Introduction
3β,16β,17α-trihydroxycholest-5-en-22-one
16-O-(2-O-4-methoxybenzoyl-β-D-xylopyranosyl)-(1→3)-(2-O-acetyl-α-L-arabinopyranoside)
(OSW-1) is found in the bulbs of Ornithogalum
saundersiae(1) and has high
antitumor activity at nanomolar concentrations. Its anticancer
effect is 10–100 times that of doxorubicin, camptothecin and
paclitaxel (2). Benign cells have
been shown to be significantly less sensitive to OSW-1 compared
with cancer cell lines; concentrations leading to a 50% loss in
cell viability were 40–150 times greater than those required in
malignant cells. Furthermore, OSW-1 may lead to the loss of
mitochondrial transmembrane potential, an increase in cytosolic
calcium and the activation of calcium-dependent apoptosis in human
leukemia and pancreatic cancer cells (3). Although its total chemical synthesis
was achieved in 1999, the anticancer activity of OSW-1 is complex
and the exact mechanisms responsible for such selectivity remain
unclear (4).
MicroRNAs (miRNAs) are short (~22 nt) noncoding
single-stranded RNAs that post-transcriptionally regulate
protein-coded gene expression in plants and animals (5). They are able to bind to complementary
sequences in the 3′-untranslated regions (3′-UTRs) of several
target mRNAs to induce degradation or translational repression, and
are important in cellular proliferation and development. Mature
miRNAs use a silencing mode similar to that employed by siRNAs that
cleave mRNA transcription (6,7).
Although it has been established that the human genome contains
hundreds of miRNA genes and that each miRNA regulates a large
number of mRNA targets, the overall effect of miRNAs on mRNA
profiles has not been clarified.
To investigate the mechanism of the anticancer
activity of OSW-1, we used miRNA expression analysis in
hepatocellular carcinoma cells (HCCs; Hep3B) that were incubated
with OSW-1 in vitro. Known differential miRNA expression was
associated with the unknown function of OSW-1, and we identified
the expression of unknown differential miRNAs caused by the
antitumor effect of OSW-1.
Materials and methods
miRNA microarray
The 6th generation miRCURY™ LNA Array (v16.0;
Exiqon, Vedbaek, Denmark) contained >1891 capture probes,
covering all human, mouse and rat miRNAs annotated in miRBase 16.0,
in addition to all the viral miRNAs associated with these species.
Furthermore, the array contained capture probes for 66 new miRPlus™
human miRNAs.
Cell cultures
Hep3B cells were obtained from the Chinese Academy
of Sciences Cell Bank (Shanghai, China) and the cell line was
maintained in DMEM supplemented with 10% fetal bovine serum.
Monoclonal cell lines were acquired using a limiting dilution assay
(LDA) and maintained in DMEM with 20% fetal bovine serum. A
humidified incubator was set at 37°C with 5% CO2. The
cell lines were divided into four groups: Group A, the Hep3B
monoclonal cell line, acting as the control group; group B,
monoclonal cell line treated with 200 ng/ml OSW-1 for 24 h; group
C, monoclonal cell line treated with 5000 ng/ml doxorubicin for 24
h; and group D, monoclonal cell line treated with 80 ng/ml OSW-1
and 2000 ng/ml doxorubicin for 24 h. The study was approved by the
ethics committee of Yanbian University, Yanji City, China.
miRNA isolation and purification
TRIzol reagent (1 ml)(Invitrogen, Carlsbad, CA, USA)
was added to a 3.5-cm diameter dish and the cell lysate was passed
through a pipette several times. The isolation and purification of
miRNAs were completed using the miRNeasy Mini Kit (Qiagen, Hilden,
Germany), according to the manufacturer’s instructions. RNA
concentration and purity were determined by measuring the
absorbance at 260 nm and the OD260/OD280 ratio was calculated using
a NanoDrop ND-1000 spectrophotometer (Nanodrop Technologies,
Wilmington, DE, USA). RNA integrity and gDNA contamination were
analyzed using denaturing agarose gel electrophoresis.
RNA extraction
Total RNA was isolated using TRIzol (Invitrogen) and
the miRNeasy Mini Kit (Qiagen) according to the manufacturer’s
instructions, which recovered all RNA species, including miRNAs.
RNA quality and quantity was measured using the NanoDrop
spectrophotometer and RNA integrity was determined by gel
electrophoresis.
RNA labeling
After RNA isolation, the miRCURY Hy3™/Hy5™ Power
Labeling kit (Exiqon) was used according to the manufacturer’s
instructions for miRNA labeling. One microgram of each sample was
3′-end-labeled with Hy3 and Hy5 fluorescent labels, respectively,
using T4 RNA ligase by the following procedure: RNA in 2.0 μl water
was combined with 1.0 μl CIP buffer and CIP (Exiqon). The mixture
was incubated for 30 min at 37°C and terminated by incubation for 5
min at 95°C. Next, 3.0 μl of labeling buffer, 1.5 μl of fluorescent
label (Hy3 or Hy5), 2.0 μl of DMSO and 2.0 μl of labeling enzyme
were added to the mixture. The labeling reaction was incubated for
1 h at 16°C and terminated by incubation for 15 min at 65°C.
Array hybridization
After terminating the labeling procedure, the Hy3-
and Hy5-labeled samples were mixed pair-wise and hybridized on the
miRCURY LNA Array (v16.0; Exiqon) according to the manufacturer’s
instructions. The total 25 μl mixture from the Hy3- and Hy5-labeled
samples with 25 μl hybridization buffer was denatured for 2 min at
95°C, incubated on ice for 2 min and then hybridized to the
microarray for 16 h at 56°C in a 12-Bay Hybridization System
(Nimblegen Systems Inc., Madison, WI, USA), which provided an
active mixing action and constant incubation temperature to improve
hybridization uniformity and enhance the signal. Following
hybridization, the slides were washed several times using a wash
buffer kit (Exiqon) and dried by centrifugation for 5 min at 400
rpm. The slides were scanned using the Axon GenePix 4000B
microarray scanner (Axon Instruments, Foster City, CA, USA).
Data analysis
Scanned images were imported into GenePix Pro 6.0
software (Axon Instruments) for grid alignment and data extraction.
miRNAs with two channel intensities, >0 and SNR>1, were
selected for further normalization. Expression data were normalized
using the locally weighted scatter plot smoothing (LOWESS)
regression algorithm (8), which
produced within-slide normalization to minimize the
intensity-dependent differences between the dyes. Between slides
normalization was performed using scale normalization (9). Following normalization, replicated
miRNAs were averaged. Differentially expressed miRNAs were
identified using fold-change filtering. Hierarchical clustering was
performed using MEV software (v4.6, TIGR) (10). Quantitative RT-PCR verified the
miRNA expression profile using random sampling.
Results
Eligible total RNA was isolated, including miRNAs,
for the miRNA microarray from the cell cultures, as shown in
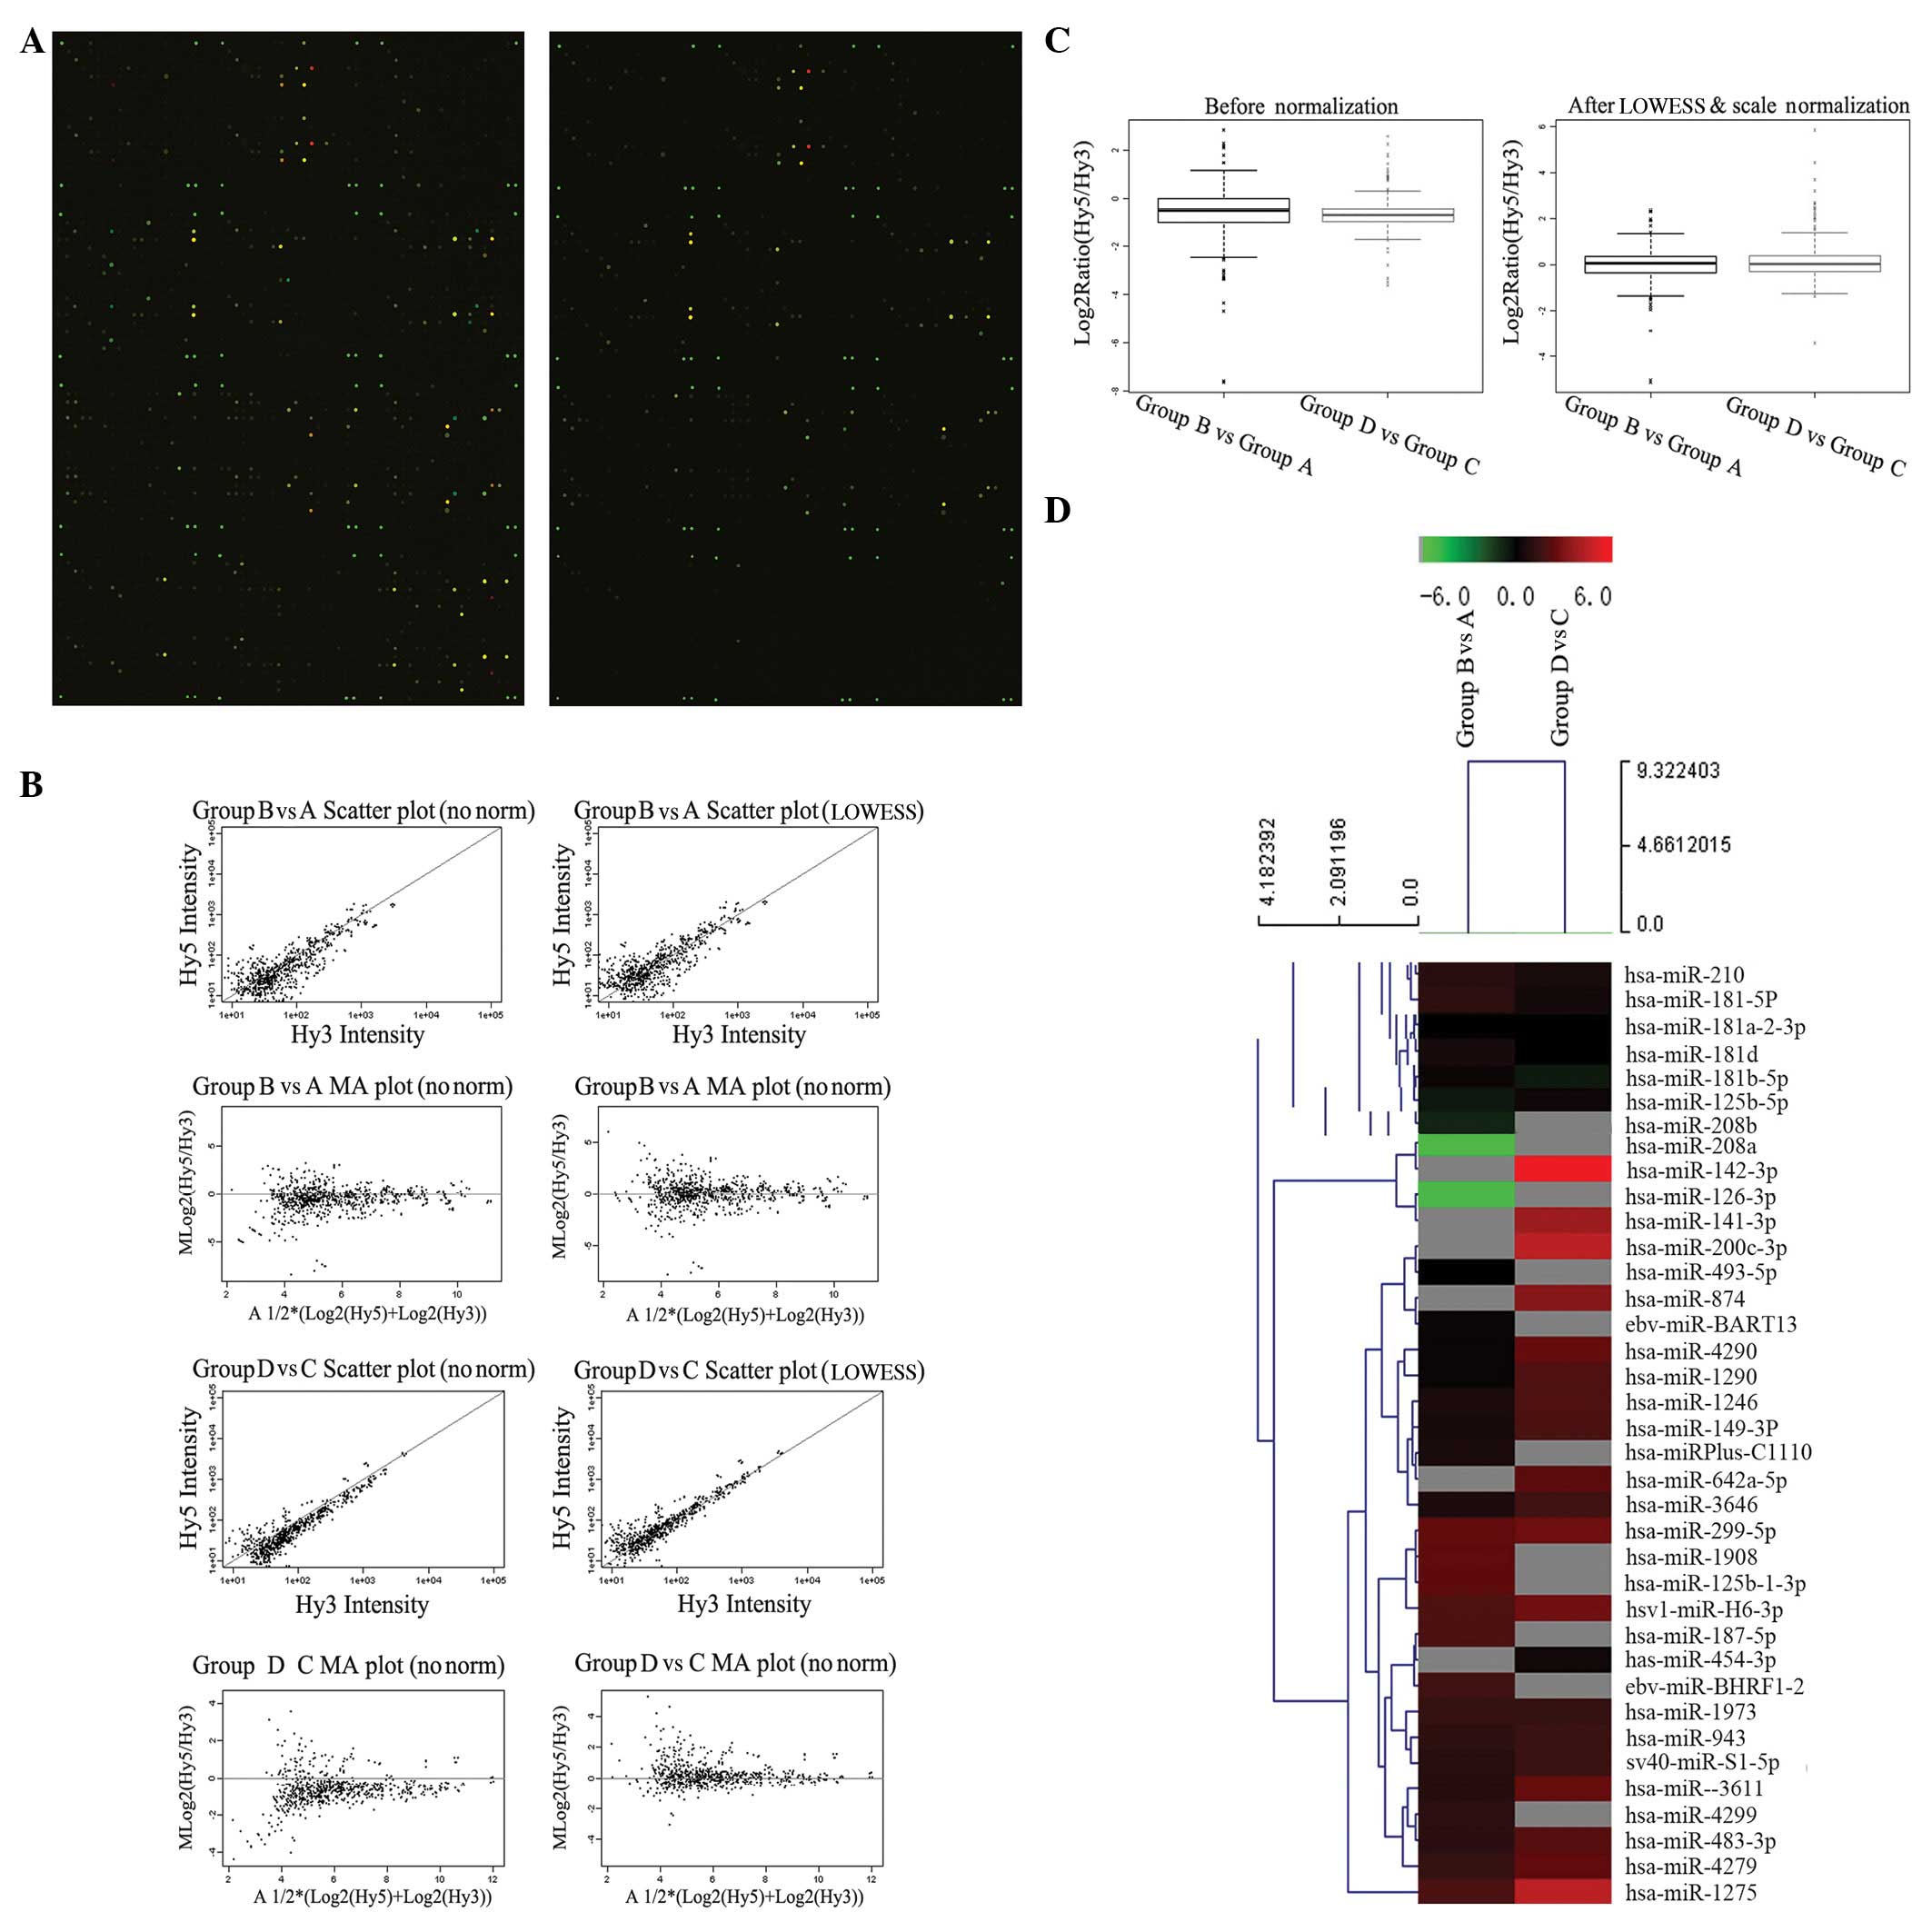
Table I and Fig. 1. Scanned images were imported into
GenePix Pro 6.0 software for grid alignment and data extraction
(Fig. 2A). miRNAs with two channel
intensities, >0 and SNR>1, were selected for further
normalization. Expression data were normalized using the LOWESS
regression algorithm (8), which
produced within-slide normalization to minimize the
intensity-dependent differences between the dyes. Between slides
normalization was performed by scale normalization (Table II) (9). After normalization, the replicated
miRNAs were averaged. Differentially expressed miRNAs were
identified through fold-change filtering and quality assessments of
miRNA data were performed after filtering, as shown in Fig. 2B and C and Table III. Finally, hierarchical
clustering was carried out to reveal distinguishable miRNA
expression profiling among the four groups (Fig. 2D).
 | Table IRNA quantification and quality
assurance, as determined by the NanoDrop ND-1000
spectrophotometer. |
Table I
RNA quantification and quality
assurance, as determined by the NanoDrop ND-1000
spectrophotometer.
| Group | OD260/280 ratio | OD260/230 ratio | Conc. (ng/μl) | Volume (μl) | Quantity (ng) |
|---|
| A | 1.92 | 1.99 | 212.07 | 10 | 2120.70 |
| B | 1.95 | 1.95 | 557.38 | 10 | 5573.80 |
| C | 2.00 | 2.02 | 553.75 | 10 | 5537.50 |
| D | 1.99 | 1.91 | 706.17 | 10 | 7061.70 |
| Table IImiRNA expression profiling data. |
Table II
miRNA expression profiling data.
| | | Data after LOWESS
normalization | Data after LOWESS
& scale normalization |
|---|
| | |
|
|
|---|
| | Fold-change | Log2 ratio
scale | Log2 ratio
scale | Ratio scale |
|---|
| |
|
|
|
|
|---|
| ID | Name | Group B/group A | Group D/group C | Group B/group A | Group D/group C | Group B/group A | Group D/group C | Group B/group A |
|---|
| 4040 | hsa-miR-9-5p | 1.201596352 | 0.973057734 | 0.376576901 | −0.027722981 | 0.264952338 | −0.039402688 | 1.201596352 |
| 4610 | hsa-miR-126-3p | 0.030305072 | | −7.169461969 | | −5.044296936 | | 0.030305072 |
| 4700 | hsa-miR-140-5p | 1.73666148 | 1.47424504 | 1.131805162 | 0.393988691 | 0.796316563 | 0.55997634 | 1.73666148 |
| 5250 | hsa-miR-105-5p | | | | | | | |
| 5730 | hsa-miR-208a | 0.02847763 | | −7.296995474 | | −5.134027082 | | 0.02847763 |
| 6880 | hsa-miR-297 | | | | | | | |
| 9938 | hsa-let-7i-5p | 0.769523042 | 0.641605265 | −0.537199825 | −0.450462161 | −0.377963568 | −0.640242114 | 0.769523042 |
| 10138 |
hsa-miR-130a-3p | 1.056391584 | 1.164773916 | 0.112488423 | 0.154822957 | 0.079144713 | 0.220049953 | 1.056391584 |
| 10306 |
hsa-miR-146b-5p | | | | | | | |
| 10916 | hsa-miR-1 | | | | | | | |
| 10919 |
hsa-miR-103a-3p | 1.130481377 | 1.167560403 | 0.251480975 | 0.157248367 | 0.176937226 | 0.223497189 | 1.130481377 |
| 10923 | hsa-miR-107 | 0.920825852 | 0.856509091 | −0.169134419 | −0.157221875 | −0.118999757 | −0.223459536 | 0.920825852 |
| 10925 | hsa-miR-10b-5p | 1.345927976 | 0.489139642 | 0.609171131 | −0.725871604 | 0.428601209 | −1.031681704 | 1.345927976 |
| 10928 |
hsa-miR-125a-5p | 1.260412915 | 1.311638016 | 0.474567194 | 0.275360214 | 0.333896442 | 0.391369622 | 1.260412915 |
| Table IIIAll differentially expressed
miRNAs. |
Table III
All differentially expressed
miRNAs.
| A, Group B/group A
2.0-fold upregulated miRNAs |
|
| | Fold-change | Raw intensity | Log2
ratio scale after LOWESS normalization | Log2
ratio scale after LOWESS and scale normalization | Ratio scale after
LOWESS and scale normalization |
| |
|
|
|
|
|
| ID | Name | Group B/group
A | Group B (Hy5) | Group A (Hy3) | Group B/group
A | Group B/group
A | Group B/group
A |
|
| 42696 | hsa-miR-943 | 2.243215941 | 26.5 | 13.5 | 1.65662315 | 1.165568507 | 2.243215941 |
| 42775 | hsa-miR-187-5p | 3.766473652 | 33.0 | 9.5 | 2.719252716 | 1.913214437 | 3.766473652 |
|
| B, Group B/group A
1 2.0-fold downregulated miRNAs |
|
| | Fold-change | Raw intensity | Log2
ratio scale after LOWESS normalization | Log2
ratio scale after LOWESS and scale normalization | Ratio scale after
LOWESS and scale normalization |
| |
|
|
|
|
|
| ID | Name | Group B/group
A | Group B (Hy5) | Group A (Hy3) | Group B/Group
A | Group B/Group
A | Group B/Group
A |
|
| 4610 | hsa-miR-126-3p | 0.030305072 | 0 | 378 | −7.169461969 | −5.044296936 | 0.030305072 |
| 5730 | hsa-miR-208a | 0.02847763 | 3 | 572 | −7.296995474 | −5.134027082 | 0.02847763 |
Treatment with OSW-1 induced the upregulation of a
number of miRNAs, including miR-181, miR-187, miR-210, miR-2,
miR-299 and miR-1275 (Fig. 3A).
Notably, the downregulation of miRNAs also occurred with OSW-1
treatment, to include miR-126 and miR-208. Following 24 h of OWS-1
treatment, there was an ~35-fold downregulation of miRNA (Fig. 3B).
The effect of OSW-1 was compared with that of
traditional anticarcinogens through identification of the
differentially expressed miRNAs among group D and group C. Results
showed that miR-1275, miR-200 and miR-141 were upregulated 13 to
21-fold. Notably, the level of upregulation of miR-142 was ~58-fold
higher than its expression with a different treatment (Fig. 4A and B).
Discussion
miRNAs, including hsa-miR-299-5p, miR-125b,
miR-187-5p and miR-210, were upregulated following treatment with
OSW-1. In a study by Shevde et al(11), hsa-mir-299-5p targeted osteopontin
(OPN), which is known to be critical for enhancing proliferation
and tumorigenicity. We speculate that the expression of OPN is
downregulated following treatment with OSW-1, thus inhibiting the
proliferation and tumorigenicity of HCCs. miR-125b has been shown
to suppress HCC proliferation and metastasis by directly targeting
the oncogene LIN28B (12), the
overexpression of which represses the endogenous level of the p53
protein, thus suppressing apoptosis in human neuroblastoma and lung
fibroblast cells (13). In
accordance with our previous study (14), the p53 pathway was activated by
OSW-1 on the miRNA level. miR-187 is highly expressed in
BRAF and RAS point mutations and RET/PTC and
PAX8/PPARγ rearrangements (15). It has been demonstrated that OSW-1
acts directly on BRAF mutations to highly express miR-187.
miR-210 mediates a novel mechanism of adaptation to hypoxia and
regulates mitochondrial function via iron-sulfur cluster metabolism
and free radical generation (16).
The balance of the reactive oxygen species (ROS) is important for
maintaining a normal metabolism. In previous studies, malignant
cells were transformed by oxidative damage to DNA and mutations
were induced by the sustained activation of ROS. ROS activates the
p53 signaling pathway, influencing mitochondrial membrane potential
and promoting the generation of caspase-3, caspase-9, and
representative drugs, doxorubicin and vincristine (17,18).
Furthermore, high levels of miR-483-3p may be found in ~30% of
colon, breast and liver cancers, which is located within intron 2
of the IGF2 locus (19). Our data
showed that miR-483 was highly expressed after treatment with
OSW-1, which indicates that the function of miR-483 was
bidirectional.
hsa-miR-126-3p and hsa-miR-208a were downregulated
~58-fold by OSW-1. miR-126 is known to enhance the pro-angiogenic
actions of VEGF and FGF and promote blood vessel formation by
repressing the expression of Spred-1 accordingly. The targeted
deletion of miR-126 in mice produced leaking vessels, hemorrhaging
and partial embryonic lethality (20). After treatment with OSW-1, the
expression levels of miR-126 in HCCs were barely detected, which
may increase the ability of Spred-1 to inhibit RAF. Tumor
angiogenesis was prohibited through the inhibition of the MAPK
signaling pathway by OSW-1. Therefore, the proliferation of
vascular smooth muscle cells correlates with miR-208-mediated
downregulation of p21 (21),
demonstrating that OSW-1 may inhibit tumor growth by the
vasifaction of tumor tissue.
Comparison between group C and group D revealed that
miR-142 was expressed at high levels, and miR-200C-3p, miR-1275 and
miR-141 showed increasing levels of upregulation from 13 to 20-fold
(Fig. 4). miR-142-3p directly and
negatively regulates RAC1 in HCCs, where RAC1 regulates a diverse
array of cellular events including migration and invasion (22). In a study by Wu et
al(22), blocking miR-142-3p
increased colony formation, migration and invasion in HCCs. The
levels of miR-142 were inversely related to the levels of
acetyltransferase p300 and MAPK activity, and miR-142 inhibited
survival and growth pathways by directly targeting nodal regulators
p300 and gp130. miR-142 potentially represses multiple components
of the NF-κB pathway, preventing cytokine-mediated NO production
and blocking the translation of actinin (23). The upregulation of miR-142 by OSW-1
inhibits RAC1 in the Wnt, MAPK and axon guidance pathway.
Overexpression of miR-200c leads to reduced levels of transcription
factor 8 and increased expression of E-cadherin (24). OSW-1-mediated upregulation of
miR-200c enhances the intercellular junctions of HCCs by
stabilizing cell polarity and inhibiting proliferation.
Simultaneously, miR-141 and miR-200c inhibit the expression of
ZFHX1B, a transcriptional repressor for CDH1/E-cadherin (25). Zinc finger E-box-binding homeobox 1
(ZEB1) and ZEB2 are regulated by the high expression of the miR-200
family, which weakens the inhibition of E-cadherin, preventing the
occurrence of epithelial to mesenchymal transition (EMT) (26).
Under the influence of OSW-1, the upregulated
expression of miR-1275 was increased 4-fold, and following
treatment with OSW-1 and doxorubicin, it was upregulated with an
~20-fold increase when compared to the effects of doxorubicin
alone. We hypothesized that miR-1275 is a direct target of OSW-1
and therefore is a potential anticancer target.
In conclusion, OSW-1 may affect numerous miRNAs that
act on specific signaling pathways for proliferation,
differentiation, apoptosis, cell adhesion, migration, polarity and
EMT (Fig. 5).
Acknowledgements
This study was supported by a grant from the
National Natural Science Foundation of China (Grant No. 81160529)
and the Jilin province Science and Technology Development Project
(Grant No. 200905207).
References
|
1
|
Kubo S, Mimaki Y, Terao M, Sashida Y,
Nikaido T and Ohmoto T: Acylated cholestane glycosides from the
bulbs of Ornithogalum saudersiae. Phytochemistry.
31:3969–3973. 1992. View Article : Google Scholar
|
|
2
|
Mimaki Y, Kuroda M, Kameyama A, Sashida Y,
Hirano T and Oka K: Cholestane glycosides with potent cytostatic
activities on various tumor cells from Ornithogalum
saundersiae bulbs. Bioorg Med Chem Lett. 7:633–636. 1997.
View Article : Google Scholar
|
|
3
|
Zhou Y, Garcia-Prieto C, Carney DA, et al:
OSW-1: a natural compound with potent anticancer activity and a
novel mechanism of action. J Natl Cancer Inst. 97:1781–1785. 2005.
View Article : Google Scholar : PubMed/NCBI
|
|
4
|
Deng S, Yu B, Lou Y and Hui Y: First total
synthesis of an exceptionally potent antitumor saponin, OSW-1. J
Org Chem. 64:202–208. 1999. View Article : Google Scholar : PubMed/NCBI
|
|
5
|
Morris KV, Chan SW, Jacobsen SE and Looney
DJ: Small interfering RNA-induced transcriptional gene silencing in
human cells. Science. 305:1289–1292. 2004. View Article : Google Scholar : PubMed/NCBI
|
|
6
|
Jeyaseelan K, Herath WB and Armugam A:
MicroRNAs as therapeutic targets in human diseases. Expert Opin
Ther Targets. 11:1119–1129. 2007. View Article : Google Scholar : PubMed/NCBI
|
|
7
|
Scherr M and Eder M: Gene silencing by
small regulatory RNAs in mammalian cells. Cell Cycle. 6:444–449.
2007. View Article : Google Scholar : PubMed/NCBI
|
|
8
|
Cleveland WS: LOWESS: A program for
smoothing scatterplots by robust locally weighted regression. Am
Stat. 35:541981. View
Article : Google Scholar
|
|
9
|
Yang YH, Dudoit S, Luu P, Lin DM, Peng V,
Ngai J and Speed TP: Normalization for cDNA microarray data: a
robust composite method addressing single and multiple slide
systematic variation. Nucleic Acids Res. 30:e152002. View Article : Google Scholar : PubMed/NCBI
|
|
10
|
Saeed AI, Bhagabati NK, Braisted JC, Liang
W, Sharov V, Howe EA, et al: TM4 microarray software suite. Methods
in Enzymology. 411:134–193. 2006. View Article : Google Scholar : PubMed/NCBI
|
|
11
|
Shevde LA, Metge BJ, Mitra A, Xi Y, Ju J,
King JA and Samant RS: Spheroid-forming subpopulation of breast
cancer cells demonstrates vasculogenic mimicry via hsa-miR-299-5p
regulated de novo expression of osteopontin. J Cell Mol Med.
14:1693–1706. 2010. View Article : Google Scholar
|
|
12
|
Liang L, Wong CM, Ying Q, et al:
MicroRNA-125b suppressesed human liver cancer cell proliferation
and metastasis by directly targeting oncogene LIN28B2. Hepatology.
52:1731–1740. 2010. View Article : Google Scholar : PubMed/NCBI
|
|
13
|
Le MT, Teh C, Shyh-Chang N, et al:
MicroRNA-125b is a novel negative regulator of p53. Genes Dev.
23:862–876. 2009. View Article : Google Scholar : PubMed/NCBI
|
|
14
|
Jin J, Jin X, Qian C, Ruan Y and Jiang H:
Signaling network of OSW 1 induced apoptosis and necroptosis in
hepatocellular carcinoma. Mol Med Rep. 7:1646–1650. 2013.PubMed/NCBI
|
|
15
|
Nikiforova MN, Tseng GC, Steward D, Diorio
D and Nikiforov YE: MicroRNA expression profiling of thyroid
tumors: biological significance and diagnostic utility. J Clin
Endocrinol Metab. 93:1600–1608. 2008. View Article : Google Scholar : PubMed/NCBI
|
|
16
|
Favaro E, Ramachandran A, McCormick R, et
al: MicroRNA-210 regulates mitochondrial free radical response to
hypoxia and krebs cycle in cancer cells by targeting iron sulfur
cluster protein ISCU. PLoS One. 5:e103452010. View Article : Google Scholar : PubMed/NCBI
|
|
17
|
Mizutani H, Tada-Oikawa S, Hiraku Y,
Kojima M and Kawanishi S: Mechanism of apoptosis induced by
doxorubicin through the generation of hydrogen peroxide. Life Sci.
76:1439–1453. 2005. View Article : Google Scholar : PubMed/NCBI
|
|
18
|
Groninger E, Meeuwsen-De Boer GJ, De Graaf
SS, Kamps WA and De Bont ES: Vincristine induced apoptosis in acute
lymphoblastic leukaemia cells: a mitochondrial controlled pathway
regulated by reactive oxygen species? Int J Oncol. 21:1339–1345.
2002.
|
|
19
|
Veronese A, Lupini L, Consiglio J, et al:
Oncogenic role of miR-483-3p at the IGF2/483 locus. Cancer Res.
70:3140–3149. 2010. View Article : Google Scholar : PubMed/NCBI
|
|
20
|
Wang S, Aurora AB, Johnson BA, et al: The
endothelial-specific microRNA miR-126 governs vascular integrity
and angiogenesis. Dev Cell. 15:261–271. 2008. View Article : Google Scholar : PubMed/NCBI
|
|
21
|
Zhang Y, Wang Y, Wang X, et al: Insulin
promotes vascular smooth muscle cell proliferation via
microRNA-208-mediated downregulation of p21. J Hypertens.
29:1560–1568. 2011. View Article : Google Scholar : PubMed/NCBI
|
|
22
|
Wu L, Cai C, Wang X, Liu M, Li X and Tang
H: MicroRNA-142-3p, a new regulator of RAC1, suppresses the
migration and invasion of hepatocellular carcinoma cells. FEBS
Lett. 585:1322–1330. 2011. View Article : Google Scholar : PubMed/NCBI
|
|
23
|
Sharma S, Liu J, Wei J, Yuan H, Zhang T
and Bishopric NH: Repression of miR-142 by p300 and MAPK is
required for survival signalling via gp130 during adaptive
hypertrophy. EMBO Mol Med. 4:617–632. 2012. View Article : Google Scholar : PubMed/NCBI
|
|
24
|
Hurteau GJ, Carlson JA, Spivack SD and
Brock GJ: Overexpression of the microRNA hsa-miR-200c leads to
reduced expression of transcription factor 8 and increased
expression of E-cadherin. Cancer Res. 67:7972–7976. 2007.
View Article : Google Scholar : PubMed/NCBI
|
|
25
|
Nakada C, Matsuura K, Tsukamoto Y, et al:
Genome-wide microRNA expression profiling in renal cell carcinoma:
significant down-regulation of miR-141 and miR-200c. J Pathol.
216:418–427. 2008. View Article : Google Scholar : PubMed/NCBI
|
|
26
|
Korpal M, Lee ES, Hu G and Kang Y: The
miR-200 family inhibits epithelial-mesenchymal transition and
cancer cell migration by direct targeting of E-cadherin
transcriptional repressors ZEB1 and ZEB2. J Biol Chem.
283:14910–14914. 2008. View Article : Google Scholar : PubMed/NCBI
|