Introduction
Renal cell carcinoma is the most common type of
malignant kidney tumor. It was estimated that in 2012 ~64,770 new
cases of kidney cancer would be diagnosed in the United States,
resulting in 13,570 mortalities (1). In 2011, ~90% of cases of kidney
cancer were renal cell carcinoma (2). According to a review in 2008, 30% of
patients show signs of advanced renal cell carcinoma when
diagnosed, and 20–30% of patients treated by nephrectomy relapse
and develop metastases during the follow-up period (3). As renal cell carcinoma is not
sensitive to chemotherapy and radiotherapy, immunotherapy with
interferon (IFN)-α was frequently used in the past 20 years
(4). However, only a 15–30%
objective response rate was reported was reported in a previous
study and serious adverse effects have been observed in patients
who have undergone immunotherapy (5). Thus, the ability to identify patients
who are most likely to benefit from immunotherapy is necessary.
IFN-α exerts its effects on cells by interacting
with the cell receptors and thus activating the Janus kinase (JAK)
family. Activated JAK1 and tyrosine kinase 2 phosphorylate Signal
Transducer and Activator of Transcription (STAT) and the activated
STAT proteins interact with regulatory elements to induce the
transcription of target genes (6).
A previous study demonstrated that JAK-STAT activation is
associated with IFN-α resistance in renal cell lines (7). Certain molecules, including STAT3 and
p53, have been identified as predictive and prognostic markers of
renal cell carcinoma (8,9). However, the majority of these studies
were conducted in vitro and these findings do not provide
sufficient information to permit clinical treatment. To the best of
our knowledge, studies concerning the expression of JAK-STAT in
human renal cancer tissue are limited. The purpose of the present
study was to assess the expression levels of JAK-STAT in human
renal cancer tissues and identify a biomarker that is associated
with the effects of IFN-α treatment.
Patients and methods
Patients and tissues
A total of 32 Chinese patients (mean age, 61.2
years) who had been diagnosed with locally advanced renal cell
carcinoma by post surgery pathological examination at The People’s
Hospital of Guangxi Zhuang Autonomous Region (Nanning, China)
between 2010 and 2011 were included in this study. The TNM staging
of cancer was performed according to the American Joint Committee
on Cancer Cancer Staging Manual (10). The demographic and
clinicopathological characteristics of the patients are listed in
Table I. A routine physical
examination was conducted and the immune function of the patients
was detected prior to the surgery. No abnormalities were identified
in the patients. All patients received a radical nephrectomy and
post surgery adjuvant immunotherapy with IFN-α2b (Schering-Plough,
Kenilworth, NJ, USA). The treatment protocol was performed
according to the instructions in the guidelines of the Chinese
Urological Association (11).
Considering the toxic side-effects of IFN, the patients were
advised to receive a low dose of IFN-α2b (3 MIU subcutaneously,
three times weekly) treatment for 12 weeks. The patients were
followed-up for 24 months, and the local relapse and metastasis
rates were recorded.
 | Table IDemographic and clinicopathological
characteristics of the patients. |
Table I
Demographic and clinicopathological
characteristics of the patients.
| Characteristic | Number |
|---|
| Age, years |
| <50 | 5 |
| 50–70 | 20 |
| >70 | 7 |
| Gender |
| Male | 22 |
| Female | 10 |
| TNM stage |
|
T2N1M0 | 16 |
|
T3aN0M0 | 11 |
|
T3aN1M0 | 3 |
|
T3bN0M0 | 2 |
The tumor samples from the 32 patients were
collected as soon as they were removed from the body. Each tumor
sample was divided into two sections. One section was ground and
stimulated in RPMI-1640 medium (HyClone Laboratories, Inc., Logan,
UT, USA) containing IFN-α2b (final concentration, 3 MIU/ml) for 4
h, and the other section was incubated in RPMI-1640 medium without
IFN, which served as a control. The benign renal tissues were
collected from 10 patients who underwent a nephrectomy as a result
of nonmalignant disease. All samples were stored at −80°C. The
present study was approved by the Ethics Committee of The People’s
Hospital of Guangxi Zhuang Autonomous Region. Written consent was
obtained from all patients.
Immunohistochemistry
The expression levels of JAK1, P-JAK1, STAT1,
P-STAT1, STAT2 and P-STAT2 were detected by immunohistochemical
staining of the renal cell carcinomas and benign renal tissues. The
antibodies of P-JAK1, STAT2 and P-STAT2 were purchased from Abcam
(Cambridge, UK). The antibodies of JAK1, STAT1 and P-STAT1 were
purchased from Cell Signaling Technology, Inc. (Danvers, MA, USA).
The immunohistochemical staining and evaluation were performed as
previously described (12). All
sections were blindly analyzed by experienced pathologists.
Briefly, the immunohistochemical analysis was performed after
recoding the sections to create a blind set. The overall intensity
and percentage were evaluated under a light microscope (Olympus,
Tokyo, Japan). Briefly, the immunohistochemical results were
categorized into four grades based on the percentage of positive
cells and/or the staining intensity, which was identified by
comparing the section with the positive controls in each
experiment. The grades were as follows: (−), positive cells <5%
of the cancer tissue and/or weakly stained; (+), <25% and/or
weakly stained; (++), <50% and/or moderately stained; and (+++),
>75% and/or strongly stained.
Semiquantitative polymerase chain
reaction (qPCR) assay
Total RNA was isolated from the tumor and benign
tissues using TRIzol® reagent (Invitrogen, Carlsbad, CA,
USA). The RNA concentration was determined using a
spectrophotometer (Bio-Rad Laboratories, Hercules, CA, USA).
Complementary DNA was synthesized from 3 μg total RNA with a
RevertAid First Strand cDNA Synthesis kit (Fermentas, Hanover, MD,
USA) according to the manufacturer’s instructions. The qPCR assay
was performed with 20 μl reaction mixture, and the PCR was
conducted with 35 cycles of 94°C for 30 sec and 72°C for 1 min.
β-actin served as an internal control. The PCR products underwent
electrophoresis by 2% agarose gel analysis. The expression levels
of the target genes were evaluated by calculating the average
ratios of gray scale using a computerized gel imaging system
(Bio-Rad Laboratories). The primers that were used for the
amplification are listed in Table
II.
| Table IISequences of the primers used. |
Table II
Sequences of the primers used.
| Gene | Sequence (5′→3′) | Length (bp) | Tm
(°C) |
|---|
| JAK1 | Sense:
TTCTACATGGGGGGATAG
Antisense: TAAGTATGGAAACCCTCTAA | 278 | 54.4 |
| STAT1 | Sense:
GGTTGAACCCTACACGAAG
Antisense: CTACAGAGCCCACTATCCG | 335 | 57.4 |
| STAT2 | Sense:
ATACTAGGGACGGGAAGTCG
Antisense: CTGGGAAAAGGGCTGAATG | 368 | 59.8 |
| β-actin | Sense:
CGTGGACATCCGCAAAGAC
Antisense: AAGAAAGGGTGTAACGCAACT | 306 | |
Western blot analysis
The tumor samples, which had been stimulated with
IFN, were lysed and homogenized (SanShon Machinery, Zhejiang,
China) in radioimmunoprecipitation assay buffer and the control
samples were treated in the same way. The protein concentration in
the samples was subsequently determined. Equal amounts of protein
were separated on 10% sodium dodecyl sulfate-polyacrylamide gel
electrophoresis gels and transferred to a polyvinylidene difluoride
membrane (Millipore, Billerica, MA, USA). The membrane was blocked
with non-fat milk for 2 h and incubated with the primary antibodies
overnight. Following washing with Tris-buffered saline and Tween 20
(TBST) for 30 min, the membrane was incubated for 1 h, washed with
TBST and the proteins were detected with an enhanced
chemiluminescence kit (Bio-Rad Laboratories). The protein
expression levels were evaluated by calculating the average ratios
of gray scale using a computerized gel imaging system; GAPDH served
as the control.
Statistical analysis
The positive expression rates between the tumor and
benign tissues were assessed with χ2 test. The qPCR and
western blot data were analyzed using Student’s t-test. P<0.05
was considered to indicate a statistically significant difference.
The data were analyzed with SPSS software version 19.0 (IBM,
Armonk, NY, USA).
Results
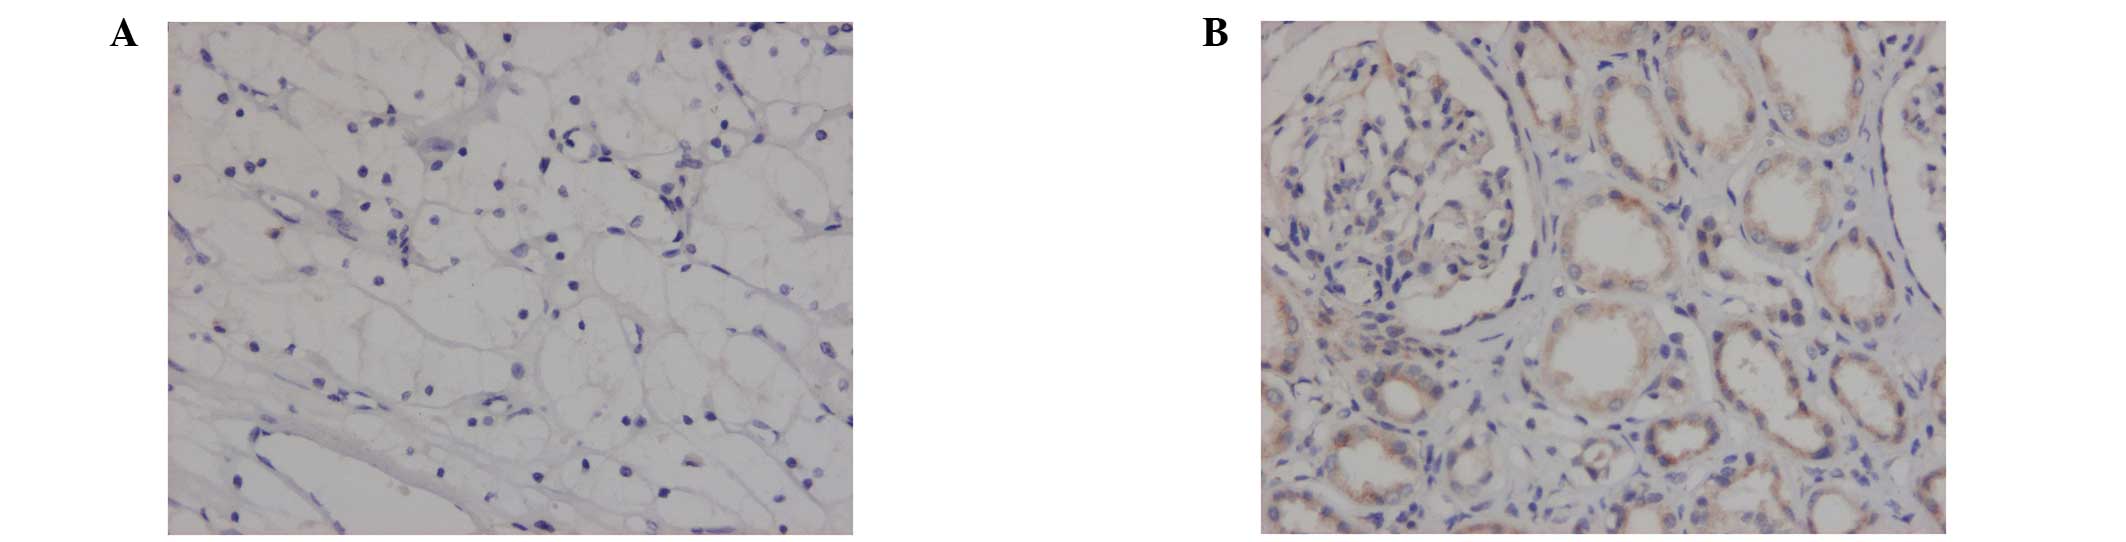
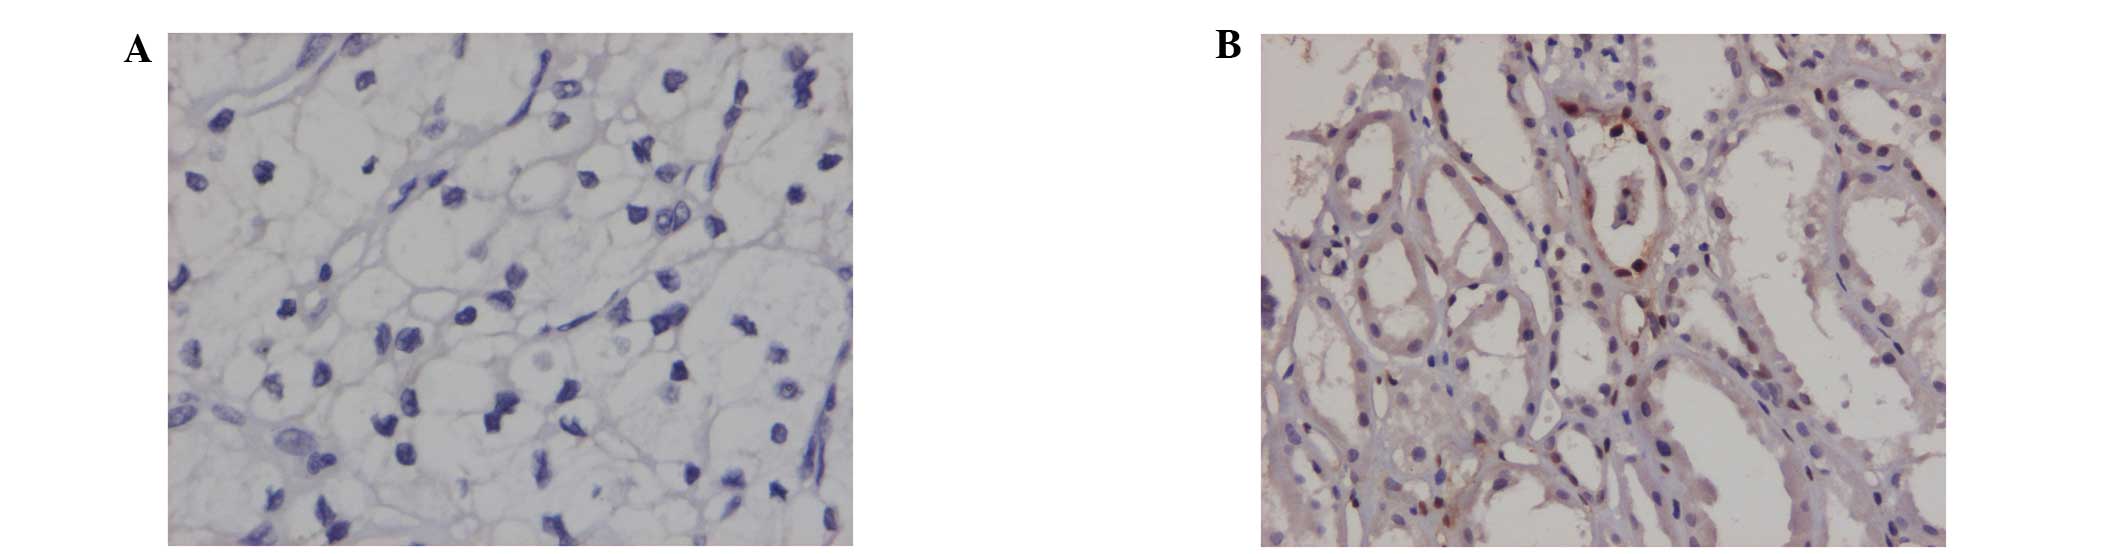
Immunohistochemical staining in the renal
cell carcinomas and benign renal tissues
Positive immunohistochemical staining was observed
in the cytoplasm or cytomembranes of the renal tubules. The
positive expression rates of JAK1, STAT1 and P-STAT1 in the renal
cell carcinomas were significantly lower than those observed in the
benign renal tissues (P<0.05). The expression rates of STAT2 in
the renal cell carcinomas were elevated compared with those in the
benign renal tissues (P<0.05). No differences in the expression
rates of P-JAK1 and P-STAT2 between the renal cell carcinoma
tissues and benign renal tissues were identified (Figs. 1–3; Table
III).
| Table IIIExpression rates of JAK-STAT signaling
pathway components in renal cell carcinoma and benign renal
tissue. |
Table III
Expression rates of JAK-STAT signaling
pathway components in renal cell carcinoma and benign renal
tissue.
| Signaling pathway
component | Renal cell carcinoma,
% (n) | Benign renal tissue,
% (n) |
|---|
|
|
|---|
| − | + to +++ | − | + to +++ |
|---|
| JAK1 | 75.0 (24/32) | 25.0 (8/32) | 30.0 (3/10) 7 | 0.0 (7/10) |
| P-JAK1 | 100.0 (32/32) | 0.0 (0/32) | 100.0 (10/10) | 0.0 (0/10) |
| STAT1 | 68.8 (22/32) | 31.2 (10/32) | 50.0 (5/10) | 50.0 (5/10) |
| P-STAT1 | 87.5 (28/32) | 12.5 (4/32) | 30.0 (3/10) | 70.0 (7/10) |
| STAT2 | 0.0 (0/32) | 100.0 (32/32) | 20.0 (2/10) | 80.0 (8/10) |
| P-STAT2 | 0.0 (0/32) | 100.0 (32/32) | 0.0 (0/10) | 100.0 (10/10) |
qPCR detection of the JAK-STAT mRNA
expression levels
The JAK1, STAT1 and STAT2 mRNA levels were detected
in the renal cell carcinomas and benign renal tissues. The relative
expression levels of JAK1 (0.696±0.102) and STAT1 (0.341±0.068) in
the tumor tissues were lower than those in the benign tissues
(0.957±0.103 and 0.547±0.082, respectively; P<0.05). No
significant differences were identified in the relative mRNA
expression levels of STAT2 (0.702±0.101 vs. 0.676±0.105) between
the two types of tissue (Fig.
4).
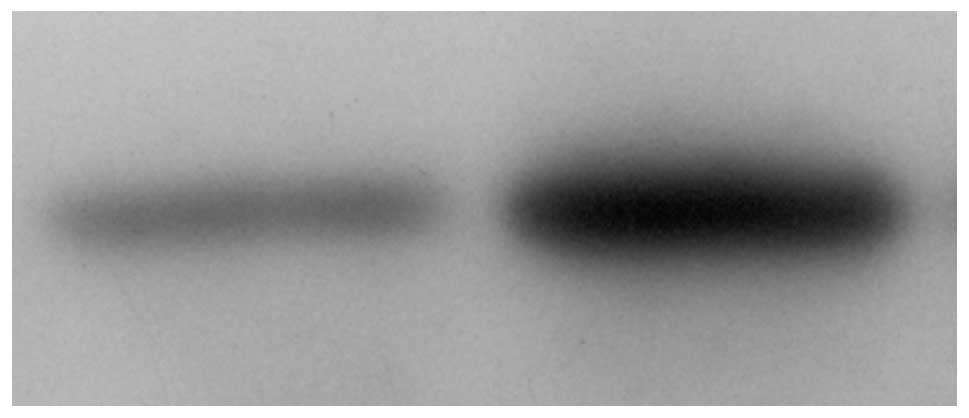
Western blot analysis determined the
changes in the levels of JAK-STAT expression following stimulation
with IFN
To determine the active status of JAK-STAT in the
tumor tissues following stimulation with IFN-α2b, the expression
levels of JAK-STAT in the IFN stimulated and control tumor tissues
were identified using western blot analysis. The expression levels
of JAK1, P-JAK1, STAT1 and P-STAT1 were examined in the two types
of tissues. The results showed that IFN stimulation significantly
increased the expression levels of P-STAT1 (Figs. 5–7), however, not those of STAT1, JAK1 and
P-JAK1 (P<0.05; Table IV).
Enhanced expression levels of P-STAT1 were detected in 75% (24/32)
of the samples, however, the levels varied markedly between the
samples. Enhanced expression levels of P-STAT1 were not detected in
25% of the samples. The percentage of enhanced expression levels of
P-STAT1 increased significantly when compared with those of the
control (P<0.05).
| Table IVRelative expression levels of JAK-STAT
signaling pathway components prior to and following stimulation
with interferon (n=32). |
Table IV
Relative expression levels of JAK-STAT
signaling pathway components prior to and following stimulation
with interferon (n=32).
| Relative expression
level, mean ± standard deviation |
|---|
|
|
|---|
| Pathway
components | Control tumor
tissue | Stimulated tumor
tissue |
|---|
| JAK1 | 0.253±0.14 | 0.298±0.19 |
| P-JAK1 | 0.316±0.23 | 0.307±0.14 |
| STAT1 | 0.424±0.27 | 0.384±0.20 |
| P-STAT1 | 0.190±0.12 | 0.460±0.24a |
Enhanced P-STAT1 expression levels were
associated with relapse and metastasis of renal cell carcinoma
The patients were followed up for 24 months after
the immunotherapy with IFN. Clinical evaluation was performed by
regular interviews, and relapse and metastasis of the tumors were
diagnosed using enhanced computed tomography scanning and tissue
biopsy analysis. The patients were divided into two groups (high
and low expression) based on whether the enhancement of the P-STAT1
expression levels was above or below the mean value. The rates of
relapse and metastasis were compared between the high and low
expression level groups. All patients tolerated the immunotherapy
well and completed their treatment courses. By the end of the
follow-up period, nine patients suffered local relapse and lung
metastasis was identified in one patient. The high expression
levels group exhibited reduced relapse and metastatic rates
compared with those of the low expression group (P<0.05;
Table V).
| Table VLocal relapse and metastasis rates of
the renal cell carcinomas in the two groups; high and low
expression of phosphorylated Signal Transducer and Activator of
Transcription. |
Table V
Local relapse and metastasis rates of
the renal cell carcinomas in the two groups; high and low
expression of phosphorylated Signal Transducer and Activator of
Transcription.
| Group | Local relapse rate, %
(n) | Metastasis rate, %
(n) |
|---|
| High expression | 16.7 (2/12) | 0.0 (0/10) |
| Low expression | 35.0 (7/20) | 5.0 (1/20) |
Discussion
Although IFN-α is a treatment option for advanced
and metastatic renal cell carcinoma, a substantial proportion of
patients fail to respond to IFN treatment (13). The mechanism of resistance to IFN
treatment of renal cell carcinoma remains unclear. The
cytokine-activated JAK-STAT pathway has an important role in the
control of immune responses. The present study focused on the
expression status of the components of the JAK-STAT pathway in
human renal cell carcinoma and attempted to identify a biomarker,
which predicts the IFN response in patients undergoing
immunotherapy.
The expression levels of JAK-STAT in renal cancer
carcinoma tissues were examined and the results indicated that the
positive expression rates of JAK1, STAT1 and P-STAT1 in the renal
cell carcinomas were significantly lower compared with those in the
benign renal tissues. Furthermore, the qPCR assay showed that the
relative mRNA levels of JAK1 and STAT1 in the malignant tissues
were lower than those in the benign tissues. A previous study on
IFN-resistant human melanoma cells demonstrated that a defect in
the levels of STAT1 was responsible for the reduced response to IFN
treatment, and transfection of the IFN-resistant cell line to
express increased levels of STAT1 partially restored the IFN
response (14). In addition, the
results from an in vitro study indicated that an
IFN-resistant renal carcinoma cell line was associated with
defective induction of STAT1 (15). The results of the present study
demonstrated that defective expression of the JAK-STAT1 pathway may
be a common phenomenon in IFN-resistant malignant tumors.
Furthermore, the results of defective expression levels of JAK1 and
STAT1 in human renal carcinoma tissues, which were observed in the
present study, were consistent with the findings from a previous
cell line study (7).
The change in the expression levels of JAK, P-JAK1,
STAT1 and P-STAT1 following IFN stimulation was investigated in the
present study using immunohistochemical staining and qPCR. IFNs are
able to bind to a specific cell surface IFN receptor, and IFN
receptor activation leads to the phosphorylation of STAT1 and
STAT2, which is critical for signal transduction (16). The results of the present study
showed that IFN stimulation increased the expression levels of
P-STAT1. Enhanced expression levels were detected in 75% (24/32) of
the tumor samples. These results indicated that the majority of
tumors respond to IFN stimulation, however, the response in the
present study varied markedly between the tumor samples, which may
indicate different responses to IFN therapy among patients. As only
the enhanced expression levels of P-STAT1 were detected by western
blot analysis, the association between the enhanced expression
levels of P-STAT1 and the response to IFN therapy in patients was
subsequently investigated. All patients who had undergone IFN
therapy for 24 months were followed up and the results indicated
that the patients whose tumors expressed P-STAT1 in high levels
following IFN stimulation were less likely to suffer a relapse or
metastasis. In addition, the post surgery recurrence rate of
locally advanced renal cell carcinoma was 64% according to the data
of a previous study (17),
however, the rate of relapse in the high expression levels group in
the present study was 16.7%, which indicated that the lower relapse
rate in the present study was due to the IFN therapy.
In conclusion, numerous attempts have been made to
identify a predictive biomarker for IFN resistance in different
fields (8,18,19).
The results of the present study indicated that P-STAT1 may be a
novel predictor of the IFN response in patients with advanced renal
cell carcinoma. This study presents the preliminary results,
however, a greater population of patients and an increased
follow-up period are required for further investigation.
Acknowledgements
The present study was funded by the Natural Science
Foundation of Guangxi, China (grant no. 2010GXNSFB013080).
References
|
1
|
Siegel R, Naishadham D and Jemal A: Cancer
statistics, 2012. CA Cancer J Clin. 62:10–29. 2012. View Article : Google Scholar
|
|
2
|
Ljungberg B, Campbell SC, Choi HY, Jacqmin
D, Lee JE, Weikert S and Kiemeney LA: The epidemiology of renal
cell carcinoma. Eur Urol. 60:615–621. 2011. View Article : Google Scholar : PubMed/NCBI
|
|
3
|
Athar U and Gentile TC: Treatment options
for metastatic renal cell carcinoma: a review. Can J Urol.
15:3954–3966. 2008.PubMed/NCBI
|
|
4
|
Jurado JM, Zarcos I, Delgado M, Blancas I,
Legerén M and García-Puche JL: Temsirolimus in overtreated
metastatic renal cancer with subsequent use of sunitinib: A case
report. Oncol Lett. 5:1382–1384. 2013.PubMed/NCBI
|
|
5
|
Tanriverdi O: Review on targeted treatment
of patients with advanced-stage renal cell carcinoma: a medical
oncologist’s perspective. Asian Pac J Cancer Prev. 14:609–617.
2013.PubMed/NCBI
|
|
6
|
Darnell JE Jr, Kerr IM and Stark GR:
Jak-STAT pathways and transcriptional activation in response to
IFNs and other extracellular signaling proteins. Science.
264:1415–1421. 1994. View Article : Google Scholar : PubMed/NCBI
|
|
7
|
Shang D, Liu Y, Ito N, Kamoto T and Ogawa
O: Defective Jak-Stat activation in renal cell carcinoma is
associated with interferon-alpha resistance. Cancer Sci.
98:1259–1264. 2007. View Article : Google Scholar : PubMed/NCBI
|
|
8
|
Eto M, Kamba T, Miyake H, Fujisawa M,
Kamai T, Uemura H, Tsukamoto T, et al; Japan Immunotherapy
SNPs-Study Group for Kidney Cancer. STAT3 polymorphism can predict
the response to interferon-α therapy in patients with metastatic
renal cell carcinoma. Eur Urol. 63:745–752. 2013.
|
|
9
|
Masuda A, Kamai T, Abe H, Arai K and
Yoshida K: Is Stat3 and/or p53 mRNA expression a prognostic marker
for renal cell carcinoma? Biomed Res. 30:171–176. 2009. View Article : Google Scholar : PubMed/NCBI
|
|
10
|
Edge S, Byrd DR, Compton CC, Fritz AG,
Greene FL and Trotti A: AJCC Cancer Staging Manual. 7th ed.
Springer Verlag; New York, NY: pp. 547–560. 2009
|
|
11
|
Na Yanqun, Ye Zhangqun and Sun Guang: The
CUA Guideline for Urological Disease. People’s Health Publishing
House; Beijing: pp. 4–16. 2011, (In Chinese).
|
|
12
|
Chen L, Zhu YY, Zhang XJ, Wang GL, Li XY,
He S, Zhang JB and Zhu JW: TSPAN1 protein expression: a significant
prognostic indicator for patients with colorectal adenocarcinoma.
World J Gastroenterol. 15:2270–2276. 2009. View Article : Google Scholar : PubMed/NCBI
|
|
13
|
Zeng Z, Que T, Zhang J and Hu Y: A study
exploring critical pathways in clear cell renal cell carcinoma. Exp
Ther Med. 7:121–130. 2014.PubMed/NCBI
|
|
14
|
Wong LH, Krauer KG, Hatzinisiriou I,
Estcourt MJ, Hersey P, Tam ND, Edmondson S, et al:
Interferon-resistant human melanoma cells are deficient in ISGF3
components, STAT1, STAT2, and p48-ISGF3gamma. J Biol Chem.
272:28779–28785. 1997. View Article : Google Scholar : PubMed/NCBI
|
|
15
|
Brinckmann A, Axer S, Jakschies D,
Dallmann I, Grosse J, Patzelt T, Bernier T, et al: Interferon-alpha
resistance in renal carcinoma cells is associated with defective
induction of signal transducer and activator of transcription 1
which can be restored by a supernatant of phorbol 12-myristate
13-acetate stimulated peripheral blood mononuclear cells. Br J
Cancer. 86:449–455. 2002.
|
|
16
|
Caraglia M, Marra M, Pelaia G, Maselli R,
Caputi M, Marsico SA and Abbruzzese A: Alpha-interferon and its
effects on signal transduction pathways. J Cell Physiol.
202:323–335. 2005. View Article : Google Scholar : PubMed/NCBI
|
|
17
|
Lam JS, Shvarts O, Leppert JT, Pantuck AJ,
Figlin RA and Belldegrun AS: Postoperative surveillance protocol
for patients with localized and locally advanced renal cell
carcinoma based on a validated prognostic nomogram and risk group
stratification system. J Urol. 174:466–472. 2005. View Article : Google Scholar
|
|
18
|
Noguchi Y, Kurokawa MS, Okuse C, Matsumoto
N, Nagai K, Sato T, Arito M, et al: Serum peptides, represented by
complement 3f des-arginine, are useful for prediction of the
response to pegylated interferon-α plus ribavirin in patients with
chronic hepatitis C. Hepatol Res. 43:743–756. 2013.PubMed/NCBI
|
|
19
|
Azuma T, Matayoshi Y, Nagase Y and Oshi M:
Neutrophil number after interferon-alfa treatment is an independent
predictive marker of overall survival in metastatic renal cell
carcinoma. Clin Genitourin Cancer. 10:180–184. 2012. View Article : Google Scholar : PubMed/NCBI
|