Introduction
Approximately 10% of all clinically overt
intracranial neoplasms arise from the pituitary gland, of which
prolactin-secreting adenomas, also termed prolactinomas, were the
most common, accounting for 30–40% of pituitary tumors (1,2).
Prevalence has classically been indicated to be 94 per 100,000
inhabitants (3). The early
diagnosis of prolactin-secreting pituitary tumors is difficult due
to the early signs or symptoms being associated with the
overproduction of hormones, and hormones that are only combined
with a single tumor are particularly rare (2,4).
Hormones, such as estrogens, are apparently not the only cause and
other possible hormones, including local growth factors in
pituitary prolactinomas, are less well defined (5).
Prolactin pituitary (PRL) tumors are classified and
managed according to size (6). For
example, microprolactinomas (<1 cm) do not typically invade the
parasellar region, while macroprolactinomas (>1 cm) are more
likely to locally invade and compress surrounding structures.
Previous studies have determined the molecular pathogenesis of
pituitary tumor aggressive behavior and malignant transformation. A
dopamine agonist was identified to control PRL via decreased
D2 receptor availability, differential isoform expression
and disrupted autocrine growth factor signaling (7,8).
ErbB receptors, epidermal growth factor receptor (9), p185her2/neu (10), ErbB3 and ErbB4
(11), including the
kinase-deficient ErbB3 dimerization with
p185her2/neu may reflect tumor progression to an
increasingly dedifferentiated state (12,13).
Increased ErbB receptor expression has been verified in
aggressive pituitary tumors and carcinomas. Furthermore, inhibition
of the ErbB receptor may provide an alternative medical
control of tumor growth and hormone secretion (14).
In the present study, the gene expression profile of
PRL tumor samples, including non-invasive, invasive and
aggressive-invasive samples, were investigated and the
differentially expressed genes (DEGs) associated with tumor
metastasis were identified. The DEGs were subsequently clustered
and The Database for Annotation, Visualization and Integrated
Discovery (DAVID) was used to identify over-represented Gene
Ontology (GO) categories in biological processes and significant
pathways. Finally, gene pairs of DEGs between non-invasive and
aggressive-invasive samples were identified and used to construct
the co-expression network. The present study aimed to identify
co-expressed gene pairs for PRL tumor metastasis via bioinformatics
methods, with the purpose of investigating potential molecular
biomarkers for use in clinical treatment.
Materials and methods
Microarray data and preprocessing
The gene expression profile GSE22812 (15) was downloaded from the Gene
Expression Omnibus database (http://www.ncbi.nlm.nih.gov/geo/), and included 13 PRL
tumor samples. These samples were classified as non-invasive (n=5),
invasive (n=2) and aggressive-invasive (n=6). The annotation
information of GeneChip was available based on the GPL2895
microarray platform (GE Healthcare/Amersham Biosciences CodeLink
Human Whole Genome Bioarray).
The original probe-level data in the CEL files were
converted into expression values with a log2
transformation. The probe signal was subsequently converted into
the corresponding gene symbol using the microarray platform,
GPL2895. For genes that corresponded with multiple probe sets,
which exhibited a plurality of expression values, the expression
values of those probe sets were averaged and the boxplot of the
standardization expression value was mapped. Finally, these data
were normalized using the between array normalization function in
the limma package of R language (part of the Bioconductor project)
(16,17).
DEGs analysis and screening
The limma package in R language was used to identify
DEGs in the invasive and aggressive-invasive samples by comparison
with the non-invasive samples. The DEGs with a fold change value
(|log2FC|)>1 and P<0.05 were selected.
To avoid the difference of expression value in one
group being greater than that between groups, the standard
deviation (SD) of expression values of DEGs in the different groups
was calculated. SD<0.15 served as the cut-off criterion for
further DEG screening.
The expression values of DEGs were hierarchically
clustered by Cluster software (http://bonsai.hgc.jp/~mdehoon/software/cluster/software.htm)
(18) and the differences in gene
expression between non-invasive, invasive, and aggressive-invasive
samples were intuitively observed. The expression values of
overlapping genes between invasive and aggressive-invasive samples
were also hierarchically clustered.
Functional enrichment analysis of
DEGs
The functional enrichment analysis for the screened
DEGs from the invasive and aggressive-invasive samples was
performed using DAVID (19) for
Kyoto Encyclopedia of Genes and Genomes (KEGG) (20) pathway and GO (21) function analysis. P<0.01 served
as the cut-off criterion. Comparison of the significant GO terms
and KEGG pathways were used to identify the different biological
functions between the invasive and aggressive-invasive samples.
Co-expression network analysis
The correlation coefficient (R value) of DEGs
between non-invasive and aggressive-invasive samples was calculated
via the Spearman method of cor( ) function in R language (22). The invasive samples were excluded
due to the low number of samples. The linear association of the
expression value between two genes was verified using the cor( )
test and only the gene pairs with |R|>0.95 and P<0.05 were
selected to construct the interaction networks.
Results
Screening differentially expressed
genes
The publicly available microarray dataset, GSE22812
was preprocessed and a total of 7,579 genes were obtained from 13
PRL tumor samples. The differences between samples were
significantly reduced following normalization using the between
array normalization function (Fig.
1). The median of the gene expression value was almost on a
straight line, indicating a marked degree of standardization.
At |log2FC|>1, P<0.05 and
SD<0.15, a total of 61 DEGs were obtained by comparing
non-invasive and invasive samples, including 31 upregulated and 30
downregulated genes (Table I). A
total of 89 DEGs were identified between non-invasive and
aggressive-invasive samples, including 36 upregulated and 53
downregulated genes (Table II).
The number of abnormally expressed genes from the
aggressive-invasive samples was greater compared with the invasive
samples.
 | Table ISignificant upregulated and
downregulated differentially expressed genes (top 10 of each) from
invasive samples. |
Table I
Significant upregulated and
downregulated differentially expressed genes (top 10 of each) from
invasive samples.
| Gene |
Log2FC | P-value |
|---|
| PDE4C | 1.40 |
9.60E−04 |
| PHF19 | 2.01 |
1.00E−03 |
| SLC2A11 | 1.34 |
1.40E−03 |
| KRTAP19-1 | 1.23 |
1.50E−03 |
| ANKRD33B | 2.09 |
1.60E−03 |
| KLHL8 | 1.50 |
2.00E−03 |
| GPR52 | 1.29 |
2.40E−03 |
| EGFR-AS1 | 1.23 |
2.90E−03 |
| PLCZ1 | 1.22 |
3.20E−03 |
| ASGR1 | 1.06 |
4.40E−03 |
| CDO1 | −2.33 |
4.89E−05 |
| TAGLN3 | −1.46 |
4.65E−04 |
| AKAP12 | −2.33 |
1.30E−03 |
| CORO1C | −1.45 |
2.30E−03 |
| LAPTM4B | −1.17 |
2.40E−03 |
| JUNB | −1.46 |
3.30E−03 |
| HPCAL1 | −1.63 |
4.00E−03 |
| ACTN1 | −1.30 |
4.20E−03 |
| HIST1H2AG | −1.45 |
5.70E−03 |
| ATP1B3 | −1.08 |
6.20E−03 |
| Table IISignificant upregulated and
downregulated differentially expressed genes (top 10 of each) from
aggressive-invasive samples. |
Table II
Significant upregulated and
downregulated differentially expressed genes (top 10 of each) from
aggressive-invasive samples.
| Gene |
Log2FC | P-value |
|---|
| CCNB1 | 1.71 |
1.29E−04 |
| RACGAP1 | 1.75 |
1.44E−04 |
| TAGLN | 1.97 |
2.01E−04 |
| ZNF430 | 1.38 |
3.14E−04 |
| GTDC1 | 1.62 |
3.67E−04 |
| SLC2A11 | 1.19 |
4.38E−04 |
| VLDLR | 1.19 |
5.50E−04 |
| DBF4 | 1.43 |
6.44E−04 |
| COL6A2 | 1.64 |
7.05E−04 |
| SRGAP2C | 1.23 |
8.93E−04 |
| RCN1 | −1.44 |
8.91E−04 |
| C11orf82 | −1.21 |
9.13E−04 |
| CLCN1 | −1.74 |
1.00E−03 |
| IPO7 | −1.38 |
1.50E−03 |
| SLC23A1 | −1.22 |
1.50E−03 |
| SIK2 | −1.43 |
1.98E−03 |
| STAT5B | −1.32 |
2.00E−03 |
| ZNF516 | −1.28 |
2.10E−03 |
| GLI1 | −1.51 |
2.50E−03 |
| CCHCR1 | −1.21 |
2.60E−03 |
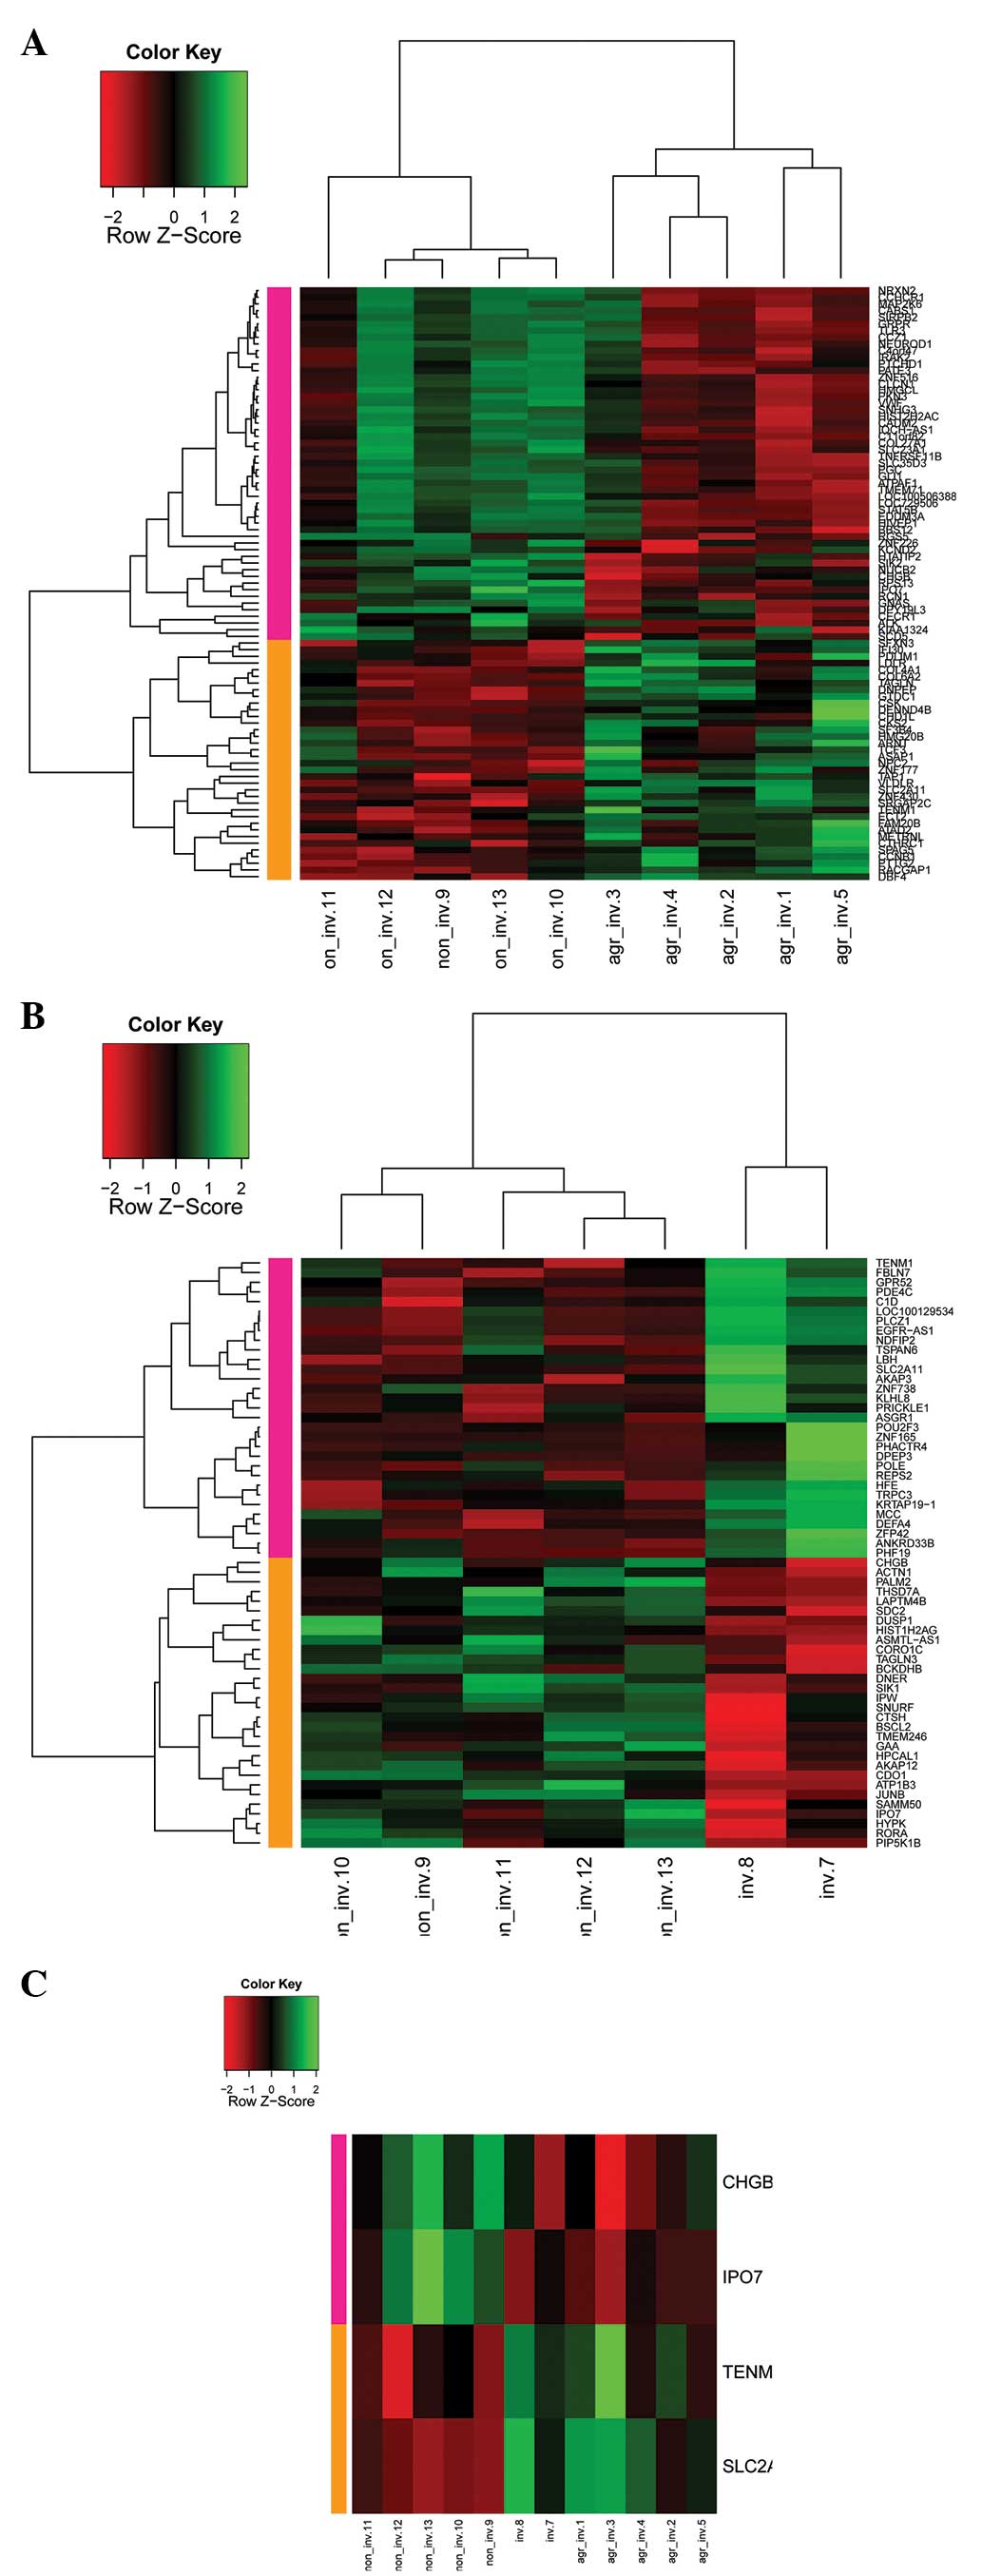
Cluster analysis
Cluster analysis was used to determine the
expression value of DEGs from the different samples. One
aggressive-invasive sample (PRL tumor_agressive-invasive_6) showed
a different expression value and was excluded. The other five
aggressive-invasive, two invasive and five non-invasive samples
were clustered and the color contrast is shown in Fig. 2. Briefly, a cluster analysis of
five aggressive-invasive and five non-invasive samples showed two
clusters; upregulated and downregulated genes in the
aggressive-invasive samples (Fig.
2A). Similarly, cluster analysis of two invasive and five
non-invasive samples showed two clusters; upregulated and
downregulated genes in the invasive samples (Fig. 2B).
There were four genes that were shared by the
invasive and aggressive-invasive samples, including solute carrier
family 2, facilitated glucose transporter member 11
(SLC2A11), importin 7 (IPO7), chromogranin B
(CHGB) and teneurin transmembrane protein 1 (TENM1).
Cluster analysis showed upregulation of TENM1 and
SLC2A11, and downregulation of IPO7 and CHGB
in the aggressive-invasive samples (Fig. 2C).
Gene function annotation
To determine the function of DEGs in a PRL tumor,
the DEGs were mapped into the GO database. Table III shows the significant GO terms
in which the DEGs were primarily located. In the invasive samples,
the majority of DEGs were enriched in response to cyclic adenosine
monophosphate and a glucocorticoid stimulus. By contrast, in the
aggressive-invasive samples, the cell cycle was the most
significant GO term and the other genes partially correlated with
the response to hormone stimulation (Table III). DEGs from the
aggressive-invasive samples were enriched into GO terms compared
with invasive samples. However, DEGs were not significantly
enriched into a specific pathway via the KEGG pathway analysis,
which may be due to the limitation of the low number of DEGs that
were analyzed.
| Table IIISignificantly enriched GO terms in
prolactin tumor cells from invasive and aggressive-invasive samples
with P<0.01. |
Table III
Significantly enriched GO terms in
prolactin tumor cells from invasive and aggressive-invasive samples
with P<0.01.
| Sample | Category | GO Term | Count | P-value |
|---|
| Invasive | GOTERM_BP_FAT | GO:0051591 response
to cyclic adenosine monophosphate | 4 | 0.0003 |
| GOTERM_BP_FAT | GO:0051384 response
to glucocorticoid stimulus | 4 | 0.0018 |
| GOTERM_BP_FAT | GO:0031960 response
to corticosteroid stimulus | 4 | 0.0023 |
|
Aggressive-invasive | GOTERM_BP_FAT | GO:0045637
regulation of myeloid cell differentiation | 4 | 0.0042 |
| GOTERM_BP_FAT | GO:0022402 cell
cycle process | 9 | 0.0045 |
| GOTERM_BP_FAT | GO:0010033 response
to organic substance | 10 | 0.0059 |
| GOTERM_BP_FAT | GO:0007049 cell
cycle | 10 | 0.0094 |
| GOTERM_CC_FAT | GO:0005576
extracellular region | 19 | 0.0032 |
| GOTERM_CC_FAT | GO:0044421
extracellular region part | 12 | 0.0040 |
| GOTERM_MF_FAT | GO:0046982 protein
heterodimerization activity | 6 | 0.0029 |
Construction of a co-expression
network
To construct the co-expression network of DEGs
between non-invasive and aggressive-invasive samples, the
correlation coefficient of DEGs was calculated and only gene pairs
with |R|>0.95 and P<0.05 were selected. The co-expression
network of DEGs from the invasive samples consisted of 42 nodes and
34 co-expressed pairs, presenting scattered gene pairs and only one
module with more than five nodes (Fig.
3A). In the aggressive-invasive samples, the co-expression
network of DEGs contained 68 nodes and 122 co-expressed pairs
gathered together, forming positive correlation modules and mixed
modules (Fig. 3B). There were five
modules containing more than five nodes (Fig. 3B).
Briefly, SLC2A11 and CHGB were shared
by two co-expression networks within the different co-expressed
pairs. Furthermore, no co-expressed pair simultaneously occurred in
two co-expression networks. A number of downregulated DEGs in the
aggressive-invasive samples were gathered to form positive
correlation modules (Fig. 3B).
Discussion
PRL-secreting adenomas were the most common (~40%)
type of pituitary adenomas and an important cause of hypogonadism,
infertility and osteoporosis, as well as central compressive
effects (8,23,24).
Medical therapy with dopamine agonists are highly effective in
controlling the tumor mass in the majority of cases, however,
complicated situations, including dopamine agonist resistance,
pregnancy and malignant prolactinomas, may require multi-therapies
involving surgery, radiotherapy, or a combination of the two
(25,26). Progress in elucidating the natural
development of prolactinomas was beneficial for disease management
(27). However, currently there is
no method to accurately identify the invasive pituitary tumors that
are most likely to metastasize, which would enable early treatment
prior to progression to malignant prolactinomas.
In the current study, a total of 61 and 89 DEGs were
identified by comparing non-invasive samples with invasive and
aggressive-invasive samples, respectively. Cluster analysis showed
that four overlapping genes, SLC2A11, TENM1,
IPO7 and CHGB were co-expressed, indicating the close
association of these genes with tumor transformation. It has been
reported that CHGB (CgB) may be considered as a
universal granular marker for pituitary adenomas (28). In addition, the hypothalamic
hormone, gonadotropin-releasing hormone and the CgA-derived
peptide, pancreastatin, may regulate CgB mRNA in gonadotroph
adenomas, indicating an autocrine effect of pancreastatin on
pituitary tumor function (29).
CgB is a precursor of two peptides, GAWK (CHGB
420–493) and BAM-1745 (1745-dalton pyroglutamyl) (30). Although the other three genes have
not been verified to be associated with pituitary adenomas,
previous studies have implicated these genes in other cancers.
Notably, β-karyopherin genes (IPO7) were the importin-α/β
complex that was frequently overexpressed in cancer and is mediated
by the nuclear importing of proteins with a classical nuclear
localization signal (31,32). SLC2A11, the solute carrier
2A11 gene, encodes a novel sugar transporter, Human glucose
transporter 11, and consists of 12 exons, located on chromosome
22q11.2. In human tissue, a 7.2-kb transcript of SLC2A11 was
detected exclusively in heart and skeletal muscle (33). In vertebrates, there are four
paralogs, TENM 1–4, which are expressed prominently in the
developing central nervous system. TENM1 and -2 are
expressed by distinct interconnected populations of neurons
(34). Based on their distinct
complementary expression, a possible function in the establishment
of proper connectivity in the brain was hypothesized (35). Progress in elucidating the
mechanisms underlying the pathogenesis of prolactinomas may enable
future development of novel molecular therapies for
treatment-resistant cases.
GO function enrichment analysis showed different GO
terms of invasive and aggressive-invasive samples, indicating a
different biological progression in the two stages. Hormone genes
were abnormally expressed in the invasive samples and, in the
aggressive-invasive samples, dysregulation of cell cycle
progression was hypothesized as significant in malignant
metastasis. In addition, the co-expression network of DEGs showed
that SLC2A11 and CHGB occurred in two co-expression
networks combined with different co-expressed pairs. These results
indicated that CHGB and SLC2A11 may be significant in
PRL tumor progression and may serve as molecular biomarkers for PRL
tumors. However, samples were limited in the current study and
co-expression of metastasis-associated genes was not
comprehensively elucidated.
In conclusion, four genes that are relevant to tumor
metastasis were identified from 13 PRL tumor samples using a
bioinformatics method. Two gene pairs were shared by co-expression
networks of DEGs from invasive and aggressive-invasive samples.
These candidate factors correlated with the progression of
prolactinoma and, thus, may provide a series of potential
therapeutic targets for the treatment of pituitary tumors.
Acknowledgements
The present study was supported by a grant from the
Natural Science Foundation Project of CQ CSTC (grant no.
2010BB5179).
References
|
1
|
Mindermann T and Wilson CB: Age-related
and gender-related occurrence of pituitary adenomas. Clin
Endocrinol (Oxf). 41:359–364. 1994. View Article : Google Scholar : PubMed/NCBI
|
|
2
|
Dessimoz C, Browaeys P, Maeder P, et al:
Transformation of a microprolactinoma into a mixed growth hormone
and prolactin-secreting pituitary adenoma. Front Neuroendocrin
(Lausanne). 2:1162011.PubMed/NCBI
|
|
3
|
Daly AF, Rixhon M, Adam C, Dempegioti A,
Tichomirowa MA and Beckers A: High prevalence of pituitary
adenomas: a cross-sectional study in the province of Liege,
Belgium. J Clin Endocrinol Metab. 91:4769–4775. 2006. View Article : Google Scholar : PubMed/NCBI
|
|
4
|
Ma W, Ikeda H and Yoshimoto T:
Clinicopathologic study of 123 cases of prolactin-secreting
pituitary adenomas with special reference to multihormone
production and clonality of the adenomas. Cancer. 95:258–266. 2002.
View Article : Google Scholar : PubMed/NCBI
|
|
5
|
Ahtiainen P, Sharp V, Rulli SB, et al:
Enhanced LH action in transgenic female mice expressing
hCGbeta-subunit induces pituitary prolactinomas; the role of high
progesterone levels. Endocr Relat Cancer. 17:611–621. 2010.
View Article : Google Scholar
|
|
6
|
Ali S, Miller KK and Freudenreich O:
Management of psychosis associated with a prolactinoma: case report
and review of the literature. Psychosomatics. 51:370–376. 2010.
View Article : Google Scholar : PubMed/NCBI
|
|
7
|
Gillam MP, Molitch ME, Lombardi G and
Colao A: Advances in the treatment of prolactinomas. Endocr Rev.
27:485–534. 2006. View Article : Google Scholar
|
|
8
|
Vlotides G, Cooper O, Chen YH, Ren SG,
Greenman Y and Melmed S: Heregulin regulates prolactinoma gene
expression. Cancer Res. 69:4209–4216. 2009. View Article : Google Scholar : PubMed/NCBI
|
|
9
|
Leriche VK, Asa SL and Ezzat S: Epidermal
growth factor and its receptor (EGF-R) in human pituitary adenomas:
EGF-R correlates with tumor aggressiveness. J Clin Endocrinol
Metab. 81:656–662. 1996.PubMed/NCBI
|
|
10
|
Roncaroli F, Nosé V, Scheithauer BW, et
al: Gonadotropic pituitary carcinoma: HER-2/neu expression and gene
amplification. Report of two cases. J Neurosurg. 99:402–408. 2003.
View Article : Google Scholar : PubMed/NCBI
|
|
11
|
Onguru O, Scheithauer BW, Kovacs K, et al:
Analysis of epidermal growth factor receptor and activated
epidermal growth factor receptor expression in pituitary adenomas
and carcinomas. Mod Pathol. 17:772–780. 2004. View Article : Google Scholar
|
|
12
|
Zhang H, Berezov A, Wang Q, et al: ErbB
receptors: from oncogenes to targeted cancer therapies. J Clin
Invest. 117:2051–2058. 2007. View
Article : Google Scholar : PubMed/NCBI
|
|
13
|
Tzahar E, Waterman H, Chen X, et al: A
hierarchical network of interreceptor interactions determines
signal transduction by Neu differentiation factor/neuregulin and
epidermal growth factor. Mol Cell Biol. 16:5276–5287. 1996.
|
|
14
|
Vlotides G, Siegel E, Donangelo I, Gutman
S, Ren SG and Melmed S: Rat prolactinoma cell growth regulation by
epidermal growth factor receptor ligands. Cancer Res. 68:6377–6386.
2008. View Article : Google Scholar : PubMed/NCBI
|
|
15
|
Wierinckx A, Roche M, Raverot G, et al:
Integrated genomic profiling identifies loss of chromosome 11p
impacting transcriptomic activity in aggressive pituitary PRL
tumors. Brain Pathol. 21:533–543. 2011.PubMed/NCBI
|
|
16
|
Toedling J, Sklyar O, Huber W, et al:
Ringo - an R/Bioconductor package for analyzing ChIP-chip readouts.
BMC Bioinformatics. 8:2212007. View Article : Google Scholar : PubMed/NCBI
|
|
17
|
Bolstad BM, Irizarry RA, Astrand M and
Speed TP: A comparison of normalization methods for high density
oligonucleotide array data based on variance and bias.
Bioinformatics. 19:185–193. 2003. View Article : Google Scholar : PubMed/NCBI
|
|
18
|
Eisen MB, Spellman PT, Brown PO and
Botstein D: Cluster analysis and display of genome-wide expression
patterns. Proc Natl Acad Sci USA. 95:14863–14868. 1998. View Article : Google Scholar : PubMed/NCBI
|
|
19
|
Huang da W, Sherman BT and Lempicki RA:
Systematic and integrative analysis of large gene lists using DAVID
bioinformatics resources. Nat Protoc. 4:44–57. 2009.PubMed/NCBI
|
|
20
|
Kanehisa M: The KEGG database. Novartis
Found Symp. 247:91–103; discussion 119–128, 244–152. 2002.
View Article : Google Scholar
|
|
21
|
Hulsegge I, Kommadath A and Smits MA:
Globaltest and GOEAST: two different approaches for Gene Ontology
analysis. BMC Proc. 3(Suppl 4): S102009. View Article : Google Scholar : PubMed/NCBI
|
|
22
|
Becker RA, Chambers JM and Wilks AR: The
New S Language: A Programming Environment for Data Analysis and
Graphics. 1. Chapman & Hall; London: 1988
|
|
23
|
Melmed S: Mechanisms for pituitary
tumorigenesis: the plastic pituitary. J Clin Invest. 112:1603–1618.
2003. View
Article : Google Scholar : PubMed/NCBI
|
|
24
|
Casanueva FF, Molitch ME, Schlechte JA, et
al: Guidelines of the Pituitary Society for the diagnosis and
management of prolactinomas. Clin Endocrinol (Oxf). 65:265–273.
2006. View Article : Google Scholar : PubMed/NCBI
|
|
25
|
Olafsdottir A and Schlechte J: Management
of resistant prolactinomas. Nat Clin Pract Endocrinol Metab.
2:552–561. 2006. View Article : Google Scholar
|
|
26
|
Whitelaw BC, Dworakowska D, Thomas NW, et
al: Temozolomide in the management of dopamine agonist-resistant
prolactinomas. Clin Endocrinol (Oxf). 76:877–886. 2012. View Article : Google Scholar : PubMed/NCBI
|
|
27
|
Ragel BT and Couldwell WT: Pituitary
carcinoma: a review of the literature. Neurosurg Focus. 16:E72004.
View Article : Google Scholar : PubMed/NCBI
|
|
28
|
Riva C, Leutner M, Capella C, et al:
Different expression of chromogranin A and chromogranin B in
various types of pituitary adenomas. Zentralbl Pathol. 139:165–170.
1993.PubMed/NCBI
|
|
29
|
Jin L, Scheithauer BW, Young WF Jr, Davis
DH, Klee GG and Lloyd RV: Pancreastatin secretion by pituitary
adenomas and regulation of chromogranin B mRNA expression. Am J
Pathol. 148:2057–2066. 1996.PubMed/NCBI
|
|
30
|
Louthan O: Chromogranin a in physiology
and oncology. Folia Biol (Praha). 57:173–181. 2011.PubMed/NCBI
|
|
31
|
Golomb L, Bublik DR, Wilder S, et al:
Importin 7 and exportin 1 link c-Myc and p53 to regulation of
ribosomal biogenesis. Mol Cell. 45:222–232. 2012. View Article : Google Scholar : PubMed/NCBI
|
|
32
|
Atasheva S, Fish A, Fornerod M and Frolova
EI: Venezuelan equine Encephalitis virus capsid protein forms a
tetrameric complex with CRM1 and importin alpha/beta that obstructs
nuclear pore complex function. J Virol. 84:4158–4171. 2010.
View Article : Google Scholar
|
|
33
|
Doege H, Bocianski A, Scheepers A, et al:
Characterization of human glucose transporter (GLUT) 11 (encoded by
SLC2A11), a novel sugar-transport facilitator specifically
expressed in heart and skeletal muscle. Biochem J. 359:443–449.
2001. View Article : Google Scholar
|
|
34
|
Kenzelmann D, Chiquet-Ehrismann R,
Leachman NT and Tucker RP: Teneurin-1 is expressed in
interconnected regions of the developing brain and is processed in
vivo. BMC Dev Biol. 8:302008. View Article : Google Scholar : PubMed/NCBI
|
|
35
|
Beckmann J, Vitobello A, Ferralli J,
Kenzelmann Brož DK, Rijli FM and Chiquet-Ehrismann R: Human
teneurin-1 is a direct target of the homeobox transcription factor
EMX2 at a novel alternate promoter. BMC Dev Biol. 11:352011.
View Article : Google Scholar : PubMed/NCBI
|