Introduction
Human rheumatoid arthritis (RA), a polyarticular
disease of autoimmune nature (1),
is perpetuated by an invasive pannus tissue, whereas osteoarthritis
(OA), as a non-inflammatory degenerative disease of the articular
cartilage (2), is characterized by
an increased tendency for novel blood vessel formation (3,4).
Furthermore, recent studies have reported information regarding the
differences in pathogenesis between RA and OA. Patients with RA
present with joint destruction caused by hyperplasia of the
synovial lining, infiltration of mononuclear cells into the
sublining layer, stimulation of fibroblast-like synoviocytes and
the increase of catabolic mediators, including interleukin (IL)-1β
tumor necrosis factor (TNF)-α and matrix metalloproteinases (MMP)
(5). By contrast, in patients with
OA, joint destruction is due to cartilage degradation and elevated
concentrations of cartilage matrix components, which elicit the
presence of synovitis. In addition, synovitis aggravates the damage
of articular cartilage by releasing inflammatory cytokines and
destructive proteases (6).
Although OA and RA have different modes of
pathogenesis, the current treatment of these two disease is
similar, including nonsteroidal anti-inflammatory drugs, applied
for pain and inflammation management (7,8);
disease-modifying antirheumatic drugs, which function as a
classical first-line therapy to minimize or prevent joint damage
(7,9); and surgical treatment performed to
replace the joints (10,11). However, these approaches induce a
number of adverse events and less than satisfactory clinical
outcomes (12,13). Thus, disease-specific therapy
requires further investigation.
Genetic factors are also critical in the
pathogenesis of RA and OA. Bramlage et al (14) identified that bone morphogenetic
protein (BMP)-4 and BMP-5 were downregulated in OA and RA compared
with that expressed in normal synovial tissue, suggesting a role of
distinct BMPs in joint homeostasis, which may be altered in
inflammatory and degenerative joint diseases. In addition, Pohlers
et al (15) demonstrated
that upregulation of the tumor growth factor (TGF)-β pathway was
observed in RA synovial fibroblasts (SFBs), resulting in
significant overexpression of MMP-11 mRNA and protein in RA SFBs,
but not in OA SFBs. However, differentially expressed genes (DEGs)
and molecular mechanisms underlying RA and OA are not yet fully
understood.
In the current study, comparative analysis of DEG
characteristics between RA and OA profiles was performed to
identify DEGs with potential pathophysiological relevance.
Differential gene co-expression networks were constructed and
analyzed to identify disease candidate genes.
Materials and methods
Microarray data analysis
The gene expression data was downloaded from the
Gene Expression Omnibus (GEO) database (http://www.ncbi.nlm.nih.gov/geo/) using GEO accession
no. GSE7669 (15). The database
contains six RA and six OA SFBs derived from a human study using
the Affymetrix Human Genome U95 version 2 (Affymetrix Inc., Santa
Clara, CA, USA) platform. Background-corrected signal intensities
were determined using the MAS 5.0 software
(Affymetrix®). The normalization of datasets obtained on
Affymetrix arrays was performed using the preprocessCore package in
R (16).
Screening DEGs
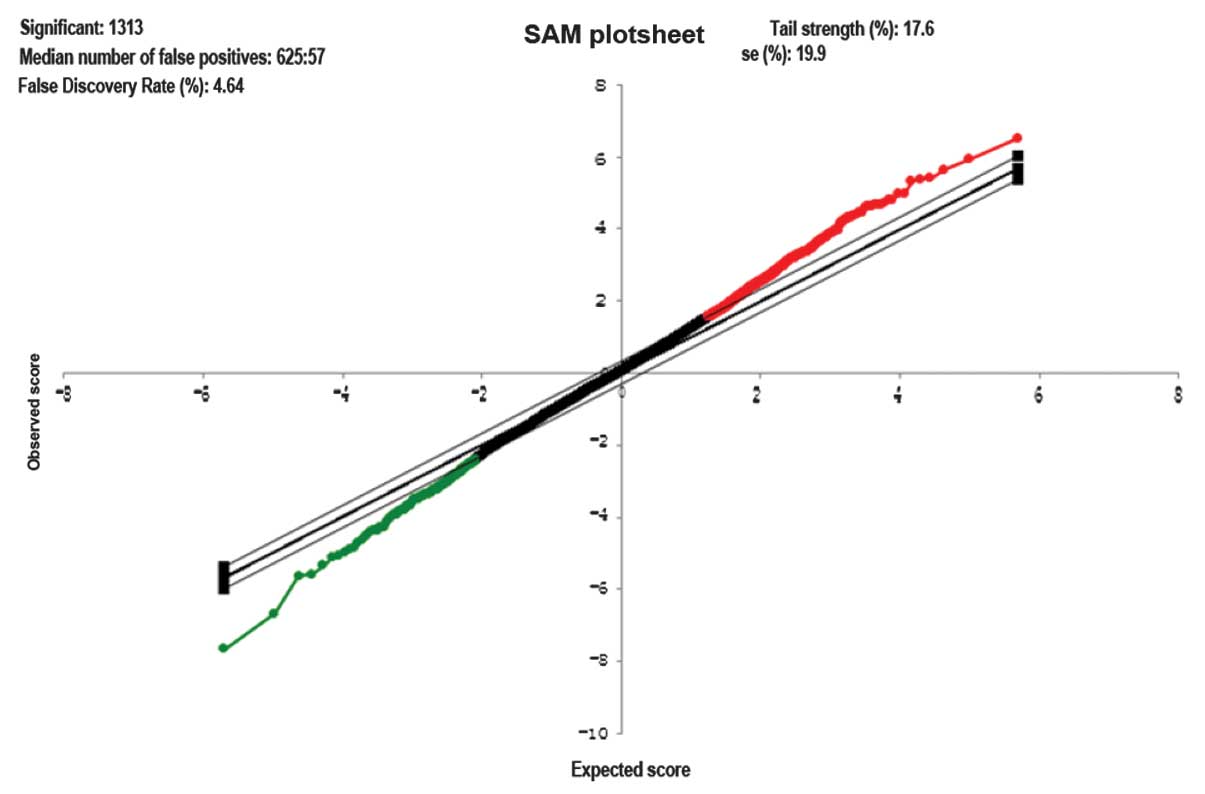
Significance analysis of microarray (SAM) is widely
used to detect genes on a microarray with statistically significant
changes in expression (17). As an
alternative to a t-test, significance SAM4.0 was employed for
determination of differentially expressed genes between RA and OA
SFBs and the threshold was set as log |fold change| ≥2.
Constructing differential gene
co-expression networks
Prior to the construction of co-expression networks,
the expression value was determined from differentially expressed
gene samples between RA and OA. Next, Pearson’s coefficient was
applied to calculate correlations between DEGs. The differential
co-expressiond network was then constructed as the threshold was
set as r≥0.8.
Network topological analysis
The Cytoscape plug-in Network Analyzer (18) was used for network visualization
and gene co-expression analysis. For each network the number of
nodes and edges was simply calculated. The clustering coefficient
of a network Cn was counted as the average clustering
coefficient of all of its non-singleton nodes via the formula:
Cn = 2en/kn(kn-1) (1); where en denotes the number
of edges between the kn neighbors of n and kn
is the degree of n (19).
Gene ranking
Conventionally, disease-associated gene ranking is
determined by linkage analysis and gene expression profile analysis
(20–22). However, these methods are mostly
limited to a single statistic indicator. In the current study, the
fold change of differentially expressed genes, the clustering
coefficient and the degree of differential gene co-expression were
integrated to determine the disease-associated gene ranking using
the formula (2): Crin =
FCn + degreen + Cn (2); where
Crin is an indicator of the gene ranking (the larger the
value is, the higher the gene ranks), FCn stands for the
value of gene fold change, degreen and Cn
denotes the average degree and the clustering coefficient of a
co-expression network respectively.
Calculating GO enrichment
Biological function and candidate gene-associated
biological pathways can be determined by GO (http://www.geneontology.org). The open access software
DAVID (23) was used to access the
GO enrichment of candidate genes, which is a slightly modified
Fisher’s exact test, identical to the EASE score (24).
Results
Differentially gene expression
Gene expression in six RA SFBs was compared with
that in six OA SFBs. The R preprocessCore was used to normalize and
preprocess the presented data (log |fold change| ≥2) (Fig. 1). A total of 1313 differentially
expressed genes were observed, in which 1068 genes were upregulated
and 245 genes were downregulated in OA SFBs compared with RA SFBs
(Fig. 2).
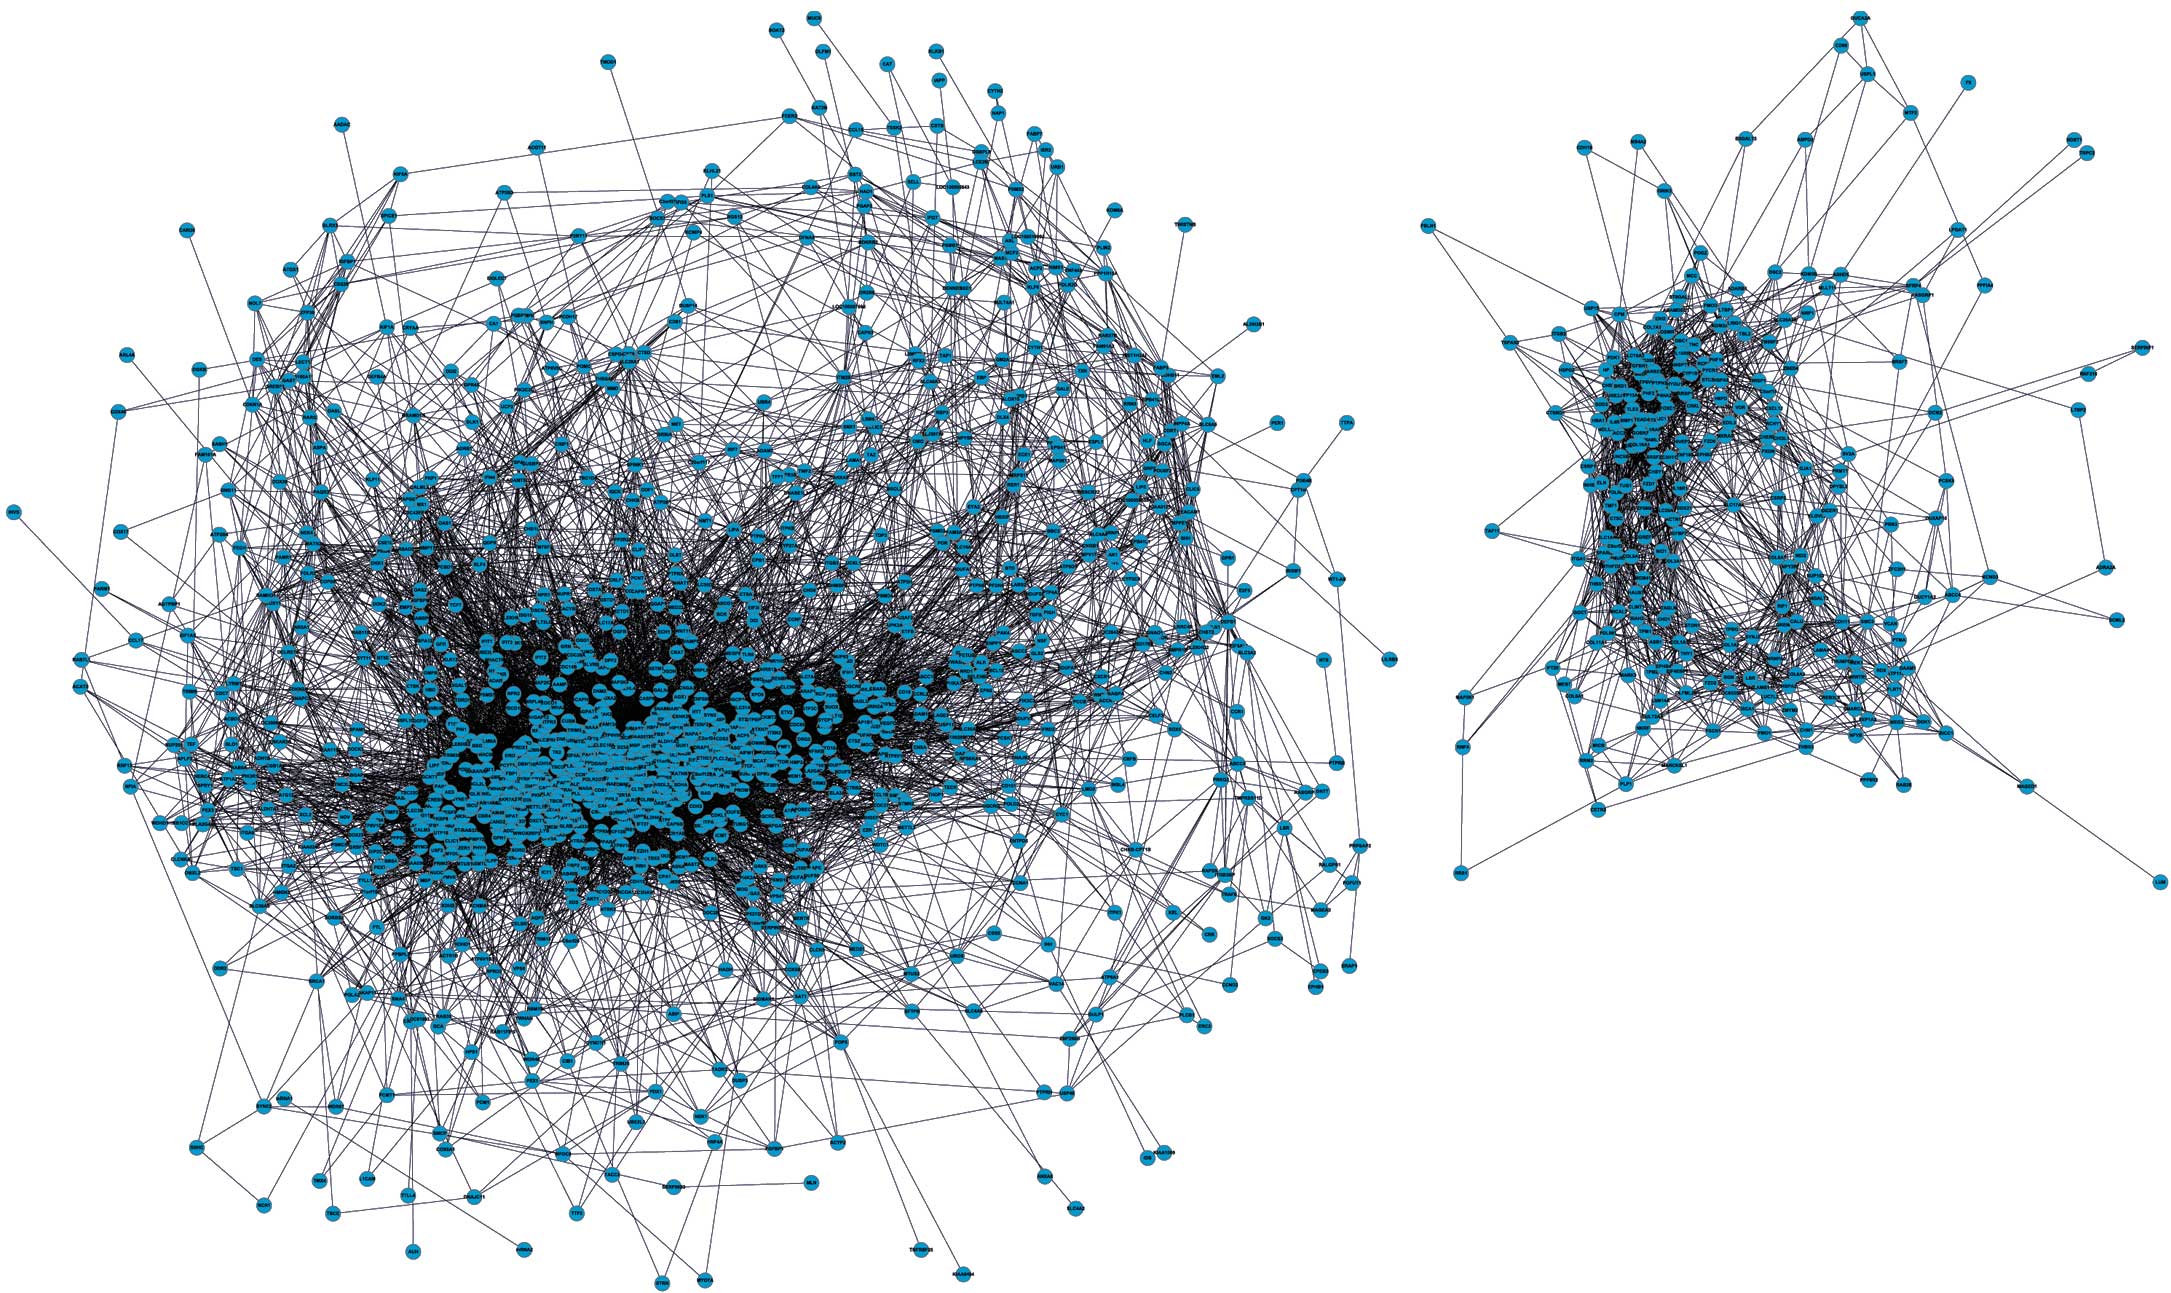
Differential co-expression network
To construct a differential gene co-expression
network, data from a total 1313 DEGs were extracted from the
expression profile and Pearson’s coefficient was applied to
calculate correlations between these DEGs (the threshold as r≥0.8).
A total 1302 nodes and 20372 edges were identified among the
differential gene co-expression network, which is comprised of two
closely connected sub-networks (Fig.
3)
Top 10 genes with the highest node
degrees in the co-expression network
Clustering coefficient and degree were analyzed to
detect the importance of disease-associated genes from differential
gene co-expression networks. In the current study, the top 10
degree of corresponding genes are shown in Table I. Briefly, tubulin folding
cofactor, ATP-binding cassette sub-family A member 3 and
dimethylargining dimethlyamnohydrolase 2 were the top three genes
of the list, with a considerably higher degree in the co-expression
network.
 | Table Igenes with the highest node degrees in
the co-expression network. |
Table I
genes with the highest node degrees in
the co-expression network.
| No. | Gene ID | Degree | Clustering
coefficient |
|---|
| 1 | TBCD | 190 | 0.3267613 |
| 2 | ABCA3 | 169 | 0.3709495 |
| 3 | DDAH2 | 164 | 0.3754302 |
| 4 | SLC29A1 | 164 | 0.3787221 |
| 5 | ARL2 | 162 | 0.3647726 |
| 6 | MAPKAPK3 | 161 | 0.3473602 |
| 7 | GUK1 | 160 | 0.3463050 |
| 8 | GNB5 | 159 | 0.3894594 |
| 9 | C16orf45 | 154 | 0.3922417 |
| 10 | PPP1R7 | 152 | 0.3580515 |
Top 20 disease candidate genes
To determine the association between DEGs and the
two diseases, OA and RA, disease candidate genes were ranked
according to the Crin value using the formula
Crin = FCn + degreen +
Cn. As presented in Table
II, the top 5 of 20 disease candidate genes were inhibin β B
(INHBB), carboxypeptidase M, alcohol dehydrogenase 1A, integrin β2
(ITGB2) and collagen, type XI, α 1 (COL11A1), respectively.
| Table IITop 20 disease candidate genes. |
Table II
Top 20 disease candidate genes.
| Rank | Symbol | Regulation |
Crin |
|---|
| 1 | INHBB | OA (down) | 10.10852052 |
| 2 | CPM | OA (down) | 8.60116868 |
| 3 | ADH1C | OA (up) | 6.83154569 |
| 4 | ITGB2 | OA (down) | 6.62193398 |
| 5 | COL11A1 | OA (down) | 6.28105739 |
| 6 | ADH1A | OA (up) | 6.23549718 |
| 7 | C10orf116 | OA (up) | 5.89913165 |
| 8 | SLC29A1 | OA (up) | 5.84062491 |
| 9 | PRG4 | OA (up) | 5.57878155 |
| 10 | CHL1 | OA (up) | 5.54248666 |
| 11 | RARRES2 | OA (down) | 5.40151339 |
| 12 | MS4A2 | OA (down) | 5.36385476 |
| 13 | CCR3 | OA (up) | 5.05797001 |
| 14 | IFIT2 | OA (up) | 4.88706770 |
| 15 | RSAD2 | OA (up) | 4.77719664 |
| 16 | CLIC5 | OA (up) | 4.77298747 |
| 17 | MYRIP | OA (up) | 4.77081124 |
| 18 | SPARCL1 | OA (up) | 4.70336130 |
| 19 | ABCA3 | OA (up) | 4.51342883 |
| 20 | THBS1 | OA (down) | 4.29227205 |
Functional annotation of candidate
genes
The analysis of GO enrichment was used to detect the
association between the top 20 disease-associated candidate genes
and associated biological processes and pathways (P<0.05).
Overall, the majority of the top 20 disease-associated candidate
genes, including INHBB, CCR3, radical S-adenosyl methionine domain
containing 2, thrombospondin 1 (THBS1) and membrane-spanning
4-domains, subfamily A, member 2, were intensively enriched in
immune-associated biological process terms, including defense,
inflammatory, immune responses, immune system process and response
to wounding. In addition, ITGB2, THBS1, COL11A1, and close homolog
of L1 were closely involved in cell adhesion and biological
adhesion (Table III).
| Table IIITop 20 disease candidate genes and
related BP terms. |
Table III
Top 20 disease candidate genes and
related BP terms.
| Rank | BP term | N | Genes |
|---|
| 1 | Response to
stimulus | 9 | INHBB, PRG4, CCR3,
RSAD2, MS4A2, ITGB2, THBS1, COL11A1, ABCA3 |
| 2 | Localization | 8 | SLC29A1, MYRIP,
CLIC5, MS4A2, ITGB2, THBS1, ABCA3, DNM1 |
| 3 | Defense
response | 6 | INHBB, CCR3, RSAD2,
MS4A2, ITGB2, THBS1 |
| 4 | Response to
stress | 6 | INHBB, CCR3, RSAD2,
MS4A2, ITGB2, THBS120 |
| 5 | Response to
external stimulus | 6 | INHBB, CCR3, MS4A2,
ITGB2, THBS1, COL11A1 |
| 6 | Immune system
process | 5 | PRG4, RSAD2, MS4A2,
ITGB2, THBS1 |
| 7 | Cell adhesion | | 5 CCR3, ITGB2,
THBS1, COL11A1, CHL1 |
| 8 | Biological
adhesion | 5 | CCR3, ITGB2, THBS1,
COL11A1, CHL1 |
| 9 | Immune
response | 4 | PRG4, RSAD2, MS4A2,
THBS1 |
| 10 | Inflammatory
response | 4 | CCR3, MS4A2, ITGB2,
THBS1 |
| 11 | Response to
wounding | 4 | CCR3, MS4A2, ITGB2,
THBS1 |
| 12 | Inner ear
morphogenesis | 2 | CLIC5, COL11A1 |
Discussion
Gene expression studies have been widely used to
allow improved diagnosis and identify novel pathways implicated in
the pathogenesis of autoimmune diseases. In the current study, DEGs
in OA SFBs compared with RA SFBs were identified based on gene
expression profiling, 1068 upregulated genes and 245 downregulated
genes were observed. Similarly, a previous study has reported
different biological properties between RA and OA SFBs. Higher
levels of specific cytokines were found in RA SFBs compared with OA
SFBs, including epidermal growth factor, basic fibroblast growth
factor, TGF-β1, granulocyte-macrophage colony-stimulating factor,
IL-1β and IL-6. In addition, by contrast with the OA SFBs, RA SFBs
were observed to stimulate [3H]thymidine incorporation
in the murine fibroblast cell line (25). Therefore, the current results
support the hypothesis that RA and OA may result in the alterations
of gene expression in the SFBs.
The development of an RA and OA gene co-expression
network based on the topological analysis is critical, since it may
provide visualized structural information regarding the
connectivity of genes, compared with the traditional clustering
analysis (26). Notably, the
clustering coefficient and degree are two of the most important
features of the network model. In the present study, the top 10
clustering coefficient Crin-associated genes were
identified, which indicates a highly significant association
between these genes and disease status. Notably, to the best of our
knowledge the present study was the first to use the formula:
Crin = FCn + degreen +
Cn, which is comprised of fold change, average degree
and clustering coefficient of co-expression gene network to
calculate the top 20 disease-associated candidate genes.
For OA disease, Martin et al (27) reported that the single nucleotide
polymorphism, rs2615977, located in intron 31 of COL11A1 (5th gene
at ranking) is highly associated with OA. In addition, COL11A1 has
been used as a significant target for musculoskeletal disease
research (28). In the present
study, COL11A1 was observed to be downregulated in OA samples
compared with RA samples, which further supports the results of a
previous study that suggested COL11A1 may have be associated with
OA (29). In addition, the
inhibition of cartilage hyperplasia appears to be another favorable
approach to relieve symptoms of OA disease. Ruan et al
(30) demonstrated that PRG4 (9th
gene at ranking) inhibits cartilage metabolism and proliferation by
upregulating hypoxia inducible factor-3α. In the current study,
PRG4 was found to be upregulated in the OA group but downregulated
in the RA group, which indicates that the PRG4 gene may have a
potential association with the pathogenesis of RA and OA.
In RA, Rinaldi et al (31) suggested that β1 integrins
contribute to the tight binding of RA SFBs to the matrix and
regulate extracellular matrix remodeling in the RA disease process
in vivo. The function of β1 integrins is similar to that of
the ITGB2 identified in this study (4th gene at ranking). Notably,
ITGB2 was identified to be upregulated in RA rather than OA, which
further supports the hypothesis that ITGB2 may be critical in
facilitating the RA disease process. INHBA and INHBB (1st gene at
ranking) are two subunits of inhibin. El-Gendi et al
(32) has demonstrated that the
serum level of inhibin β A was significantly higher in 60 patients
with RA compared with 20 normal patients. In the present study, the
expression level of INHBB was identified to be higher in RA
compared with OA, indicating that INHBB may have a similar function
to INHBA and may serve as a novel biological marker in the
diagnosis of RA disease.
Furthermore, functional enrichment analysis of the
top 20 disease-associated genes was performed to demonstrate the
possible biological mechanisms underlying AR and OA, including
response to stimulus, localization, response to stress, response to
external stimulus and process involved in the development of the
immune system. This finding is consistent with the results of
previous studies, suggesting that the immune system is pivotal in
auto-inflammatory and non-auto-inflammatory arthritis. The immune
system regulates the alteration of cell osmosis and the
inflammatory response caused by periostitis (33–36).
The majority of the other top 20 disease-associated genes were
enriched in terms of cell and biological adhesion. Notably, cell
adhesion is also highly correlated with the pathogenesis of AR and
OA. Karatay et al (37)
stated that the decreased intercellular adhesion molecule-1 and
vascular cell adhesion molecule-1 levels following intra-articular
hyaluronic acid (HA) injection may aid in explaining the
anti-inflammatory effects of HA therapy in OA of the knee.
In conclusion, the present study offers significant
information that may aid in understanding the molecular mechanisms
underlyng OA and RA. The top 20 disease-associated genes and
associated BP terms were observed in this study, which may
facilitate the design of targeted therapy for OA and RA in the near
future.
Acknowledgments
This study was supported by the Shanghai Medical Key
Subject Construction Project (ZK2012A28) and National Clinical Key
Specialty Construction Project.
References
|
1
|
Maini R, Plater-Zyberk C and Andrew E:
Autoimmunity in rheumatoid arthritis. An approach via a study of B
lymphocytes. Rheum Dis Clin North Am. 13:319–338. 1987.PubMed/NCBI
|
|
2
|
Buckwalter J and Mankin H: Articular
cartilage: degeneration and osteoarthritis, repair, regeneration,
and transplantation. Instr Course Lect. 47:487–504. 1997.PubMed/NCBI
|
|
3
|
Brown RA and Weiss JB: Neovascularisation
and its role in the osteoarthritic process. Ann Rheum Dis.
47:881–885. 1988. View Article : Google Scholar : PubMed/NCBI
|
|
4
|
Sattar A, Kumar P and Kumar S: Rheumatoid-
and osteo-arthritis: quantitation of ultrastructural features of
capillary endothelial cells. J Pathol. 148:45–53. 1986. View Article : Google Scholar : PubMed/NCBI
|
|
5
|
Keyszer G, Redlich A, Häupl T, et al:
Differential expression of cathepsins B and L compared with matrix
metalloproteinases and their respective inhibitors in rheumatoid
arthritis and osteoarthritis: a parallel investigation by
semiquantitative reverse transcriptase-polymerase chain reaction
and immunohistochemistry. Arthritis Rheum. 41:1378–1387. 1998.
|
|
6
|
Ayral X, Pickering E, Woodworth T,
Mackillop N and Dougados M: Synovitis: a potential predictive
factor of structural progression of medial tibiofemoral knee
osteoarthritis - results of a 1 year longitudinal arthroscopic
study in 422 patients. Osteoarthritis Cartilage. 13:361–367.
2005.
|
|
7
|
Emery P, Breedveld FUC, Lemmel EM, et al:
A comparison of the efficacy and safety of leflunomide and
methotrexate for the treatment of rheumatoid arthritis.
Rheumatology (Oxford). 39:655–665. 2000. View Article : Google Scholar : PubMed/NCBI
|
|
8
|
Superio-Cabuslay E, Ward MM and Lorig KR:
Patient education interventions in osteoarthritis and rheumatoid
arthritis: a meta-analytic comparison with nonsteroidal
antiinflammatory drug treatment. Arthritis Care Res. 9:292–301.
1996. View Article : Google Scholar
|
|
9
|
Ross C: A comparison of osteoarthritis and
rheumatoid arthritis: diagnosis and treatment. Nurse Pract.
22:20–41. 1997. View Article : Google Scholar : PubMed/NCBI
|
|
10
|
Kofoed H and Sørensen TS: Ankle
arthroplasty for rheumatoid arthritis and osteoarthritis:
prospective long-term study of cemented replacements. J Bone Joint
Surg Br. 80:328–332. 1998. View Article : Google Scholar : PubMed/NCBI
|
|
11
|
Wajon A, Carr E, Edmunds I and Ada L:
Surgery for thumb (trapeziometacarpal joint) osteoarthritis.
Cochrane Database Syst Rev. Oct 7;CD0046312009.
|
|
12
|
Silverstein FE, Faich G, Goldstein JL, et
al: Gastrointestinal toxicity with celecoxib vs nonsteroidal
anti-inflammatory drugs for osteoarthritis and rheumatoid
arthritis: the CLASS study: a randomized controlled trial.
Celecoxib Long-term Arthritis Safety Study. JAMA. 284:1247–1255.
2000. View Article : Google Scholar
|
|
13
|
Deeks JJ, Smith LA and Bradley MD:
Efficacy, tolerability, and upper gastrointestinal safety of
celecoxib for treatment of osteoarthritis and rheumatoid arthritis:
systematic review of randomised controlled trials. BMJ.
325:6192002. View Article : Google Scholar
|
|
14
|
Bramlage CP, Häupl T, Kaps C, et al:
Decrease in expression of bone morphogenetic proteins 4 and 5 in
synovial tissue of patients with osteoarthritis and rheumatoid
arthritis. Arthritis Res Ther. 8:R582006. View Article : Google Scholar : PubMed/NCBI
|
|
15
|
Pohlers D, Beyer A, Koczan D, Wilhelm T,
Thiesen HJ and Kinne RW: Constitutive upregulation of the
transforming growth factor-beta pathway in rheumatoid arthritis
synovial fibroblasts. Arthritis Res Ther. 9:R592007. View Article : Google Scholar : PubMed/NCBI
|
|
16
|
Bolstad BM, Irizarry RA, Astrand M and
Speed TP: A comparison of normalization methods for high density
oligonucleotide array data based on variance and bias.
Bioinformatics. 19:185–193. 2003. View Article : Google Scholar : PubMed/NCBI
|
|
17
|
Tusher VG, Tibshirani R and Chu G:
Significance analysis of microarrays applied to the ionizing
radiation response. Proc Natl Acad Sci USA. 98:5116–5121. 2001.
View Article : Google Scholar : PubMed/NCBI
|
|
18
|
Shannon P, Markiel A, Ozier O, et al:
Cytoscape: a software environment for integrated models of
biomolecular interaction networks. Genome Res. 13:2498–2504. 2003.
View Article : Google Scholar : PubMed/NCBI
|
|
19
|
Ruan J, Dean AK and Zhang W: A general
co-expression network-based approach to gene expression analysis:
comparison and applications. BMC Syst Biol. 4:82010. View Article : Google Scholar : PubMed/NCBI
|
|
20
|
Tiret L, Rigat B, Visvikis S, et al:
Evidence, from combined segregation and linkage analysis, that a
variant of the angiotensin I-converting enzyme (ACE) gene controls
plasma ACE levels. Am J Hum Genet. 51:197–205. 1992.PubMed/NCBI
|
|
21
|
Schmitt WA Jr, Raab RM and Stephanopoulos
G: Elucidation of gene interaction networks through time-lagged
correlation analysis of transcriptional data. Genome Res.
14:1654–1663. 2004. View Article : Google Scholar : PubMed/NCBI
|
|
22
|
Welsh JB, Zarrinkar PP, Sapinoso LM, et
al: Analysis of gene expression profiles in normal and neoplastic
ovarian tissue samples identifies candidate molecular markers of
epithelial ovarian cancer. Proc Natl Acad Sci USA. 98:1176–1181.
2001. View Article : Google Scholar
|
|
23
|
Huang da W, Sherman BT, Tan Q, et al:
DAVID Bioinformatics Resources: expanded annotation database and
novel algorithms to better extract biology from large gene lists.
Nucleic Acids Res. 35:W169–W175. 2007.PubMed/NCBI
|
|
24
|
Aoki-Kinoshita KF and Kanehisa M: Gene
annotation and pathway mapping in KEGG. Methods Mol Biol.
396:71–91. 2007. View Article : Google Scholar : PubMed/NCBI
|
|
25
|
Bucala R, Ritchlin C, Winchester R and
Cerami A: Constitutive production of inflammatory and mitogenic
cytokines by rheumatoid synovial fibroblasts. J Exp Med.
173:569–574. 1991. View Article : Google Scholar : PubMed/NCBI
|
|
26
|
Schadt EE and Lum PY: Thematic review
series: systems biology approaches to metabolic and cardiovascular
disorders. Reverse engineering gene networks to identify key
drivers of complex disease phenotypes. J Lipid Res. 47:2601–2613.
2006. View Article : Google Scholar
|
|
27
|
Martin S, Richards AJ, Yates J, Scott JD,
Pope M and Snead MP: Stickler syndrome: further mutations in
COL11A1 and evidence for additional locus heterogeneity. Eur J Hum
Genet. 7:807–814. 1999. View Article : Google Scholar : PubMed/NCBI
|
|
28
|
Kahler RA, Yingst S, Hoeppner LH, et al:
Collagen 11a1 is indirectly activated by lymphocyte
enhancer-binding factor 1 (Lef1) and negatively regulates
osteoblast maturation. Matrix Biol. 27:330–338. 2008. View Article : Google Scholar : PubMed/NCBI
|
|
29
|
Meulenbelt I: Osteoarthritis year 2011 in
review: genetics. Osteoarthritis Cartilage. 20:218–222. 2012.
|
|
30
|
Ruan MZ, Erez A, Guse K, et al:
Proteoglycan 4 expression protects against the development of
osteoarthritis. Sci Transl Med. 5:176ra342013.PubMed/NCBI
|
|
31
|
Rinaldi N, Schwarz-Eywill M, Weis D, et
al: Increased expression of integrins on fibroblast-like
synoviocytes from rheumatoid arthritis in vitro correlates with
enhanced binding to extracellular matrix proteins. Ann Rheum Dis.
56:45–51. 1997. View Article : Google Scholar
|
|
32
|
El-Gendi SS, Moniem AE, Tawfik NM, Ashmawy
MM, Mohammed OA, Mostafa AK, Zakhari MM and Herdan OM: Value of
serum and synovial fluid activin A and inhibin A in some rheumatic
diseases. Int J Rheum Dis. 13:273–279. 2010. View Article : Google Scholar : PubMed/NCBI
|
|
33
|
Scanzello CR, Plaas A and Crow MK: Innate
immune system activation in osteoarthritis: is osteoarthritis a
chronic wound? Curr Opin Rheum. 20:565–572. 2008. View Article : Google Scholar : PubMed/NCBI
|
|
34
|
Sakkas LI and Platsoucas CD: The role of T
cells in the pathogenesis of osteoarthritis. Arthritis Rheum.
56:409–424. 2007. View Article : Google Scholar : PubMed/NCBI
|
|
35
|
Feldmann M and Maini RN; Lasker Clinical
Medical Research Award. TNF defined as a therapeutic target for
rheumatoid arthritis and other autoimmune diseases. Nat Med.
9:1245–1250. 2003. View
Article : Google Scholar : PubMed/NCBI
|
|
36
|
McInnes IB and Schett G: Cytokines in the
pathogenesis of rheumatoid arthritis. Nat Rev Immunol. 7:429–442.
2007. View
Article : Google Scholar : PubMed/NCBI
|
|
37
|
Karatay S, Kiziltunc A, Yildirim K,
Karanfil RC and Senel K: Effects of different hyaluronic acid
products on synovial fluid levels of intercellular adhesion
molecule-1 and vascular cell adhesion molecule-1 in knee
osteoarthritis. Ann Clin Lab Sci. 34:330–335. 2004.PubMed/NCBI
|