Introduction
Globally, lung cancer is the leading cause of cancer
mortality in males and the second leading cause of cancer mortality
in females with ~1.6 million new lung cancer cases and 1.4 million
mortalities expected to occur in one year (1). In China, the most frequently
diagnosed cancer is lung cancer (2), and Chinese females have higher lung
cancer rates than females in several European countries (3).
Almost 40% of lung cancer cases are adenocarcinoma,
which usually originates in the peripheral lung tissue (4). Although several studies have assessed
gene expression (5–7) or provided novel diagnostic aids
(8) for pulmonary adenocarcinoma,
key genes leading to the deterioration of pulmonary adenocarcinoma
remain to be fully evaluated. Extensive efforts have been made to
uncover the basic mechanisms underlying the initiation and
progression of pulmonary adenocarcinoma, as well as to target these
processes for diagnostics at molecular and genetic levels. Key
genes and transcription factors (TFs) have an important role in the
study of the disease. For example, the expression of the receptor
of activated C kinase, which is an important 36-kDa cytosolic
protein (9), was reported to be a
useful biomarker for pulmonary adenocarcinoma (10). Furthermore, thyroid transcription
factor-1 gene amplification has been discovered in certain types of
lung adenocarcinoma, and this finding has been useful to inhibit
transforming growth factor-β-mediated epithelial-to-mesenchymal
transition in pulmonary adenocarcinoma cells (11). Compared with traditional research
methods, DNA microarrays are one of the most popular technologies
for studying the expression of genes at a large scale and
ultimately associating them with diseases (12). The molecular mechanisms of
pulmonary adenocarcinoma have yet to be fully understood, and a
large-scale study of genes associated with this disease is
necessary.
The aim of the present study was to explore the
biochemical pathways leading to the deterioration of patients with
pulmonary adenocarcinoma at the gene transcription level using a
computational bioinformatics analysis of gene expression.
Furthermore, the study aimed to identify the potential association
between TFs and differentially co-expressed genes (DCGs) in the
regulation of transcription. The present study may provide the
groundwork to enable the exploration of the most variable genes
leading to pulmonary adenocarcinoma.
Materials and methods
All patients provided informed consent prior to
their inclusion in the present study, and all human studies were
approved by the Ethics Committee of Shanghai Jiaotong University
(Shanghai, China) and performed in accordance with the ethical
standards.
Affymetrix microarray data and
differential expression analysis
The gene expression profile of GSE 2514 (7) was downloaded from a public functional
genomics data repository, the Gene Expression Omnibus (GEO), which
was based on the Affymetrix GPL8300 platform (Affymetrix Human
Genome U95, Version 2 Array; Affymetrix, Inc., Santa Clara, CA,
USA). These expression data were deposited by Stearman et al
(7). A total of 39 samples,
including 20 human lung cancer tissue samples and 19 human normal
lung tissue samples, were analyzed with one replicate each.
The R package was used to analyze the gene
expression profile (http://r-project.org/). The CEL source files were
processed into expression estimates, and background correction and
quartile data normalization were performed using the Robust
Multi-array Average algorithm (13). The probability of genes being
differentially expressed between pulmonary adenocarcinoma samples
and normal samples was computed using the limma package (14). The t-test method was used to
identify DEGs (15,16). P-values <0.05 and |logFC|>0.5
were considered to be statistically significant. The DCsum, DCp and
DCe functions in the Differential Co-expression Analysis and
Differential Regulation Analysis of Gene Expression Microarray Data
(DCGL) (17,18) (part of the R package) were used to
evaluate DCGs and differentially co-expressed links (DCLs). A
Q-value <0.05 was defined as the cut-off criterion.
Pathway enrichment analysis of DCGs
The Kyoto Encyclopedia of Genes and Genomes (KEGG)
PATHWAY database is a comprehensive database containing various
biochemical pathways (19). This
database records networks of molecular interactions in cells, as
well as variants of these networks specific to particular
organisms. To explore the dysfunctional pathways in pulmonary
adenocarcinoma samples, each group of genes was assessed using the
Database for Annotation, Visualization and Integrated Discovery
(DAVID) (20) for pathway
enrichment analysis. The DAVID is a program that detects an
enrichment of genes with specific gene ontology, KEGG and SwissProt
terms.
Construction of a transcriptional
regulatory network
TRANSFAC® (21) is a database of TFs, their genomic
binding sites and DNA-binding profiles. TRANSFAC®
comprises numerous data sheets, including SITE, GENE, FACTOR,
CLASS, MATRIX, CELLS, METHOD and REFERENCE. The association between
downloaded human TFs and target genes in the database was analyzed.
A total of 298 TFs and 6,495 TF-target pairs were selected. The
DCLs were mapped to the TF-target pairs and the results were
associated with the known target genes to obtain transcriptional
regulation interrelations. Cytoscape (22) software was used for the
construction of a transcriptional regulatory network.
Results
Differential gene expression in cancer
tissue samples compared with normal samples
The gene expression profile of GSE 2514 was
downloaded from the GEO database. Considering the scale of the
calculations in the DCGL, pulmonary adenocarcinoma microarray data
were analyzed and filtered using the limma and Affy packages to
obtain the DEGs. A total of 1,379 DEGs were obtained with a P-value
<0.05 and |logFC|>0.5. The DCGL in the R package was used to
screen DCLs and DCGs. When Q<0.05 was used as the cut-off
criterion, a total of 251 DCGs and 37,094 DCLs were obtained.
Identification of dysregulated
pathways
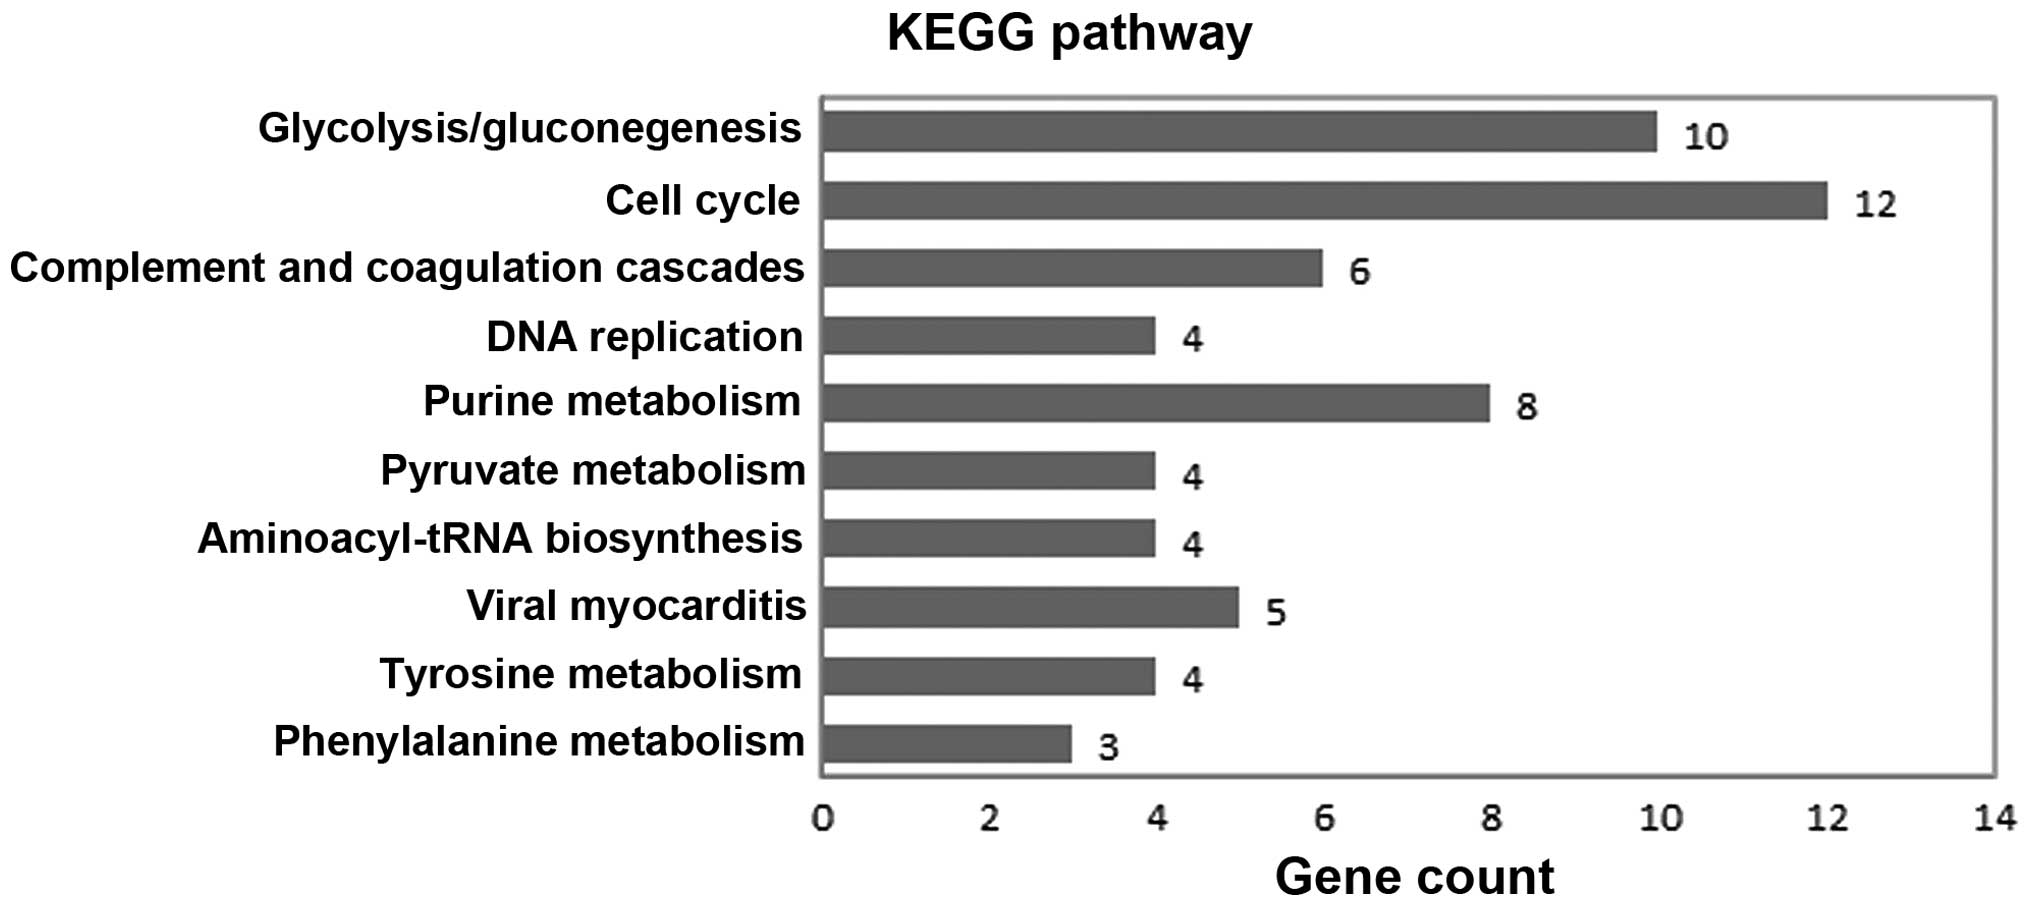
In order to identify the dysregulated pathways in
pulmonary adenocarcinoma samples, pathway enrichment analysis was
performed using the online biological classification tool DAVID. A
total of 10 pathways with a P-value <0.1 were enriched (Fig. 1). The most significant pathway was
glycolysis/gluconeogenesis (P=5.49×10⁻⁶). The other
significant pathways included the cell cycle
(P=8.84×10⁻⁵), complement and coagulation cascades
(P=0.018029) and DNA replication (P=0.044864). Ten significant
pathways are listed in Table
I.
 | Table IPathway enrichment of differentially
co-expressed genes in patients with cancer compared with normal
controls with P<0.1. |
Table I
Pathway enrichment of differentially
co-expressed genes in patients with cancer compared with normal
controls with P<0.1.
| Term | P-value | Differentially
co-expressed genes |
|---|
| Hsa00010:
Glycolysis/gluconeogenesis |
5.49×10⁻⁶ | ALDOA, GPI,
TPI1, PKM2, ALDH2, FBP1, ADH1B, ADH1A, PGK1, GAPDH, PCK1 |
| Hsa04110: Cell
cycle |
8.84×10⁻⁵ | CCNB1, CDC6,
CCNB2, CCND2, BUB1, PCNA, BUB1B
PRKDC, MCM2, GADD45B, MCM4, MCM6 |
| Hsa04610:
Complement and coagulation cascades | 0.018029 | VWF, C7, THBD,
CD59, SERPING1, CFD |
| Hsa03030: DNA
replication | 0.044864 | PCNA, MCM2,
MCM4, MCM6 |
| Hsa00230: Purine
metabolism | 0.052964 | POLR2H, ITPA,
PKM2, PDE4B, RRM1, NPR1, ENTPD6
HPRT1 |
| Hsa00620: Pyruvate
metabolism | 0.058282 | ME1, PKM2,
ALDH2, PCK1 |
| Hsa00970:
Aminoacyl-tRNA biosynthesis | 0.061901 | TARS, AARS,
EPRS, IARS2 |
| Hsa05416: Viral
myocarditis | 0.072253 | LAMA2, ICAM1,
CAV1, DMD, MYH11 |
| Hsa00350: Tyrosine
metabolism | 0.073368 | GOT2, MAOB,
ADH1B, ADH1A, MIF |
| Hsa00360:
Phenylalanine metabolism | 0.084752 | GOT2, MAOB,
MIF |
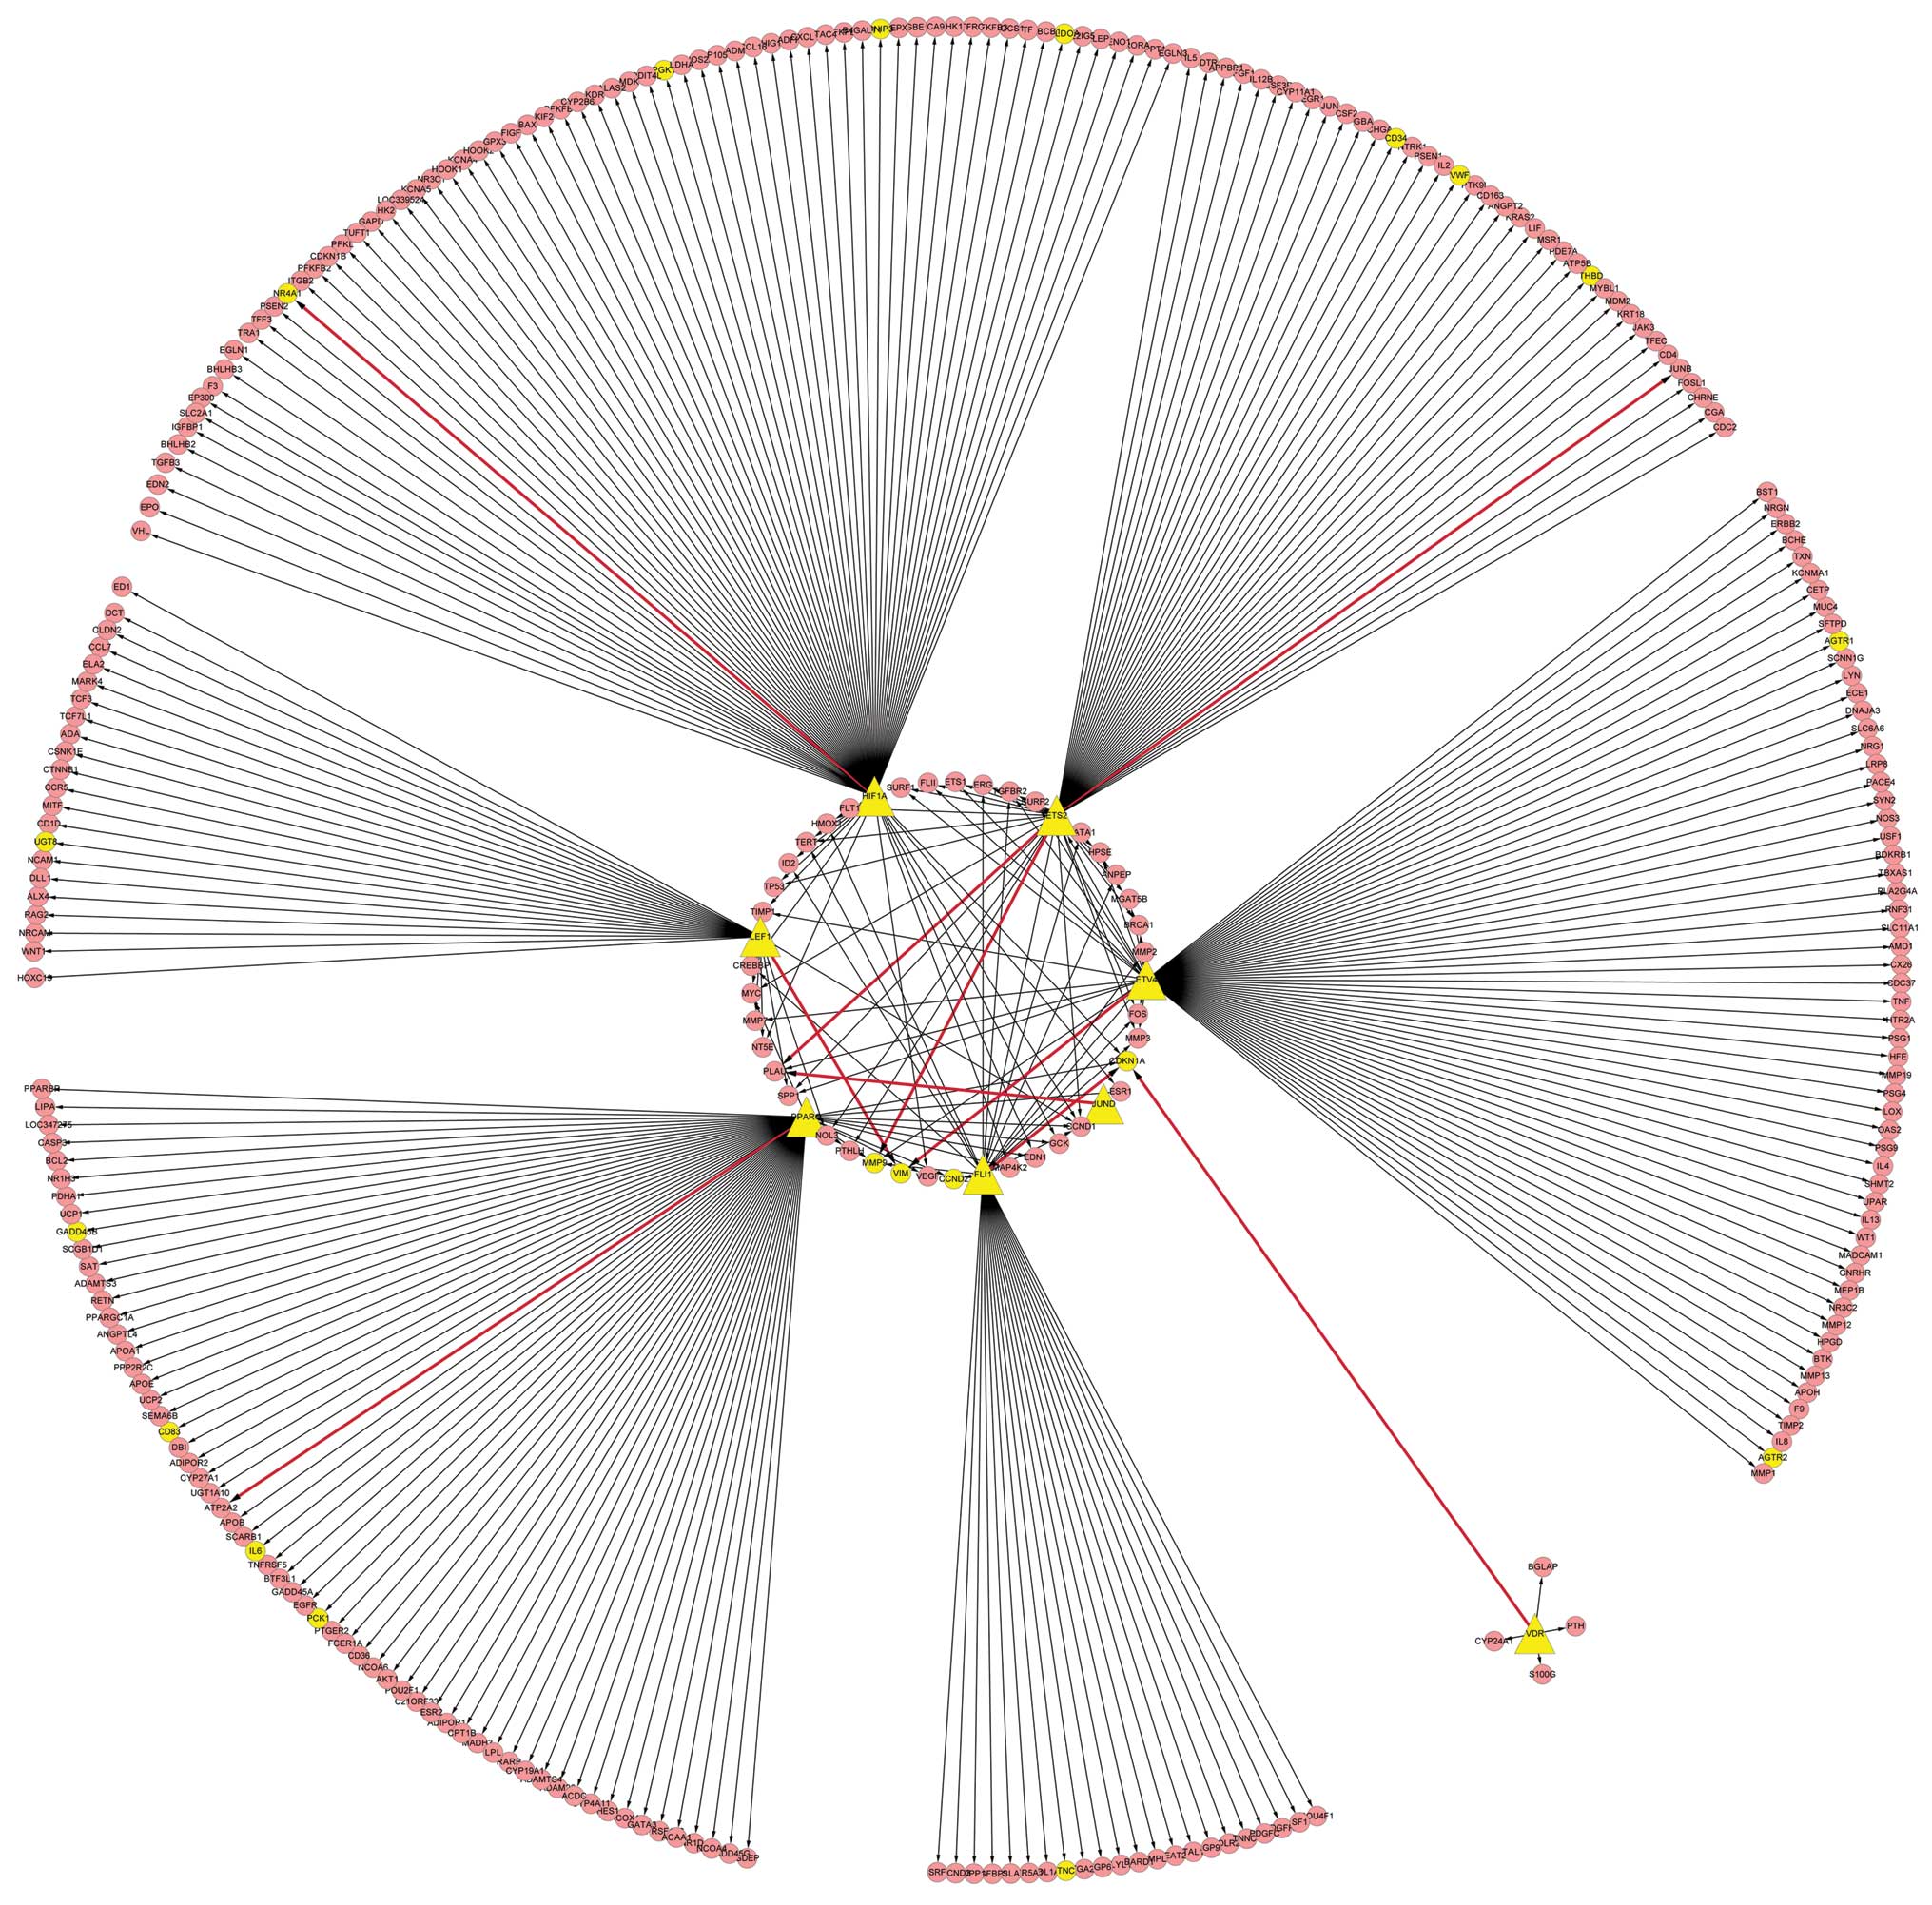
TF regulatory network
All DCLs discovered in the present study were
compared with the TRANSFAC database, and 10 TF-target gene pairs
associated with pulmonary adenocarcinoma were observed, including
eight TFs. The correlation difference (cor. diff.)-value (the sum
of absolute values of the maximum absolute correlation for TF and
target gene) indicated the degree of correlation between the TF and
target gene (Table II). By
mapping eight TFs to the TRANSFAC database again, 366 regulation
associations that were linked with those TFs were obtained. By
processing these associations with Cytoscape software, eight TFs
and 308 target genes were identified in the transcriptional
regulatory network. Furthermore, several TFs and target genes
belonging to DCGs did not appear among the DCLs in the present
study, which indicated that those TFs may be synergistic with other
factors. The results are illustrated in Fig. 2.
| Table IITranscription regulation correlations
in differentially co-expressed links. |
Table II
Transcription regulation correlations
in differentially co-expressed links.
| Transcription
factor | Target gene | Cor. 1 | Cor. 2 | Cor. diff. |
|---|
| FLI1 | CDKN1A | −0.593101612 | 0.701060623 | 1.294162235 |
| ETS2 | PLAU |
7.12×10⁻¹ | −0.513413211 | 1.225511357 |
| HIF1A | NR4A1 | 0.79000137 | −0.432670777 | 1.222672148 |
| PPARG | ATP2A2 | 0.448097377 | −0.721308657 | 1.169406033 |
| LEF1 | VIM | 0.484138641 | −0.605684298 | 1.089822939 |
| ETS2 | JUNB | 0.735807964 | −0.337406532 | 1.073214496 |
| ETV4 | VIM | 0.485632699 | −0.491208815 | 0.976841514 |
| JUND | PLAU |
6.27×10⁻¹ | 0.038142972 | 0.588792142 |
| ETS2 | MMP9 | 0.619596343 | 0.05290016 | 0.566696183 |
| VDR | CDKN1A | 0.497762462 | 0.034328193 | 0.463434268 |
Discussion
The present study investigated gene expression
profiles in patients with lung cancer and healthy controls to
explore the biochemical pathways leading to the deterioration
associated with pulmonary adenocarcinoma at the gene transcription
level using a computational bioinformatics method. Furthermore, the
study identified the most variable genes leading to pulmonary
adenocarcinoma according to the associations between TFs and target
genes. A total of 251 DCGs and 37,094 DCLs were obtained following
DCGL analysis. These 251 DCGs were significantly enriched in 10
pathways. In addition, certain DCGs belonging to TF-target pairs
did not appear among the DCLs. These TF-target gene pairs may have
a synergistic effect with other TFs, which may provide novel
insights for research into pulmonary adenocarcinoma.
In the present study, KEGG PATHWAY analysis was used
to identify the dysregulated pathways in pulmonary adenocarcinoma
samples; 10 pathways, including glycolysis/gluconeogenesis, the
cell cycle and the complement and coagulation cascades, were
highlighted. These pathways were associated with energy conversion,
cell replication and the immune response. The most significant
pathway was glycolysis/gluconeogenesis. Glycolysis involves the
conversion of glucose into pyruvate and the generation of small
amounts of adenosine triphosphate and nicotinamide adenine
dinucleotide, and gluconeogenesis is a pathway leading to the
synthesis of glucose from noncarbohydrate precursors.
Gluconeogenesis is the reverse of glycolysis, but involves minor
variations or alternative paths. A series of DCGs were included in
the glycolysis/gluconeogenesis pathway, including phosphoglycerate
kinase 1 (PGK1). Chen et al (23) suggested that four proteins,
including the protein encoded by PGK1, that are involved in
the glycolysis pathway are overexpressed in pulmonary
adenocarcinoma; this overexpression was suggested to be associated
with low survival rates in patients with pulmonary adenocarcinoma.
A study on breast cancer demonstrated that tumors had abnormal
bioenergetics, and patients with cancer showed a systematic loss of
energy involving the interaction of tumor glycolysis and
gluconeogenesis (24). The results
of the differential co-expression analysis in the present study are
in accordance with previous studies and indicated that the genes in
the glycolysis/gluconeogenesis pathway have an important role in
the development and progression of pulmonary adenocarcinoma.
A transcriptional regulatory network with 308 target
genes and eight TFs was obtained using Cytoscape software. In this
network, 19 target genes and all of the eight TFs [Fli-1
proto-oncogene, ETS transcription factor (FLI1), v-ets
erythroblastosis virus E26 oncogene homolog 2 (ETS2),
hypoxia-inducible factor 1α (HIF1A), peroxisome
proliferator-activated receptor γ (PPARG), lymphoid
enhancer-binding factor 1 (LEF1), ets variant 4 (ETV4), jun D
proto-oncogene (JUND) and vitamin D receptor (VDR)] were DCGs. The
most significant correlation of TF-target gene pairs was
FLI1-cyclin-dependent kinase inhibitor 1A (CDKN1A) with a
cor. diff.-value of 1.294162235. Other significant correlations
included ETS2-urokinase-type plasminogen activator (PLAU)
(cor. diff.-value, 1.225511357) and HIF1A-nuclear receptor
subfamily 4, group A, member 1 (NR4A1) (cor. diff.-value,
1.222672148). Correlations of TF-target genes are listed in
Table II.
FLI1 is a member of the ETS family of TFs
characterized by the presence of the evolutionary conserved
DNA-binding (ETS) domain, which recognizes the purine-rich GGA
(A/T) core sequence (25). Sankar
et al (26) suggested that
the EWS RNA-binding protein 1 gene fuses with FLI1 to
produce the EWS/FLI fusion protein, which is the abnormal TF that
drives tumor development in Ewing sarcoma. CDKN1A is a type
of CDK inhibitor (CKI), and is a cell cycle inhibitor gene
regulated by VDR. The expression or stability of CKIs is reduced in
tumors and leads to organ hyperplasia and increased tumor
susceptibility (27).
CDKN1A plays essential roles in the DNA damage response by
inducing cell cycle arrest and directly inhibiting DNA replication,
as well as by regulating fundamental processes, including apoptosis
and transcription (28). The
deletion of CDKN1A improves stem cell function and increases
the lifespan of mice with dysfunctional telomeres without
accelerating cancer formation (29). To date, genes whose expression has
been reported to be repressed by EWS/FLI include CDKN1A
(30,31).
It was also observed in the present study that
DNA-binding transcription factors have three target genes. The
expression of ETS2 has been shown to be elevated in certain
cancer tissue samples and have a significant role in cancer
progression (32). The genes
regulated by ETS2 are those encoding enzymes that degrade the
extracellular matrix, including stromelysin and collagen (33). The most significant relevant target
gene to ETS2 is PLAU, which is currently used as a
diagnostic marker (34).
PLAU is closely correlated with the expression of a series
of genes in lung cancer cell lines (35). However, in renal cancer cells,
PLAU showed cancer cell-specific methylation that did not
correlate well with expression status (36) and it was not specifically
associated with colon cancer (37). The results of the cotransfection of
the PLAU enhancer-CAT construct in the presence of
increasing amounts of the ETS2-β-galactosidase expression
vector showed that the co-expression of the ETS dominant-negative
protein resulted in the almost complete inhibition of the
PLAU enhancer induction (38). The second relevant gene to ETS2 is
JUNB, which represents an important target in diseases
associated with cancer and fibrosis (39). The expression of JUNB is
inactivated by methylation in chronic myeloid leukemia (40). The third relevant gene to ETS2 is
matrix metalloproteinase-9 (MMP9). The expression of
MMP9 in non-small cell lung cancer contributes to tumor cell
invasiveness (41). ETS can
regulate MMPs, and MMP9 expression was shown to be
suppressed by ETS blockage through overexpression of a
dominant-negative form of ETS1 (42).
HIF1A encodes a pivotal TF that regulates
angiogenesis by inducing the expression of vascular endothelial
growth factor, interleukin-8 and a basic fibroblast growth factor
(43). HIF1A is considered to be
one of the key regulators of tumor angiogenesis. NR4A1 is
the target gene of HIF1A. NR4A1 was demonstrated to reduce
the migration of normal and breast cancer cell lines (44). Results regarding the knockdown or
overexpression of NR4A1 in lung cancer cells suggest that
this receptor exhibits pro-oncogenic activity and enhances cell
survival and/or proliferation (45).
The other TFs examined in the present study showed
less correlation with their target genes, but these also had an
important role in the molecular mechanism of the disease. PPARG is
a member of the PPAR family, which has a pivotal role in
adipogenesis and glucose homeostasis (46). LEF1 mRNA levels are
important statistical metrics in cancer. A study on ovarian,
fallopian tube and peritoneal cancer indicated that LEF1
overexpression may be predictive of poor overall survival (47). Furthermore, ETV4 was
demonstrated to be a useful marker in study on prostate cancer
(48), and JUND and its target
gene PLAU were shown to have an important role in gene
expression in cancer cells (49).
The TF with the least correlation was VDR, which only had five
target genes on the map. This indicates that VDR is an important
site for carcinogenesisP.
In conclusion, a total of 10 pathways were enriched
in pulmonary adenocarcinoma tissue samples, and the most
significant pathway of DCGs in the present study was
glycolysis/gluconeogenesis. Ten TF-target gene pairs that were
associated with pulmonary adenocarcinoma were discovered in the
transcriptional regulatory network. Co-expression analysis of these
TFs and target genes may provide novel ideas for cancer research,
and the results of the present study may provide groundwork
enabling the investigation of the most variable genes leading to
the development and progression of pulmonary adenocarcinoma.
However, further experiments are required to confirm these
observations.
References
|
1
|
Ferlay J, Shin HR, Bray F, Forman D,
Mathers C and Parkin DM: Estimates of worldwide burden of cancer in
2008: GLOBOCAN 2008. Int J Cancer. 127:2893–2917. 2010. View Article : Google Scholar : PubMed/NCBI
|
|
2
|
Jemal A, Center MM, DeSantis C and Ward
EM: Global patterns of cancer incidence and mortality rates and
trends. Cancer Epidemiol Biomarkers Prev. 19:1893–1907. 2010.
View Article : Google Scholar : PubMed/NCBI
|
|
3
|
Mackay J, Eriksen M and Shafey O: The
Tobacco Atlas. 2nd edition. American Cancer Society; Atlanta, GA:
2006
|
|
4
|
Hong WK, Bast RC, Hait WN, Kufe DW,
Pollock RE, Weichselbaum RR, Holland HF and Frei E III: Cancer
Medicine. 8th edition. PMPH; New York, NY: 2010
|
|
5
|
Garber ME, Troyanskaya OG, Schluens K,
Petersen S, Thaesler Z, Pacyna-Gengelbach M, van de Rijn M, Rosen
GD, Perou CM, Whyte RI, et al: Diversity of gene expression in
adenocarcinoma of the lung. Proc Natl Acad Sci USA. 98:13784–13789.
2001. View Article : Google Scholar : PubMed/NCBI
|
|
6
|
Director’s Challenge Consortium for the
Molecular Classification of Lung Adenocarcinoma. Shedden K, Taylor
JM, Enkemann SA, Tsao MS, Yeatman TJ, Gerald WL, Eschrich S,
Jurisica I, Giordano TJ, Misek DE, et al: Gene expression-based
survival prediction in lung adenocarcinoma: a multi-site, blinded
validation study. Nat Med. 2008.14:822–827
|
|
7
|
Stearman RS, Dwyer-Nield L, Zerbe L,
Blaine SA, Chan Z, Bunn PA Jr, Johnson GL, Hirsch FR, Merrick DT,
Franklin WA, et al: Analysis of orthologous gene expression between
human pulmonary adenocarcinoma and a carcinogen-induced murine
model. Am J Pathol. 167:1763–1775. 2005. View Article : Google Scholar : PubMed/NCBI
|
|
8
|
Jiang H, Deng Y, Chen HS, Tao L, Sha Q,
Chen J, Tsai CJ and Zhang S: Joint analysis of two microarray
gene-expression data sets to select lung adenocarcinoma marker
genes. BMC Bioinformatics. 5:812004. View Article : Google Scholar : PubMed/NCBI
|
|
9
|
Ron D, Chen CH, Caldwell J, Jamieson L,
Orr E and Mochly-Rosen D: Cloning of an intracellular receptor for
protein kinase C: a homolog of the beta subunit of G proteins. Proc
Natl Acad Sci USA. 91:839–843. 1994. View Article : Google Scholar : PubMed/NCBI
|
|
10
|
Nagashio R, Sato Y, Matsumoto T, Kageyama
T, Satoh Y, Shinichiro R, Masuda N, Goshima N, Jiang SX and Okayasu
I: Expression of RACK1 is a novel biomarker in pulmonary
adenocarcinomas. Lung Cancer. 69:54–59. 2010. View Article : Google Scholar : PubMed/NCBI
|
|
11
|
Saito RA, Watabe T, Horiguchi K, Kohyama
T, Saitoh M, Nagase T and Miyazono K: Thyroid transcription
factor-1 inhibits transforming growth factor-β-mediated
epithelial-to-mesenchymal transition in lung adenocarcinoma cells.
Cancer Res. 69:2783–2791. 2009.
|
|
12
|
Fang G, Kuang R, Pandey G, Steinbach M,
Myers CL and Kumar V: Subspace differential coexpression analysis:
problem definition and a general approach. Pac Symp Biocomput.
145–156. 2010.PubMed/NCBI
|
|
13
|
Irizarry RA, Hobbs B, Collin F,
Beazer-Barclay YD, Antonellis KJ, Scherf U and Speed TP:
Exploration, normalization, and summaries of high density
oligonucleotide array probe level data. Biostatistics. 4:249–264.
2003. View Article : Google Scholar
|
|
14
|
Diboun I, Wernisch L, Orengo CA and
Koltzenburg M: Microarray analysis after RNA amplification can
detect pronounced differences in gene expression using limma. BMC
Genomics. 7:2522006. View Article : Google Scholar : PubMed/NCBI
|
|
15
|
Lee HK, Hsu AK, Sajdak J, Qin J and
Pavlidis P: Coexpression analysis of human genes across many
microarray data sets. Genome Res. 14:1085–1094. 2004. View Article : Google Scholar : PubMed/NCBI
|
|
16
|
Stuart JM, Segal E, Koller D and Kim SK: A
gene-coexpression network for global discovery of conserved genetic
modules. Science. 302:249–255. 2003. View Article : Google Scholar : PubMed/NCBI
|
|
17
|
Liu BH, Yu H, Tu K, Li C, Li YX and Li YY:
DCGL: an R package for identifying differentially coexpressed genes
and links from gene expression microarray data. Bioinformatics.
26:2637–2638. 2010. View Article : Google Scholar : PubMed/NCBI
|
|
18
|
Yu H, Liu BH, Ye ZQ, Li C, Li YX and Li
YY: Link-based quantitative methods to identify differentially
coexpressed genes and gene pairs. BMC Bioinformatics. 12:3152011.
View Article : Google Scholar : PubMed/NCBI
|
|
19
|
Kanehisa M and Goto S: KEGG: kyoto
encyclopedia of genes and genomes. Nucleic Acids Res. 28:27–30.
2000. View Article : Google Scholar : PubMed/NCBI
|
|
20
|
Huang da W, Sherman BT, Tan Q, Collins JR,
Alvord G, Roayaei J, Stephens R, Baseler MW, Lane HC and Lempicki
RA: The DAVID Gene Functional Classification Tool: a novel
biological module-centric algorithm to functionally analyze large
gene lists. Genome Biol. 8:R1832007.PubMed/NCBI
|
|
21
|
Wingender E, Chen X, Hehl R, Karas H,
Liebich I, Matys V, Meinhardt T, Prüss M, Reuter I and Schacherer
F: TRANSFAC: an integrated system for gene expression regulation.
Nucleic Acids Res. 28:316–319. 2000. View Article : Google Scholar : PubMed/NCBI
|
|
22
|
Smoot ME, Ono K, Ruscheinski J, Wang PL
and Ideker T: Cytoscape 2.8: new features for data integration and
network visualization. Bioinformatics. 27:431–432. 2011. View Article : Google Scholar : PubMed/NCBI
|
|
23
|
Chen G, Gharib TG, Wang H, Huang CC, Kuick
R, Thomas DG, Shedden KA, Misek DE, Taylor JM, Giordano TJ, et al:
Protein profiles associated with survival in lung adenocarcinoma.
Proc Natl Acad Sci USA. 100:13537–13542. 2003. View Article : Google Scholar : PubMed/NCBI
|
|
24
|
Perumal SS, Shanthi P and Sachdanandam P:
Therapeutic effect of tamoxifen and energy-modulating vitamins on
carbohydrate-metabolizing enzymes in breast cancer. Cancer
Chemother Pharmacol. 56:105–114. 2005. View Article : Google Scholar : PubMed/NCBI
|
|
25
|
Oikawa T and Yamada T: Molecular biology
of the Ets family of transcription factors. Gene. 303:11–34. 2003.
View Article : Google Scholar : PubMed/NCBI
|
|
26
|
Sankar S, Gomez NC, Bell R, Patel M, Davis
IJ, Lessnick SL and Luo W: EWS and RE1-silencing transcription
factor inhibit neuronal phenotype development and oncogenic
transformation in Ewing sarcoma. Genes Cancer. 4:213–223. 2013.
View Article : Google Scholar
|
|
27
|
Lüdtke TH, Farin HF, Rudat C,
Schuster-Gossler K, Petry M, Barnett P, Christoffels VM and Kispert
A: Tbx2 controls lung growth by direct repression of the cell cycle
inhibitor genes Cdkn1a and Cdkn1b. PLoS Genet.
9:e10031892013.PubMed/NCBI
|
|
28
|
Cazzalini O, Scovassi AI, Savio M, Stivala
LA and Prosperi E: Multiple roles of the cell cycle inhibitor
p21(CDKN1A) in the DNA damage response. Mutat Res. 704:12–20. 2010.
View Article : Google Scholar : PubMed/NCBI
|
|
29
|
Choudhury AR, Ju Z, Djojosubroto MW,
Schienke A, Lechel A, Schaetzlein S, Jiang H, Stepczynska A, Wang
C, Buer J, et al: Cdkn1a deletion improves stem cell function and
lifespan of mice with dysfunctional telomeres without accelerating
cancer formation. Nat Genet. 39:99–105. 2007. View Article : Google Scholar : PubMed/NCBI
|
|
30
|
Schwentner R: Molecular mechanisms of
transcriptional repression by the EWS-FLI1 oncogene in Ewing’s
sarcoma. PhD dissertation. University of Vienna. Publication no.
AC07884381. 2008
|
|
31
|
Riggi N, Cironi L, Provero P, Suvà ML,
Kaloulis K, Garcia-Echeverria C, Hoffmann F, Trumpp A and
Stamenkovic I: Development of Ewing’s sarcoma from primary bone
marrow-derived mesenchymal progenitor cells. Cancer Res.
65:11459–11468. 2005.
|
|
32
|
Liu AY, Corey E, Vessella RL, Lange PH,
True LD, Huang GM, Nelson PS and Hood L: Identification of
differentially expressed prostate genes: increased expression of
transcription factor ETS-2 in prostate cancer. Prostate.
30:145–153. 1997. View Article : Google Scholar : PubMed/NCBI
|
|
33
|
Butticé G and Kurkinen M: Oncogenes
control stromelysin and collagenase gene expression. Contrib
Nephrol. 107:101–107. 1994.PubMed/NCBI
|
|
34
|
Sudol M: From Rous sarcoma virus to
plasminogen activator, src oncogene and cancer management.
Oncogene. 30:3003–3010. 2011. View Article : Google Scholar : PubMed/NCBI
|
|
35
|
Watanabe T, Miura T, Degawa Y, Fujita Y,
Inoue M, Kawaguchi M and Furihata C: Comparison of lung cancer cell
lines representing four histopathological subtypes with gene
expression profiling using quantitative real-time PCR. Cancer Cell
Int. 10:22010. View Article : Google Scholar : PubMed/NCBI
|
|
36
|
Ibanez de Caceres I, Dulaimi E, Hoffman
AM, Al-Saleem T, Uzzo RG and Cairns P: Identification of novel
target genes by an epigenetic reactivation screen of renal cancer.
Cancer Res. 66:5021–5028. 2006.PubMed/NCBI
|
|
37
|
Maness L, Goktepe I, Chen H, Ahmedna M and
Sang S: Impact of Phytolacca americana extracts on gene
expression of colon cancer cells. Phytother Res. Apr 4–2013.(Epub
ahead of print). View
Article : Google Scholar
|
|
38
|
Cirillo G, Casalino L, Vallone D,
Caracciolo A, De Cesare D and Verde P: Role of distinct
mitogen-activated protein kinase pathways and cooperation between
Ets-2, ATF-2, and Jun family members in human urokinase-type
plasminogen activator gene induction by interleukin-1 and
tetradecanoyl phorbol acetate. Mol Cell Biol. 19:6240–6252.
1999.
|
|
39
|
Gervasi M, Bianchi-Smiraglia A, Cummings
M, Zheng Q, Wang D, Liu S and Bakin AV: JunB contributes to Id2
repression and the epithelial-mesenchymal transition in response to
transforming growth factor-β. J Cell Biol. 196:589–603.
2012.PubMed/NCBI
|
|
40
|
Yang MY, Liu TC, Chang JG, Lin PM and Lin
SF: JunB gene expression is inactivated by methylation in chronic
myeloid leukemia. Blood. 101:3205–3211. 2003. View Article : Google Scholar : PubMed/NCBI
|
|
41
|
Liu PL, Tsai JR, Hwang JJ, Chou SH, Cheng
YJ, Lin FY, Chen YL, Hung CY, Chen WC, Chen YH and Chong IW:
High-mobility group box 1-mediated matrix metalloproteinase-9
expression in non-small cell lung cancer contributes to tumor cell
invasiveness. Am J Resp Cell Mol Biol. 43:530–538. 2010. View Article : Google Scholar : PubMed/NCBI
|
|
42
|
Sahin A, Vercamer C, Kaminski A, Fuchs T,
Florin A, Hahne JC, Mattot V, Pourtier-Manzanedo A, Pietsch T,
Fafeur V and Wernert N: Dominant-negative inhibition of Ets 1
suppresses tumor growth, invasion and migration in rat C6 glioma
cells and reveals differentially expressed Ets 1 target genes. Int
J Oncol. 34:3772009.
|
|
43
|
Cha ST, Chen PS, Johansson G, Chu CY, Wang
MY, Jeng YM, Yu SL, Chen JS, Chang KJ, Jee SH, et al: MicroRNA-519c
suppresses hypoxia-inducible factor-1 alpha expression and tumor
angiogenesis. Cancer Res. 70:2675–2685. 2010. View Article : Google Scholar : PubMed/NCBI
|
|
44
|
Alexopoulou AN, Leao M, Caballero OL, Da
Silva L, Reid L, Lakhani SR, Simpson AJ, Marshall JF, Neville AM
and Jat PS: Dissecting the transcriptional networks underlying
breast cancer: NR4A1 reduces the migration of normal and breast
cancer cell lines. Breast Cancer Res. 12:R512010. View Article : Google Scholar : PubMed/NCBI
|
|
45
|
Lee SO, Li X, Khan S and Safe S: Targeting
NR4A1 (TR3) in cancer cells and tumors. Expert Opin Ther Targets.
15:195–206. 2011. View Article : Google Scholar : PubMed/NCBI
|
|
46
|
Robbins GT and Nie D: PPARgamma, bioactive
lipids, and cancer progression. Front Biosci (Landmark Ed).
17:1816–1834. 2012. View
Article : Google Scholar : PubMed/NCBI
|
|
47
|
Clements A, Engle D, Shelton D, Neff T,
Park S, Bender D, Ahmed A, De Geest K, Button A, Engelhardt JF and
Goodheart M: Lymphoid Enhancing Factor 1 (Lef-1) overexpression in
epithelial ovarian, fallopian tube and peritoneal cancer and
associations with clinical factors. Proc Obstet Gynecol. 2:1–2.
2011.
|
|
48
|
Tomlins SA, Mehra R, Rhodes DR, Smith LR,
Roulston D, Helgeson BE, Cao X, Wei JT, Rubin MA, Shah RB and
Chinnaiyan AM: TMPRSS2: ETV4 gene fusions define a third molecular
subtype of prostate cancer. Cancer Res. 66:3396–3400. 2006.
View Article : Google Scholar : PubMed/NCBI
|
|
49
|
Darnell JE Jr: Transcription factors as
targets for cancer therapy. Nat Rev Cancer. 2:740–749. 2002.
View Article : Google Scholar : PubMed/NCBI
|