Gene expression profiles of patients with cerebral hematoma following spontaneous intracerebral hemorrhage
- Authors:
- Published online on: July 25, 2014 https://doi.org/10.3892/mmr.2014.2421
- Pages: 1671-1678
-
Copyright: © Yang et al. This is an open access article distributed under the terms of Creative Commons Attribution License [CC BY_NC 3.0].
Abstract
Introduction
Spontaneous intracerebral hemorrhage (ICH) involves the extravasation of blood within the brain parenchyma in the absence of trauma or surgery, accounting for 10–30% of all strokes worldwide (1). ICH is a complex, dynamic process that consists of three distinct phases (2): i) Initial hemorrhage, retraction of the clot begins in the first few hours following ICH. ii) Hematoma expansion, hematoma expansion occurs 24 or 48 h following the initial onset of symptoms, which involves a sudden increase in intracranial pressure, disrupting the integrity of the local tissue and blood-brain barrier. In addition, obstructed venous outflow promotes the activation of tissue thromboplastin, resulting in local coagulopathy. (iii) Perihematoma (PH) edema, PH cerebral edema develops within the first few days following ICH as a result of an inflammatory response [activation of cellular (leukocytes, macrophages and microglia) and molecular (cytokines, proteases and reactive oxygen species) components] (3) secondary to local release of thrombin and other end products of coagulation from the hematoma, and also due to cytotoxic mediators (hemoglobin and its degradation products, heme and iron) that are released from red blood cells (4–6).
The hematoma expansion rate and PH edema volume are key factors to predict neurological deterioration and survival. Hematoma volume >30 ml is associated with increased mortality (7). When the hemorrhagic volume exceeds 150 ml, cerebral perfusion pressure falls to zero, which subsequently leads to patient mortality (8). Therefore, prevention of hematoma expansion is a logical therapeutic target (9). Additionally, it is possible that anti-inflammatory and anti-apoptotic drugs may have the therapeutic potential to ameliorate secondary brain injury following ICH. For example, sesamin confers neuroprotection in rat ICH by suppressing activation of microglia and the p44/42 MAPK pathway (10). Ginkgolide B was able to significantly suppress the gene expression of Toll-like receptor 4 and nuclear factor-κB, reduce the concentrations of tumor necrosis factor-α, interleukin (IL)-1β and IL-6 as well as reduce the number of apoptotic neuronal cells in hemorrhagic rat brain tissues (11).
Recently, Carmichael et al (12) attempted to investigate the gene expression pattern in PH tissues of ICH rat models in a microarray study, which simultaneously measured transcript abundances of thousands of genes in a cell population or tissue. The results indicated a robust upregulation of pro-/anti-inflammatory networks and a downregulation of neuronal signaling pathways (12). Furthermore, Rosell et al (13) investigated the genomic profile following spontaneous human ICH and suggested that the significantly overexpressed genes in the PH areas encoded for cytokines, chemokines, coagulation, cell growth and proliferation factors, while the downregulated genes encoded proteins involved in the cell cycle or neurotrophins. Therefore, the identified genes may be potential targets for ICH therapy.
The present study aimed to further identify the differentially expressed genes (DEGs) between PH and contralateral healthy tissues [grey (CG) matter and white (CW) matter] using a different statistical approach and threshold. Further interaction network and function analyses were also performed for these DEGs. It is expected that these data may further elucidate the processes and mechanisms of death caused by hematoma following spontaneous ICH.
Materials and methods
Microarray data
The gene expression profiles were downloaded from the Gene Expression Omnibus under accession number GSE24265 (13), which includes 11 brain samples from different regions of four deceased patients who had suffered from a supratentorial ICH within four days prior to mortality. Of these samples, four were from PH tissues, four from CG and three from CW. The study group included two female and two male subjects with a median age of 79 years (range, 68–92 years). The samples from PH, CG and CW tissue were obtained within the first 5 h following mortality, snap frozen in liquid nitrogen and stored at −80°C until RNA isolation. The original studies by Rosell et al (13) was approved by the Ethics Committee of the Vall d’Hebron Hospital (Barcelona, Spain) and informed and written consent was acquired from all of the patients or patient’s relatives. Demographic and tissue sampling data are presented in Table I. The array platform was GPL570 [Human Genome U133 Plus 2.0 Array (Affymetrix Inc., Santa Clara, CA, USA)]. The array annotation information was from Affymatrix, including the information for all probes on Affymetrix ATH1 (25K; (Affymetrix Inc.).
Data pre-processing and identifying DEGs
Firstly, the raw data were transformed into a readable expression profile format and then the missing data were imputed according to Troyanskaya’s method (14) followed by normalization (15). DEGs between PH and CG, and PH and CW were identified using the limma package in R (16). Benjamini-Hochberg (BH) multiple test correction was then used to adjust the P-values (17). Only the genes with a false discovery rate (FDR) <0.05 and |logFC(fold change)| >1 were selected as DEGs.
Tissue specific DEGs
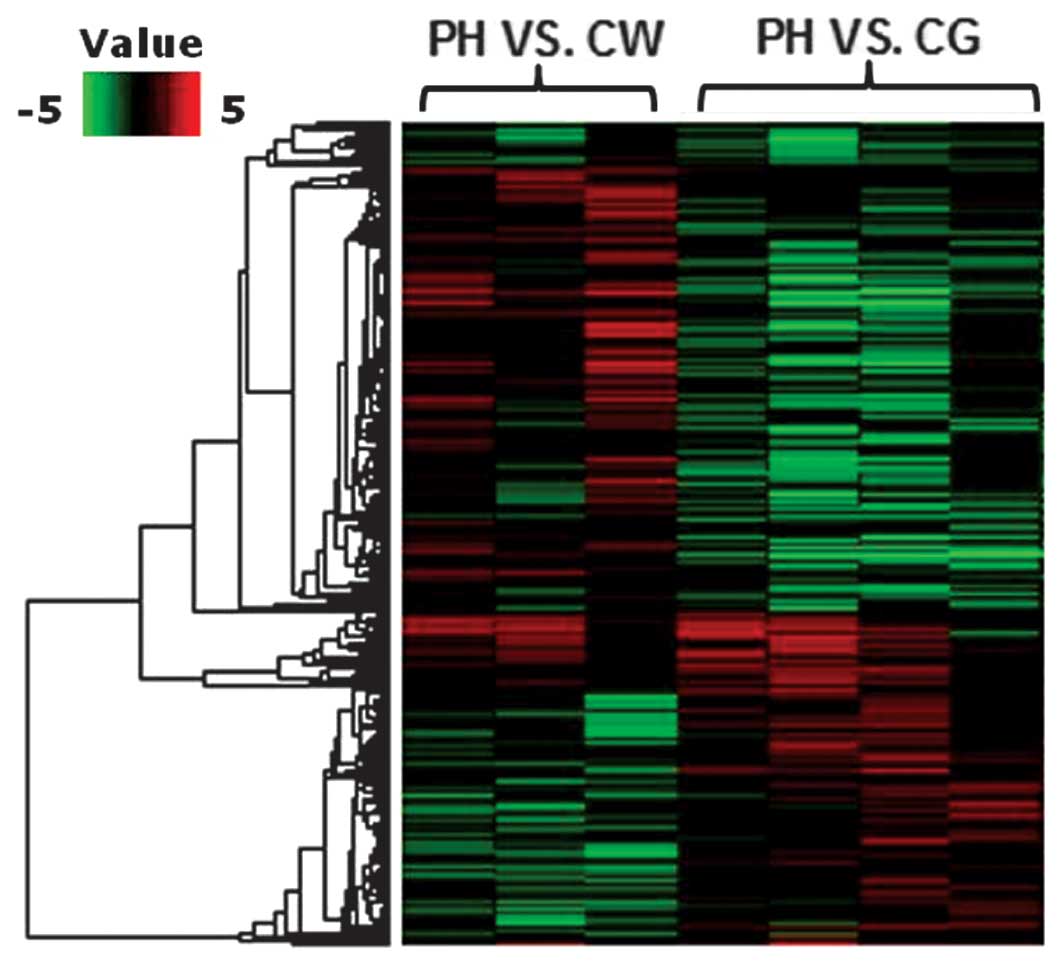
The expression of genes is time- and space-specific, and in different tissues may be significantly different. The genes were clustered based on their expression in two groups using Cluster analysis (18). The expression differences in the various tissues were visualized by heatmap (Clifton Watt, Stanford University, USA).
Construction of the interaction network
Numerous activities in the body, including important physiological activities and responses to the external or internal environment, are performed by the binding and dissociation of proteins. All of these activities are conducted by signaling transduction networks consisting of protein-protein interactions (19). Therefore, detailed investigations into protein interaction networks is essential for the understanding of bodily systems (20). Based on the sequence and structure information of DEGs, their interaction possibility was predicted according to the String database (http://string.embl.de/) that quantitatively integrates interaction data from four sources [genomic context, high-throughput experiments, (conserved) co-expression and previous knowledge] for a large number of organisms, and transfers information between these organisms where applicable (21). Furthermore, the interaction network was also constructed for the two groups; PH vs. CG and PH vs. CW.
Functional enrichment of DEGs in interaction networks
The annotation was performed for the genes in protein interaction networks. FuncAssociate (http://llama.med.harvard.edu/funcassociate) is a web application that identifies properties enriched in lists of genes or proteins that emerge from large-scale experimentation (22). The interactive DEGs were screened and functional enrichment analysis was performed using FuncAssociate (22). FDR<0.05 was set as the threshold for this analysis using the hypergeometric distribution.
Pathway analysis of DEGs in interaction networks
Expression Analysis Systematic Explorer (EASE, http://david.niaid.nih.gov/david/ease.htm) is a customizable, standalone software application that facilitates the biological interpretation of gene lists derived from the results of microarray, proteomic and Serial Analysis of Gene Expression studies (23). EASE queries the Kyoto Encyclopedia of Genes and Genomes pathways database (http://www.genome.ad.jp/kegg/) and determines functional enrichment by calculating a Fisher’s exact test P-value for each pathway. P≤0.05 was considered to indicate as significant gene-enrichment in a specific annotation category.
Results
Screening of DEGs
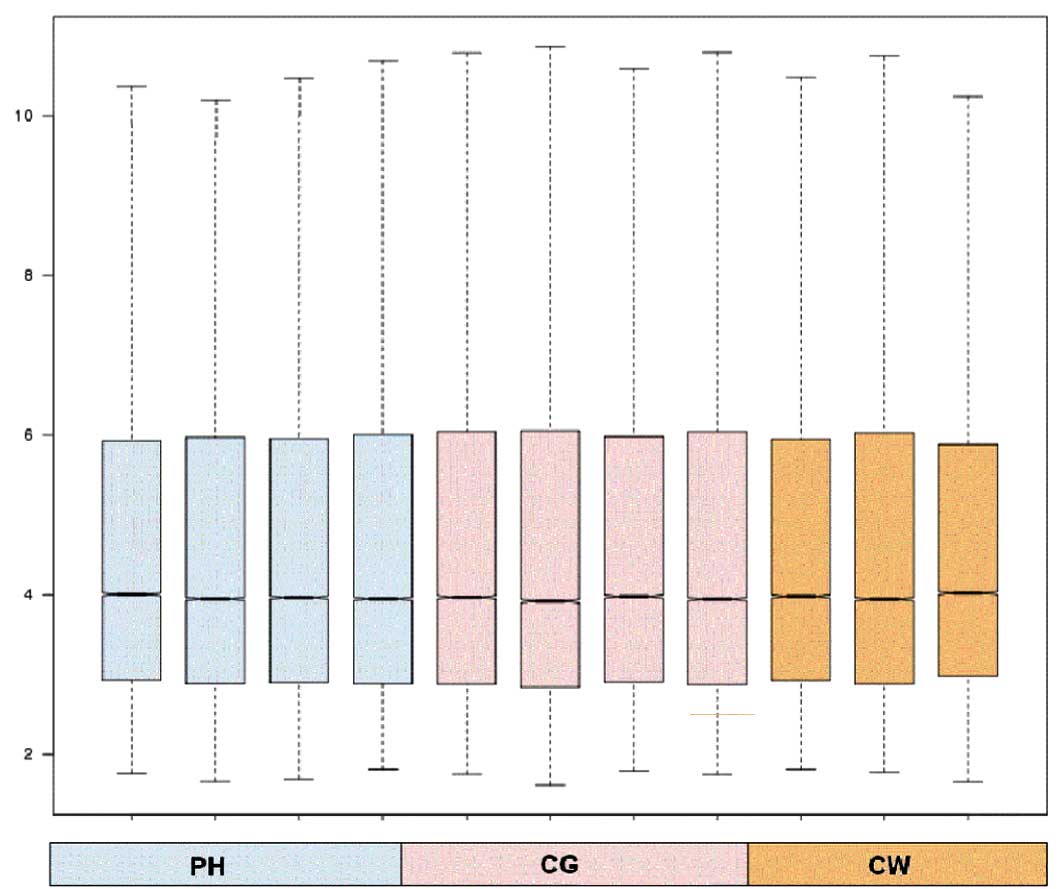
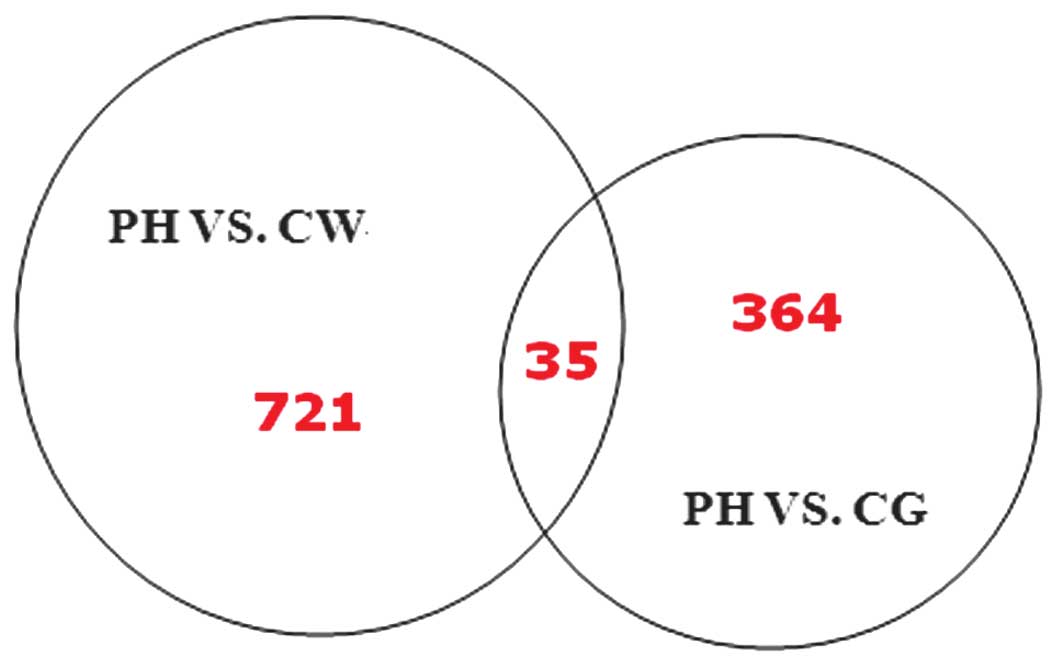
Following data pre-processing, the gene expression profile data with higher normalization (Fig. 1) were selected for DEG analysis. The DEGs were analyzed using the R language limma package and BH multiple test correction. As a result, 399 DEGs were obtained between PH and CG, and 756 DEGs between PH and CW according to the threshold of FDR<0.05 and |logFC|>1, indicating spatial specificity of the gene expression (Fig. 2). Furthermore, there were 35 common DEGs between the two groups (Fig. 3). Among the common DEGs, the expression change tendency for a number of the genes was similar [sphingosine kinase-1 (SPHK1) was downregulated in PH samples compared with CG and CW]), but for a number was opposite [ephrin-A5 (EFNA5) and HTR2A were significantly upregulated in PH samples compared with CG but downregulated compared with CW].
Co-expression network
The co-expression network for the DEGs between the PH vs. CG and PH vs. CW groups were constructed utilizing String (Fig. 4). The results screened several interactive pairs, including inositol 1,4,5-trisphosphate receptor, type 1 (ITPR1)-ryanodine receptor 2 (RYR2) and Ca2+/calmodulin-dependent protein kinase II α (CAMK2A)-MAPK1 in the PH vs. CG group, and integrin α5 (ITGA5)-laminin B1 (LAMB1) in the PH vs. CW group.
Enriched Gene Ontology (GO) terms of genes in the co-expression network
The DEGs in the co-expression network were enriched into GO terms using FuncAssociate. The results indicated that the GO terms enriched by the two groups were different (Table II). Compared with CG, DEGs for PH were significantly enriched in calcium ion transport (GO:0006816), ion transport (GO:0006811) and synaptic transmission (GO:0007268). Whereas compared with CW, the DEGs of PH were significantly associated with blood vessel development (GO:0001568), vasculature development (GO:0001944) and regulation of cell proliferation (GO:0042127).
Pathway enriched by DEGs in network
Pathway analysis for DEGs of the two groups was also performed using EASE. As demonstrated in Table III, the four pathways were identified to be significantly correlated with PH when compared with CG, including the Ca2+ signaling pathway (hsa04020), which was consistent with the GO enrichment analysis (Table II). A number of genes were shared by enriched GO terms and pathways, including SLC8A2, calcium channel, voltage-dependent, T-type, α1I subunit (CACNA1I), ITPR1, PRKCB, RYR2, CACNA1E, PPP3CA and CAMK2A. Six pathways were enriched for DEGs between PH and CW, among which extracellular matrix (ECM)-receptor interaction (hsa04512) was the most significant pathway. ECM-receptor interaction is most commonly associated with cell proliferation and apoptosis. Therefore, the pathway analysis results of the DEGs in PH vs. CW group were also in accordance with the GO pathway [the common genes were collagen type 1, α2 (COL1A2), LAMB1 and ACTN1].
Discussion
The present study identified >350 genes that were significantly differentially expressed following ICH in PH regions compared with contralateral healthy tissues (grey matter and white matter) in human samples according to the threshold of FDR<0.05 and |logFC|>1. The majority of DEGs were further revealed to be involved in the networks and pathways correlated with the calcium signaling pathway, cell proliferation, regulation of apoptosis, neuron differentiation or ECM-receptor interaction.
As brain metabolism is almost entirely dependent on the oxidation of glucose delivered by the blood, obstructed blood flow during ICH may cause a rapid decline in tissue metabolism that culminates in neuronal cell death. Although multiple factors are involved, disturbances in neuronal ionic homeostasis may be fundamental for neuronal cell swelling and death (24). Dissipation of ionic gradients causes neuronal depolarization and the release of neurotransmitters from intracellular stores, including glutamate. Glutamate provokes further depolarization due to activation of the α-amino-3-hydroxy-5-methyl-4-isoxazolepropionic acid and N-methyl-D-aspartate glutamate receptors, as well as voltage-gated Ca2+ channels, thus triggering Ca2+ influx and release from extracellular spaces. In addition, Ca2+ is mobilized within the cell from intracellular Ca2+ stores through two types of Ca2+ release channels: Ryanodine receptors (RyRs) and inositol 1,4,5-trisphosphate receptors (IP3Rs) (25,26). Such Ca2+ accumulation and excitation contributes to the generation of reactive oxygen and nitrogen species, and the release of apoptotic factors, ultimately causing cell death through excitotoxicity (27). As expected, the present results implied that CACNA1I, CAMK2A, RYR2 and ITPR1 were significantly upregulated in PH areas. There is also evidence that intracellular Ca2+ release channels may cooperate, leading to positive feedback during activation (28). Agonist-dependent activation of IP3Rs may promote activation of RyRs, amplifying and shaping the resulting Ca2+-signal (28). The ITPR type 2 channel activity is modulated by Ca2+/CaMKII-mediated phosphorylation of serine 150 of the IP3R2 (29). As expected, the present study also found an interaction between RYR2 and ITPR1 (Fig. 4).
Consistently several genes that regulate neuronal cell proliferation were downregulated but the pro-apoptotic genes were upregulated in the PH area. For example, SPHK1 is an enzyme that catalyzes the phosphorylation of sphingosine to form sphingosine-1-phosphate (S1P). S1P regulates diverse biological processes including proliferation and survival following binding to S1P receptor-1 to 5 (S1P1 to S1P5) (30,31). Furthermore, translational investigations suggest a profound impact of S1P administration in the modulation of edema formation in disease state in which increased vascular permeability is a hallmark feature (32). Isoflurane delays the development of early brain injury following subarachnoid hemorrhage through upregulating SPHK1 expression (33).
EFNA5 is reported to be upregulated in reactive astrocytes following stroke, which limits axonal sprouting from cortical neurons and motor recovery. Blockade of EFNA5 signaling using a unique tissue delivery system induces the formation of a novel pattern of axonal projections in motor, premotor and prefrontal circuits, and mediates neuronal recovery (34). As expected, EFNA5 was also upregulated in PH regions compared with normal CG, but it was downregulated compared with CW (conveys axons), indicating the ephrin/Eph A expression gradients in the central nervous system (35).
PH edema is directly toxic to neurons as it disrupts the blood-brain barrier (36). The blood-brain barrier primarily consists of endothelial cells with specialized tight junctions lining the blood vessels, astrocytic end-feet surrounding the blood vessels, and pericytes embedded in the basement membranes between the endothelial cells and the astrocytes. This dynamic structure is highly regulated by interactions between its cellular and ECM components (including collagen, laminin, fibronectin, hyaluronan and proteoglycan) along with integrin receptors (37,38). In the present study, the ECM-receptor interaction pathway was also identified and different ECM fibrous proteins [COL1A2, LAMB1, syndecan 2 and fibronectin 1] and integrins (ITGA5) were downregulated.
In conclusion, the present study provides several potential targets to decrease hematoma expansion and alleviate neuronal cell death following spontaneous intracerebral hemorrhage. However, further studies are required to validate this evidence and determine its clinical utility.
Acknowledgements
The present study was supported by a grant from the National Natural Science Foundation of China (grant no. 81071037).
References
Aguilar MI and Freeman WD: Spontaneous intracerebral hemorrhage. Semin Neurol. 30:555–564. 2010. View Article : Google Scholar | |
Thiex R and Tsirka SE: Brain edema after intracerebral hemorrhage: mechanisms, treatment options, management strategies, and operative indications. Neurosurg Focus. 22:E62007. View Article : Google Scholar | |
Wang J and Doré S: Inflammation after intracerebral hemorrhage. J Cereb Blood Flow Metab. 27:894–908. 2006. | |
Hua Y, Keep RF, Hoff JT and Xi G: Brain injury after intracerebral hemorrhage: the role of thrombin and iron. Stroke. 38(Suppl): 759–762. 2007. View Article : Google Scholar : PubMed/NCBI | |
Xi G, Keep RF and Hoff JT: Mechanisms of brain injury after intracerebral haemorrhage. Lancet Neurol. 5:53–63. 2006. View Article : Google Scholar : PubMed/NCBI | |
Aronowski J and Zhao X: Molecular pathophysiology of cerebral hemorrhage: secondary brain injury. Stroke. 42:1781–1786. 2011. View Article : Google Scholar : PubMed/NCBI | |
Tuhrim S, Horowitz DR, Sacher M and Godbold JH: Validation and comparison of models predicting survival following intracerebral hemorrhage. Crit Care Med. 23:950–954. 1995. View Article : Google Scholar : PubMed/NCBI | |
Xi G and Hoff J: The pathophysiology of hemorrhagic lesions. Imaging of the Nervous System: Diagnosis and Therapeutic Applications. Latchaw R, Kucharczyk J and Moseley ME: 1 and 2. Elsevier Mosby; Philadelphia: pp. 519–534. 2005 | |
Brown DL and Morgenstern LB: Stopping the bleeding in intracerebral hemorrhage. N Engl J Med. 352:828–830. 2005. View Article : Google Scholar : PubMed/NCBI | |
Ohnishi M, Monda A, Takemoto R, et al: Sesamin suppresses activation of microglia and p44/42 MAPK pathway, which confers neuroprotection in rat intracerebral hemorrhage. Neuroscience. 232C:45–52. 2012. | |
Hu YY, Huang M, Dong XQ, Xu QP, Yu WH and Zhang ZY: Ginkgolide B reduces neuronal cell apoptosis in the hemorrhagic rat brain: Possible involvement of Toll-like receptor 4/nuclear factor-kappa B pathway. J Ethnopharmacol. 137:1462–1468. 2011. View Article : Google Scholar : PubMed/NCBI | |
Carmichael ST, Vespa PM, Saver JL, et al: Genomic profiles of damage and protection in human intracerebral hemorrhage. J Cereb Blood Flow Metab. 28:1860–1875. 2008. View Article : Google Scholar : PubMed/NCBI | |
Rosell A, Vilalta A, García-Berrocoso T, et al: Brain perihematoma genomic profile following spontaneous human intracerebral hemorrhage. PLoS One. 6:e167502011. View Article : Google Scholar | |
Troyanskaya O, Cantor M, Sherlock G, et al: Missing value estimation methods for DNA microarrays. Bioinformatics. 17:520–525. 2001. View Article : Google Scholar : PubMed/NCBI | |
Fujita A, Sato JR, de Rodrigues LO, Ferreira CE and Sogayar MC: Evaluating different methods of microarray data normalization. BMC Bioinformatics. 7:4692006. View Article : Google Scholar : PubMed/NCBI | |
Wettenhall JM and Smyth GK: limmaGUI: a graphical user interface for linear modeling of microarray data. Bioinformatics. 20:3705–3706. 2004. View Article : Google Scholar : PubMed/NCBI | |
Benjamini Y and Hochberg Y: Controlling the false discovery rate: a practical and powerful approach to multiple testing. J R Stat Soc. 57:289–300. 1995. | |
Liu CL, Prapong W, Natkunam Y, et al: Software tools for high-throughput analysis and archiving of immunohistochemistry staining data obtained with tissue microarrays. Am J Pathol. 161:1557–1565. 2002. View Article : Google Scholar | |
Giot L, Bader JS, Brouwer C, et al: A protein interaction map of Drosophila melanogaster. Science. 302:1727–1736. 2003. View Article : Google Scholar : PubMed/NCBI | |
Li S, Armstrong CM, Bertin N, et al: A map of the interactome network of the metazoan C. elegans. Science. 303:540–543. 2004. View Article : Google Scholar : PubMed/NCBI | |
Szklarczyk D, Franceschini A, Kuhn M, et al: The STRING database in 2011: functional interaction networks of proteins, globally integrated and scored. Nucleic Acids Res. 39:D561–D568. 2011. View Article : Google Scholar : PubMed/NCBI | |
Berriz GF, Beaver JE, Cenik C, Tasan M and Roth FP: Next generation software for functional trend analysis. Bioinformatics. 25:3043–3044. 2009. View Article : Google Scholar : PubMed/NCBI | |
Hosack DA, Dennis G Jr, Sherman BT, Lane HC and Lempicki RA: Identifying biological themes within lists of genes with EASE. Genome Biol. 4:R702003. View Article : Google Scholar : PubMed/NCBI | |
Kahle KT, Simard JM, Staley KJ, Nahed BV, Jones PS and Sun D: Molecular mechanisms of ischemic cerebral edema: role of electroneutral ion transport. Physiology (Bethesda). 24:257–265. 2009. View Article : Google Scholar : PubMed/NCBI | |
Bodalia A, Li H and Jackson MF: Loss of endoplasmic reticulum Ca2+homeostasis: contribution to neuronal cell death during cerebral ischemia. Acta Pharmacol Sin. 34:49–59. 2013. | |
Kakizawa S, Yamazawa T, Chen Y, et al: Nitric oxide-induced calcium release via ryanodine receptors regulates neuronal function. EMBO J. 31:417–428. 2012. View Article : Google Scholar : PubMed/NCBI | |
Liao Y, Kristiansen A-M, Oksvold CP, et al: Neuronal Ca2+-activated K+ channels limit brain infarction and promote survival. PLoS One. 5:e156012010.PubMed/NCBI | |
McGeown JG: Interactions between inositol 1, 4, 5-trisphosphate receptors and ryanodine receptors in smooth muscle: one store or two? Cell Calcium. 35:613–619. 2004. View Article : Google Scholar : PubMed/NCBI | |
Maxwell JT, Natesan S and Mignery GA: Modulation of inositol 1, 4, 5-trisphosphate receptor type-2 channel activity by Ca2+/calmodulin-dependent protein kinase II (CaMKII)-mediated phosphorylation. J Biol Chem. 287:39419–39428. 2012. View Article : Google Scholar : PubMed/NCBI | |
Dev KK, Mullershausen F, Mattes H, et al: Brain sphingosine-1-phosphate receptors: implication for FTY720 in the treatment of multiple sclerosis. Pharmacol Ther. 117:77–93. 2008. View Article : Google Scholar : PubMed/NCBI | |
Pébay A, Toutant M, Prémont J, et al: Sphingosine-1-phosphate induces proliferation of astrocytes: regulation by intracellular signalling cascades. Eur J Neurosci. 13:2067–2076. 2001.PubMed/NCBI | |
McVerry BJ and Garcia JG: In vitro and in vivo modulation of vascular barrier integrity by sphingosine 1-phosphate: mechanistic insights. Cell Signal. 17:131–139. 2005. View Article : Google Scholar : PubMed/NCBI | |
Altay O, Hasegawa Y, Sherchan P, et al: Isoflurane delays the development of early brain injury after subarachnoid hemorrhage through sphingosine-related pathway activation in mice. Crit Care Med. 40:1908–1913. 2012. View Article : Google Scholar | |
Overman JJ, Clarkson AN, Wanner IB, et al: A role for ephrin-A5 in axonal sprouting, recovery, and activity-dependent plasticity after stroke. Proc Natl Acad Sci USA. 109:E2230–E2239. 2012. View Article : Google Scholar : PubMed/NCBI | |
Sobel RA: Ephrin A receptors and ligands in lesions and normal-appearing white matter in multiple sclerosis. Brain Pathol. 15:35–45. 2005. View Article : Google Scholar : PubMed/NCBI | |
Bodmer D, Vaughan KA, Zacharia BE, Hickman ZL and Connolly ES: The molecular mechanisms that promote edema after intracerebral hemorrhage. Transl Stroke Res. 3(Suppl 1): 52–61. 2012. View Article : Google Scholar : PubMed/NCBI | |
Baeten KM and Akassoglou K: Extracellular matrix and matrix receptors in blood-brain barrier formation and stroke. Dev Neurobiol. 71:1018–1039. 2011. View Article : Google Scholar : PubMed/NCBI | |
Abbott NJ, Patabendige AA, Dolman DE, Yusof SR and Begley DJ: Structure and function of the blood-brain barrier. Neurobiol Dis. 37:13–25. 2010. View Article : Google Scholar |