Introduction
Nasopharyngeal carcinoma (NPC), a malignant tumor
derived from the epithelial cells of the nasopharynx, is associated
with high rates of metastasis and a poor prognosis (1). NPC is particularly common in
Guangdong and Guangxi in southern China, in Southeast Asia, Alaska
and Greenland with a reported incidence as high as 50 cases/100,000
individuals (2). NPC occurs at an
anatomical site which is poorly accessible to surgeons, and at
first diagnosis >50% of patients have locally advanced,
non-metastatic stage III or IV NPC (3,4). NPC
is sensitive to ionizing radiation, thus radiotherapy, with or
without concurrent chemotherapy, is the currently accepted standard
of care (3–6). Survival is correlated with the
disease stage at diagnosis with a five-year overall survival (OS)
of 90% for stage I disease and 58% for stage IV disease (4,7).
Despite the efficacy of radiotherapy, radioresistance remains a
severe obstacle to effective treatment in numerous cases (6–8).
The presence of tumor cell heterogeneity is
considered to result in significant differences in the intrinsic
radiosensitivity of NPC cells, and the survival of radioresistant
sublines following radiotherapy is the major cause of local
recurrence and metastasis (8).
Clinically relevant doses of radiation have been demonstrated to
activate multiple signaling pathways, processes which are
considered to depend on the expression of specific growth factor
receptors, transcription factors, autocrine factors, RAS mutation
and (phosphatase and tensin homolog) PTEN expression within the
cell (9).
Recent studies have suggested that tyrosine
phosphorylation and dephosphorylation, mediated by protein tyrosine
kinases (PTK) and protein tyrosine phosphatases (PTP), have an
important role in the regulation of these complex pathways
(10–13). The src homology 2 domain-containing
phosphatase (SHP) is a nuclear receptor with tumor-suppression
activity and has been demonstrated to be downregulated in a number
of cancer types (14). SHP-1 and
SHP-2, src homology 2 (SH2) domain-containing phosphatases, share
55% sequence homology and a similar molecular structure (15). The SH2 domains of SHP-1 have
recently been revealed to downregulate the activity of a number of
kinases to negatively regulate signal transduction and to inhibit
cell proliferation (14,16–21).
Activated SHP-1 has been demonstrated to catalyze tyrosine
dephosphorylation of the Janus kinases (JAKs), src and c-fms,
leading to the reduction or loss of kinase activity and the
inhibition of cell proliferation (14,16–19,22–26).
SHP-1 has been reported to be a negative regulator of angiogenesis
(27) and to be upregulated in
breast cancer (28). Although
SHP-1 was demonstrated to be a negative regulator of proliferation,
knockdown of SHP-1 resulted in CDK6 downregulation and G1/S cell
cycle arrest in prostate cancer cells (20,29).
Several studies have identified that SHP-2 has a role in DNA
damage-induced apoptosis and in the regulation of the DNA damage
G2/M checkpoint (30,31). Furthermore, increased expression of
SHP-2 has been found in gastric (32) and cervical cancer (33).
Retinoblastoma protein (pRb) inhibits the
progression of cells into S phase and is regulated via pRb
phosphorylation by the cyclin D1/cyclin-dependent kinase 4 (CDK4)
complex (34). Tumor suppressor
gene p16 has been demonstrated to negatively regulate cyclin
D1/CDK4 complex phosphorylation activity and the cyclin D1/p16/Rb
pathway appears to be altered in a number of malignancies (34). Hwang et al (35) reported that 89% of NPC tumors
exhibited at least one alteration in the D1/p16/Rb pathway.
Similarly, Gulley et al (36) found that p16 was not detectable in
64% of NPC cases.
The aim of the present study was to establish a
radioresistant NPC cell line to study the molecular mechanism of
radioresistance by measuring the expression of cell cycle control
proteins SHP-1/2, p16, CDk4 and cyclin D1. The results may provide
useful information for future improvements of radiotherapeutic
strategies.
Materials and methods
Establishment of radioresistant
nasopharyngeal carcinoma cell sublines
Human nasopharyngeal carcinoma CNE-2 cells were
obtained from the Central Cancer Laboratory, Affiliated Union
Hospital of Tongji Medical College, Huazhong University of Science
and Technology (Wuhan, Hubei, China). The cells were cultured in
RPMI-1640 (Gibco-BRL, Invitrogen Life Technologies, Carlsbad, CA,
USA) supplemented with 10% fetal bovine serum (Hangzhou Evergreen
Company, Hangzhou, China) at 37°C under 5% CO2.
Exponentially growing CNE-2 cells were divided into
two groups (CNE-2S1 and CNE-2S2) and irradiated with a dose of 6 Gy
x5 or 2 Gy x15, respectively. Irradiation was performed with 6 MV
X-rays generated by a Siemens Primus H high-energy linear
accelerator (Munich, Germany) as previously described (37). The length of the irradiation
intervals were dependant on the MUs of LINAC delivered. There was a
7–9 day and 2–3 day break in between the 6 Gy x5 and 2 Gy x15
doses, respectively. The radiation field was 10×10 cm, the distance
from the source to target was 100 cm and the absorbed dose rate was
200 cGy/min. The cells were subcultured between the doses of
irradiation. The surviving sublines (CNE-2S1 and CNE-2S2 clones)
were then passaged for three months and their radiosensitivity was
determined.
Construction of pGCsi-RNAi vectors
SHP-1 and SHP-2 RNAi target sequences were designed
based on the NM_080549.3 and NM_002831.5 sequences obtained from
the National Center for Biotechnology Information [NCBI; National
Institutes of Health (NIH), Bethesda, MD, USA] database using
online design software (http://rnaidesigner.invitrogen.com/rnaiexpress/). The
target sequences are summarized in Table I. The negative control, p small
interfering (si)RNA-NC, was not homologous to the target genes.
CNE-2 cells were transiently transfected with the six different
pGCsi-RNA plasmids or psiRNA-NC using Lipofectamine 2000
(Invitrogen Life Technologies, Carlsbad, CA, USA) according to the
manufacturer’s instructions. Quantitative polymerase chain reaction
(qPCR) and western blot analysis were performed to evaluate the
interference efficiency 48 h following transfection.
 | Table ISHP-1 and SHP-2 RNAi target
sequences. |
Table I
SHP-1 and SHP-2 RNAi target
sequences.
| A, SHP-1 siRNA
target sequences |
|---|
|
|---|
| Plasmid | siRNA sequence | Start site |
|---|
| pGCsi-RNA 1 |
5′-TCCCGACAACACAATACCAGATAAATTC | |
|
AAGAGATTTATCTGGTATTGTGTTGTCTTT-3′ | 1907 |
| pGCsi-RNA 2 |
5′-TCCCGTCCCATTACTACTGTTCCAATTC | |
|
AAGAGATTGGAACAGTAGTAATGGGACTT-3′ | 774 |
| pGCsi-RNA 3 |
5′-TCCCAATCTCTATGCAACTCAAGGCTTC | |
|
AAGAGAGCCTTGAGTTGCATAGAGATTTT-3′ | 970 |
| pGCsi-RNA NC |
5′-TCCCTTCTCCGAACGTGTCACGTTTC | |
|
AGAGAACGTGACACGTTCGGAGAATT-3′ | |
|
| B, SHP-2 siRNA
target sequences |
|
| Plasmid | siRNA sequence | Start site |
|
| pGCsi-RNA 4 |
5′-TCCCGACCCTTATCGTACGATCTAATAAATTC | |
|
AAGAGATTCTACTATCTTACTTATTATCTATTT-3′ | 1907 |
| pGCsi-RNA 5 |
5′-TCCCCTTATCTATCTATCTGATGGATTTC | |
|
AAGAGAATCGATCGATCGATCACTGATCGTT-3′ | 774 |
| pGCsi-RNA 6 |
5′-TCCCATCTATGCTCGCGCTAGCTCGATGTTC | |
|
AAGAGAATTCTATCTATATATCTGGTATGTT-3′ | 970 |
| pGCsi-RNA NC |
5′-TCCCTTCTCCGAACGTGTCACGTTTC | |
|
AGAGAACGTGACACGTTCGGAGAATT-3′ | |
Detection of mRNA transcription using
qPCR
Total RNA was extracted from transiently-transfected
CNE-2 cells using TRIzol (Invitrogen Life Technologies) according
to the manufacturer’s instructions. Total RNA (1 μg) was reversely
transcribed using an oligo dT primer and moloney murine leukemia
virus reverse transcriptase (Invitrogen Life Technologies)
according to the manufacturer’s instructions. The cDNA product was
PCR-amplified using SHP-1/2 primers (Table II). The cycling conditions were as
follows: 35 cycles of denaturation at 95°C, annealing at 57°C and
elongation at 72°C. GAPDH was used as an internal control. The
amplified products were analyzed on 1% agarose gels.
| Table IISHP-1/2 polymerase chain reaction
primers. |
Table II
SHP-1/2 polymerase chain reaction
primers.
| Target gene | Primers | Annealing
temperature (°C) | Length of product
(bp) |
|---|
| SHP-1 | F:
5′-TTGTAGCACTCCGAATGGTT-3′
R: 5′-CTTCTGCCTGGTCTTCTCCT-3′ | 56.6 | 185 |
| SHP-2 | F:
5′-TCCAGGACTGCAATGCTTAC-3′
R: 5′-CCTAATTCGGATCGTAGCTAATG-3′ | 58.6 | 174 |
Western blot analysis
Total protein was extracted from transiently
transfected CNE-2 cells using a lysis buffer (20 mM Tris [pH 7.5],
150 mM NaCl, 1% Triton X-100, sodium pyrophosphate,
β-glycerophosphate, EDTA, Na3VO4 and
leupeptin; Wuhan Biyuntian Biotechnology Research Institute,
Shanghai, China) and quantified using a bicinchoninic acid kit
(Biyuntian Biotechnology Research Institute, Shanghai, China).
Equal amounts of protein were separated by SDS-PAGE and transferred
to polyvinylidene fluoride membranes (Millipore, Billerica, MA,
USA). The membranes were blocked with normal goat serum at 37°C for
1 h and were then incubated with a 1:300 dilution of primary rabbit
anti-human SHP-1, p16, CDK4 or cyclin D1 monoclonal antibodies
(Cell Signaling Technology, Inc., Danvers, MA, USA) at 4°C
overnight. The membranes were extensively washed and incubated with
a 1:2,000 dilution of horseradish peroxidase-conjugated goat
anti-rabbit secondary antibody (Beijing Zhongshan Golden Bridge
Company, Beijing, China) at 37°C for 1 h. The protein bands were
visualized using an enhanced chemiluminescence kit (Pierce
Biotechnology, Inc., Rockford, IL, USA) and visualized using a UV
transilluminator (Uvitec Limited, Avebury House, Cambridge, UK).
Image J 1.43b software (NIH, Bethesda, MD, USA) was used to scan
the protein bands and to measure the optical density values. The
ratio of the target band/internal reference GAPDH was calculated to
determine the relative protein expression.
Construction and identification of CNE-2
cell lines stably transfected with interference plasmids
CNE-2 cells were transfected with pGCsi-RNAi vectors
for 24 h, passaged (1:10) and replated. The stably transfected
cells were selected using 600 μg/ml G418 (Gibco-BRL) for 14 days.
Positive clones were obtained and screened by qPCR and western
blotting for transfection efficiency. The cells with high
transfection efficiency were amplified and maintained in the
presence of 300 μg/ml G418. The CNE-2 cells stably transfected with
the siRNA inhibiting SHP-1 expression were named
CNE-2S*, and CNE-2 cells stably transfected with the
siRNA inhibiting SHP-2 expression were named
CNE-2S#.
Clonogenic survival assay
Single-cell suspensions of parental CNE-2, CNE-2S1,
CNE-2S2, CNE-2S* and CNE-2S# cells were
plated in six-well culture plates and irradiated with 0, 200, 400,
600, 800 and 1,000 cGy. Following irradiation, the cells were
cultured for two weeks, fixed with absolute ethanol containing 1%
methyl violet for 20 min and the number of surviving colonies
(defined as a colony with >50 cells) were counted. The plating
efficiency (PE) and the cell survival fraction (SF) were calculated
as follows: PE = (number of colonies in the control group/number of
inoculated cells) × 100% and SF = (number of colonies in the
experimental group/number of inoculated cells) × PE. The cell
survival curves were plotted with Sigma Plot 2001 software using
the multi-target, single-hit model S =
l-(1-e−D/D0)N. Radiobiological parameters,
including the average lethal dose (D0), quasi-threshold
dose (Dq) and the extrapolation number (N), were also
calculated (38).
Cell cycle detection with flow
cytometry
Single cell suspensions of irradiated CNE-2S1 and
CNE-2S2 cells were added to pre-chilled 75% ethanol and fixed at
−20°C overnight. The ethanol was then discarded and the cells were
rinsed with phosphate-buffered saline and resuspended. The samples
were digested with RNAase and propidium iodide (PI; Sigma, St.
Louis, MO, USA) was added to achieve a final concentration of 60
μg/ml. The samples were incubated in the dark for 30 min and
subjected to flow cytometry using FACScan (Becton Dickinson, San
Jose, CA, USA) using blue light (488 nm) for excitation.
Fluorescence was measured at 530±20 nm (green, fluorescein
isothiocyanate) and >620 nm (red, PI) (39). The experiment was repeated three
times and the mean was calculated.
Statistical analysis
Data are presented as the mean ± standard deviation.
Differences between the three groups were assessed by analysis of
variance for continuous variables. The Bonferroni method was used
for adjustment of type I errors for multiple comparisons. All
statistical assessments were evaluated at a two-sided α-level of
0.05. Statistical analyses were performed using SAS 9.2 statistics
software (SAS Institute Inc., Cary, NC, USA).
Results
Radiosensitivity of CNE-2S1 and CNE-2S2
cells
The fractions of CNE-2, CNE-2S1 and CNE-2S2 cells
that survived irradiation are revealed in Fig. 1A. The results demonstrated that
irradiation killed the cells logarithmically and that CNE-2S1 cells
had a higher radioresistance compared with the parental or CNE-2S2
cells. Notably, CNE-2S1 cells had higher D0,
Dq and N values compared with the parental CNE-2 cells,
indicating higher radioresistance (Table III). By contrast, D0,
Dq and N values were similar between the CNE-2S2 and
parental cells, indicating no difference in radiosensitivity.
| Table IIIRadiosensitivity parameters of the
cell lines. |
Table III
Radiosensitivity parameters of the
cell lines.
| Parameter | CNE-2 | CNE-2S1 | CNE-2S2 | P-value |
|---|
| D0 | 1.71±0.03 | 2.07±0.07b | 1.62±0.05c | <0.001a |
| Dq | 1.49±0.06 | 2.01±0.08b | 1.46±0.03c | <0.001a |
| N | 2.87±0.05 | 4.43±0.14b | 2.45±0.11b,c | <0.001a |
CNE-2, CNE-2S1 and CNE-2S2 cells were cultured for
three months, and analysis of the cell survival curves as well as
the radiosensitivity parameters D0, Dq and N
indicated that CNE-2S1 cells had higher radioresistance compared
with the parental and CNE-2S2 cells following three months of
culture (Table IV).
| Table IVRadiosensitivity parameters of the
cell lines following three months of culture. |
Table IV
Radiosensitivity parameters of the
cell lines following three months of culture.
| Parameter | CNE-2 | CNE-2S1 | CNE-2S2 | P-value |
|---|
| D0 | 1.42±0.05 | 2.13±0.04b | 1.39±0.07c | <0.001a |
| Dq | 1.57±0.06 | 2.41±0.07b | 1.69±0.08c | <0.001a |
| N | 2.38±0.11 | 4.35±0.13b | 2.47±0.05c | <0.001a |
Cell cycle analysis of CNE-2, CNE-2S1 and
CNE-2S2 cells
Irradiated CNE-2S1 cells had a significantly lower
percentage of cells in G1 phase and a significantly higher
percentage of cells in S phase compared with irradiated CNE-2 and
CNE-2S2 cells (Fig. 2). In the
CNE-2 group, 83.5±2.3% of cells were in G1 phase, 10.3±0.7% cells
were in S phase and 6.2±1.8% were in G2-M phase. The CNE-2S2 group
demonstrated a similar profile with 86.3±2.0% cells in G1 phase,
7.9±0.6% in S phase and 5.8±2.2% in G2-M phase. However, in the
CNE-2S1 group, 63.3±2.8% of the cells were in G1 phase, 26.6±1.2%
were in S phase and 10±3.2% were in G2-M phase. The average S/G1
ratios in the CNE-2, CNE-2S1 and CNE-2S2 groups were 0.12, 0.42 and
0.09, respectively.
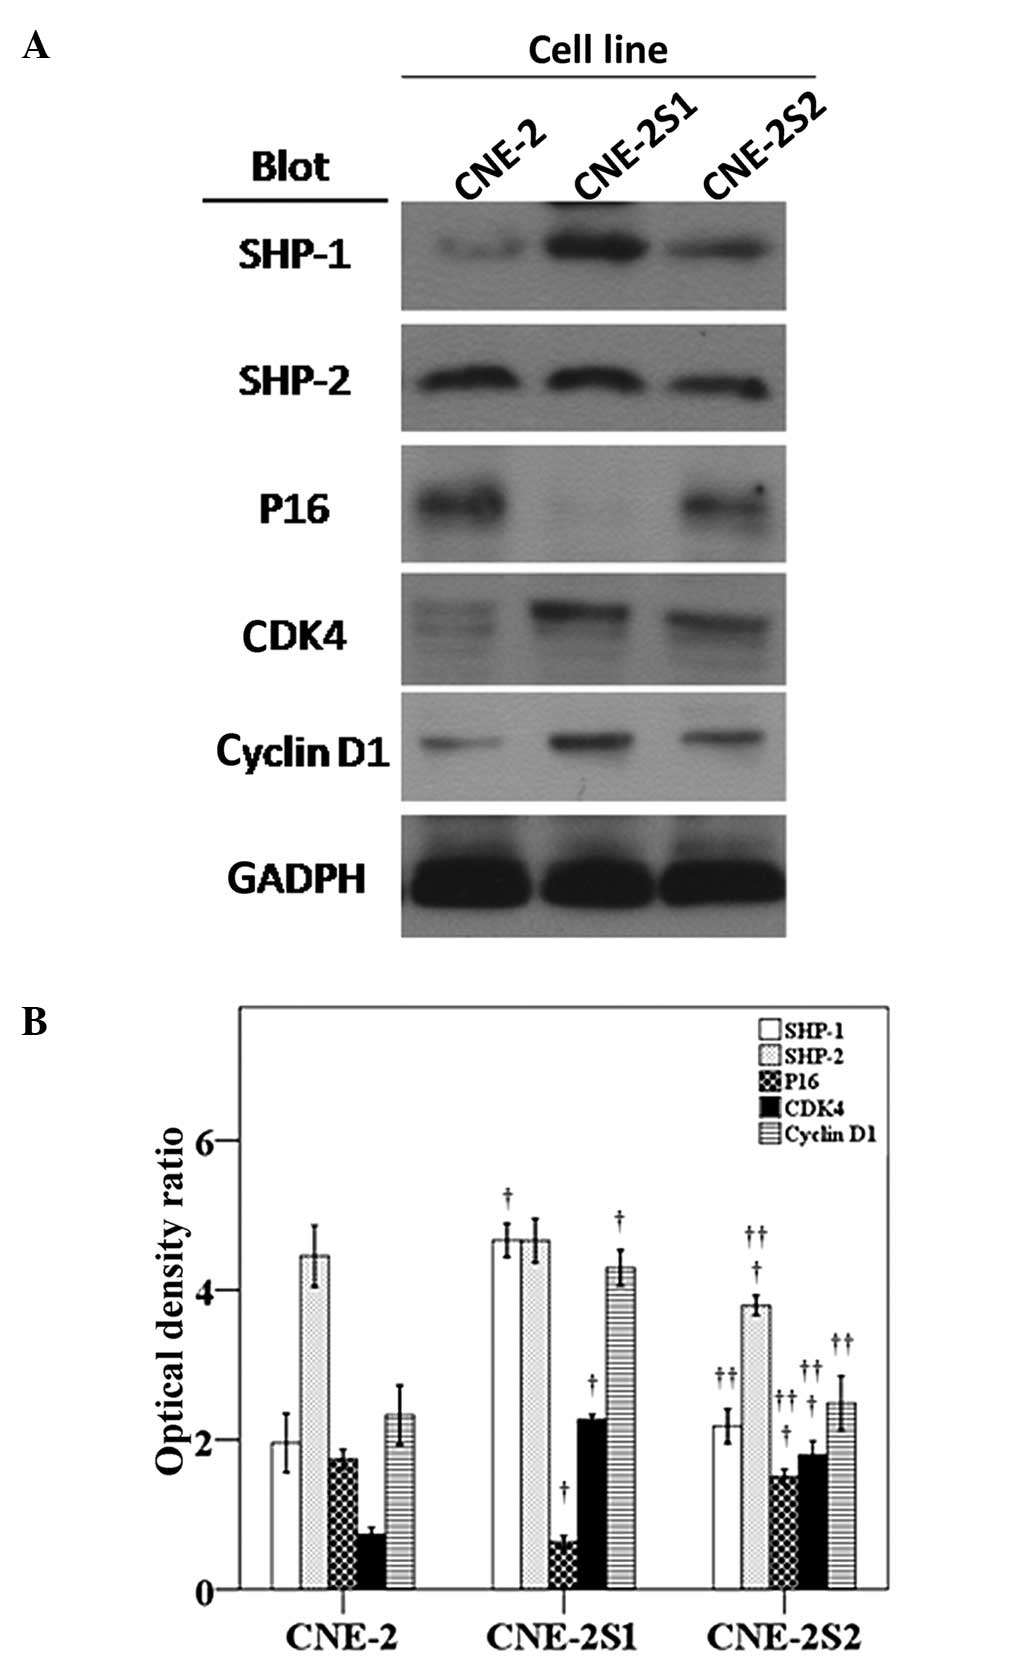
SHP-1/2, p16, CDK4 and cyclin D1
expression in CNE-2, CNE-2S1 and CNE-2S2 cells
There was a significant upregulation of SHP-1, CDK4
and cyclin D1 and a significant downregulation of p16 in CNE-2S1
cells as compared with CNE-2 cells (Fig. 3). There was significant
downregulation of SHP-2 and p16, and an upregulation of CDK4 in
CNE-2S2 cells compared with the CNE-2 cells. As compared with the
CNE-2S1 cells, in CNE-2S2 there was a significant upregulation of
p16 and a significant downregulation of all other proteins
studied.
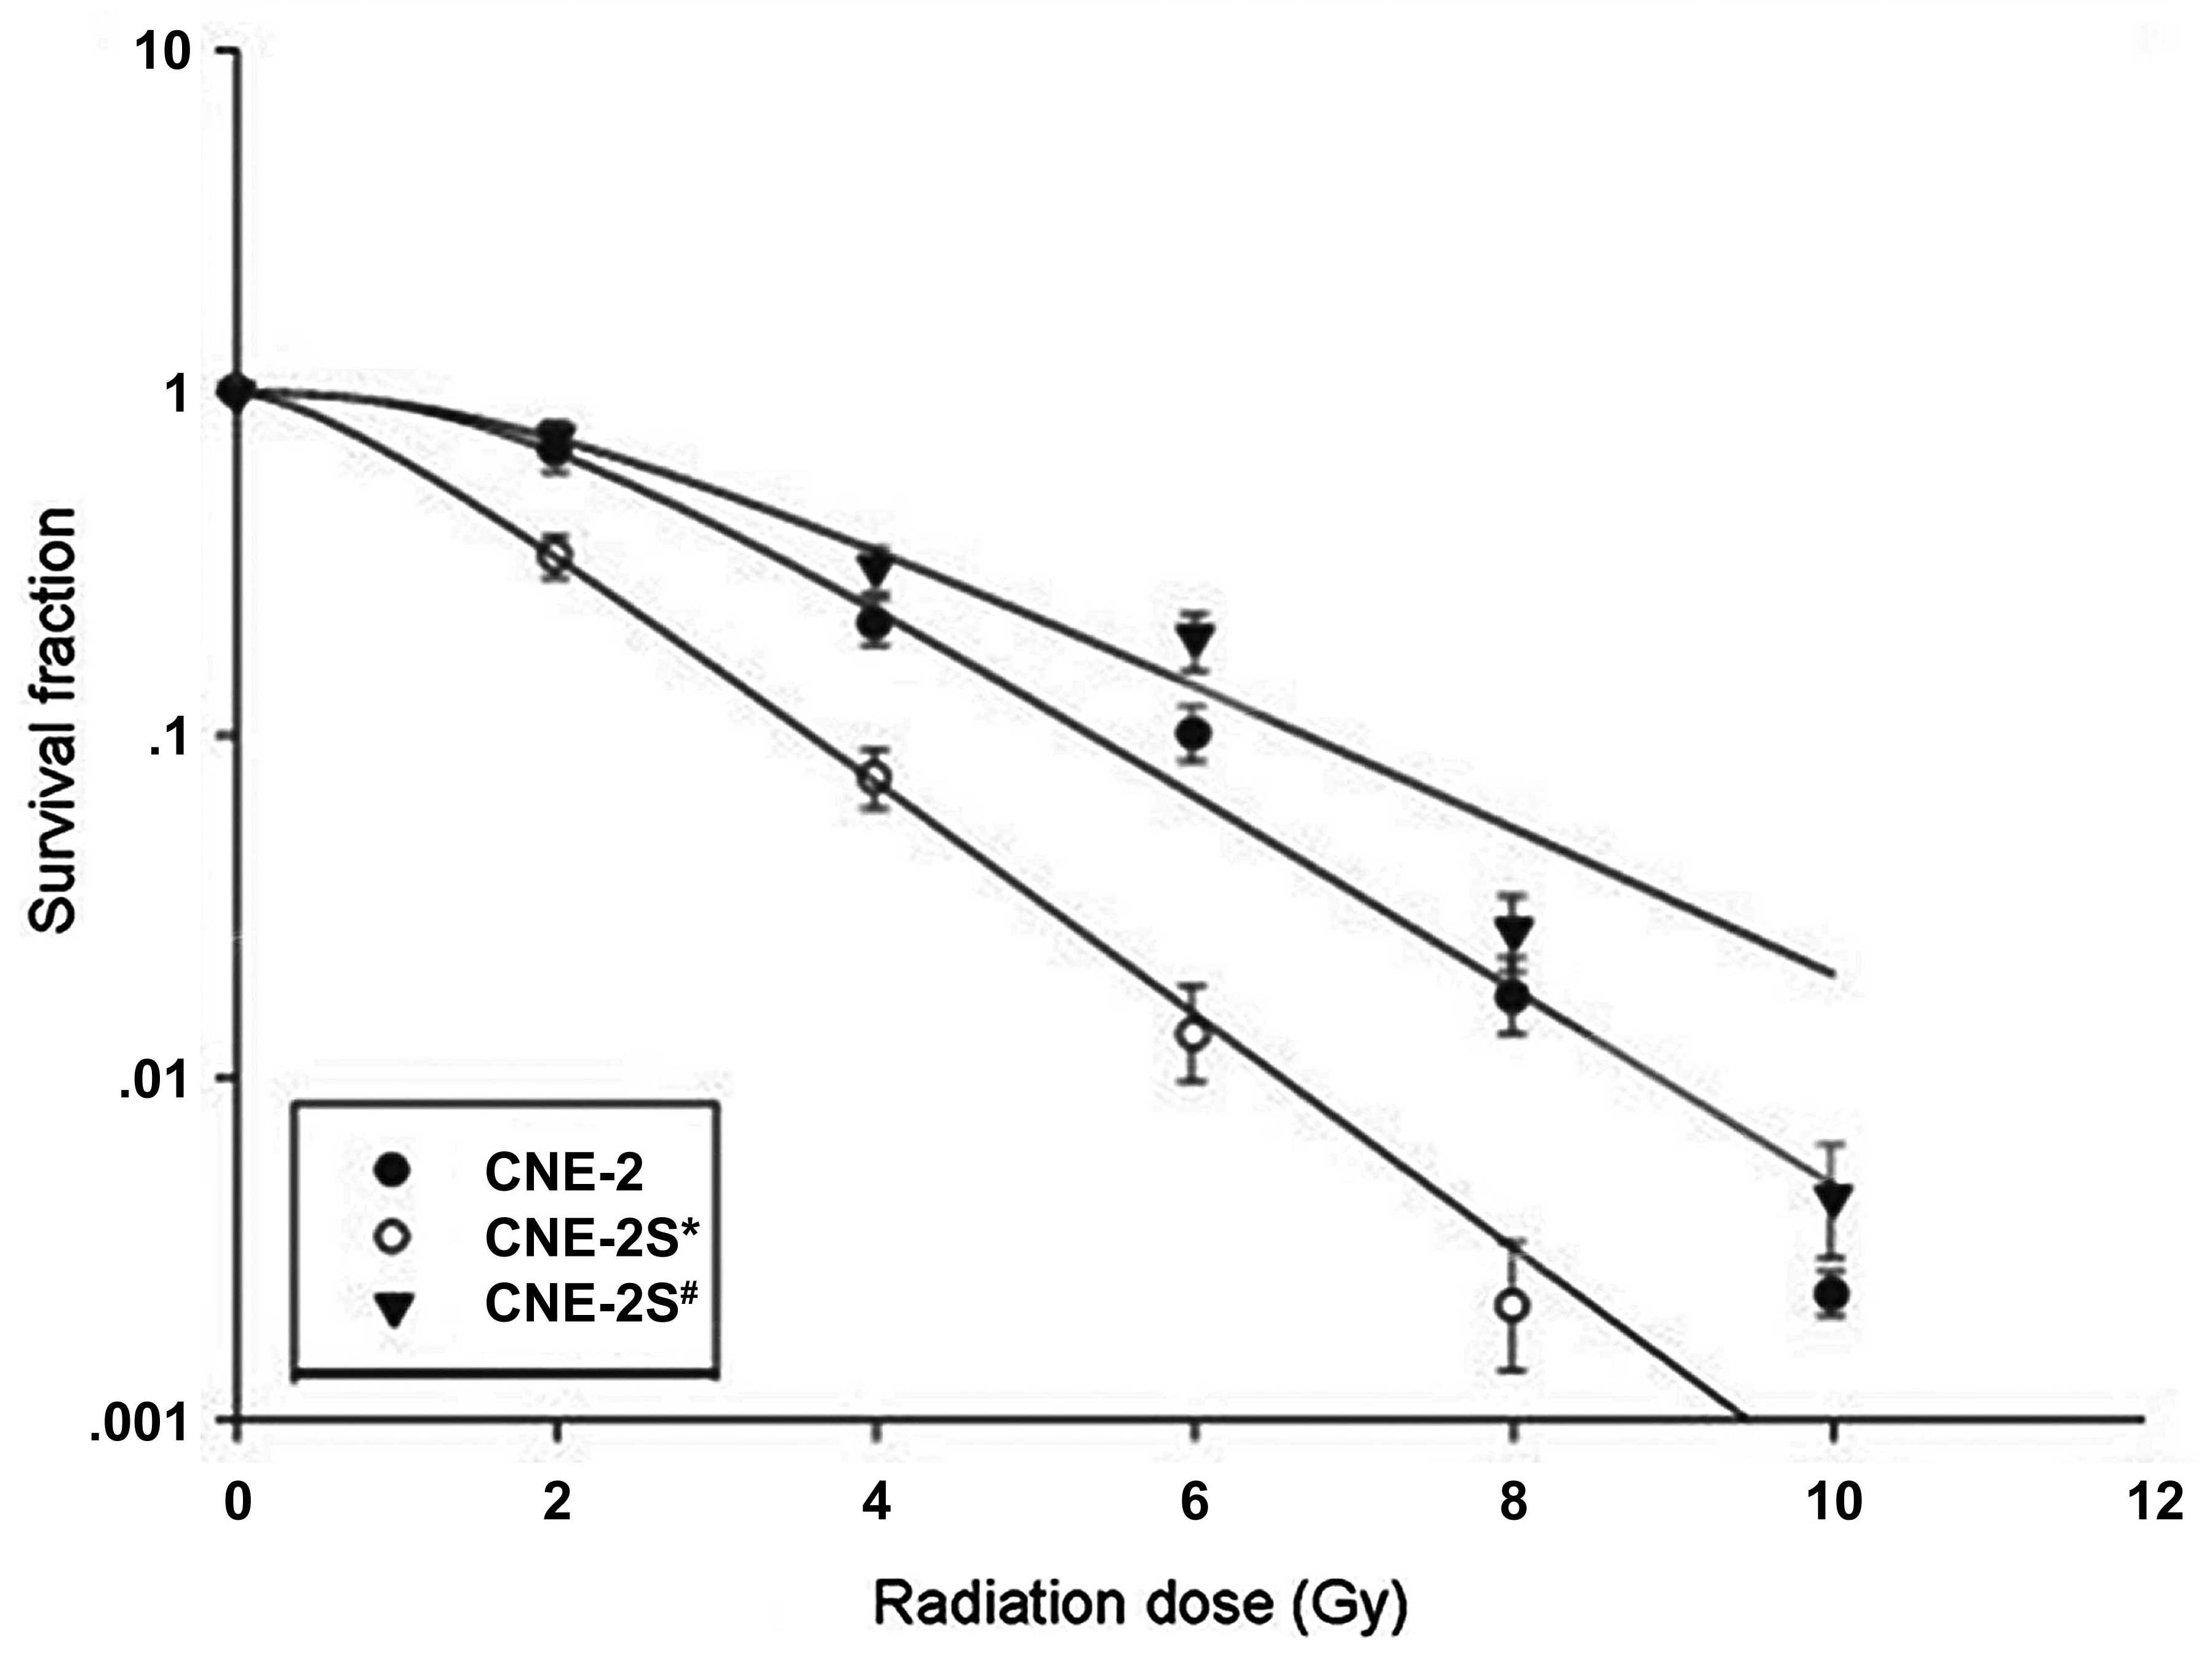
Survival of CNE-2S* and
CNE-2S# cells following different radiation doses
The survival curves of the CNE-2S* and
CNE-2S# cell lines are demonstrated in Fig. 4, and the radiosensitivity
parameters are summarized in Table
V. In all of the cell lines, the radiation killed the cells in
a logarithmic dose-dependent manner. The CNE-2S* cells
had significantly lower D0, Dq and N values
and a narrower shoulder area under the cell survival curve compared
with the CNE-2 cells, suggesting that these cells were more
radiosensitive compared with CNE-2 cells.
| Table VRadiosensitivity parameters of
CNE-2S* and CNE-2S# cells after different
radiation doses. |
Table V
Radiosensitivity parameters of
CNE-2S* and CNE-2S# cells after different
radiation doses.
| Parameter | CNE-2 |
CNE-2S* |
CNE-2S# | P-value |
|---|
| D0 | 1.64±0.08 | 1.23±0.04b | 1.83±0.06b,c | <0.001a |
| Dq | 1.25±0.03 | 0.93±0.05b | 1.35±0.05b,c | <0.001a |
| N | 2.35±0.09 | 1.89±0.06b | 2.49±0.11c | <0.001a |
Cell cycle analysis of CNE-2,
CNE-2S# and CNE-2S* cells
The results of the flow cytometric cell cycle
analysis of the CNE-2, CNE-2S# and CNE-2S*
cells are shown in Fig. 5. In the
CNE-2 group, 78.6±2.6, 13.9±1.7 and 7.5±1.4% of the cells were in
G1, S, and G2-M phase, respectively. The cell cycle profile of the
CNE-2S# group revealed 79.4±1.6, 13.6±1.5 and 7.0±1.7%
of cells in G1, S and G2-M phase, respectively; however there was
no significant difference from the DNE-2 group. The
CNE-2S* group exhibited a significant difference in the
percentage of G1, S and S/G1 cells compared with the
CNE-2S# and CNE-2 groups, with 85.4±1.4, 6.4±0.7 and
10.0±2.0% cells in G1, S and G2-M phase, respectively. There was no
significant difference in the percentage of G2-M cells between the
three groups. The average percentage of S/G1 phase cells in the
CNE-2, CNE-2S* and CNE-2S# groups was 0.2,
0.1 and 0.2, respectively.
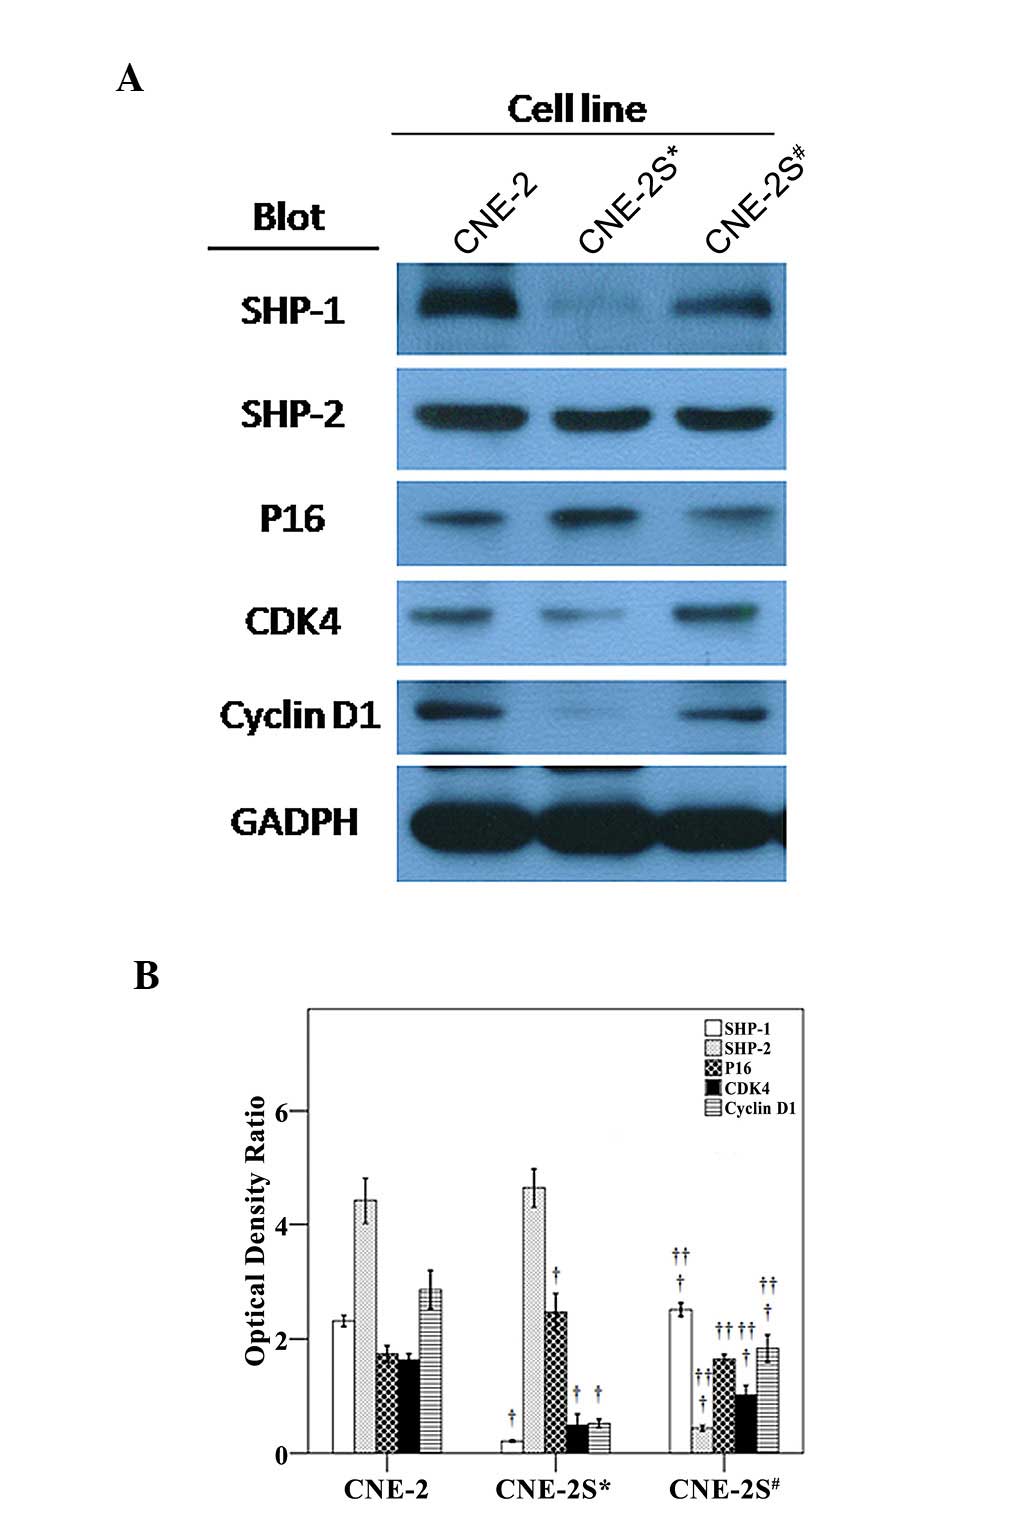
SHP-1/2, p16, CDK4 and cyclin D1
expression in CNE-2, CNE-2S* and CNE-2S#
cells
The expression levels of SHP-1, CDK4 and cyclin D1
were significantly downregulated, while the expression of p16 was
significantly upregulated in the CNE-2S* cells compared
with the CNE-2 cells (Fig. 6).
SHP-2 and CDK4 were significantly downregulated in the
CNE-2S# cells compared with the CNE-2 cells. As compared
with the CNE-2S* cells, the expression of SHP-1, CDK4
and cyclin D1 was significantly upregulated and the expression
levels of SHP-2 and p16 were downregulated in the
CNE-2S# cells.
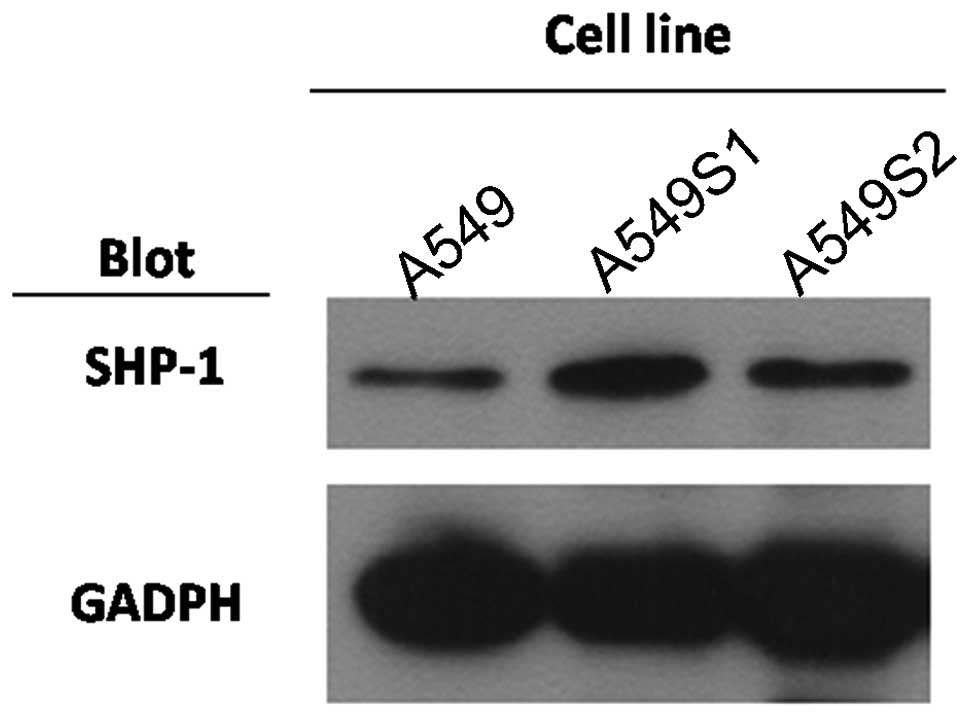
SHP-1 in radioresistant lung cancer cell
lines A549S1 and A549S2
Upregulation of SHP-1 was not only detected in
radioresistant nasopharyngeal carcinoma cells; radioresistance was
also established in the lung cancer cell lines A549S1 and A549S2.
Compared with the parent line A549, SHP-1 expression, as determined
by western blotting, in these two radioresistant lines was
similarly increased as observed in the CNE-2S1 cells (Fig. 7).
Discussion
The results of the present study demonstrated that
CNE-2S1 cells were significantly more radioresistant than CNE-2S2
cells and parental cells, had a significantly higher percentage of
cells in S phase and a significantly lower percentage of cells in
G1 phase as compared with CNE-2S2 cells. Significantly higher
levels of SHP-1, CDK4 and cyclin D1 protein and significantly lower
levels of p16 were found in the CNE-2S1 compared with the CNE-2S2
cells. Stable suppression of SHP-1 mRNA in CNE-2 cells resulted in
increased radiosensitivity compared with the parental cells, a
decrease in the number of cells in the S phase and an increase in
the expression of p16. Taken together, the results suggested that
the SHP-1/p16/cyclin D1/CDK4 pathway may have a role in regulating
radiosensitivity and cell cycle distribution in nasopharyngeal
cells.
These data demonstrated that the large split-dose
irradiation induced the formation of more radioresistant NPC cells
compared with the conventional fractionation method. Fractionated
radiotherapy has been demonstrated to lead to radioresistance via a
number of different mechanisms, including i) selection of an
intrinsic radioresistant phenotype from a heterogenous population;
ii) induction of mutations leading to radioresistance and iii)
alterations in the tumor microenvironment (40). Radiosensitivity has been reported
to be affected by cellular hypoxia, efficiency of the DNA repair
mechanisms following radiation-induced DNA damage, the number of
dividing cells and the cell cycle distribution (41,42).
Abrogation of the G2/M checkpoint has been reported to potentiate
radiation-induced cell death and the checkpoint kinase 1 inhibitor
Go6976 was demonstrated to enhance the sensitivity of NPC cells to
radiotherapy (43). Acquired
radioresistance was also revealed to be associated with cyclin D1
overexpression (40). In general,
cells in S phase are radioresistant, cells in G0/1 phase are
relatively radiosensitive and cells in the G2-M phase are most
sensitive to radiation (38). The
present data demonstrated a significantly higher proportion of S
phase cells and a significantly lower proportion of G1 phase cells
in the CNE-2S1 group compared with the parental cells, while there
was no difference in the percentage of G2/M cells. Of note, there
were no significant changes in the proportions of cells in the
various cell cycle phases in the CNE-2S2 cells. Based on these
data, it was hypothesized that the dysregulation of the cell cycle
may be an important mechanism driving radioresistance in NPC
cells.
SHP-1 is expressed in hematopoietic cells, as well
as other cell types, and in malignant cells, most notably in
malignant epithelial cells (21).
SHP-1 regulates cell proliferation by catalyzing tyrosine
dephosphorylation, leading to the reduction or loss of kinase
activity and by regulating proteins important in the cell-cycle,
including CDK2, p27 and cyclin D1 (21). Although SHP-1 has been demonstrated
to be an inhibitor of cell proliferation, knockdown of SHP-1 was
recently reported to downregulate CDK6 and inhibit G1/S progression
in prostate cancer cells (20).
The present results, which demonstrated that SHP-1 knockdown
resulted in a G1/ S block accompanied by a significant increase in
radiosensitivity, are consistent with those of the aforementioned
study. SHP-1 has previously been suggested to interact with PI3K to
increase the protein stability of p27 and to modulate cell cycle
events (20). In addition, Seo
et al (27) demonstrated
that SHP-1 mediates the anti-proliferative activity of the tissue
inhibitor of metalloproteinase (TIMP)-2 in human microvascular
endothelial cells.
The present study investigated the association
between SHP-1 and p16, as p16 has previously been demonstrated to
be silenced in the vast majority of NPC patients (35,36).
In addition, low p16 expression correlated with poor outcome and
adenovirus-mediated p16 gene therapy inhibited tumor formation in a
mouse model of NPC (44). The data
of the present study are consistent with these results and
demonstrated a significant downregulation of p16 in CNE-2S1 cells,
which was reversed in the CNE-2S* cells, where SHP-1
expression was silenced.
Areas of future study include the correlation of
SHP-1 and radiation-induced signaling through pro-survival pathways
(e.g., epidermal growth factor receptor; PI3K/Akt), as well as the
correlation with the expression of radiation-activated
transcription factor (activator protein 1 and nuclear factor κB),
and the expression of p21 and p27kip1 in the NPC cell lines studied
(45–47).
In conclusion, the results of the present study
demonstrated that SHP-1 has a role in the radioresistance of NPC
cells, possibly via the regulation of the cell cycle. Targeting
specific signaling pathways to modulate radiosensitivity may be
valuable in the development of novel therapeutic strategies to
treat NPC.
Abbreviations:
|
NPC
|
nasopharyngeal carcinoma
|
|
CRT
|
chemotherapy-radiotherapy
|
|
EGFR
|
epidermal growth factor receptor
|
|
MV
|
megavolt
|
|
PE
|
inoculation efficiency
|
|
SF
|
cell survival fraction
|
|
D0
|
average lethal dose
|
|
Dq
|
quasi-threshold dose
|
|
N
|
extrapolation number
|
|
PTK
|
protein tyrosine kinases
|
|
PTP
|
protein tyrosine phosphatases
|
References
|
1
|
Tulalamba W and Janvilisri T:
Nasopharyngeal carcinoma signaling pathway: an update on molecular
biomarkers. Int J Cell Biol. 2012:5946812012. View Article : Google Scholar : PubMed/NCBI
|
|
2
|
Chang ET and Adami HO: The enigmatic
epidemiology of nasopharyngeal carcinoma. Cancer Epidemiol
Biomarkers Prev. 15:1765–1777. 2006. View Article : Google Scholar : PubMed/NCBI
|
|
3
|
Lee AW, Sze WM, Au JS, Leung SF, Leung TW,
Chua DT, Zee BC, Law SC, Teo PM, Tung SY, Kwong DL and Lau WH:
Treatment results for nasopharyngeal carcinoma in the modern era:
the Hong Kong experience. Int J Radiat Oncol Biol Phys.
61:1107–1116. 2005. View Article : Google Scholar : PubMed/NCBI
|
|
4
|
Lee AW, Poon YF, Foo W, Law SC, Cheung FK,
Chan DK, Tung SY, Thaw M and Ho JH: Retrospective analysis of 5037
patients with nasopharyngeal carcinoma treated during 1976–1985
overall survival and patterns of failure. Int J Radiat Oncol Biol
Phys. 23:261–270. 1992.PubMed/NCBI
|
|
5
|
Langendijk JA, Leemans CR, Buter J,
Berkhof J and Slotman BJ: The additional value of chemotherapy to
radiotherapy in locally advanced nasopharyngeal carcinoma: a
meta-analysis of the published literature. J Clin Oncol.
22:4604–4612. 2004. View Article : Google Scholar : PubMed/NCBI
|
|
6
|
Lin JC, Jan JS, Hsu CY, Liang WM, Jiang RS
and Wang WY: Phase III study of concurrent chemoradiotherapy versus
radiotherapy alone for advanced nasopharyngeal carcinoma: positive
effect on overall and progression-free survival. J Clin Oncol.
21:631–637. 2003. View Article : Google Scholar
|
|
7
|
Wee J, Tan EH, Tai BC, Wong HB, Leong SS,
Tan T, Chua ET, Yang E, Lee KM, Fong KW, Tan HS, Lee KS, Loong S,
Sethi V, Chua EJ and Machin D: Randomized trial of radiotherapy
versus concurrent chemoradiotherapy followed by adjuvant
chemotherapy in patients with American Joint Committee on
Cancer/International Union against cancer stage III and IV
nasopharyngeal cancer of the endemic variety. J Clin Oncol.
23:6730–6738. 2005. View Article : Google Scholar
|
|
8
|
Feng XP, Yi H, Li MY, Li XH, Yi B, Zhang
PF, Li C, Peng F, Tang CE, Li JL, Chen ZC and Xiao ZQ:
Identification of biomarkers for predicting nasopharyngeal
carcinoma response to radiotherapy by proteomics. Cancer Res.
70:3450–3462. 2010. View Article : Google Scholar : PubMed/NCBI
|
|
9
|
Dent P, Yacoub A, Contessa J, Caron R,
Amorino G, Valerie K, Hagan MP, Grant S and Schmidt-Ullrich R:
Stress and radiation-induced activation of multiple intracellular
signaling pathways. Radiat Res. 159:283–300. 2003. View Article : Google Scholar : PubMed/NCBI
|
|
10
|
Sung FL, Hui EP, Tao Q, Li H, Tsui NB,
Dennis Lo YM, Ma BB, To KF, Harris AL and Chan AT: Genome-wide
expression analysis using microarray identified complex signaling
pathways modulated by hypoxia in nasopharyngeal carcinoma. Cancer
Lett. 253:74–88. 2007. View Article : Google Scholar
|
|
11
|
Morrison JA, Gulley ML, Pathmanathan R and
Raab-Traub N: Differential signaling pathways are activated in the
Epstein-Barr virus-associated malignancies nasopharyngeal carcinoma
and Hodgkin lymphoma. Cancer Res. 64:5251–5260. 2004. View Article : Google Scholar
|
|
12
|
Li L, Tao Q, Jin H, van Hasselt A, Poon
FF, Wang X, Zeng MS, Jia WH, Zeng YX, Chan AT and Cao Y: The tumor
suppressor UCHL1 forms a complex with p53/MDM2/ARF to promote p53
signaling and is frequently silenced in nasopharyngeal carcinoma.
Clin Cancer Res. 16:2949–2958. 2010. View Article : Google Scholar : PubMed/NCBI
|
|
13
|
Zeng ZY, Zhou YH, Zhang WL, Xiong W, Fan
SQ, Li XL, Luo XM, Wu MH, Yang YX, Huang C, Cao L, Tang K, Qian J,
Shen SR and Li GY: Gene expression profiling of nasopharyngeal
carcinoma reveals the abnormally regulated Wnt signaling pathway.
Hum Pathol. 38:120–133. 2007. View Article : Google Scholar : PubMed/NCBI
|
|
14
|
Oka T, Yoshino T, Hayashi K, Ohara N,
Nakanishi T, Yamaai Y, Hiraki A, Sogawa CA, Kondo E, Teramoto N,
Takahashi K, Tsuchiyama J and Akagi T: Reduction of hematopoietic
cell-specific tyrosine phosphatase SHP-1 gene expression in natural
killer cell lymphoma and various types of lymphomas/leukemias:
combination analysis with cDNA expression array and tissue
microarray. Am J Pathol. 159:1495–1505. 2001. View Article : Google Scholar
|
|
15
|
Neel BG, Gu H and Pao L: The ‘Shp’ing
news: SH2 domain-containing tyrosine phosphatases in cell
signaling. Trends Biochem Sci. 28:284–293. 2003.
|
|
16
|
Mittal Y, Pavlova Y, Garcia-Marcos M and
Ghosh P: Src homology domain 2-containing protein-tyrosine
phosphatase-1 (SHP-1) binds and dephosphorylates
G(alpha)-interacting, vesicle-associated protein (GIV)/Girdin and
attenuates the GIV-phosphatidylinositol 3-kinase (PI3K)-Akt
signaling pathway. J Biol Chem. 286:32404–32415. 2011. View Article : Google Scholar
|
|
17
|
Beyaert R: SHP works a double shift to
control TLR signaling. Nat Immunol. 12:725–727. 2011. View Article : Google Scholar : PubMed/NCBI
|
|
18
|
Prasad S, Pandey MK, Yadav VR and Aggarwal
BB: Gambogic acid inhibits STAT3 phosphorylation through activation
of protein tyrosine phosphatase SHP-1: potential role in
proliferation and apoptosis. Cancer Prev Res (Phila). 4:1084–1094.
2011. View Article : Google Scholar : PubMed/NCBI
|
|
19
|
López-Ruiz P, Rodriguez-Ubreva J, Cariaga
AE, Cortes MA and Colás B: SHP-1 in cell-cycle regulation.
Anticancer Agents Med Chem. 11:89–98. 2011.
|
|
20
|
Rodríguez-Ubreva FJ, Cariaga-Martinez AE,
Cortés MA, Romero-De Pablos M, Ropero S, López-Ruiz P and Colás B:
Knockdown of protein tyrosine phosphatase SHP-1 inhibits G1/S
progression in prostate cancer cells through the regulation of
components of the cell-cycle machinery. Oncogene. 29:345–355.
2010.PubMed/NCBI
|
|
21
|
López-Ruiz P, Rodriguez-Ubreva J, Cariaga
AE, Cortes MA and Colás B: SHP-1 in cell-cycle regulation.
Anticancer Agents Med Chem. 11:89–98. 2011.
|
|
22
|
Yu Z, Maoui M, Zhao ZJ, Li Y and Shen SH:
SHP-1 dephosphorylates 3BP2 and potentially downregulates
3BP2-mediated T cell antigen receptor signaling. FEBS J.
273:2195–2205. 2006. View Article : Google Scholar : PubMed/NCBI
|
|
23
|
Zhang J and Shen B: SHP limits TLR
signaling, an inducible transcriptional corepressor. Cell Mol
Immunol. 8:445–446. 2011. View Article : Google Scholar : PubMed/NCBI
|
|
24
|
Iype T, Sankarshanan M, Mauldin IS,
Mullins DW and Lorenz U: The protein tyrosine phosphatase SHP-1
modulates the suppressive activity of regulatory T cells. J
Immunol. 185:6115–6127. 2010. View Article : Google Scholar : PubMed/NCBI
|
|
25
|
Biskup C, Böhmer A, Pusch R, Kelbauskas L,
Gorshokov A, Majoul I, Lindenau J, Benndorf K and Böhmer FD:
Visualization of SHP-1-target interaction. J Cell Sci.
117:5165–5178. 2004. View Article : Google Scholar : PubMed/NCBI
|
|
26
|
Zhu Z, Oh SY, Cho YS, Zhang L, Kim YK and
Zheng T: Tyrosine phosphatase SHP-1 in allergic and anaphylactic
inflammation. Immunol Res. 47:3–13. 2010. View Article : Google Scholar : PubMed/NCBI
|
|
27
|
Seo DW, Li H, Qu CK, Oh J, Kim YS, Diaz T,
Wei B, Han JW and Stetler-Stevenson WG: Shp-1 mediates the
antiproliferative activity of tissue inhibitor of
metalloproteinase-2 in human microvascular endothelial cells. J
Biol Chem. 281:3711–3721. 2006. View Article : Google Scholar : PubMed/NCBI
|
|
28
|
Yip SS, Crew AJ, Gee JM, Hui R, Blamey RW,
Robertson JF, Nicholson RI, Sutherland RL and Daly RJ:
Up-regulation of the protein tyrosine phosphatase SHP-1 in human
breast cancer and correlation with GRB2 expression. Int J Cancer.
88:363–368. 2000. View Article : Google Scholar : PubMed/NCBI
|
|
29
|
Ketroussi F, Giuliani M, Bahri R, Azzarone
B, Charpentier B and Durrbach A: Lymphocyte cell-cycle inhibition
by HLA-G is mediated by phosphatase SHP-2 and acts on the mTOR
pathway. PLoS One. 6:e227762011. View Article : Google Scholar : PubMed/NCBI
|
|
30
|
Yuan L, Yu WM and Qu CK: DNA
damage-induced G2/M checkpoint in SV40 large T antigen-immortalized
embryonic fibroblast cells requires SHP-2 tyrosine phosphatase. J
Biol Chem. 278:42812–42820. 2003. View Article : Google Scholar
|
|
31
|
Yuan L, Yu WM, Yuan Z, Haudenschild CC and
Qu CK: Role of SHP-2 tyrosine phosphatase in the DNA damage-induced
cell death response. J Biol Chem. 278:15208–15216. 2003. View Article : Google Scholar
|
|
32
|
Jiang J, Jin MS, Kong F, Wang YP, Jia ZF,
Cao DH, Ma HX, Suo J and Cao XY: Increased expression of tyrosine
phosphatase SHP-2 in Helicobacter pylori-infected gastric
cancer. World J Gastroenterol. 19:575–580. 2013. View Article : Google Scholar : PubMed/NCBI
|
|
33
|
Meng F, Zhao X and Zhang S: Expression and
significance of SHP-2 in human papillomavirus infected cervical
cancer. J Huazhong Univ Sci Technolog Med Sci. 32:247–251. 2012.
View Article : Google Scholar : PubMed/NCBI
|
|
34
|
Hall M and Peters G: Genetic alterations
of cyclins, cyclin-dependent kinases and Cdk inhibitors in human
cancer. Adv Cancer Res. 68:67–108. 1996. View Article : Google Scholar : PubMed/NCBI
|
|
35
|
Hwang CF, Cho CL, Huang CC, Wang JS, Shih
YL, Su CY and Chang HW: Loss of cyclin D1 and p16 expression
correlates with local recurrence in nasopharyngeal carcinoma
following radiotherapy. Ann Oncol. 13:1246–1251. 2002. View Article : Google Scholar
|
|
36
|
Gulley ML, Nicholls JM, Schneider BG, Amin
MB, Ro JY and Geradts J: Nasopharyngeal carcinomas frequently lack
the p16/MTS1 tumor suppressor protein but consistently express the
retinoblastoma gene product. Am J Pathol. 152:865–869. 1998.
|
|
37
|
Pearce AG, Segura TM, Rintala AC,
Rintala-Maki ND and Lee H: The generation and characterization of a
radiation-resistant model system to study radioresistance in human
breast cancer cells. Radiat Res. 156:739–750. 2001. View Article : Google Scholar
|
|
38
|
Hall EJ and Giaccia A: Radiobiology for
the Radiologist. 7th edition. Section I, Chapter 3: Cell survival
curves. Lippincott Williams & Wilkins; New York: 2011
|
|
39
|
Larsen JK, Landberg G and Roos G:
Detection of proliferating cell nuclear antigen. Methods Cell Biol.
63:419–431. 2001.PubMed/NCBI
|
|
40
|
Shimura T: Acquired radioresistance of
cancer and the AKT/GSK3β/cyclin D1 overexpression cycle. J Radiat
Res. 52:539–544. 2011.PubMed/NCBI
|
|
41
|
Deorukhkar A and Krishnan S: Targeting
inflammatory pathways for tumor radiosensitization. Biochem
Pharmacol. 80:1904–1914. 2010. View Article : Google Scholar : PubMed/NCBI
|
|
42
|
Brizel DM, Sibley GS, Prosnitz LR, Scher
RL and Dewhirst MW: Tumor hypoxia adversely affects the prognosis
of carcinoma of the head and neck. Int J Radiat Oncol Biol Phys.
38:285–289. 1997. View Article : Google Scholar : PubMed/NCBI
|
|
43
|
Feng Z, Xu S, Liu M, Zeng YX and Kang T:
Chk1 inhibitor Gö6976 enhances the sensitivity of nasopharyngeal
carcinoma cells to radiotherapy and chemotherapy in vitro and in
vivo. Cancer Lett. 297:190–197. 2010.
|
|
44
|
Li AA, Ng E, Shi W, Lee A, Chia M, Liu TJ,
Huang D, O’Sullivan B, Gullane P and Liu FF: Potential efficacy of
p16 gene therapy for EBV-positive nasopharyngeal carcinoma. Int J
Cancer. 110:452–458. 2004. View Article : Google Scholar : PubMed/NCBI
|
|
45
|
Gupta S and Ahmed MM: A global perspective
of radiation-induced signal transduction pathways in cancer
therapeutics. Indian J Exp Biol. 42:1153–1176. 2004.PubMed/NCBI
|
|
46
|
Storozhuk Y, Sanli T, Hopmans SN, Schultz
C, Farrell T, Cutz JC, Steinberg GR, Wright J, Singh G and
Tsakiridis T: Chronic modulation of AMP-Kinase, Akt and mTOR
pathways by ionizing radiation in human lung cancer xenografts.
Radiat Oncol. 7:712012. View Article : Google Scholar : PubMed/NCBI
|
|
47
|
Valerie K, Yacoub A, Hagan MP, Curiel DT,
Fisher PB, Grant S and Dent P: Radiation-induced cell signaling:
inside-out and outside-in. Mol Cancer Ther. 6:789–801. 2007.
View Article : Google Scholar : PubMed/NCBI
|