Introduction
The extracellular matrix (ECM) is a complex
three-dimensional network structure composed of macromolecules,
including fibrous protein, proteoglycans and glycoproteins. The ECM
mediates cellular adhesion and is involved in the intracellular
signal transduction pathway, which, in turn, affects the
occurrence, development and metastasis of malignancies (1). The adhesive cell-cell and cell-matrix
attraction may be affected and modified when the cell undergoes
malignant transformation.
A demonstrated that signal transduction of the
urokinase plasminogen activator receptor (uPAR) activates the
Ras-mitogen-activated protein kinase (MAPK) signaling pathway
through the activity of a series of proteases (2). High expression levels of uPA and uPAR
may result in the activation of integrin α5β1 and initiate a
signaling cascade by aggregating the epidermal growth factor
receptor. The signaling cascade subsequently causes a sustained and
high level of extracellular signal-regulated kinase (ERK) activity
and tumorigenicity (3). Integrin
α5β1 is the most important transmembrane receptor in the uPAR
signaling pathway, and may promote the development of malignant
lesions, invasion and metastasis. uPAR, a heavily glycosylated
single-chain glycoprotein, has three homologous domains: D1, D2 and
D3. uPA dissociates these three regional proteins of uPAR into:
uPAR (D1), comprised of the D1 domain, uPAR (D2D3), comprised of
the D2 and D3 domains, uPAR (D1D2), comprised of the D1 and D2
domains, and the alternative splicing isomer of the uPAR gene,
comprised of the D3 domain (4). In
a previous study, the concentration and intensity of uPAR (D1D2)
mRNA were found to be significantly increased in para-carcinoma and
liver cancer tissue in primary culture as compared with normal
tissue (5). The result indicated
that uPAR (D1D2) mRNA overexpression may be due to uPAR isomer
conformational changes, resulting in cell signal conduction
abnormalities. In addition, the overexpression was closely
associated with liver cell differentiation, abnormal clonal
proliferation and increases in the degree of malignant
transformation. Therefore, in the present study, the expression
levels of uPAR (D1D2) and integrin α5β1 in normal, para-carcinoma
and hepatic tissues were detected by polymerase chain reaction
(PCR) and in situ hybridization.
Materials and methods
Liver tissue sample collection
The collection of 60 hepatocellular carcinoma (HCC)
tissue samples (from 42 males and 18 females) and 25 hemangioma
tissue samples (from 18 males and 7 females), from patients with a
pathological diagnosis and surgical resection, was conducted at the
First Affiliated Hospital of Guangxi Medical University (Nanning,
China) between December 2011 and April 2013. Prior to specimen
collection, ethical informed consent was obtained from each
patient. The study was approved by the Ethics Commitee of The First
Affiliated Hospital of Guangxi Medical University (Nanning,
China)
Liver cancer tissues were removed from the cancer
tissues that were not yet necrotic, para-carcinoma tissues were
extracted from areas surrounding the cancer tissues ~2 cm and
normal liver tissues were obtained from hepatic hemangioma patients
undergoing surgical resection. One portion of each tissue sample
was placed in a liquid nitrogen environment until mRNA extraction
was performed, and another portion was fixed using neutral formalin
solution, paraffin-embedded and sectioned.
Instruments and reagents
The following instruments and reagents were used:
Ultraviolet Spectrophotometer (Nanodrap 2000; Thermo Fisher
Scientific, Rockford, IL, USA), ultra-low temperature freezer
(Thermo Forma 984; Thermo Fisher Scientific), Gel Doc™ XP + Gel
imaging system, voltage steady flow electrophoresis apparatus
(DYY-8B), thermal cycling machine (ABI Veriti™) and an inverted
microscope (Nikon Corporation, Tokyo, Japan). Human uPAR (D1D2),
integrin α5, integrin β1, the in situ hybridization kit and
3% hydrogen peroxide were purchased from Wuhan Boster Biological
Techology, Ltd. (Wuhan, China). TRIzol, the RT-PCR kit and the
nucleic acid dye were obtained from Treasure Biological Company
(Dalian, China). The PCR kit and agarose were purchased from Thermo
Fisher Scientific. Primers 1 and 4 were designed by Shanghai Sangon
Biological Engineering Technology & Services Co., Ltd.
(Shanghai, China) and synthesized by Invitrogen Trading Co., Ltd.
(Shanghai, China). Primers 2 (6)
and 3 (7) were synthesized by
Takara Bio, Inc. (Shiga, Japan).
Liver tissue RNA extraction
The liver tissues were removed from the liquid
nitrogen. The required quantity of tissue was added to 1 ml TRIzol
and was then placed on ice for 5–10 min. The tissues were
mechanically homogenized (JB50-S; Shanghai Heying Instrument
Manufacturing Co., Ltd., Shanghai, China) and chloroform was added
at a ratio of 5:1 lysate:chloroform (Shanghai Heying Instrument
Manufacturing Co., Ltd.). The samples were left to rest for 5 min
subsequent to being completely agitated and mixed, then centrifuged
for 15 min (6,720 × g) at 4°C. DNA, protein and RNA were separated
into sublayers, a white middle layer and an upper layer one after
another.
The colorless upper layer of liquid was transferred
to a new Eppendorf tube and an equal volume isopycnic isopropanol
(Shanghai Heying Instrument Manufacturing Co., Ltd.) was added. The
suspension was mixed, incubated at room temperature for 10 min and
centrifuged for 15 min (5,600 × g) at 4°C.
The supernatant was discarded and the white sediment
was retained. A volume of 1 ml 75% absolute ethyl alcohol was
added, the solution was pipetted gently and then centrifuged for 10
min (6,720 × g) at 4°C. The alcohol was carefully discarded and the
above procedure was repeated. The alcohol was added to an
appropriate volume of diethylpyrocarbonate (DEPC; D100T; Sigma) to
dissolve the RNA subsequent to drying in the air for 10 min.
Measurement of RNA purity and PCR
The ultraviolet spectrophotometer was used to
measure the concentration of RNA and the optical density (OD)
value. The RNA purity was deemed to be at an adequate level if the
OD260/OD280 value was between 1.8 and 2.0. The quantity of RNA was
measured using the RT-PCR kit, according to the manufacturer’s
instructions. Reverse transcription was performed using an ABI
Veriti Thermal Cycler instrument (Applied Biosystems, Foster City,
CA, USA). The primers used are listed in Table I.
 | Table IPCR primers. |
Table I
PCR primers.
| Gene | Primer type | Primer sequence | No. of bases | Length (bp) |
|---|
| uPAR (D1D2) | Forward |
5′-GACCTCTGCAGGACCACGAT-3′ | 20 | 367 |
| Reverse |
5′-GGTGGCGGTCATCCTTTG-3′ | 18 | |
| Integrin α5 | Forward |
5′-AAAAACGGGAAGCTCCAAGCCGCA-3′ | 24 | 337 |
| Reverse |
5′-AGGATGATGATCCACAGTGGGACG-3′ | 24 | |
| Integrin β1 | Forward |
5′-GTGGAGAATGTATACAAGCAGGGC-3′ | 24 | 511 |
| Reverse |
5′-TTCCTGAGCTTAGCTGGTGTTGTG-3′ | 24 | |
| GAPDH | Forward |
5′-GGTGCTGAGTATGTCGTGGAG-3′ | 21 | 292 |
| Reverse |
5′-CAGTCTTCTGAGTGGCAGTGAT-3′ | 22 | |
In situ hybridization
The in situ hybridization kit used a
polyphase oligonucleotide probe corresponding to the target gene
labeled with digoxigenin. Table
II shows the mRNA probe sequences of the target genes.
| Table IImRNA probe sequences of the target
genes. |
Table II
mRNA probe sequences of the target
genes.
| Target gene | mRNA probe
sequence |
|---|
| uPAR (D1D2) | 5′-TGTAA GACCA ACGGG
GATTG CCGTG TGGAA GAGTG-3′
5′-CACTC AGAGA AGACC AACAG GACCC TGAGC TATCG-3′
5′-AGGAT GACCG CCACC TCCGT GGCTG TGGCT ACCTT-3′ |
| Integrin α5 | 5′-CAGTG CACCC CCATT
GAATT TGACA GCAAA GGCTC-3′
5′-CAGGA GCAGA TTGCA GAATC TTATT ACCCC GAGTA-3′
5′-ACCAT CTTCC CCGCC ATGTT CAACC CAGAG GAGCG-3′ |
| Integrin β1 | 5′-AAATC TTGTG GAGAA
TGTAT ACAAG CAGGG-3′
5′-CAGTC ACTGA AGAGT TCCAG CCTGT TTACA-3′
5′-GTGCC GTGAC AACTG TGGTC AATCC GAAGT-3′ |
Cover slips and other vessels used in the in
situ hybridization experiment were treated with water
containing 1% DEPC to remove RNA enzymes prior to use. The
experiment was conducted according the manufacturer’s instructions
of the kit and the results were observed under a microscope (Nikon,
Tokyo, Japan).
Calculation of expression level
scores
Positive expression of uPAR (D1D2) and integrin α5β1
was identified in the cytoplasm, exhibiting a yellow granular
appearance. A total of 10 high power fields (HPFs) for each slice
were randomly selected to determine the result and 100 tumor cells
were counted to calculate the percentage of positive cells in each
HPF. To comprehensively determine the expression levels of the two
molecules, positive cell number and stained intensity scores were
used. The positive cell score was calculated as follows: 0 points,
number of positive cells <10%; 1 point, number of positive cells
<25%; 2 points, number of positive cells <50%; 3 points,
number of positive cells >50%. The positive staining intensities
were determined as follows: 0 points indicate negativity,
consistent with the negative control; 1 point indicates low
positive staining, appearing faint yellow (slightly more intense
than the negative control); 2 points indicate positive staining,
appearing medium yellow (more intense than the negative control); 3
points indicated marked positive staining, appearing tan or brown.
The total score of each slide was calculated using the positive
cell number score plus the stained intensity score: 0–2 points
signified low expression levels (−/+), 3–4 points signified medium
expression levels (++) and 5–6 points signified high expression
levels (+++).
Statistical analysis
The PCR results are expressed as gray values (mean ±
standard deviation). The in situ hybridization result was
determined by positive cell number and staining intensity scores.
SPSS version 17.0 (SPSS, Inc., Chicago, IL, USA) was used to
process the data. Pairwise comparisons were calculated using
one-way analysis of variance, categorical variable comparisons were
performed with the χ2 test and correlation analysis was
conducted using Spearman’s rank correlation. P<0.05 was
considered to indicate a statistically significant difference.
Results
uPAR (D1D2) and integrin α5β1 mRNA
expression levels
In the liver cancer and para-carcinoma HCC tissues
and normal liver tissues, uPAR (D1D2; Fig. 1A), integrin α5 (Fig. 1C) and integrin β1 (Fig. 1E) mRNA expression levels were
determined using electrophoresis. The signal intensities in
para-carcinoma and cancer tissues were markedly increased as
compared with those in normal tissue. Water served as a blank
control to exclude specific bands. uPAR (D1D2; Fig. 1B), integrin α5 (Fig. 1D) and integrin β1 (Fig. 1F) samples served as internal
reference bands corresponding to the three target genes. The
function of these bands was to reduce the effect of differences in
the doses of sample injection and the experimental results.
 | Figure 1Electrophoresis results of uPAR isomer
D1D2, integrin α5 and integrin β1 detection in cancer,
paracarcinoma and normal tissue. (A) uPAR (D1D2), (C) integrin α5
and (E) integrin β1. Lane 1, marker; lane 2, cancer tissue; lane 3,
para-carcinoma tissue; lane 4, normal tissue; lane 5, blank
control. (B, D and F) indicate the internal reference bands
corresponding to the three target genes: (B) uPAR (D1D2), (D)
integrin α5 and (F) integrin β1. uPAR, urokinase-type plasminogen
activator receptor. |
IMAGE J software analysis of each sample
and the grey value of the corresponding internal reference
The expression levels of uPAR (D1D2) and integrin
α5β1 mRNA, as determined by PCR, were calculated according to the
following equation: Grey level ratio = (grey value of target band -
grey value of water)/(grey value of internal reference - grey value
of water) (Table III). mRNA
levels of uPar (D1D2), integrin α5 and integrin β1 were increased
in para-carcinoma as compared with those in normal tissues, and
even more increased in carcinoma tissues.
| Table IIIExpression levels of uPAR (D1D2) and
integrin α5β1. |
Table III
Expression levels of uPAR (D1D2) and
integrin α5β1.
| | Grey value ratio |
|---|
| |
|
|---|
| Group | n | uPAR (D1D2) | Integrin α5 | Integrin β1 |
|---|
| Normal tissue | 25 | 0.542±0.048 | 0.509±0.070 | 0.329±0.401 |
| Adjacent tissue | 60 | 0.772±0.063b | 0.735±0.039b | 0.596±0.08b |
| Cancer tissue | 60 | 1.222±0.144a | 1.316±0.108a | 1.168±0.106a |
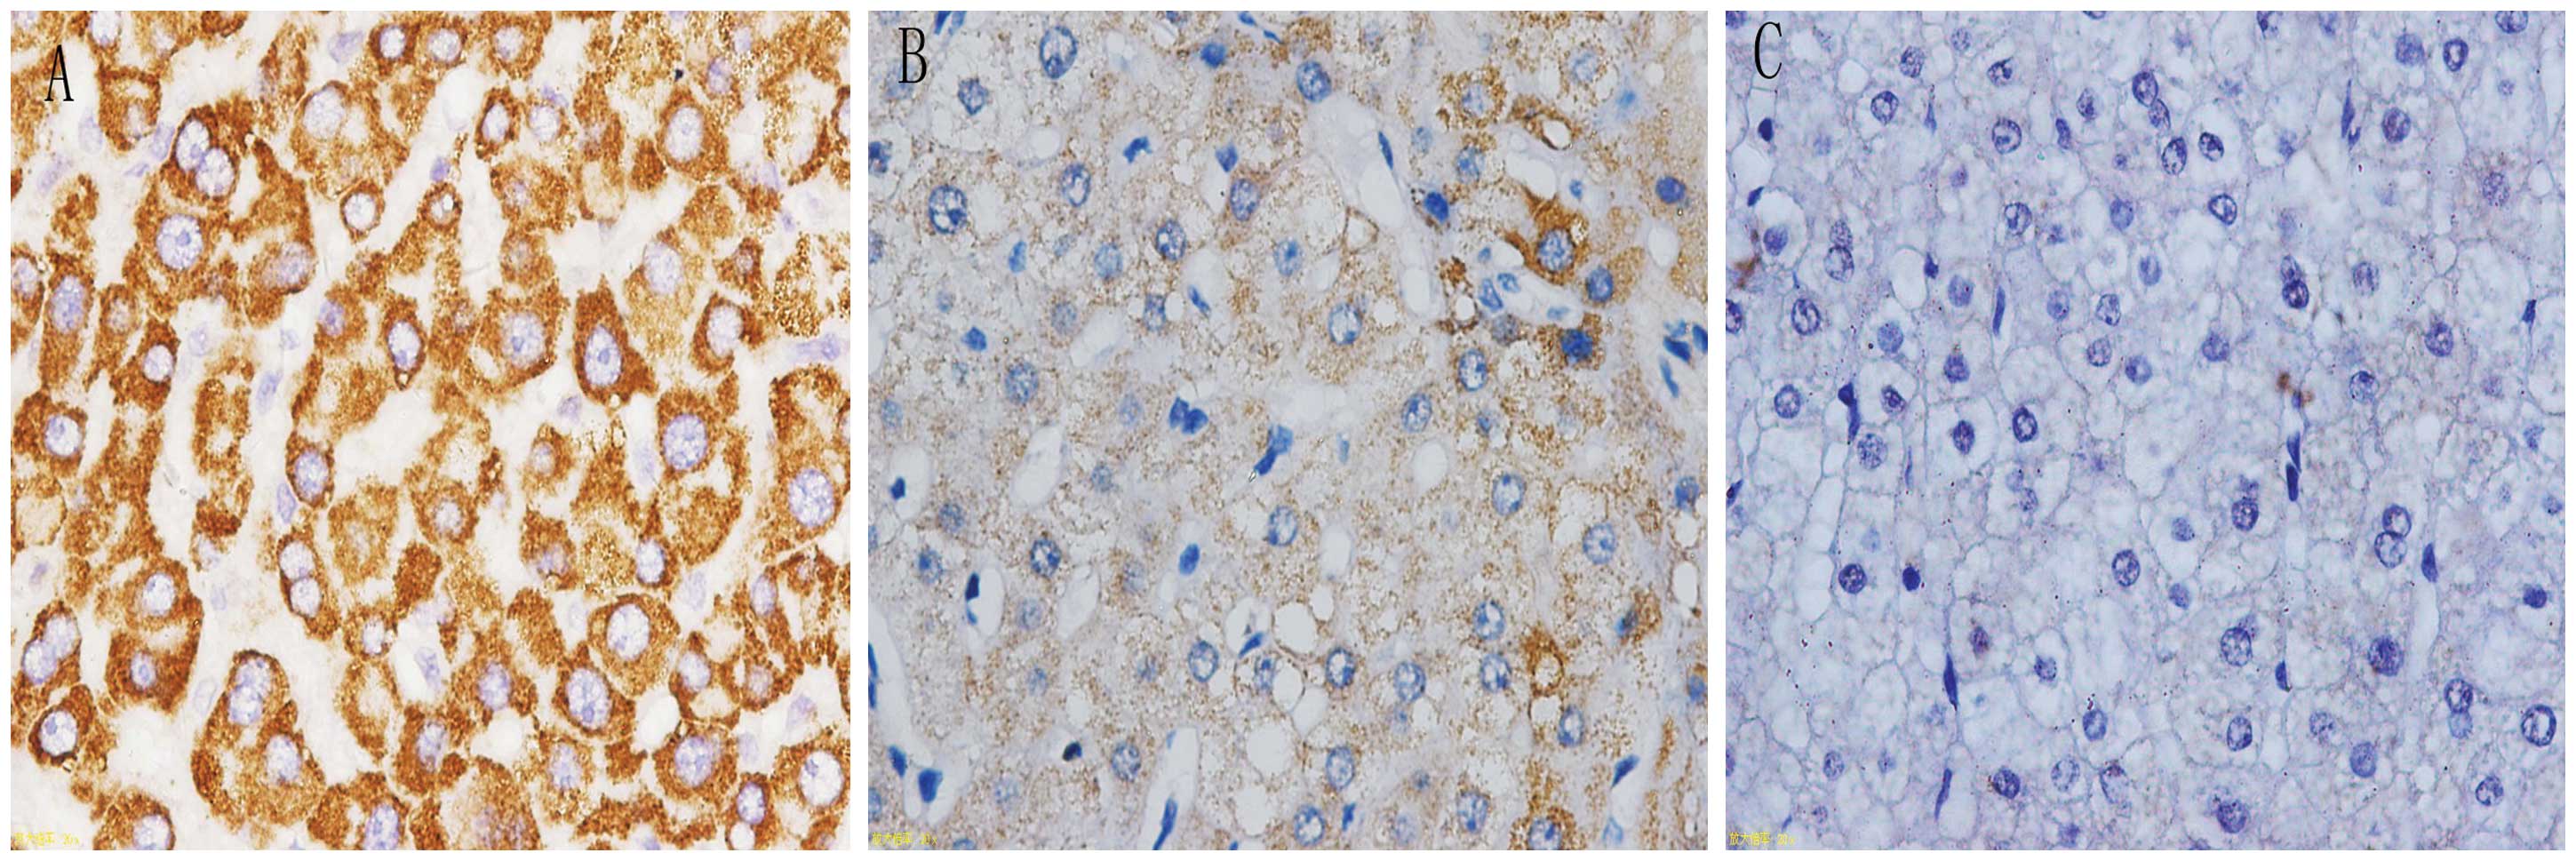
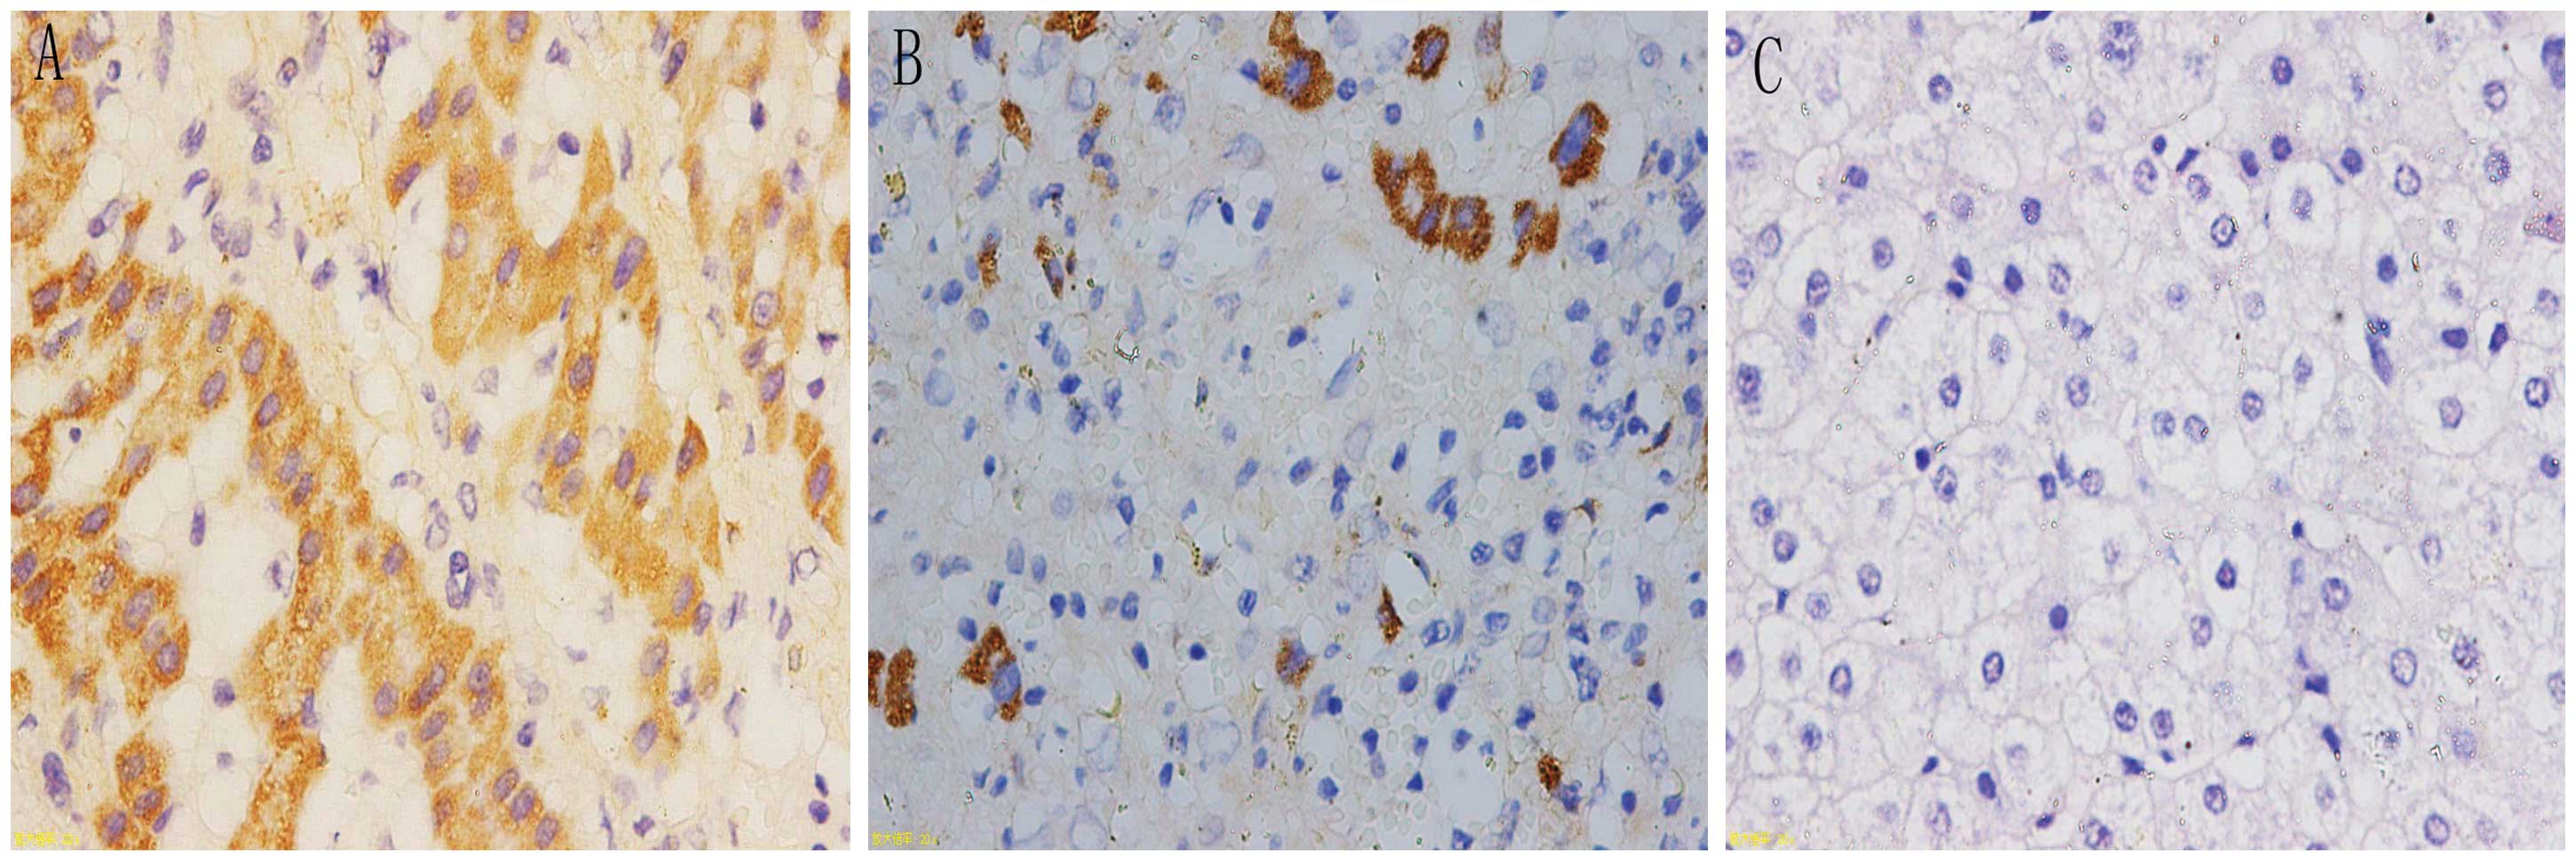
Detection of uPAR (D1D2), integrin α5 and
integrin β1 expression using in situ hybridization
In situ hybridization was observed under a
microscope; positive signaling of the target genes was located in
the cytoplasm and appeared as a tan color. The positive signal
percentages for uPAR (D1D2), integrin α5 and integrin β1 were
highest in cancer tissues, followed by para-carcinoma tissues and
were lowest in the normal liver tissues (Figs. 2–4). Subsequently, the expression levels of
uPAR (D1D2), integrin α5 and integrin β1 in the liver tissues were
calculated from the microscopy results. The adopted positive cell
and staining intensity scores were used to comprehensively
determine the expression levels of the respective molecules
(Table IV).
| Table IVExpression levels of uPAR (D1D2),
integrin α5 and integrin β1 in liver tissue. |
Table IV
Expression levels of uPAR (D1D2),
integrin α5 and integrin β1 in liver tissue.
| | | Staining results | |
|---|
| | |
| |
|---|
| Gene | Group | n | − | + | ++ | +++ | Positive rate
(%) |
|---|
| uPAR (D1D2) | Normal tissue | 25 | 16 | 6 | 3 | 0 | 36.0a |
| Adjacent tissue | 60 | 24 | 12 | 16 | 8 | 60.0b |
| Cancer tissue | 60 | 10 | 4 | 25 | 21 | 83.3 |
| Integrin α5 | Normal tissue | 25 | 22 | 3 | 0 | 0 | 12.0a |
| Adjacent
tissue | 60 | 38 | 6 | 12 | 4 | 36.7b |
| Cancer tissue | 60 | 21 | 7 | 18 | 14 | 65.0 |
| Integrin β1 | Normal tissue | 25 | 22 | 2 | 1 | 0 | 12.0b |
| Adjacent
tissue | 60 | 37 | 8 | 10 | 5 | 38.3b |
| Cancer tissue | 60 | 23 | 6 | 15 | 16 | 61.7 |
The correlations among the expression levels of uPAR
(D1D2) and integrin α5β1 in HCC, and the clinical pathological
features were determined to be as follows: The positive rate of
uPAR (D1D2) in HCC was not correlated with α fetal protein (AFP),
ferritin (SF), pathologic stage or tumor size, but was correlated
with DNA copy number. When the DNA copy number was
>1.0×10³, the positive percentage of uPAR (D1D2) was
90.7%; When the DNA copy number was <1.0×10³, the
positive percentage was 64.7% and a statistically significant
difference was detected between the two groups (P<0.05). The
integrin α5β1 expression levels did not correlate with AFP, SF,
hepatitis B virus (HBV) DNA copy number or tumor size (P>0.05),
but correlated with the pathologic stage. At different pathological
stages, the percentages of positive integrin α5β1 in HCC were
significantly different (P<0.05).
The correlation between the expression intensities
of uPAR (D1D2) and integrin α5β1 in HCC tissues was positive. Thus,
a synergistic effect between the expression levels of the two
molecules may be considered (rs1=0.257, P<0.05;
rs2=0.261, P<0.05; Tables V and VI).
| Table VCorrelation between uPAR (D1D2)
expression and integrin α5 expression in HCC. |
Table V
Correlation between uPAR (D1D2)
expression and integrin α5 expression in HCC.
| Integrin α5
expression | uPAR (D1D2)
expression | Total |
|---|
|
|---|
| − | + | ++ | +++ |
|---|
| − | 7 | 1 | 8 | 5 | 21 |
| + | 1 | 0 | 4 | 2 | 7 |
| ++ | 0 | 2 | 9 | 7 | 18 |
| +++ | 2 | 1 | 4 | 7 | 14 |
| Total | 10 | 4 | 25 | 21 | 60 |
| Table VICorrelation between uPAR (D1D2)
expression and integrin β1 expression in HCC. |
Table VI
Correlation between uPAR (D1D2)
expression and integrin β1 expression in HCC.
| Integrin β1
expression | uPAR (D1D2)
expression | Total |
|---|
|
|---|
| − | + | ++ | +++ |
|---|
| − | 5 | 1 | 13 | 4 | 23 |
| + | 2 | 1 | 1 | 2 | 6 |
| ++ | 1 | 1 | 6 | 7 | 15 |
| +++ | 2 | 1 | 5 | 8 | 16 |
| Total | 10 | 4 | 25 | 21 | 60 |
Discussion
Tumor transformation, growth, invasion and
metastasis is a complex interaction process between tumor cells and
the rest of the body. In this process, the various proteases
adhered to the ECM (including serine proteases and matrix
metalloproteinases) and growth factors (such as the integrin family
and epidermal growth factor) are crucial (8).
Increasing evidence suggests that tumor-associated
mRNA may induce tumor cells to produce special function proteins
closely associated with cancer occurrence and development. uPAR is
an important factor in the urokinase system; certain studies have
shown that uPAR mRNA is a specific marker of malignant
transformation and metastasis in stomach cancer, colon cancer and
non-small cell lung cancer (9–11).
mRNA splice variants are considered specific sequences of
diagnostic malignancy (12,13),
which may render certain protein areas missing, and subsequently
result in loss or change of function, or the development of a novel
function. There are multiple mRNA splice variants of uPAR; studies
have demonstrated that these splice variants exert a marked effect
in breast cancer, small cell lung cancer and other malignancies
(14–17). In the present study, PCR and in
situ hybridization techniques were used to detect the
expression levels of uPAR (D1D2) mRNA in the liver cancer,
para-neoplastic and normal tissues. The expression levels of the
uPAR (D1D2) splice variant were observed to be significantly
different in HCC, para-carcinoma and normal liver cells and in
primary culture; the expression levels of uPAR (D1D2) exhibited an
upward trend with liver cancer development. The expression
intensity of uPAR (D1D2) in HCC was not associated with AFP, SF,
pathological stage or tumor size, but was associated with the HBV
DNA copy number (P<0.05). This is consistent with the previous
results of primary cultured hepatoma cells. Continuous replication
HBV activates particular proto-oncogenes, but renders certain
tumor-suppressor genes inactive and mutational, thus promoting the
occurrence of cancer. The integration of virus DNA may increase the
occurrence of the HBV X antigen and induce malignant transformation
of liver cells (18).
Integrins are a group of transmembrane glycoprotein
receptors widely distributed on cell surfaces. In addition to
mediating adhesion between the cell and the ECM, integrins affect
ECM degradation and tumor cell chemotaxis, proliferation, apoptosis
and metastasis (19). Integrin
α5β1 is an important member of the integrin family. A number of
studies have demonstrated the association between integrin α5β1 and
numerous types of cancer, including liver, breast and colorectal
cancer (20–21). Furthermore, uPA and uPAR,
overexpressed in cancer cells, frequently combine with integrin
α5β1 to form uPA-uPAR-α5β1 complexes, which induce the activation
of signaling pathways to alter cell adhesion, proliferation and
migration (22). Aguirre Aguirre
Ghiso et al (23)
considered the interaction between uPAR and integrin α5β1 on the
cell surface to induce a series of reactions and this interaction
may be involved in MAPK-ERK signaling pathway activation,
eventually resulting in head and neck tumors, as determined in head
and neck cancer models. Wei et al (24) deemed that the binding between uPAR
and α5β1 requires maximum fibrin and tumor cell invasion, for which
enhancement of the Src/Rac/ERK signaling pathway is necessary. In
the present study, PCR and in situ hybridization were
employed to detect the expression levels of integrin α5 and
integrin β1 mRNA in HCC, para-carcinoma and normal liver tissues.
Similar findings to those for uPAR (D1D2) were obtained; integrin
α5β1 expression levels in HCC tissues were higher than those in
para-carcinoma and normal liver tissues. Thus, the expression
levels of integrin α5β1 in HCC were associated with the
pathological stage, and the associations among integrin α5β1
expression levels, liver cancer differentiation and malignant
transformation are inextricable. The results also revealed that
uPAR (D1D2) and integrin α5β1 expression levels in HCC were
positively correlated, and exerted a synergistic effect in cancer
occurrence and development. The correlation between uPAR (D1D2)
expression levels and liver cancer malignant transformation was
initially observed in a previous study (5), but the correlation between integrin
α5β1 expression levels and liver cancer, and the synergistic effect
of uPAR (D1D2) and integrin α5β1 in HCC had not yet been reported,
to the best of our knowledge.
In conclusion, the results of the present study
demonstrated that the synergy of uPAR (D1D2) and integrin α5β1
expression in hepatocytes was closely associated with the
occurrence of liver cancer and subsequent metastasis. The cell
signal transduction pathways and gene therapy as anticancer
strategies have become a predominant focus of cancer research. It
has been found that the cell signal transduction pathways of
different types of uPAR isomers and integrin-α5β1 are correlated
with tumorigenesis but the mechanism has not been fully elucidated.
Thus further studies will aim to determine the underlying
mechanisms.
References
|
1
|
Stetler-Stevenson WG, Aznavoorian S and
Liotta LA: Tumor cell interactions with the extracellular matrix
during invasion and metastasis. Annu Rev Cell Biol. 9:541–573.
1993. View Article : Google Scholar : PubMed/NCBI
|
|
2
|
Scaltriti M and Baselga J: The epidermal
growth factor receptor pathway: a model for targeted therapy. Clin
Cancer Res. 12:5268–5272. 2006. View Article : Google Scholar : PubMed/NCBI
|
|
3
|
Liu D, Aguirre Ghiso J, Estrada Y and
Ossowski L: EGFR is a transducer of the urokinase receptor
initiated signal that is required for in vivo growth of a human
carcinoma. Cancer Cell. 1:445–457. 2002. View Article : Google Scholar : PubMed/NCBI
|
|
4
|
Piironen T, Laursen B, Pass J, et al:
Specific immunoassays for detection of intact and cleaved forms of
the urokinase receptor. Clin Chem. 50:2059–2068. 2004. View Article : Google Scholar : PubMed/NCBI
|
|
5
|
Zhou Y, Lu X, Li S and Zhan L: Correlation
between the overexpression of urokinase receptor isoform uPAR
(D1D2) and hepatic cell malignant transformation. Mol Med Rep.
9:1689–1696. 2014.PubMed/NCBI
|
|
6
|
Hsu SL, Chenga CC, Shi YR and Chiang CW:
Proteolysis of integrin α5 and β1 subunits involved in retinoic
acid-induced apoptosis in human hepatoma Hep3B cells. Cancer Lett.
167:193–204. 2001.
|
|
7
|
Barillari G, Albonici L, Incerpi S, et al:
Inflammatory cytokines stimulate vascular smooth muscle cells
locomotion and growth by enhancing α5β1 integrin expression and
function. Atherosclerosis. 154:377–385. 2001.PubMed/NCBI
|
|
8
|
Bezdenezhnykh N, Semesiuk N, Lykhova O, et
al: Impact of stromal cell components of tumor microenvironment on
epithelial-mesenchymal transition in breast cancer cells. Exp
Oncol. 36:72–78. 2014.PubMed/NCBI
|
|
9
|
Kita Y, Fukagawa T, Mimori K, et al:
Expression of uPAR mRNA in peripheral blood is a favourite marker
for metastasis in gastric cancer cases. Br J Cancer. 100:153–159.
2009. View Article : Google Scholar : PubMed/NCBI
|
|
10
|
Dang J, Wang Y and Doe WF: Sodium butyrate
inhibits expression of urokinase and its receptor mRNAs at both
transcription and post-transcription levels in colon cancer cells.
FEBS Lett. 359:147–150. 1995. View Article : Google Scholar : PubMed/NCBI
|
|
11
|
Montuori N, Mattiello N, Mancini A, et al:
Urokinase-mediated posttranscriptional regulation of
urokinase-receptor expression in non small cell lung carcinoma. Int
J Cancer. 105:353–360. 2003. View Article : Google Scholar : PubMed/NCBI
|
|
12
|
Groenendijk FH, Zwart W, Floore A, Akbari
S and Bernards R: Estrogen receptor splice variants as a potential
source of false-positive estrogen receptor status in breast cancer
diagnostics. Breast Cancer Res Treat. 140:475–484. 2013.
|
|
13
|
Tian T, Shu Y, Chen J, et al: A functional
genetic variant in microRNA-196a2 is associated with increased
susceptibility of lung cancer in Chinese. Cancer Epidem Biomarkers
Prev. 18:1183–1187. 2009. View Article : Google Scholar : PubMed/NCBI
|
|
14
|
Grismayer B, Sato S, Kopitz C, et al:
Overexpression of the urokinase receptor splice variant uPAR-del4/5
in breast cancer cells affects cell adhesion and invasion in a
dose-dependent manner and modulates transcription of
tumor-associated genes. Biol Chem. 393:1449–1455. 2012. View Article : Google Scholar
|
|
15
|
Sato S, Kopitz C, Grismayer B, et al:
Overexpression of the urokinase receptor mRNA splice variant
uPAR-del4/5 affects tumor-associated processes of breast cancer
cells in vitro and in vivo. Breast Cancer Res Treat. 127:649–657.
2011. View Article : Google Scholar
|
|
16
|
Almasi CE, Drivsholm L, Pappot H,
Høyer-Hansen G and Christensen IJ: The liberated domain I of
urokinase plasminogen activator receptor - a new tumour marker in
small cell lung cancer. APMIS. 121:189–196. 2013. View Article : Google Scholar : PubMed/NCBI
|
|
17
|
Parise LV, Lee J and Juliano RL: New
aspects of integrin signaling in cancer. Semin Cancer Biol.
10:407–414. 2000. View Article : Google Scholar : PubMed/NCBI
|
|
18
|
Yao M, Zhou XD, Zha XL, et al: Expression
of the integrin α5 subunit and its mediated cell adhesion in
hepatocellular carcinoma. J Cancer Res Clin Oncol. 123:435–440.
1997.
|
|
19
|
Korah R, Boots M and Wieder R: Integrin
α5β1 promotes survival of growth-arrested breast cancer cells: an
in vitro paradigm for breast cancer dormancy in bone marrow. Cancer
Res. 64:4514–4522. 2004.
|
|
20
|
Jayne DG, Heath RM, Dewhurst O, Scott N
and Guillou PJ: Extracellular matrix proteins and
chemoradiotherapy: α5β1 integrin as a predictive marker in rectal
cancer. Eur J Surg Oncol. 28:30–36. 2002.
|
|
21
|
Su Q, Schröder CH, Hofmann WJ, et al:
Expression of hepatitis B virus X protein in HBV-infected human
livers and hepatocellular carcinomas. Hepatology. 27:1109–1120.
1998. View Article : Google Scholar : PubMed/NCBI
|
|
22
|
Ossowski L and Aguirre-Ghiso JA: Urokinase
receptor and integrin partnership: coordination of signaling for
cell adhesion, migration and growth. Curr Opin Cell Biol.
12:613–620. 2000. View Article : Google Scholar : PubMed/NCBI
|
|
23
|
Aguirre Ghiso JA, Kovalski K and Ossowski
L: Tumor dormancy induced by downregulation of urokinase receptor
in human carcinoma involves integrin and MAPK signaling. J Cell
Biol. 147:89–104. 1999.PubMed/NCBI
|
|
24
|
Wei Y, Tang CH, Kim Y, et al: Urokinase
receptors are required for α5β1 integrin-mediated signaling in
tumor cells. J Biol Chem. 282:3929–3939. 2007.
|