Introduction
Psoriasis is an autoimmune chronic inflammatory skin
disease that is characterized by sharply demarcated, red, scaly
lesions of varying extent. It is a long-lasting disease with a
prevalence of 0–11.8% worldwide and high recurrence rate at any
time (1,2). In addition, psoriasis may increase
the risk of certain other diseases, including stroke and myocardial
infarction (3). Psoriasis is a
multifactorial disease which can be influenced by genetic as well
as environmental factors. Two hypotheses have been posed regarding
the pathogenesis of psoriasis: i) Immune system disorders and ii)
excessive growth of skin cells (2). However, the exact etiology of
psoriasis has remained to be elucidated.
Previous studies have used microarray or RNA
sequencing for comparing the gene expression profiles between skin
of patients with lesional psoriasis or non-lesional psoriasis as
well as that of healthy controls, and certain key genes or pathways
have been identified. Through gene expression profiling of
lesional/non-lesional skin from psoriasis patients and normal skin
from healthy controls based on the Affymetrix HG-U133 plus 2
platform, Nair et al (4)
found that the interleukin (IL)-23 and nuclear factor-kappaB
pathways were closely associated with psoriasis. Krueger et
al (5) identified IL-17A as an
important molecule in the process of cell activation and
inflammatory gene circuits in psoriasis patients through comparing
the gene expression profiles between skin samples of patients with
lesional psoriasis treated with LY2439821- or placebo at different
time-points. In addition, the expression patterns of certain
psoriasis-associated genes exhibited marked differences between
lesional skin and non-lesional skin in patients with psoriasis
(2). Genes associated with immune
response or epidermal cell proliferation are usually upregulated in
skin affected by lesional psoriasis. DOUX2 was found to be
upregulated in lesional skin compared with non-lesional skin in
patients with psoriasis and atopic dermatitis (6). As an autoimmune disease, psoriasis is
largely mediated by the disorder of T-cells. Certain genes or
proteins were found to be up- or down-regulated in numerous types
of cell through the regulation of T-cells. Yin et al
(7) reported that compared with
those in normal controls the expression levels of mRNA and protein
of Notch 1 and Hes-1 in CD34+ cells, which are largely mediated by
T cells, were upregulated in patients with psoriasis. However,
previous studies on psoriasis have reported hundreds of
differentially expressed genes (DEGs) and pathways or biological
processes they were involved in, and their data require further
processing for discarding of genes and pathways with only minor
changes in psoriasis.
Gene set enrichment analysis (GSEA) is the most
well-known enrichment analysis method and is contained in numerous
freely available platforms, such as R, Java and GenePattern. It can
be used to analyze gene expression microarray data based on the
gene expression levels between different statuses (such as tumor
vs. normal samples) and the pre-defined gene sets in the Molecular
Signatures Database (http://www.broadinstitute.org/gsea/msigdb/index.jsp)
(8). Compared with the traditional
DEG analysis (DEGA) method, GSEA can detect subtle changes in
individual genes in diseases, which can be helpful in the detection
of biomarkers that can be missed by other methods. The leading-edge
analysis of GSEA results is useful for identifying gene sub-sets
from the pool of DEGs (8).
The present study applied the traditional DEGA
method and GSEA on a microarray dataset from Gene Expression
Omnibus (GEO; http://www.ncbi.nlm.nih.gov/geo/). Gene expression
levels in lesional skin from patients with psoria were compared
with those in non-lesional skin from patients with psoriasis as
well as skin samples from healthy controls to identify the DEGs.
GSEA was performed to identify overrepresented KEGG pathways in
lesional skin from patients with psoriasis and leading-edge
analysis was then performed for identifying key KEGG pathways. DEGs
that were contained in the overrepresented KEGG pathways were
considered as key genes. The present study identified several
previously known as well as novel biomarkers associated with
psoriasis.
Materials and methods
Microarray data and pre-processing
Gene expression profiles were extracted from the
study by Nair et al (4),
whose data were deposited in the GEO database with the accession
number GSE13355. A total of 180 samples were contained in the
dataset, which included 58 lesional (PP) and non-lesional (PN) skin
samples from patients with psoriasis and 64 normal skin (NN)
samples from healthy controls. The Affymetrix HG-U133 plus2
platform (GPL570; Affymetrix, Inc., Santa Clara, CA, USA) was used
for the genome expression profiling, which contains 54,675
probes.
The raw CEL files were imported into R. Background
correction, normalization and log2 transformation were performed
based on the robust multiarray average method embedded in the Affy
package (9) in Bioconductor
version 2.13 (https://bioconductor.org/). The annotation packages
hgu133plus2.db, hgu133plus2cdf and hgu133plus2probe were used to
transform the probe-level data into the gene-level data. The mean
expression value was calculated for genes corresponding to multiple
probes.
Identification of DEGs
DEGs of PP compared with PN and NN were obtained
through Student's t-test and Benjamini-Hochberg correction
based on the R limma package (10). Screening thresholds for DEGs were
adjusted to P<0.05 and fold change >2.
GSEA
GSEA is supported by the Broad Institute website
(http://www.broadinstitute.org/gsea/index.jsp) and
mainly embedded in three platforms: R, Java and GenePattern. It can
be used to determine whether the members of a gene set are
primarily distributed in the top or the bottom of the ranked gene
list or randomly distributed in the list. In the present study,
GSEA and traditional DEGA were combined to identify the potential
biomarkers of psoriasis. GSEA was conducted based on the Java
implementation and was performed using the KEGG pathway gene sets
in the Molecular Signatures Database against two probe-level
expression matrices: One was comprised of the PP and PN samples and
another was comprised of PP and NN samples. GSEA was performed
using default parameters, with a number of genes in the gene sets
of 15–500 and a permutation test time of 1,000. Cut-off of the
false-discovery rate (FDR) was set to 0.05 for the significant KEGG
pathways. Furthermore, DEGs contained in significant KEGG pathways
were considered as key genes involved in the incidence of
psoriasis. The Database for Annotation, Visualization and
Integrated Discovery (DAVID) v6.7 (11) (http://david.abcc.ncifcrf.gov/) was used to annotate
the key genes, and gene ontology (GO) terms with FDR<0.05 were
selected.
Leading-edge analysis
Leading-edge analysis can be used to extract the
core members in the gene sets, i.e. leading-edge sub-sets. The
significant gene sets can be grouped based on the common genes in
their leading-edge sub-sets, which can reveal gene sets highly
associated with the disease. In the present study, the GSEA results
for PP and PN, and PP and NN were subjected to leading-edge
analysis to identify key KEGG pathways in psoriasis.
Results
DEGs
A total of 540 genes were found to be differentially
expressed in PP compared with NN, of which, 167 were downregulated
and 374 were upregulated. In addition, 452 DEGs between PP and PN
were identified, which contained 121 downregulated and 331
upregulated ones. A total of 422 genes were shared between the two
lists of DEGs.
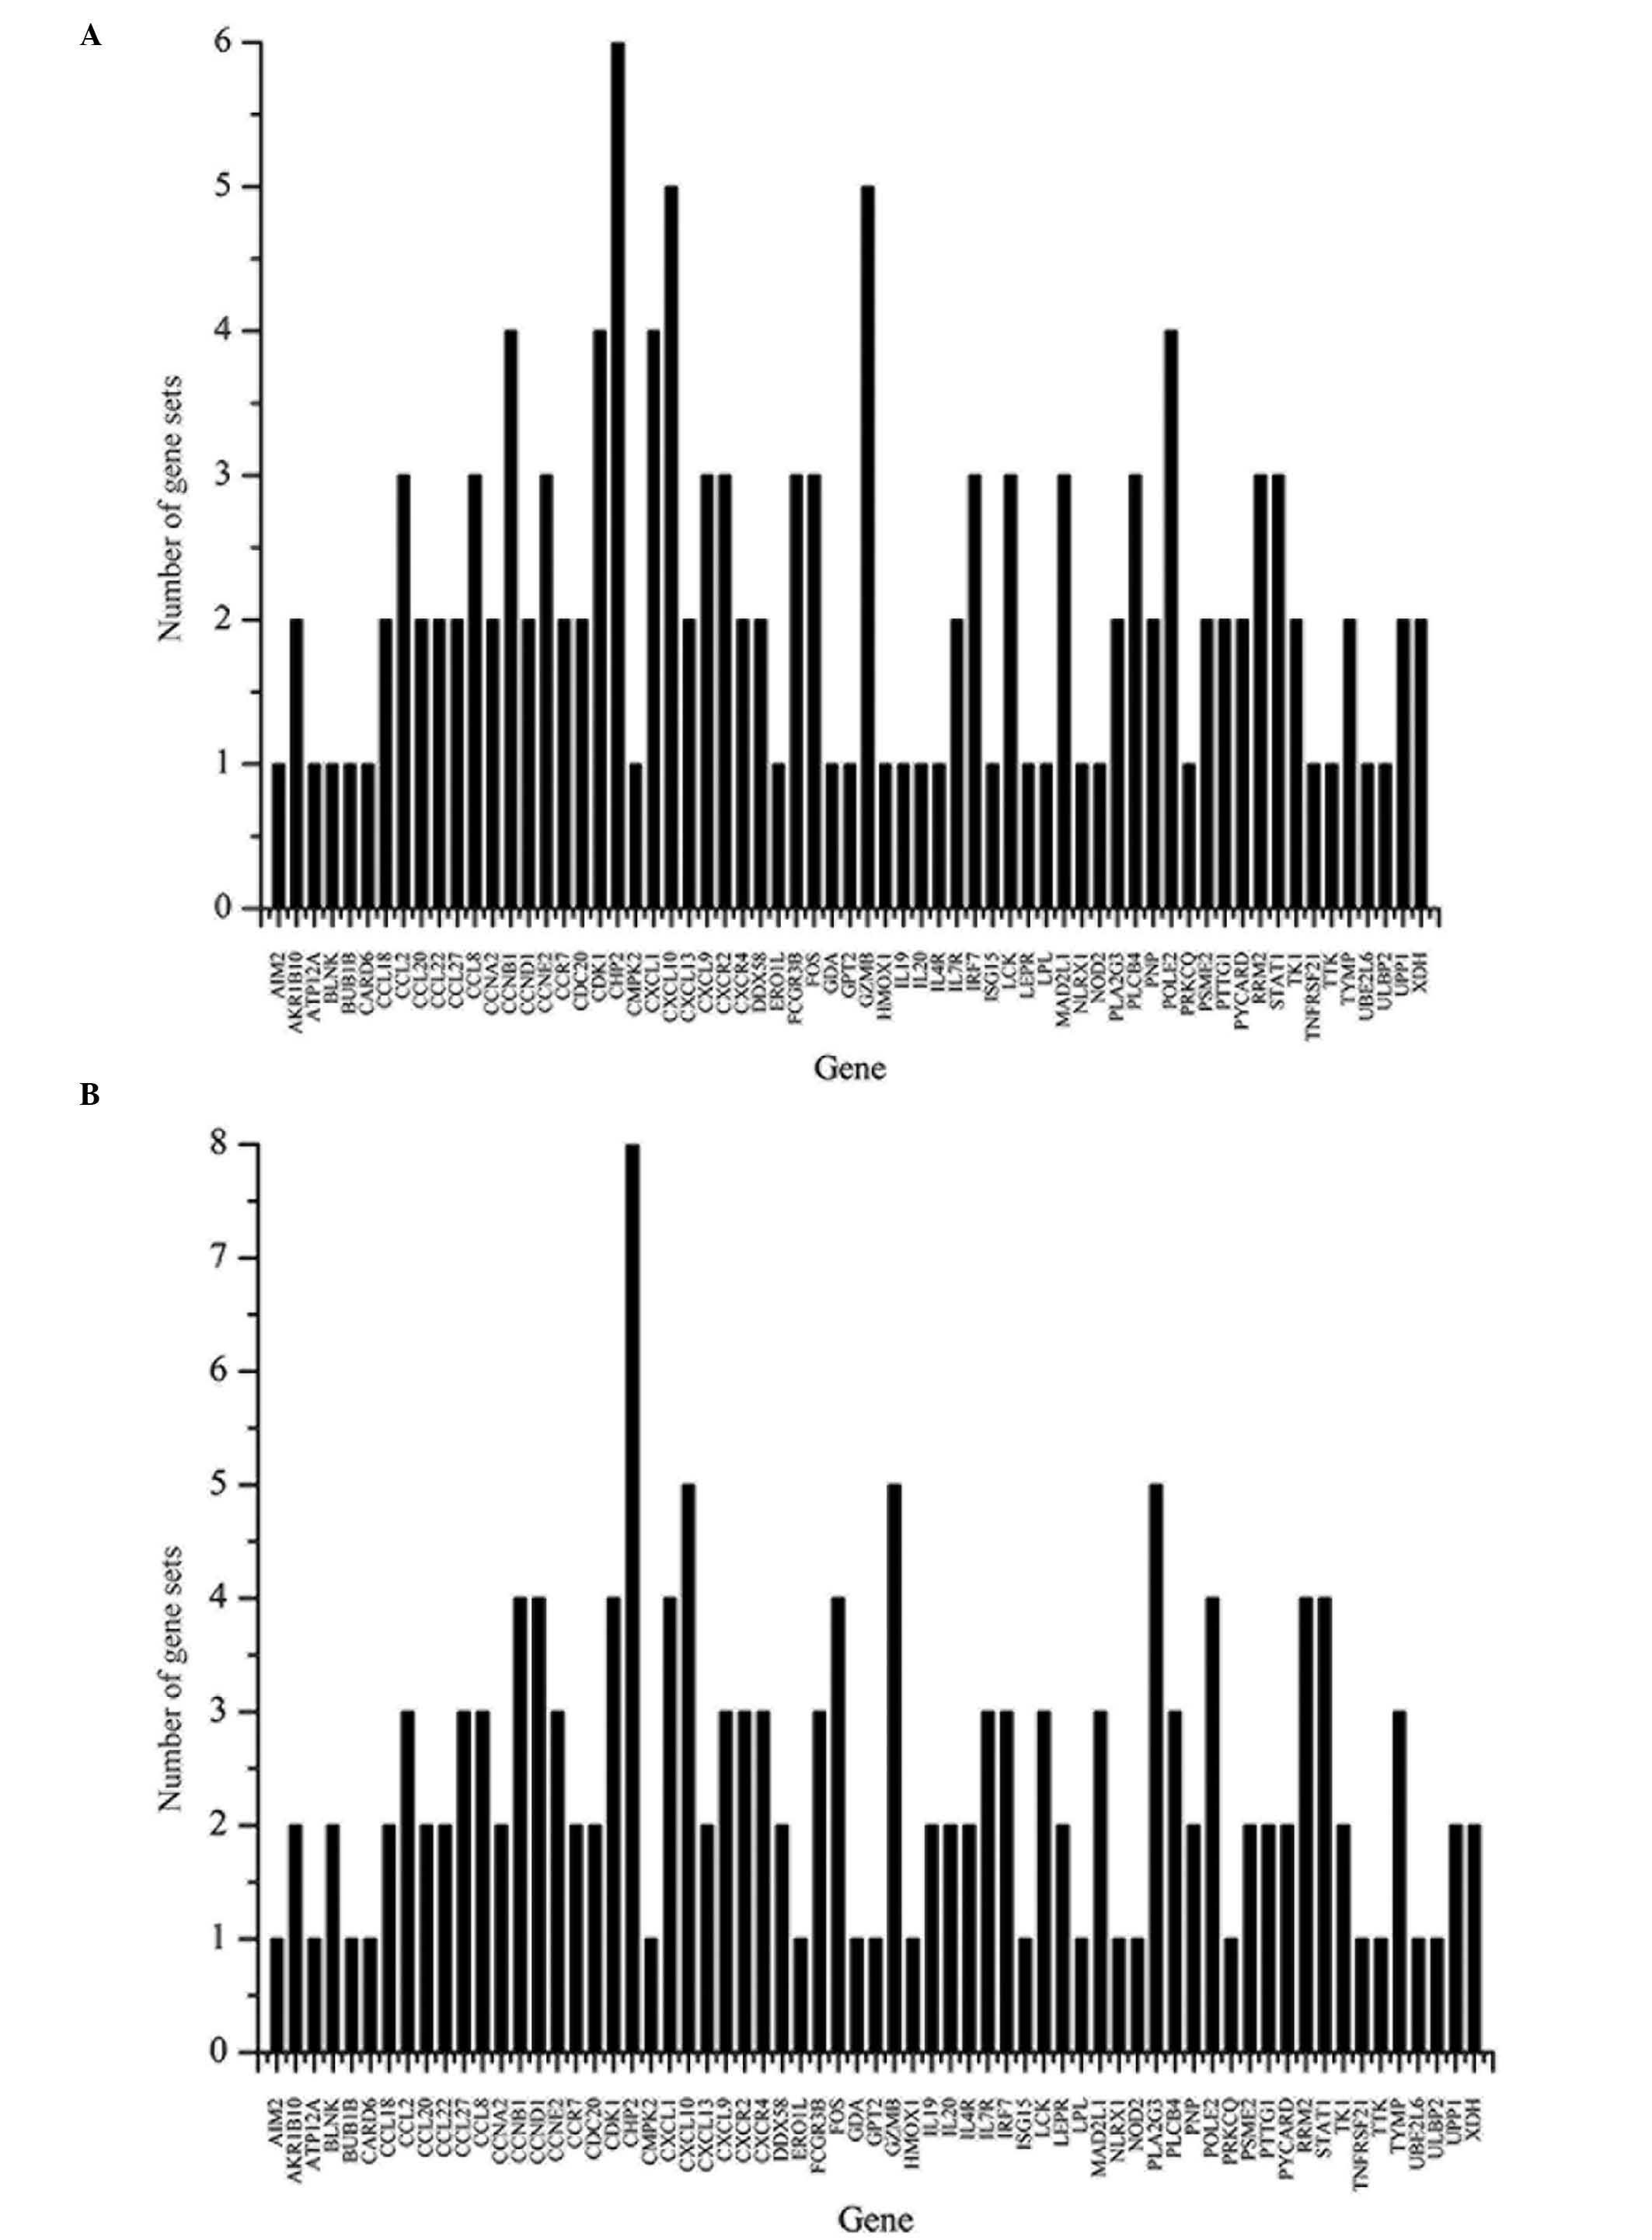
GSEA and key genes
GSEA of PP and NN samples revealed that 47 KEGG
pathways were significantly enriched in PP (Table I). Furthermore, GSEA of PP and PN
samples resulted in 67 significantly enriched KEGG pathways in PP
(Table II). All of the KEGG
pathways identified were downregulated in PP and 46 of these
pathways overlapped between PP and PN. 65 of the 422 overlapping
DEGs were involved in the 46 overlapping KEGG pathways and those
genes were considered as key genes associated with the incidence of
psoriasis. The number of KEGG pathways that every key gene was
involved in is shown in Fig. 1.
Biological processes, including immune response, chemokine activity
and inflammatory response were found to be significantly enriched
in those genes. The full list of enriched GO terms is shown in
Table III.
 | Table ISignificantly enriched KEGG pathways
in lesional psoriasis obtained by gene set enrichment analysis of
lesional skin samples from patients with psoriasis and skin samples
from healthy individuals. |
Table I
Significantly enriched KEGG pathways
in lesional psoriasis obtained by gene set enrichment analysis of
lesional skin samples from patients with psoriasis and skin samples
from healthy individuals.
| KEGG pathway | NES | FDR |
|---|
| Phenylalanine
metabolism | −2.160 | <0.001 |
| Cytosolic DNA sensing
pathway | −2.132 | 0.001 |
| RIG I-like receptor
signaling pathway | −2.045 | 0.004 |
| Drug metabolism,
other enzymes | −2.054 | 0.005 |
| Cell cycle | −2.027 | 0.005 |
| NOD-like receptor
signaling pathway | −2.001 | 0.006 |
| Purine
metabolism | −1.989 | 0.006 |
| Fructose and mannose
metabolism | −2.001 | 0.007 |
| Pyrimidine
metabolism | −1.969 | 0.008 |
| Oxidative
phosphorylation | −1.921 | 0.012 |
| Oocyte meiosis | −1.943 | 0.012 |
| p53 signaling
pathway | −1.933 | 0.012 |
| Alzheimer's
disease | −1.906 | 0.012 |
| Toll-like receptor
signaling pathway | −1.923 | 0.012 |
| Primary
immunodeficiency | −1.908 | 0.012 |
| Linoleic acid
metabolism | −1.845 | 0.018 |
| Porphyrin and
chlorophyll metabolism | −1.850 | 0.018 |
| Base excision
repair | −1.840 | 0.018 |
| Natural killer
cell-mediated cytotoxicity | −1.858 | 0.018 |
| Huntington's
disease | −1.816 | 0.018 |
| Proteasome | −1.851 | 0.018 |
| Antigen processing
and presentation | −1.834 | 0.018 |
| Homologous
recombination | −1.808 | 0.018 |
| Aminoacyl tRNA
biosynthesis | −1.810 | 0.019 |
| Cysteine and
methionine metabolism | −1.861 | 0.019 |
| Parkinson's
disease | −1.826 | 0.019 |
| Epithelial-cell
signaling in Helicobacter pylori infection | −1.818 | 0.019 |
| DNA Replication | −1.864 | 0.019 |
| Apoptosis | −1.819 | 0.019 |
| Chemokine signaling
pathway | −1.794 | 0.021 |
| RNA polymerase | −1.752 | 0.031 |
| Arginine and proline
metabolism | −1.742 | 0.031 |
| Leishmania
infection | −1.746 | 0.031 |
| Autoimmune thyroid
disease | −1.737 | 0.032 |
| Graft-versus-host
disease | −1.730 | 0.033 |
| Progesterone-mediated
oocyte maturation | −1.721 | 0.033 |
| Riboflavin
metabolism | −1.722 | 0.034 |
| Alanine aspartate and
glutamate metabolism | −1.722 | 0.035 |
| Arachidonic acid
metabolism | −1.708 | 0.037 |
| Allograft
rejection | −1.695 | 0.039 |
| Vibrio
cholerae infection | −1.697 | 0.039 |
| Tyrosine
metabolism | −1.690 | 0.040 |
| Amyotrophic lateral
sclerosis | −1.679 | 0.042 |
| Cytokine-cytokine
receptor interaction | −1.675 | 0.043 |
| Type I diabetes
mellitus | −1.680 | 0.043 |
| Systematic lupus
erythematosus | −1.658 | 0.047 |
| T-cell receptor
signaling pathway | −1.661 | 0.047 |
| Table IISignificantly enriched KEGG pathways
in lesional psoriasis obtained by gene set enrichment analysis of
lesional and non-lesional skin samples from patients with
psoriasis. |
Table II
Significantly enriched KEGG pathways
in lesional psoriasis obtained by gene set enrichment analysis of
lesional and non-lesional skin samples from patients with
psoriasis.
| KEGG pathway | NES | FDR |
|---|
| NOD-like receptor
signaling pathway | −1.982 | 0.005 |
| Phenylalanine
metabolism | −1.971 | 0.005 |
| Pyrimidine
metabolism | −1.967 | 0.005 |
| Oocyte meiosis | −2.043 | 0.005 |
| Oxidative
phosphorylation | −1.983 | 0.005 |
| Vibrio
cholerae infection | −1.992 | 0.005 |
| Parkinson's
disease | −1.953 | 0.005 |
| Huntington's
disease | −1.960 | 0.005 |
| Cell cycle | −1.984 | 0.005 |
| Purine
metabolism | −1.998 | 0.006 |
| Leishmania
infection | −1.927 | 0.006 |
| Primary
immunodeficiency | −1.935 | 0.006 |
| Alzheimer's
disease | −1.942 | 0.006 |
| RIG I-like receptor
signaling pathway | −2.055 | 0.006 |
| Toll-like receptor
signaling pathway | −2.014 | 0.006 |
| Natural killer
cell-mediated cytotoxicity | −1.928 | 0.006 |
| Fructose and
mannose metabolism | −1.999 | 0.006 |
| Chemokine signaling
pathway | −1.904 | 0.007 |
| Cytosolic DNA
sensing pathway | −2.055 | 0.008 |
| DNA
replication | −1.875 | 0.010 |
| Drug metabolism,
other enzymes | −2.061 | 0.011 |
| Cysteine and
methionine metabolism | −1.865 | 0.011 |
| Antigen processing
and presentation | −1.858 | 0.011 |
| Base excision
repair | −1.846 | 0.011 |
| Arginine and
proline metabolism | −1.839 | 0.011 |
| Apoptosis | −1.848 | 0.012 |
| p53 signaling
pathway | −1.840 | 0.012 |
| Proteasome | −1.828 | 0.012 |
| Riboflavin
metabolism | −1.828 | 0.013 |
| Epithelial-cell
signaling in Helicobacter pylori infection | −2.069 | 0.015 |
| Porphyrin and
chlorophyll metabolism | −1.790 | 0.018 |
|
Progesterone-mediated oocyte
maturation | −1.782 | 0.019 |
| Cytokine-cytokine
receptor interaction | −1.779 | 0.019 |
| Type I diabetes
mellitus | −1.752 | 0.019 |
| N-glycan
biosynthesis | −1.773 | 0.019 |
| T-cell receptor
signaling pathway | −1.774 | 0.019 |
| Systematic lupus
erythematosus | −1.753 | 0.019 |
| FCγR-mediated
phagocytosis | −1.754 | 0.020 |
| Aminoacyl tRNA
biosynthesis | −1.758 | 0.020 |
| FCεRI signaling
pathway | −1.755 | 0.020 |
| Homologous
recombination | −1.765 | 0.020 |
| α-linoleic acid
metabolism | −1.759 | 0.020 |
| Autoimmune thyroid
disease | −1.760 | 0.021 |
| Allograft
rejection | −1.732 | 0.022 |
| JAK/STAT signaling
pathway | −1.735 | 0.022 |
| Amyotrophic lateral
sclerosis | −1.727 | 0.023 |
| Gysosome | −1.717 | 0.025 |
| Alanine aspartate
and glutamate metabolism | −1.707 | 0.026 |
| Mismatch
repair | −1.707 | 0.026 |
| Glycolysis,
gluconeogenesis | −1.694 | 0.028 |
| Intestinal immune
network for IgA production | −1.687 | 0.030 |
| Pentose phosphate
pathway | −1.675 | 0.032 |
| Neurotrophin
signaling pathway | −1.662 | 0.034 |
| Ether lipid
metabolism | −1.666 | 0.034 |
| Tyrosine
metabolism | −1.663 | 0.034 |
| Amino sugar and
nucleotide sugar metabolism | −1.658 | 0.035 |
| Bladder cancer | −1.651 | 0.036 |
| Citrate cycle,
tricarboxylic acid cycle | −1.626 | 0.041 |
| VEGF signaling
pathway | −1.623 | 0.041 |
| Glutathione
metabolism | −1.626 | 0.041 |
| RNA polymerase | −1.628 | 0.041 |
| Linoleic acid
metabolism | −1.632 | 0.042 |
| B-cell receptor
signaling pathway | −1.629 | 0.042 |
| Starch and sucrose
metabolism | −1.607 | 0.046 |
| Galactose
metabolism | −1.605 | 0.046 |
| Pathogenic
Escherichia coli infection | −1.595 | 0.049 |
| Table IIISignificantly enriched gene ontology
terms of key genes in PP obtained through GSEA of PP vs NN and PP
vs PN. |
Table III
Significantly enriched gene ontology
terms of key genes in PP obtained through GSEA of PP vs NN and PP
vs PN.
| Category | Gene ontology
name | FDR | Gene |
|---|
| BP | Immune
response |
1.421×10⁻¹⁰ | AIM2, BLNK, CCL18,
CCL2, CCL20, CCL22, CCL27, CCL8, CCR7, CXCL1, CXCL10, CXCL13,
CXCL9, CXCR4, DDX58, FCGR3B, IL19, IL4R, IL7R, NLRX1, NOD2, PNP,
ULBP2 |
| BP | Chemotaxis |
3.453×10⁻¹⁰ | CCL18, CCL2, CCL20,
CCL22, CCL27, CCL8, CCR7, CXCL1, CXCL10, CXCL13, CXCL9, CXCR2,
CXCR4, TYMP |
| BP | Taxis |
3.455×10⁻¹⁰ | CCL18, CCL2, CCL20,
CCL22, CCL27, CCL8, CCR7, CXCL1, CXCL10, CXCL13, CXCL9, CXCR2,
CXCR4, TYMP |
| MF | Chemokine
activity |
5.374×10⁻¹⁰ | CCL18, CCL2, CCL20,
CCL22, CCL27, CCL8, CXCL1, CXCL10, CXCL13, CXCL9 |
| MF | Chemokine receptor
binding |
9.911×10⁻¹⁰ | CCL18, CCL2, CCL20,
CCL22, CCL27, CCL8, CXCL1, CXCL10, CXCL13, CXCL9 |
| BP | Inflammatory
response |
1.534×10⁻⁸ | BLNK, CCL18, CCL2,
CCL20, CCL22, CCL8, CCR7, CXCL1, CXCL10, CXCL13, CXCL9, CXCR2,
CXCR4, FOS, HMOX1, IRF7 |
| BP | Response to
wounding |
1.615×10⁻⁷ | BLNK, CCL18, CCL2,
CCL20, CCL22, CCL8, CCNB1, CCR7, CXCL1, CXCL10, CXCL13, CXCL9,
CXCR2, CXCR4, FOS, HMOX1, IRF7, PRKCQ |
| BP | Defense
response |
1.797×10⁻⁷ | BLNK, CCL18, CCL2,
CCL20, CCL22, CCL8, CCR7, CXCL1, CXCL10, CXCL13, CXCL9, CXCR2,
CXCR4, DDX58, FOS, HMOX1, IRF7, NLRX1, NOD2 |
| BP | Locomotory
behavior |
3.182×10⁻⁷ | CCL18, CCL2, CCL20,
CCL22, CCL27, CCL8, CCR7, CXCL1, CXCL10, CXCL13, CXCL9, CXCR2,
CXCR4, TYMP |
| MF | Cytokine
activity |
1.261×10⁻⁶ | CCL18, CCL2, CCL20,
CCL22, CCL27, CCL8, CXCL1, CXCL10, CXCL13, CXCL9, IL19, IL20 |
| BP | Behavior |
1.261×10⁻⁶ | CCL18, CCL2, CCL20,
CCL22, CCL27, CCL8, CCR7, CXCL10, CXCL13, CXCL9, CXCR2, CXCR4, FOS,
LEPR, TYMP, CXCL1 |
| CC | Extracellular
space |
1.261×10⁻⁶ | CCL18, CCL2, CCL20,
CCL22, CCL27, CCL8, CXCL1, CXCL10, CXCL13, CXCL9, HMOX1, IL19,
IL20, ISG15, LEPR, LPL, PLA2G3, ULBP2 |
| CC | Cytosol |
1.261×10⁻⁴ | BUB1B, CCNB1,
CCND1, CCNE2, CDC20, CDK1, GDA, GZMB, HMOX1, LCK, MAD2L1, NOD2,
PLCB4, PNP, PTTG1, PYCARD, RRM2, TK1, TYMP, UPP1, XDH |
| CC | Extracellular
region part |
1.261×10⁻⁴ | CCL18, CCL2, CCL20,
CCL22, CCL27, CCL8, CXCL1, CXCL10, CXCL13, CXCL9, HMOX1, IL19,
IL20, ISG15, LEPR, LPL, PLA2G3, ULBP2 |
| BP | Mitotic cell cycle
checkpoint | 0.002 | BUB1B, CCNA2,
CCND1, MAD2L1, TTK,CDK1 |
| BP | Cell cycle
checkpoint | 0.005 | BUB1B, CCNA2,
CCND1, CDK1, MAD2L1, TTK,CCNE2 |
| BP | Regulation of
protein modification process | 0.010 | BUB1B, CCND1,
CDC20, CDK1, IL20, MAD2L1, NOD2, PSME2, TTK, CCNB1 |
| BP | Response to
virus | 0.014 | CCL22, CCL8, CXCR4,
IRF7, ISG15, STAT1, DDX58 |
| BP | Anaphase-promoting
complex-dependent proteasomal ubiquitin-dependent protein catabolic
process | 0.017 | BUB1B, CDC20, CDK1,
MAD2L1, PSME2, CCNB1 |
| BP | Regulation of
ubiquitin-protein ligase activity during mitotic cell cycle | 0.026 | BUB1B, CDC20, CDK1,
MAD2L1, PSME2, CCNB1 |
| BP | Positive regulation
of protein modification process | 0.032 | CCND1, CDC20, CDK1,
IL20, NOD2, PSME2, TTK, CCNB1 |
| BP | Regulation of
ubiquitin-protein ligase activity | 0.041 | BUB1B, CDC20, CDK1,
MAD2L1, PSME2, CCNB1 |
| BP | Regulation of
ligase activity | 0.049 | BUB1B, CDC20, CDK1,
MAD2L1, PSME2, CCNB1 |
Key KEGG pathways identified by
leading-edge analysis
Through leading-edge analysis of the GSEA results
for PP and PN, and PP and NN, the numbers of overlapping genes in
leading-edge sub-sets of their significant KEGG pathways were
obtained, which are illustrated in Figs. 2 and 3. According to the number of overlapping
genes, every KEGG pathway was assigned a score and the ones with
score >2 were selected as the key KEGG pathways in psoriasis. A
total of 9 (Table IV) and 19
(Table V) key KEGG pathways were
obtained, respectively, by analysis of the GSEA results of the PP
vs. NN and PP vs. PN samples, among which seven overlapping
pathways were found.
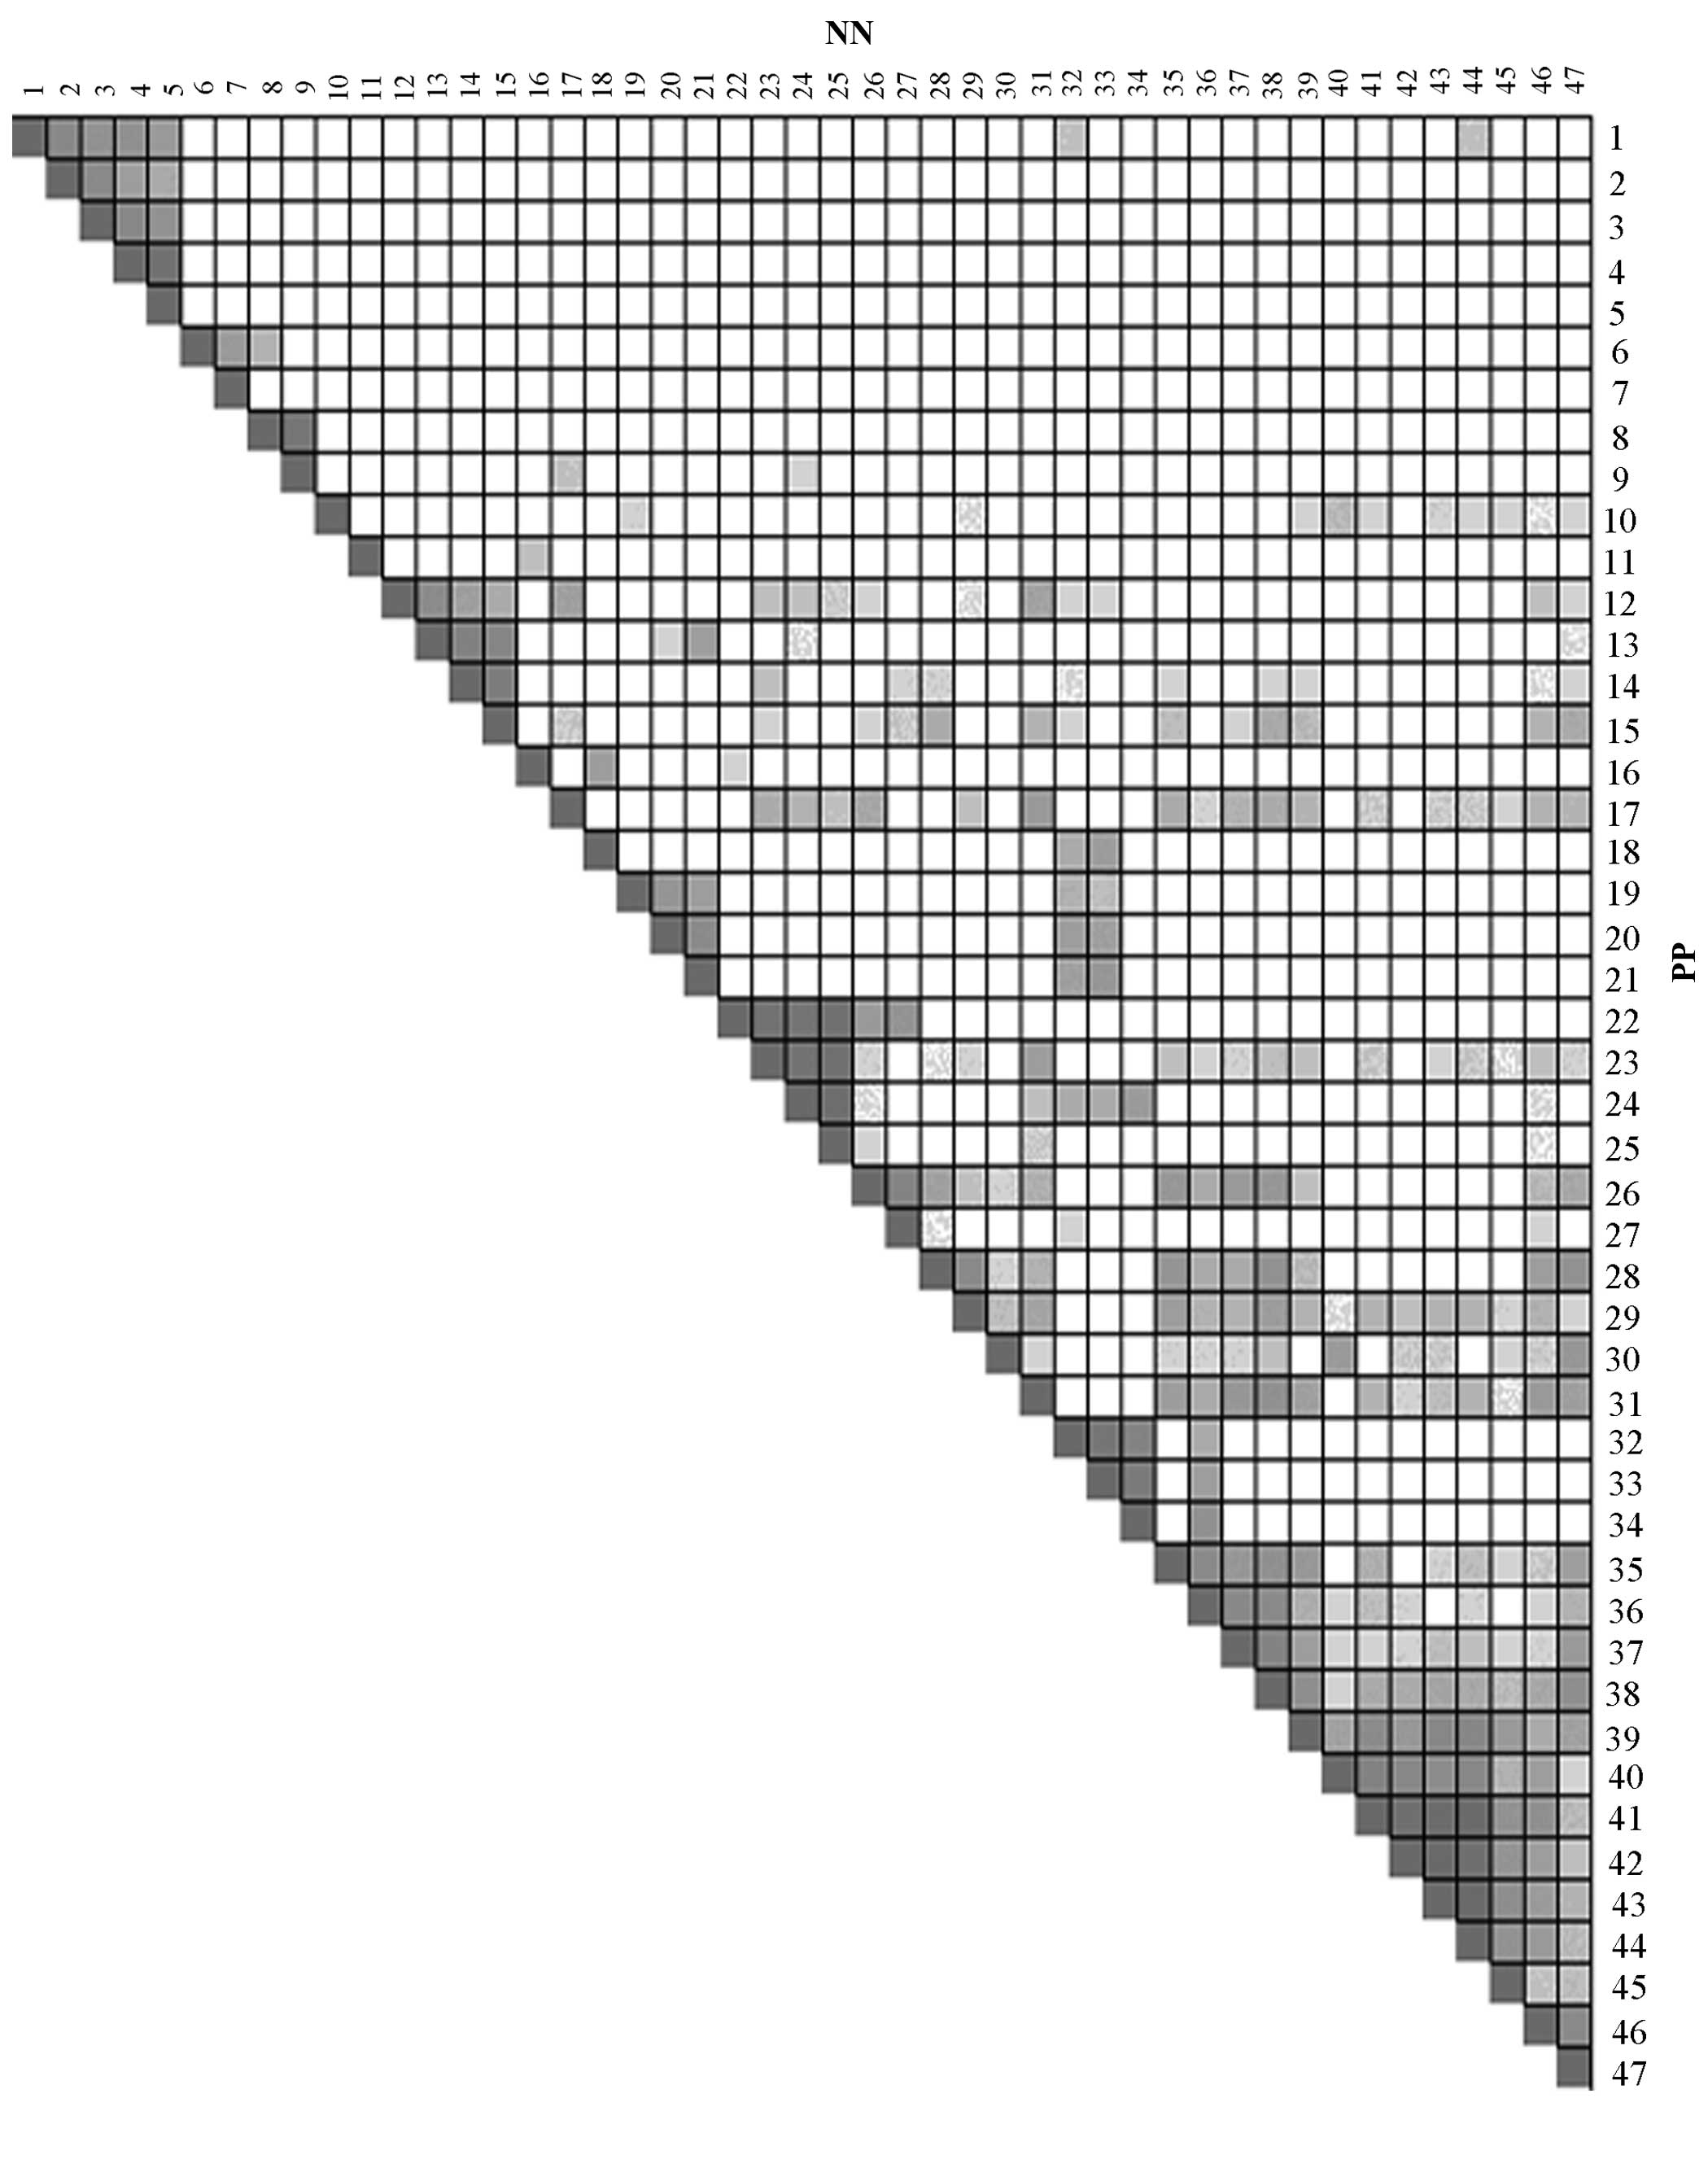 | Figure 2Overlap between the leading-edge
sub-sets of every two Kyoto Encyclopedia of Genes and Genomes
pathways identified by gene set enrichment analysis of lesional
skin samples from patients with psoriasis and skin samples of
healthy controls. The darker the color, the greater the overlap
between the leading-edge subsets. 1, Alanine aspartate and
glutamate metabolism; 2, arginine and proline metabolism; 3,
cysteine and methionine metabolism; 4, phenylalanine metabolism; 5,
tyrosine metabolism; 6, fructose and mannose metabolism; 7,
riboflavin metabolism, 8, linoleic acid metabolism; 9, arachidonic
acid metabolism; 10, proteasome; 11, aminoacyl tRNA biosynthesis;
12, p53 signaling pathway; 13, cell cycle; 14, oocyte meiosis; 15,
progesterone-mediated oocyte maturation; 16, porphyrin and
chlorophyll metabolism; 17, amyotrophic lateral sclerosis; 18, drug
metabolism, other enzymes; 19, homologous recombination; 20, base
excision repair; 21, DNA replication; 22, oxidative
phosphorylation; 23, Alzheimer's disease; 24, Huntington's disease;
25, Parkinson's disease; 26, epithelial cell signaling in
Helicobacter pylori infection; 27, Vibrio cholerae
infection; 28, chemokine signaling pathway; 29, cytokine-cytokine
receptor interaction; 30, primary immunodeficiency; 31, apoptosis;
32, purine metabolism; 33, pyrimidine metabolism; 34, RNA
polymerase; 35, NOD-like receptor signaling pathway; 36, cytosolic
DNA sensing pathway; 37, RIG I-like receptor signaling pathway; 38,
Toll-like receptor signaling pathway; 39, Leishmania infection; 40,
antigen processing and presentation; 41, graft-versus-host disease;
42, autoimmune thyroid disease; 43, allograft rejection; 44, type I
diabetes mellitus; 45, systematic lupus erythematosus; 46, natural
killer cell-mediated cytotoxicity; 47, T-cell receptor signaling
pathway. |
 | Figure 3Overlap between the leading-edge
sub-sets of every two Kyoto Encyclopedia of Genes and Genomes
pathways identified by gene set enrichment analysis of lesional and
non-lesional skin samples from patients with psoriasis. The darker
the color, the greater the overlap between the leading-edge
subsets. 1, N-glycan biosynthesis; 2, aminoacyl tRNA
biosynthesis; 3, proteasome; 4, lysosome; 5, citrate cycle,
tricarboxylic acid cycle; 6, glutathione metabolism; 7, porphyrin
and chlorophyll metabolism; 8, riboflavin metabolism; 9, fructose
and mannose metabolism; 10, amino sugar and nucleotid sugar
metabolism; 11, pentose phosphate pathway; 12, arginine and proline
metabolism; 13, alanine aspartate and glutamate metabolism; 14,
cysteine and methionine metabolism; 15, phenylalanine metabolism;
16, tyrosine metabolism; 17, glycolysis, gluconeogenesis; 18,
starch and sucrose metabolism; 19, galactose metabolism; 20, drug
metabolism, other enzymes; 21, primary immunodeficiency; 22,
oxidative phosphorylation; 23, Parkinson's disease; 24,
Huntington's disease; 25, Alzheimer's disease; 26, Vibrio
cholerae infection; 27, epithelial cell signaling in
Helicobacter pylori infection; 28, homologous recombination;
29, base excision repair; 30, DNA replication, 31, mismatch repair;
32, bladder cancer; 33, amyotrophic lateral sclerosis; 34, p53
signaling pathway; 35, cell cycle; 36, oocyte meiosis; 37,
progesterone-mediated oocyte maturation; 38, leishmania infection;
39, systematic lupus erythematosus; 40, antigen processing and
presentation; 41, autoimmune thyroid disease; 42, allograft
rejection; 43, type I diabetes mellitus; 44, graft-versus-host
disease; 45, intestinal immune network for immunoglobulin A
production; 46, cytokine-cyto-kine receptor interaction; 47,
JAK/STAT signaling pathway; 48, apoptosis; 49, pyrimidine
metabolism; 50, purine metabolism; 51, RNA polymerase; 52, NOD-like
receptor signaling pathway; 53, RIG I-like receptor signaling
pathway, 54, Toll-like receptor signaling pathway; 55, cytosolic
DNA-sensing pathway; 56, ether lipid metabolism; 57, alpha linoleic
acid metabolism; 58, linoleic acid metabolism; 59, chemokine
signaling pathway; 60, natural killer cell-mediated cytotoxicity;
61, neurotrophin signaling pathway; 62, FC gamma R-mediated
phagocytosis; 63, T-cell receptor signaling pathway; 64; FC epsilon
RI signaling pathway; 65, VEGF signaling pathway; 66, B-cell
receptor signaling pathway; 67, pathogenic Escherichia coli
infection. |
| Table IVKey KEGG pathways obtained by
leading-edge analysis of the results of the gene set enrichment
analysis of lesional and skin samples from patients with psoriasis
and skin of normal controls. |
Table IV
Key KEGG pathways obtained by
leading-edge analysis of the results of the gene set enrichment
analysis of lesional and skin samples from patients with psoriasis
and skin of normal controls.
| KEGG pathway | Score |
|---|
| Chemokine signaling
pathway | 2.064 |
| Allograft
rejection | 2.094 |
| Antigen processing
and presentation | 2.111 |
| Epithelial cell
signaling in | 2.125 |
| Helicobacter
pylori infection | |
| Leishmania
infection | 2.202 |
| Alzheimer's
disease | 2.491 |
| Autoimmune thyroid
disease | 2.617 |
| Oxidative
phosphorylation | 2.793 |
| Graft-versus-host
disease | 3.330 |
| Table VKey KEGG pathways identified by
leading-edge analysis of the gene set enrichment analysis of
lesional and non-lesional skin samples from patients with
psoriasis. |
Table V
Key KEGG pathways identified by
leading-edge analysis of the gene set enrichment analysis of
lesional and non-lesional skin samples from patients with
psoriasis.
| KEGG pathway | Score |
|---|
| Antigen processing
and presentation | 2.026 |
| FCγR-mediated
phagocytosis | 2.062 |
| Natural killer
cell-mediated cytotoxicity | 2.115 |
| Systematic lupus
erythematosus | 2.132 |
| Chemokine signaling
pathway | 2.138 |
| Epithelial cell
signaling in | 2.142 |
| Helicobacter
pylori infection | |
| Amyotrophic lateral
sclerosis | 2.153 |
| Neurotrophin
signaling pathway | 2.164 |
| NOD-like receptor
signaling pathway | 2.261 |
| Apoptosis | 2.271 |
| Parkinson's
disease | 2.322 |
|
Progesterone-mediated oocyte
maturation | 2.350 |
| Bladder cancer | 2.357 |
| Toll-like receptor
signaling pathway | 2.488 |
| Type I diabetes
mellitus | 2.604 |
| Oxidative
phosphorylation | 2.850 |
| Allograft
rejection | 3.359 |
| Leishmania
infection | 3.402 |
| Autoimmune thyroid
disease | 3.739 |
Discussion
Psoriasis is a common skin disease which is
associated with inflammation and immune disorders and may be
accompanied by numerous other diseases. In spite of the large
number of studies performed, the precise etiologies of psoriasis
have largely remained elusive. The present study performed a
combination of traditional DEGA and GSEA to identify previously
known as well as novel key KEGG pathways, such as NOD-like receptor
signaling pathway, and genes associated with psoriasis, and
therefore provided valuable targets for the treatment or diagnosis
of psoriasis.
The DEGA method identified 540 DEGs between PP and
NN and 452 DEGs between PP and PN. In addition, 422 overlapping
DEGs were identified. These results indicated that the gene
expression patterns in psoriasis patients are markedly different
from those in the skin of healthy individuals, while gene
expression is nearly identical among lesional and non-lesional skin
samples of patients with psoriasis. Furthermore, by using
fibre-optic confocal imaging technology, Suihko and Serup (12) found that there was no significant
difference in dermal papillae and cell size between non-lesional
psoriasis skin and healthy skin, while significant differences in
dermal papillae, cell size and the number of cells existed between
lesional psoriasis skin and healthy skin (13). The clinical symptoms of
non-lesional psoriasis skin may be sustained by inflammation and
immune-associated genes or pathways. In a study by Seifert et
al (14), DDK-1, an inhibitor
of the Wnt signaling pathway with important role in inflammation
and immune mechanisms, was found to be increased at the mRNA and
protein level in non-lesional psoriasis skin compared with that in
lesional psoriasis skin and healthy skin. Therefore inflammation-
or immune-associated pathways or genes may be potential targets for
preventing the occurrence of lesions in patients with non-lesional
psoriasis.
Through the combination of GSEA and DEGA, 65 key
genes were identified in the present study, which contained
numerous genes known to be associated with psoriasis, including
IL19 and IL20, as well as novel genes, including CHP2 and GZMB.
Among the 65 key genes, CHP2 was found to be involved in the most
significant KEGG pathways in the GSEA results for PP as well as for
PN. CHP2 encodes a small calcium-binding protein, which regulates
the cell pH by controlling the activity of plasma membrane-type
Na+/H+ exchange (15). In a study of Li et al
(16), CHP2 was reported to have
important roles in the activation of the calcineurin/nuclear factor
of activated T cells signaling pathway, which has been reported to
be linked with the incidence of psoriasis. In the present study,
enrichment analysis using DAVID identified the involvement of a
number of well-studied biological processes in psoriasis, including
immune response, inflammatory response and chemokine activity.
Certain members of the chemokine family, including CXCL1, CCL2,
CCL22, CXLC9 and CCL8, were found to be clustered in numerous GO
terms. Chemokines are the largest family of cytokines in human
immunophysiology (17). They can
be divided into two major families and two sub-families: CC
chemokine ligands, CC chemokine receptors, CXC chemokine ligands
and CXC chemokine receptors. Several of them have been identified
to be associated with the incidence and development of psoriasis.
Kono et al (18) reported
that the expression of CCR5 and CCL5 was associated with the
development of psoriasiform hyperplasia and microabscess. Also,
through managing multiple chemokines, keratinocytes actively
participate in the inflammatory response in psoriasis patients
(19). Therefore, chemokines may
serve as potential biomarkers for the diagnosis and treatment of
psoriasis. Furthermore, certain members of the IL family, including
IL19, IL20, IL4R and IL7R, were also enriched in the KEGG pathways
identified in the present study. IL19, IL20 and IL24 have critical
roles regarding the symptoms of psoriasis (20). Through the comparison of gene
expression profiles between lesional psoriasis skin and
non-lesional psoriasis skin, Xie et al (2) identified IL7R as an important
indictor for distinguishing non-lesional from lesional skin in
patients with psoriasis.
The autoimmune thyroid disease signaling pathway had
a high score in the key KEGG pathways for PP and PN in the present
study. Autoimmune thyroid diseases include Hashimoto's thyroiditis,
chronic autoimmune thyroiditis, Graves' disease and autoimmune
atrophic thyroiditis and primary myxedema, which are mainly
mediated by T cells and have, to a certain extent, a similar
pathogenesis to that of psoriasis. Natural killer (NK)
cell-mediated cytotoxicity signaling was also identified as a key
KEGG pathways using leading-edge analysis of the GSEA results for
PP and PN, and PP and NN samples. NK cells are large granular
lymphocytes which have important roles in the formation of the
innate immune system. The cytotoxic NK cells can kill cells
expressing stress-induced molecules and have been validated to have
important roles in psoriatic arthritis (21). Furthermore, the distribution of NK
cells in psoriasis patients was shown to be different from that in
healthy controls (22). Certain
well-studied KEGG pathways in psoriasis, including chemokine
signaling pathways, epithelial cell signaling in Helicobacter
pylori infection as well as antigen processing and
presentation, were also obtained in the present study.
In conclusion, the present study used a combination
of the traditional DEGA method and GSEA of microarray data from GEO
to identify key genes and KEGG pathways which may represent
potential biomarkers for the incidence and development of
psoriasis. GO enrichment analysis of key genes illustrated the
reliability of the results. However, further molecular biological
experiments are required to confirm the implication of the
identified genes in psoriasis as well as their utilization as
biomarkers and molecular targets for the treatment of
psoriasis.
Acknowledgments
The present study was supported by the Key Project
Fund of the Health Industry of Tianjin (no. 12KG131).
References
|
1
|
Gupta R, Debbaneh MG and Liao W: Genetic
epidemiology of psoriasis. Curr Dermatol Rep. 3:61–78. 2014.
View Article : Google Scholar
|
|
2
|
Xie S, Chen Z, Wang Q, Song X and Zhang L:
Comparisons of gene expression in normal, lesional and non-lesional
psoriatic skin using DNA microarray techniques. Int J Dermatol.
53:1213–1220. 2014. View Article : Google Scholar : PubMed/NCBI
|
|
3
|
Guo P, Luo Y, Mai G, Zhang M, Wang G, Zhao
M, Gao L, Li F and Zhou F: Gene expression profile based
classification models of psoriasis. Genomics. 103:48–55. 2014.
View Article : Google Scholar
|
|
4
|
Nair RP, Duffin KC, Helms C, Ding J,
Stuart PE, Goldgar D, Gudjonsson JE, Li Y, Tejasvi T, Feng BJ, et
al: Genome-wide scan reveals association of psoriasis with IL-23
and NF-kappaB pathways. Nat Genet. 41:199–204. 2009. View Article : Google Scholar : PubMed/NCBI
|
|
5
|
Krueger JG, Fretzin S, Suárez-Fariñas M,
Haslett PA, Phipps KM, Cameron GS, McColm J, Katcherian A, Cueto I,
White T, et al: IL-17A is essential for cell activation and
inflammatory gene circuits in subjects with psoriasis. J Allergy
Clin Immunol. 130:145.e9–154.e9. 2012. View Article : Google Scholar
|
|
6
|
Zhou RY, Wan YF, Guo Y, Jiang X and Wu Q:
Expression of DUOX2 in psoriasis and atopic dermatitis lesion.
Journal of Sichuan University. 44:736–739. 2013.In Chinese.
|
|
7
|
Yin G, Hou R, Li J, Zhang J, Li X and
Zhang K: Expression of Notch receptor and its target gene Hes-1 in
bone marrow CD34+ cells from patients with psoriasis. Dermatology.
225:147–153. 2012. View Article : Google Scholar : PubMed/NCBI
|
|
8
|
Subramanian A, Tamayo P, Mootha VK,
Mukherjee S, Ebert BL, Gillette MA, Paulovich A, Pomeroy SL, Golub
TR, Lander ES and Mesirov JP: Gene set enrichment analysis: A
knowledge-based approach for interpreting genome-wide expression
profiles. Proc Natl Acad Sci USA. 102:15545–15550. 2005. View Article : Google Scholar : PubMed/NCBI
|
|
9
|
Gautier L, Cope L, Bolstad BM and Irizarry
RA: Affy-analysis of Affymetrix GeneChip data at the probe level.
Bioinformatics. 20:307–315. 2004. View Article : Google Scholar : PubMed/NCBI
|
|
10
|
Diboun I, Wernisch L, Orengo CA and
Koltzenburg M: Microarray analysis after RNA amplification can
detect pronounced differences in gene expression using limma. BMC
Genomics. 7:2522006. View Article : Google Scholar : PubMed/NCBI
|
|
11
|
Sherman BT, Huang da W, Tan Q, Guo Y, Bour
S, Liu D, Stephens R, Baseler MW, Lane HC and Lempicki RA: DAVID
Knowledgebase: A gene-centered database integrating heterogeneous
gene annotation resources to facilitate high-throughput gene
functional analysis. BMC Bioinformatics. 8:4262007. View Article : Google Scholar : PubMed/NCBI
|
|
12
|
Suihko C and Serup J: Fluorescent
fibre-optic confocal imaging of lesional and non-lesional psoriatic
skin compared with normal skin in vivo. Skin Res Technol.
18:397–404. 2012. View Article : Google Scholar
|
|
13
|
Bahia MS, Kaur M, Silakari P and Silakari
O: Interleukin-1 receptor associated kinase inhibitors: Potential
therapeutic agents for inflammatory-and immune-related disorders.
Cell Signal. 27:1039–55. 2015. View Article : Google Scholar : PubMed/NCBI
|
|
14
|
Seifert O, Soderman J, Skarstedt M, Dienus
O and Matussek A: Increased expression of the Wnt signalling
inhibitor Dkk-1 in non-lesional skin and peripheral blood
mononuclear cells of patients with plaque psoriasis. Acta Derm
Venereol. 95:407–410. 2015. View Article : Google Scholar
|
|
15
|
Zaun HC, Shrier A and Orlowski J:
Calcineurin B homologous protein 3 promotes the biosynthetic
maturation, cell surface stability, and optimal transport of the
Na+/H+ exchanger NHE1 isoform. J Biol Chem. 83:12456–12467. 2008.
View Article : Google Scholar
|
|
16
|
Li GD, Zhang X, Li R, Wang YD, Wang YL,
Han KJ, Qian XP, Yang CG, Liu P, Wei Q, et al: CHP2 activates the
calcineurin/nuclear factor of activated T cells signaling pathway
and enhances the oncogenic potential of HEK293 cells. J Biol Chem.
283:32660–32668. 2008. View Article : Google Scholar : PubMed/NCBI
|
|
17
|
Fernandez EJ and Lolis E: Structure,
function and inhibition of chemokines. Annu Rev Pharmacol Toxicol.
42:469–499. 2002. View Article : Google Scholar
|
|
18
|
Kono F, Honda T, Aini W, Manabe T, Haga H
and Tsuruyama T: Interferon-γ/CCR5 expression in invariant natural
killer T cells and CCL5 expression in capillary veins of dermal
papillae correlate with development of psoriasis vulgaris. Br J
Dermatol. 170:1048–1055. 2014. View Article : Google Scholar : PubMed/NCBI
|
|
19
|
Giustizieri ML, Mascia F, Frezzolini A, De
Pità O, Chinni LM, Giannetti A, Girolomoni G and Pastore S:
Keratinocytes from patients with atopic dermatitis and psoriasis
show a distinct chemokine production profile in response to T
cell-derived cytokines. J Allergy Clin Immunol. 107:871–877. 2001.
View Article : Google Scholar : PubMed/NCBI
|
|
20
|
Kingo K, Mössner R, Rätsep R, Raud K,
Krüger U, Silm H, Vasar E, Reich K and Kõks S: Association analysis
of IL20RA and IL20RB genes in psoriasis. Genes Immun. 9:445–451.
2008. View Article : Google Scholar : PubMed/NCBI
|
|
21
|
Tang F, Sally B, Ciszewski C, Abadie V,
Curran SA, Groh V, Fitzgerald O, Winchester RJ and Jabri B:
Interleukin 15 primes natural killer cells to kill via NKG2D and
cPLA2 and this pathway is active in psoriatic arthritis. PLoS One.
8:e762922013. View Article : Google Scholar : PubMed/NCBI
|
|
22
|
Batista MD, Ho EL, Kuebler PJ, Milush JM,
Lanier LL, Kallas EG, York VA, Chang D, Liao W, Unemori P, et al:
Skewed distribution of natural killer cells in psoriasis skin
lesions. Exp Dermatol. 22:64–66. 2013. View Article : Google Scholar : PubMed/NCBI
Kingo K, Mössner R, Rätsep R, Raud K,
Krüger U, Silm H, Vasar E, Reich K and Kõks S: Association analysis
of IL20RA and IL20RB genes in psoriasis. Genes Immun. 9:445–451.
2008. View Article : Google Scholar : PubMed/NCBI
|