Introduction
Oral cancer is the sixth most common type of cancer
worldwide with annual incidence of ~275,000, and three quarters of
all cases occur in developing countries (1). Oral cancer accounts for ~2% of
systemic malignant tumors; 90% of such patients are diagnosed with
squamous cell carcinomas (SCC) (2). Although treatment strategies have
progressed during the last 40 years, including surgery, radiation
and chemotherapy, the five-year survival rate and life quality of
patients with oral cancer remains unsatisfactory (2). In addition, these treatments often
result in loss of speech, chewing and swallowing dysfunction,
cosmetic deformity, and psychological distress (3). However, the effective management of
patients with oral SCC is limited to the current knowledge of
malignant tumor progression. Therefore, it is important to develop
useful approaches to prevent dysplastic lesions, improve the
accuracy of diagnosis, and determine definitive biological markers
for the progression of these lesions to carcinomas.
The etiology of oral cancer is complex and is
mediated by genetic-environmental interactions (4,5).
Numerous risk factors have been demonstrated to be associated with
oral cancer, including tobacco and alcohol, dietary deficiencies,
syphilis, human papillomavirus and chronic candidiasis (4). Previous studies have focused on
genetic susceptibility and alterations, genomic instability, and
epigenetic modifications in oral oncogenesis (6–8).
Certain aberrantly expressed genes and proteins have been
identified during oral cancer development, such as transforming
growth factor-α (9), epidermal
growth factor receptor (EGFR) (10), Ras (11), cadherin 1 type I (12), Bcl2-associated X protein and B-cell
chronic lymphocytic leukaemia/lymphoma 2 (13). Although these studies contribute to
the current understanding of the disease, the complexities of such
malignancies are still not thoroughly elucidated. Genechip, or DNA
microarray, allows for the simultaneous determination of the
expression of tens of thousands of genes (14). This has revolutionized the
screening for oral carcinogenesis-associated genes, in addition to
accelerating the identification of potential therapeutic target
genes (15). Hwang et al
(16) used microarrays to evaluate
overexpressed genes in oral cancer, and identified 45 genes,
including two uncharacterized clones, that are associated with
malignancy. Alevizos et al (17) determined that there are ~600
differentially expressed genes (DEGs), including transcription
factors, oncogenes, differentiation markers, tumor suppressors and
metastatic proteins, in oral cancer. However, few studies have
investigated the dynamic changes of gene expression during oral
carcinogenesis.
In the present study, 4-nitroquinoline 1-oxide
(4-NQO) was used to induce rat oral carcinogenesis. This animal
model was selected due to its reproducibility and the anatomical
similarities to humans (18), as
well as the fact that it is widely used for investigations of oral
cancer development. Subsequently, the dynamic changes of the gene
expression profiles during the initiation and progression of oral
cancer in Wistar rats were evaluated using microarray analysis. The
current study aimed to define the genetic portrait of the different
stages in oral SCC and identify oral carcinogenesis-associated
genes for future studies, with the intent of exploring their
potential roles during the progression of oral carcinogenesis and
as possible target genes for the prevention of this disease.
Materials and methods
Animals and experimental design
A total of 38 healthy Wistar rats (160 days old,
220±10 g) derived from closed groups were enrolled in the present
study. The rats were acclimatized under appropriate conditions with
a natural day-night cycle, with free access to food and water, at a
temperature of 23±2°C and 30–50% humidity for 1 week prior to the
trial. All animals and experimental procedures were approved by the
Management Committee of Laboratory Animals Use, Institute of
Laboratory Animals, Shanghai JiaoTong University (Shanghai,
China).
4-NQO (Sigma-Aldrich, St. Louis, MO, USA) was
dissolved in distilled water at a concentration of 0.002% and then
stored in brown bottle at 4°C. A total of 38 rats were randomly
divided into the following two groups: i) The control group (n=5),
in which rats were treated with saline solution by drinking water;
and ii) in the experimental group (n=33), in which rats were
treated with 4-NQO solution in the same way. Next, the rats in the
4-NQO group were randomly sacrificed by cervical dislocation at 9
(n=7), 13 (n=7), 20 (n=5), 24 (n=6) and 32 (n=8) weeks,
respectively. Tongue tissue from the most notable lesion site was
collected and separated into the following three groups where the
tissues were: i) Fixed with 10% buffered formalin (Sigma-Aldrich)
for histopathological analysis; ii) immediately immersed in
RNAlater solution (Qiagen GmbH, Hilden, Germany) to ensure the
stability of RNA, and frozen at −80°C; or iii) used to detect the
activity of succinate dehydrogenase (SDH).
Pathological examination
The histological identification of squamous
neoplasia was performed by a pathologist who was independent and
blind to the study design. The samples were fixed in 10% buffered
formalin, embedded with paraffin and then sliced into 5-µm
thick sections using a paraffin slicing machine (Leica
Microsystems, Wetzlar, Germany). Next, sections were incubated for
4 h for deparaffinization at 65°C then were dehydrated with
gradient ethanol. Subsequently, the sections were stained with
hematoxylin (Genmed Scientifics, Inc., Shanghai, China) for 5 min.
Following differentiation in 1% hydrochloric acid alcohol for 2
sec, the sections were incubated in ammonia water for 2 min and
stained with eosin (Genmed Scientifics, Inc.) for 1 min. The
sections were then dehydrated, cleared and mounted with neutral
resin (Genmed Scientifics, Inc.). Light microscopy (BX50; Olympus,
Tokyo, Japan) was used to observe the sections and the samples were
classified into the following five types: i) Mild epithelial
dysplasia (MiD), ii) moderate epithelial dysplasia (MoD), iii)
severe epithelial dysplasia (SD), iv) carcinoma in situ
(CIS); and v) SCC, according to the criteria described by the World
Health Organization (19).
Microarrays and target sample
preparation
Transcription profile analysis was performed using a
Codelink Uniset Rat I Bioarray (GE Healthcare Life Sciences,
Chandler, AZ, USA) containing 5,800 probes. Under RNase-free
conditions, the samples were immersed into TRIzol solution
(Invitrogen; Thermo Fisher Scientific, Inc., Waltham, MA, USA) and
then homogenized on ice in a Dounce tissue grinder (Wheaton,
Millville, NJ, USA). Total RNA was extracted according to the
TRIzol extraction protocol, and then purified using an RNeasy kit
(Qiagen GmbH). For the microarrays, 10 µg total RNA was used
to synthesize cRNA by Codelink Expression Assay Reagent kit (GE
Healthcare Life Sciences), according to the manufacturer's
protocol. Briefly, single-stranded cDNA was generated using T7
primer and M-MLV reverse transcriptase (Promega Corp., Madison, WI,
USA), and then double-stranded cDNA was produced using RNase H and
DNA polymerase I (Invitrogen; Thermo Fisher Scientific, Inc.).
Subsequently, cRNA was generated based on the double-stranded cDNA
template using biotin-11-uridine-5′-triphosphate and T7 RNA
polymerase in an in vitro transcription reaction. The
purification and quantitation of cRNA was performed using an RNeasy
kit (Qiagen GmbH) and UV spectrophotometry (Evolution 300; Thermo
Fisher Scientific, Inc.), respectively.
Hybridization, processing and
scanning
A total of 10 µg cRNA was fragmented by
incubation with 50 µl fragmentation buffer (Codelink
Expression Assay Reagent kit) for 20 min at 94°C. The fragmented
cRNA in hybridization buffer was hybridized to the Uniset bioarray
in a shaking incubator (overnight, 300 rpm at 37°C). Arrays were
washed with phosphate-buffered saline (PBS) three times, and then
stained with Cy5-Streptavidin (Invitrogen; Thermo Fisher
Scientific, Inc.) for 30 min. Subsequently, arrays were washed and
then dried by centrifugation at 1,000 × g for 3 min at low speed.
The arrays were scanned using a GenePix 4000B microarray scanner
(Molecular Devices, LLC, Sunnyvale, CA, USA).
Data analysis
Data preprocessing was performed using CodeLink
Expression Analysis software (version 2.2.3; GE Healthcare Life
Sciences) (20). Probe-level data
were extracted and then normalized using linear median
normalization. Following the removal of low hybridization signals,
normalized data were converted into approximately normal
distribution from skewed distribution using a log2
transformation. DEGs were selected on the basis of a fold-change
>1.5 and P<0.05. The software package of self-organizing map
(SOM; http://www.cis.hut.fi/projects/somtoolbox/) based on
the Matlab (version 6.5; MathWorks, Natick, MA, USA) environment
was used for data mining and gene clustering, in accordance with a
previous study (21). Data were
processed using 400 (24×15 grids) neurons. The SOM illustration
output was visualized using component plane presentations (CPP)
based on a Matlab 6.5 environment (21). To characterize gene expression
patterns, the clusters were annotated with Gene Ontology (GO;
http://geneontology.org/) enrichment analysis
based on Database for Annotation, Visualization and Integrated
Discovery (22).
Quantitative polymerase chain reaction
(qPCR)
The six randomly selected DEGs were Janus kinase 3
(Jak3), cyclin-dependent kinase-1 (CDK1; also known as Cdc2a),
Bcl2-like 2 (Bcl2l2), nuclear factor-κB (NF-κB), tumor necrosis
factor receptor superfamily, member 1A (Tnfrsf1a), and SDH were
detected by qPCR. PCR amplification was performed using an iCycler
iQ Real-Time PCR detection system (Bio-Rad Laboratories, Richmond,
CA, USA) with SYBR-Green I fluorescent dye (Applied Biosystems;
Thermo Fisher Scientific, Inc.). Primer sequences for Jak3, Cdc2a,
Bcl2l2, NF-κB, Tnfrsf1a, SDH and 18S RNA are presented in Table I. The PCR program included 95°C for
10 min, 40 cycles at 95°C for 15 sec, 55°C for 1 min, and a final
20 min extension at 60–95°C. Finally, the expression of each gene
was calculated using the 2−ΔΔCq method (23) and 18S RNA was used as the internal
control.
 | Table IPrimer sequences for specific
genes. |
Table I
Primer sequences for specific
genes.
| Gene | Primer sequences
(5′-3′) |
|---|
| Jak3 | F:
CCTGGAGTGGCACGAGAATC
R: TCCACAACCTCCCGCCTAT |
| Cdc2a | F:
CCGGTTGACATCTGGAGCAT
R: CTGAGTCGCCGTGGAAAAG |
| Bcl2l2 | F:
TCCGAGTTCCGGGAAGACT
R: TGGTAACCCGACCCTGGTT |
| NF-κB | F:
CCAACGCCCTCTTCGACTAC
R: CCTCACGAGCTGAGCATGAA |
| Tnfrsf1a | F:
TCAATGGCACCGTGACAATC
R: AAGAATCCTGCGTGGCAGTT |
| SDH | F:
CATGGCGACTGCCTATGCT
R: CCTTCGTTCTTCAGCCGCT |
| 18S RNA | F:
TGTCGCTCGCTCCTCTCCTA
R: TGACCGGGTTGGTTTTGATC |
Immunohistochemical (IHC) staining
The 5-µm sections were incubated with 0.3%
hydrogen peroxide in PBS for 5 min to block the endogenous
peroxidase. An antigen retrieval step was performed in a microwave
(700 W) with 10 mM citrate buffer (pH 6.0; GenMed Scientifics,
Inc.) for 5–10 min. The sections were blocked using 5% normal goat
serum (GenMed Scientifics, Inc.) in PBS for 10 min, and then
incubated with mouse anti-rat cyclin D1 monoclonal antibody (1:50;
cat. no. sc-20044; Santa Cruz Biotechnology, Inc., Dallas, TX, USA)
and polyclonal rabbit anti-rat NF-κBp65 antibody (1:50; cat. no.
sc-372; Santa Cruz Biotechnology, Inc.) for 2 h at room
temperature. Subsequently, the sections were incubated with
biotin-labeled goat anti-mouse IgG1-B (1:200; cat. no. sc-2072;
Santa Cruz Biotechnology, Inc.) and mouse anti-rabbit IgG-B (1:200;
cat. no. sc-2491; Santa Cruz Biotechnology, Inc.) polyclonal
secondary antibodies for 15 min, respectively, and then incubated
with streptavidin for 15 min (SP kit; Zymed; Thermo Fisher
Scientific, Inc.) at room temperature. In addition, an antigen
retrieval step was performed in a microwave (700 W) with 10 mM
citrate buffer (pH 6.0; GenMed Scientifics) for 5–10 min, which
aimed to expose antigen sites masked by fixation. Immunolabeling
was visualized by incubating the tissue sections with
3,3′-diaminobenzidine solution for 15 min at room temperature and
counterstaining with hematoxylin for 2 min at room temperature. The
primary antibody was replaced with 0.01 M PBS in the negative
controls. Light microscopy (BX50; Olympus) was used to observe the
sections.
Detection of SDH activity
Tongue tissues were homogenized on ice in a Dounce
tissue grinder, and then tissue mitochondria were separated and
extracted using tissue mitochondria isolation kit (GenMed
Scientifics), according to manufacturer's protocol. Subsequently,
the activity of mitochondrial SDH was detected six times using SDH
activity assay kit (GenMed Scientifics), according to the
manufacturer's protocol. The absorbance was read at 600 nm using a
microplate reader (SpectraMax 190; Molecular Devices, LLC).
Statistical analysis
Statistical analysis was performed using SPSS
software (version 17.0; SPSS, Inc., Chicago, IL, USA). Data are
presented as the mean ± standard deviation and were analyzed by
independent sample t-tests. P<0.05 was considered to indicate a
statistically significant difference.
Results
Histological alterations to the mucosa
following 4NQO-administration
Following treatment of rat tongue tissues with 4-NQO
for 9 weeks, hematoxylin and eosin staining demonstrated a number
of initial alterations, including an increased thickness of the
spinous cell layer and disordered basal cells; of these tissues,
were diagnosed as MiD. Following treatment with 4NQO for 13 weeks,
further dysplastic alterations occurred, and MoD, SD, CIS and
invasive SCC were additionally observed in the majority of rats
tongue tissues sampled following treatment for 20, 24 and 32 weeks
(Fig. 1). The histological types
in each group are summarized in Table
II.
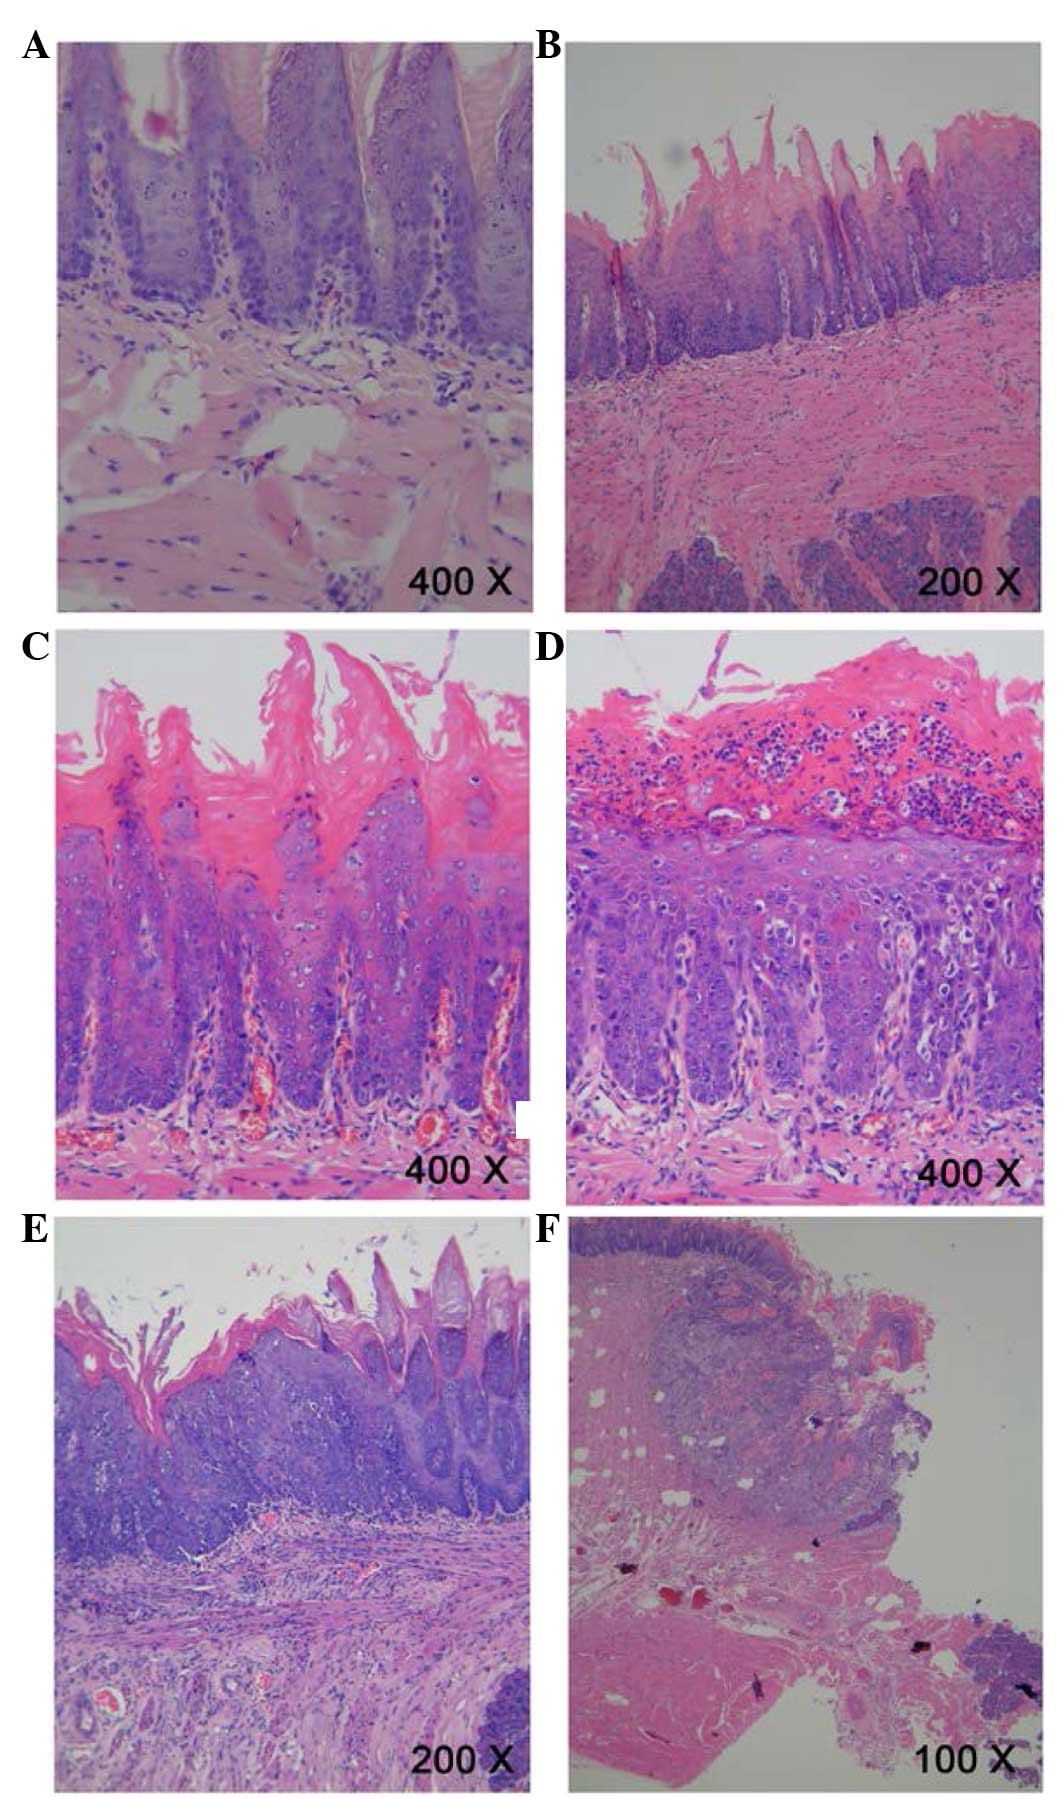 | Figure 1Pathological evidence of
carcinogenesis in rat tongues. (A) Normal squamous epithelium of
the tongue. Magnification, ×400. (B) Mild epithelial dysplasia of
the tongue exhibited loss of polarity of the deeper cell layers of
the epithelium and mild nuclear pleomorphism of cells.
Magnification, ×200. (C) Moderate epithelial dysplasia of the
tongue indicated a basaloid appearance, loss of polarity of cells
and intercellular cohesion. Magnification, ×400. (D) Severe
epithelial dysplasia of the tongue exhibited a proliferation of
basal cells, grossly disturbed stratification, the loss of polarity
of cells, individual cell keratinization and nuclear pleomorphism
of cells. Magnification, ×400. (E) Carcinoma in situ of the
tongue exhibited the proliferation of primitive basal epithelial
cells from the basement membrane to the surface, marked nuclear
atypia and the full thickness of the epithelium. Magnification,
×200. (F) Squamous cell carcinoma of the tongue showed gross
disruption of normal epithelial architecture, prominent cellular
pleomorphism, the formation of dyskeratosis with keratin pearl and
invasion into underlying connective tissues. Magnification,
×100. |
| Table IIHistological changes in rat tongues
at various time points following 4-nitroquinoline 1-oxide
treatment. |
Table II
Histological changes in rat tongues
at various time points following 4-nitroquinoline 1-oxide
treatment.
| Group (weeks) | Diagnosis
| SCC | Total |
|---|
| Normal | Mild dysplasia | Moderate
dysplasia | Severe
dysplasia | Carcinoma in
situ |
|---|
| 0 (Control) | 5 (100) | 0 (0) | 0 (0) | 0 (0) | 0 (0) | 0 (0) | 5 |
| 9 | 0 (0) | 4 (57.1) | 3 (42.9) | 0 (0) | 0 (0) | 0 (0) | 7 |
| 13 | 0 (0) | 1 (14.3) | 5 (71.4) | 1 (14.3) | 0 (0) | 0 (0) | 7 |
| 20 | 0 (0) | 0 (0) | 0 (0) | 5 (100) | 0 (0) | 0 (0) | 5 |
| 24 | 0 (0) | 0 (0) | 0 (0) | 2 (33.3) | 4 (66.7) | 0 (0) | 6 |
| 32 | 0 (0) | 0 (0) | 0 (0) | 0 (0) | 2 (25) | 6 (75) | 8 |
| Total | 5 | 5 | 8 | 8 | 6 | 6 | 38 |
Data mining and visualization by
CPP-SOM
A total of 492, 497, 1,176, 1,479 and 1,848 DEGs
were identified in the tongue tissues of MiD, MoD, SD, CIS and
SCC-stage rats. There were a similar number of up- and
downregulated genes in each of the tongue tissues types (Fig. 2A). Gene clustering and its
visualization are indicated in Fig.
2B using CPP-SOM. Each bar in the graphic illustrates the
values of a single vector component in all map units. DEGs mapped
at each stage during rat oral carcinogenesis indicated that the
genes mapped onto the corner/edge areas of the map were most
frequently regulated (Fig.
2B).
 | Figure 2Differentially expressed genes and
SOM output data at each stage during rat oral carcinogenesis. (A)
The numbers of up/downregulated genes in tongue tissues at
different stages during carcinogenesis. (B) Illustration of SOM
output microarray data by component plane presentations. Each of
these presentations appears as genome-wide transcriptional display,
in which all upregulated units (red), downregulated units (blue)
and moderately transcribed units (green and yellow) are
well-delineated. Color-coding index represents
log2-transformed ratios, and the brighter color denotes
the higher value. The following 7 major regulatory categories are
recognizable: i) 1/7, Down/upregulated genes at the early stage
(MiD and MoD); ii) 2/6, down/upregulated genes at the late stage
(SCC); iii) 3/5, down/upregulated genes at the intermediate stage
(SD and CIS); iv) 4, upregulated genes at the intermediate stage
(SD and CIS). SOM, self-organizing map; MiD, mild epithelial
dysplasia; MoD, moderate epithelial dysplasia; SCC, squamous cell
carcinoma; SD, severe epithelial dysplasia; CIS, carcinoma in
situ. |
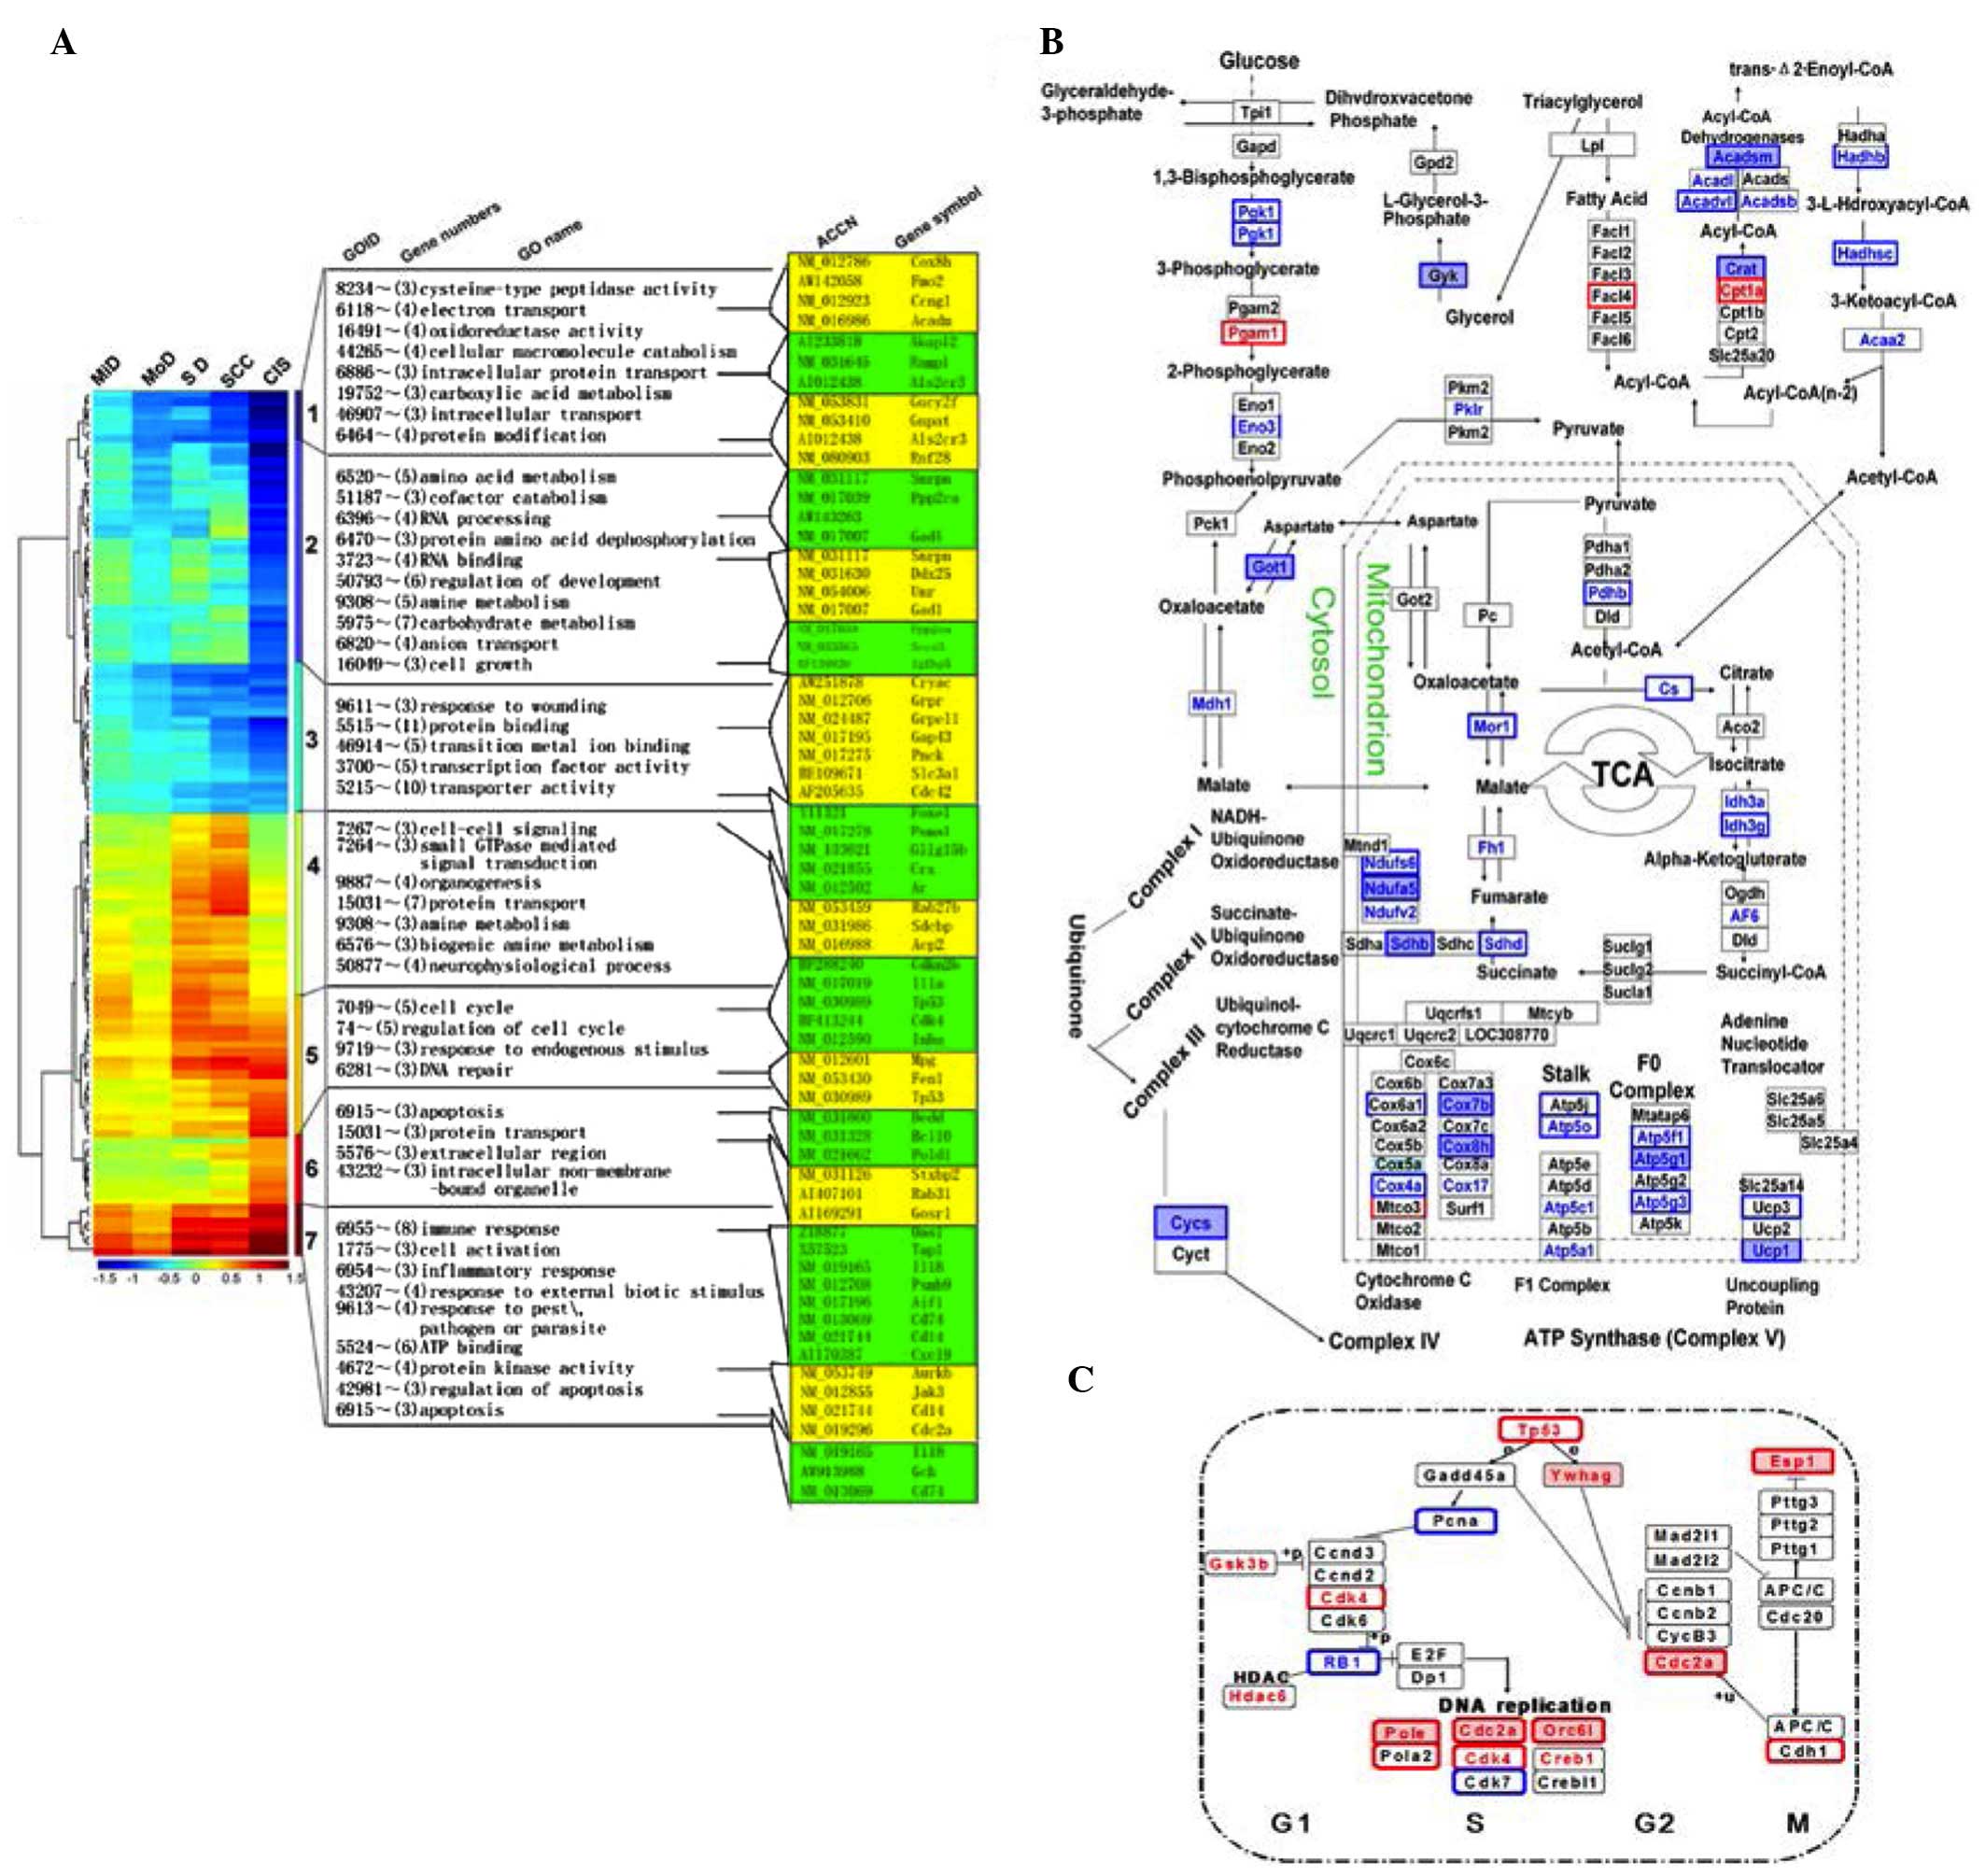
GO enrichment analysis of DEGs in tongue
tissues at each stage during rat tongue carcinogenesis
As presented in Fig.
3A, downregulated genes at the MiD and MoD stage (cluster 1)
were involved in electron transport and mitochondria respiration
complexes, while upregulated genes (cluster 7) were involved in the
immune and inflammatory responses, such as interleukin-1 (IL-1),
CD40 and chemokine (C-X-C motif) ligand 10. Down/upregulated genes
at the SCC stage (cluster 2/6) were associated with carboxylic
acid, amino acid and amine metabolism and the apoptosis pathway,
respectively. Upregulated genes at the SD and CIS stage (cluster 4)
were associated with cell-cell signaling and small GTPase mediated
signal transduction. In addition, down/upregulated genes at the SD
and CIS stage (cluster 3/5) were enriched in cellular metabolism
and transporter activity, as well as cell cycle and DNA repair.
Dynamic gene alterations underlying tricarboxylic acid (TCA) cycle
(Fig. 3B) and DNA repair (Fig. 3C) were also highlighted during rat
oral carcinogenesis.
Verification of five randomly selected
DEGs expression levels by qPCR
According to qPCR analysis, the mRNA levels of Jak3,
Bcl2I2 and NF-κB were significantly higher with the development of
rat oral carcinogenesis (P<0.05), while mRNA levels of Cdc2a and
Tnfrsf1a were significantly elevated at the early and intermediate
stages but were reduced at the late stage (P<0.01; P<0.05)
during rat oral carcinogenesis (Fig.
4). These results are in high concordance with the results from
microarray analysis.
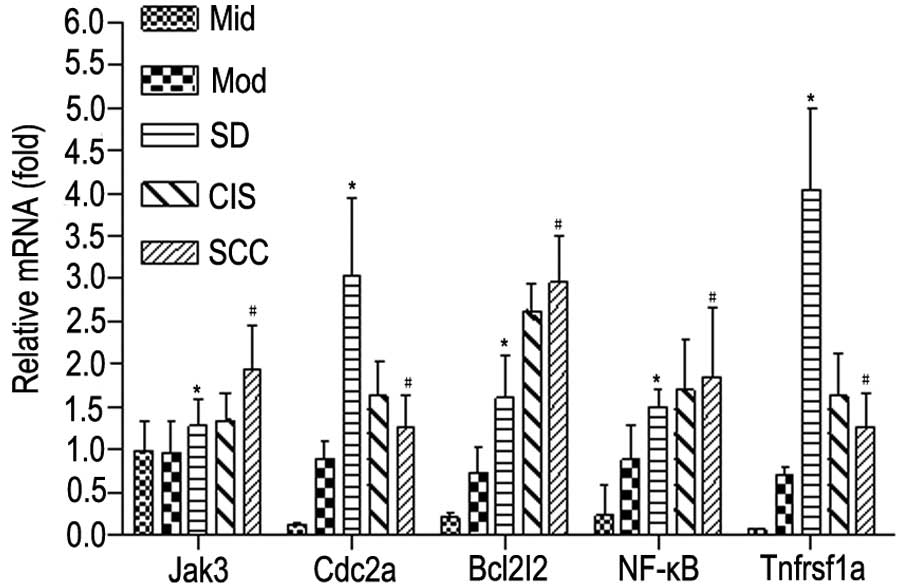 | Figure 4Verification of mRNA levels of Jak3,
Cdc2a, Bcl2I2, NF-κB and Tnfrsf1a by reverse
transcription-quantitative polymerase chain reaction.
*P<0.05 vs. MiD and MoD, #P<0.05 vs.
MiD, MoD and SD. Jak3, janus kinase 3; Cdc2a, cyclin dependant
kinase; Bcl2l2, Bcl-2-like 2; NF-κB; nuclear factor-κB; Tnfrsf1a,
tumor necrosis factor receptor 1; MiD, mild epithelial dysplasia;
MoD, moderate epithelial dysplasia; SD, severe epithelial
dysplasia; CIS, carcinoma in situ; SCC, squamous cell
carcinoma. |
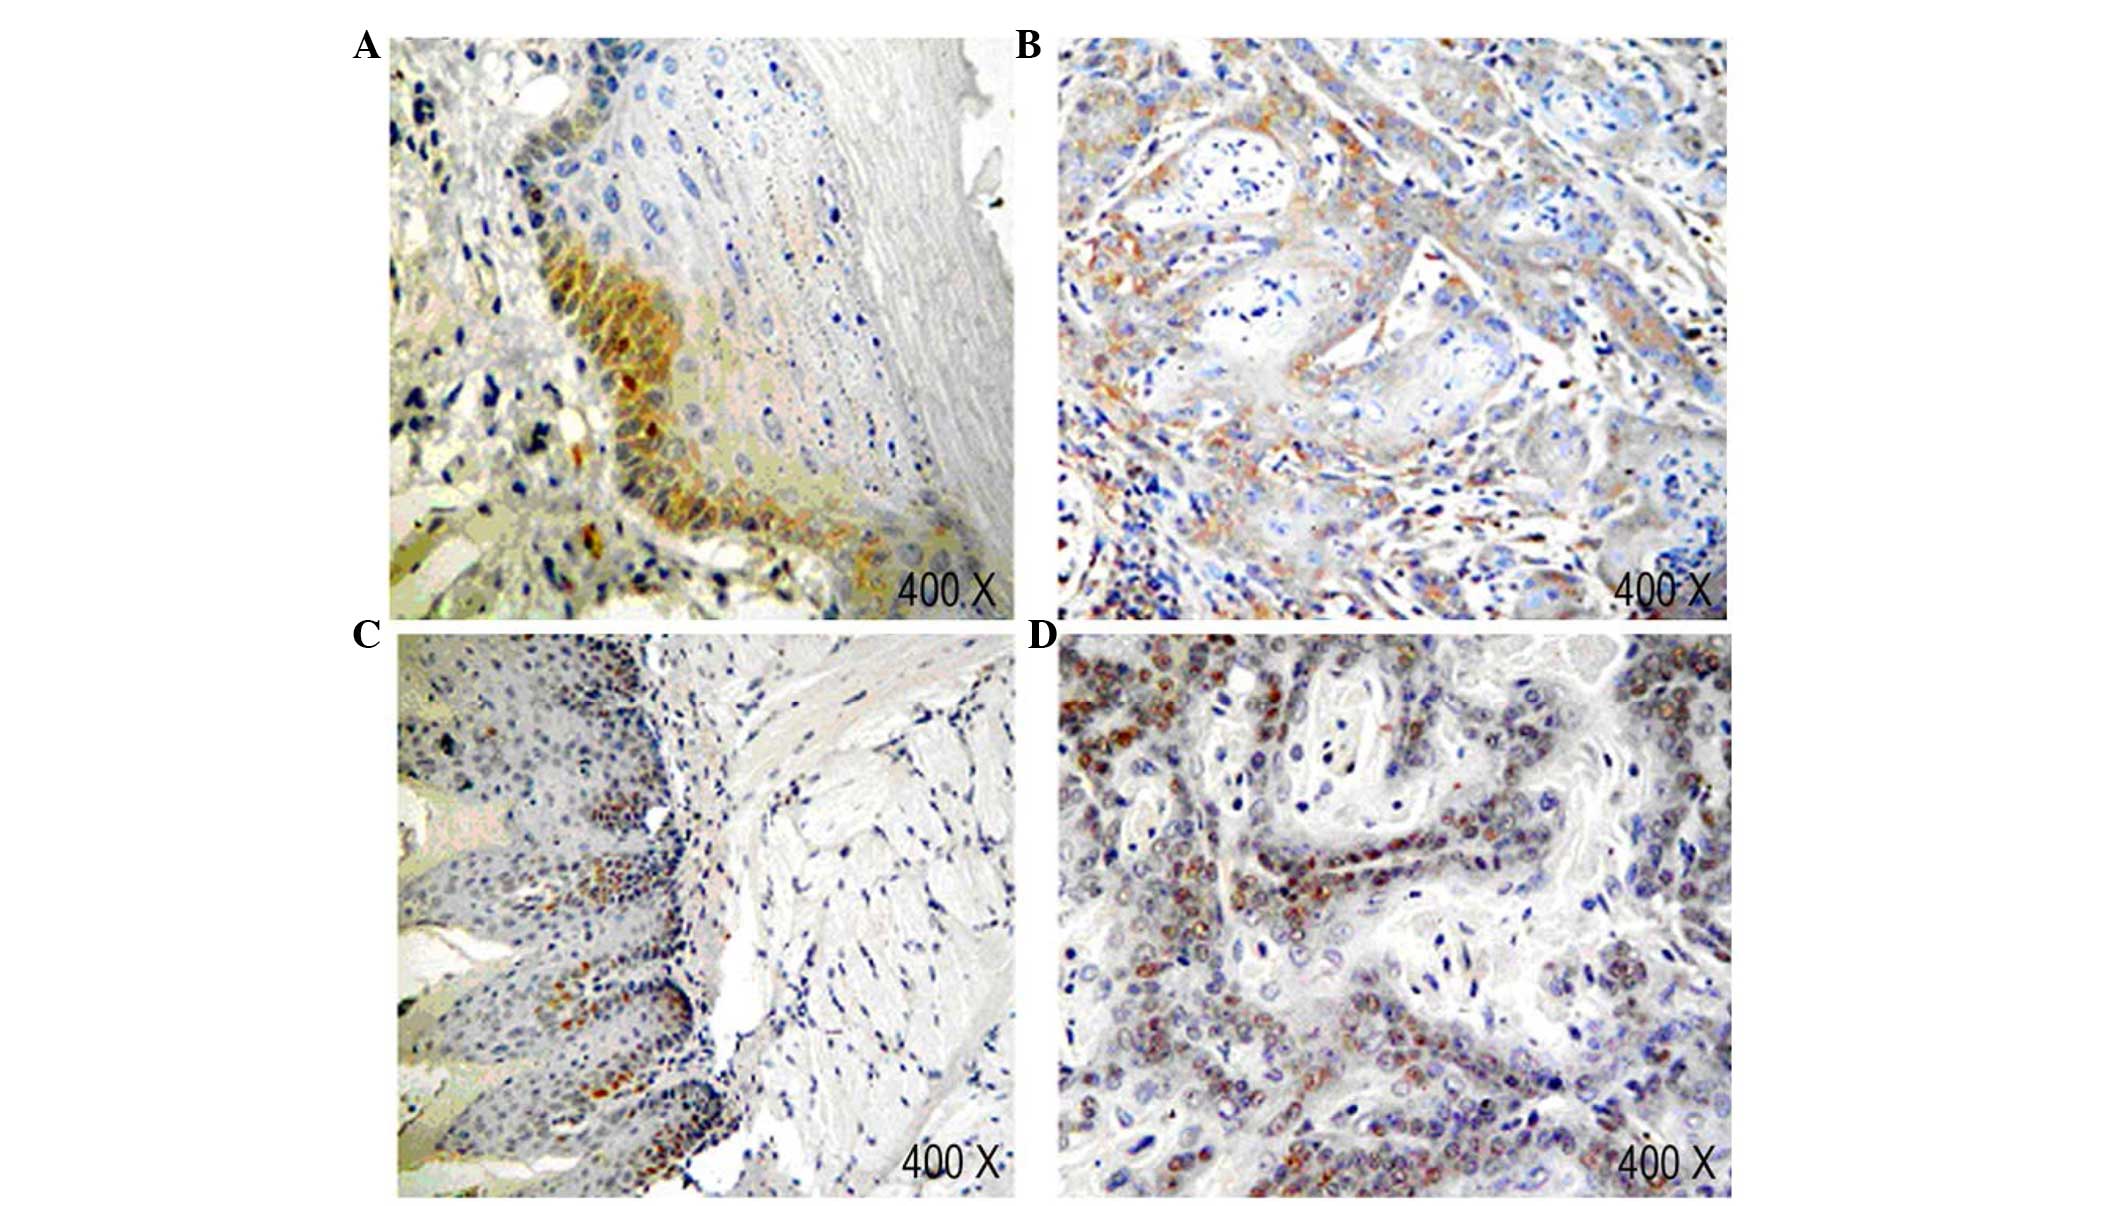
Expression of NF-κBp65 and cyclin D1 in
tongue tissues at each stage during rat tongue carcinogenesis
IHC with anti-NF-κBp65 antibody indicated the
presence of NF-κBp65-labeled cells were identified a fine granular
pattern. The normal sample indicated no expression of NF-κBp65 in
the granular layer. However, in the mild and moderate dysplasia
epithelium, the expression of NF-κBp65 was observed in the basal
cell layer (Fig. 5A). In addition,
the expression of NF-κBp65 marginally increased in parallel with
the severity of dysplasia. Compared with SCC, most samples of
dysplasia epithelium had a weaker expression of NF-κBp65 (Fig. 5B). This result was consistent with
the results of the qPCR.
In normal epithelium, the expression of cyclin D1
was only observed in the nuclei of basal cell layer. In dysplastic
epithelium, the levels of the cyclin D1 protein markedly increased,
and the distribution of positive cells extended from the basal cell
layer to the lower spinous cell layer (Fig. 5C). In the sample of SCC, cyclin
D1-labeled cells were localized in the peripheral layer of tumor
nests (Fig. 5D).
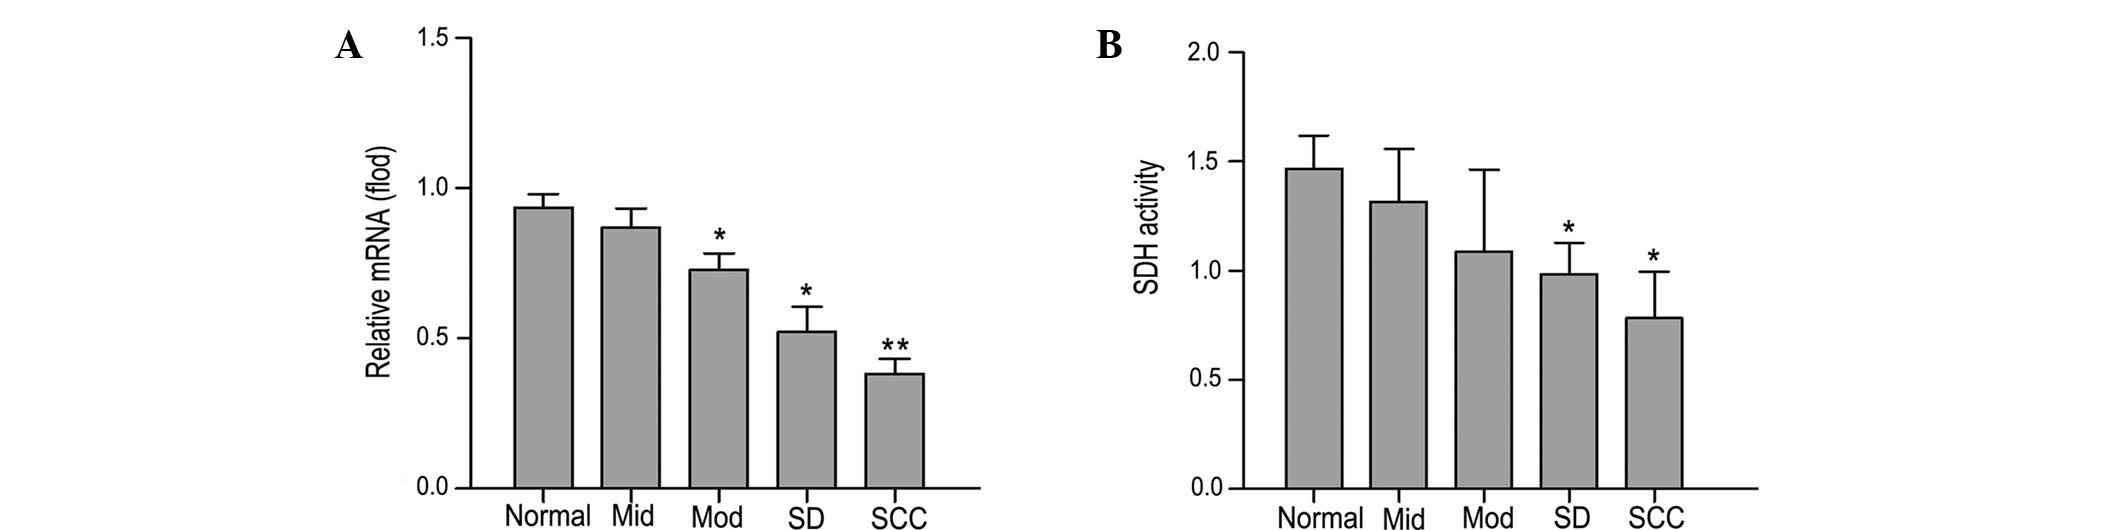
mRNA level of SDH and mitochondrial SDH
activity in tongue tissues at each stage during rat tongue
carcinogenesis
qPCR analysis indicated that the mRNA expression
level of SDH was significantly reduced in tongue tissues during rat
oral carcinogenesis (P<0.05; Fig.
6A). Furthermore, compared with normal tissues, the activity of
mitochondrial SDH was also reduced during carcinogenesis
(P<0.05; Fig. 6B).
Discussion
In the current study, the administration of 4NQO
produced a successive oral carcinogenesis progression model,
including multiple dysplastic, preneoplastic and neoplastic
lesions, following treatment for 9, 13, 20, 24 and 32 weeks. These
sequential changes in the epithelial cells mimicked human oral
cavity neoplastic transformation. Subsequently, 492, 497, 1,176,
1,479 and 1,848 DEGs were identified in tongue tissues of MiD, MoD,
SD, CIS and SCC, respectively. CPP-SOM gene expression data from
the five stages of disease analyzed, indicated a distinct
separation between normal, mild to moderate epithelial dysplasia
and SD to SCC. Therefore, oral carcinogensis was divided into three
stages at the genome-wide level: i) Initiation, early stage (MiD
and MoD); ii) promotion, intermediate stage (SD and CIS); and iii)
progression, late stage (SCC). The changes in the DEGs in these
five stages also confirmed that MiD and MoD were not only an
important early stage, but also an important turning point for oral
carcinogenesis. Additionally, it was determined that these DEGs
were primarily enriched during the cell cycle, apoptosis,
inflammatory response and TCA cycle. The expression levels of
certain DEGs, such as Jak3, Cdc2a, Bcl2I2, NF-κB, Tnfrsf1a, CCND1
and SDH, indicated a high concordance with the results from
microarray data.
Dysregulation of cell proliferation and apoptosis is
considered as a primary event in cancer development (24). In the present study,
transcriptional changes of the cell cycle and apoptosis-associated
genes primarily occurred at the intermediate and later stage of
disease onset. In normal cells, DNA replication is tightly
monitored by cell-cycle checkpoints. Cyclin D1 (CCND1; also known
as the Bcl-1 gene), was a positive regulator of G1 phase
(25), and overexpressed cyclin D1
may increase cancer progression through promoting the G1
phase of the cell cycle (26). In
accordance with the results of the current study, the expression of
CCND1 was increased in previous studies investigating oral cancer
(27) and premalignant lesions
(28). In addition, the Rb
protein, as a key component of G1 checkpoints, may be
activated to lead to G1 arrest by dephosphorylation
(29). In addition, the present
study demonstrated that important positive regulators of the cell
cycle, including key regulators of G1/S transition (CDK2
and CDK4) and the G2/M transition (CDC2 and CCND2), were
upregulated. The upregulation of such a large number of positive
cell cycle regulators and the downregulation of negative regulators
had a synergistic effect on cell proliferation. In addition, the
present study also indicated that there were consequences of
transcriptional remodeling of genes involved in apoptosis. Bcl-2,
as an anti-apoptotic protein (30), was upregulated in the current
study. All these results suggest that the cell cycle regulators and
Bcl-2 may accelerate cancer cell proliferation during oral
carcinogenesis.
A previous study demonstrated that NF-κB is involved
in immune and inflammatory reactions and cell differentiation, in
addition to anti-apoptosis, by inducing the expression of various
genes, such as tumor necrosis factor-α (TNF-α), and IL-1, TNF
receptor-associated factors (31).
Constitutive NF-κB activation had been identified in a large
variety of human malignancies, such as acute lymphoblastic
leukemia, breast cancer, colon cancer, liver cancer and melanoma
(32–35). The present study determined that
the mRNA and protein expression levels of NF-κB increased with the
progression of oral carcinogenesis, which was consistent with the
result of Nakayama et al (36). Additionally, it was determined that
the mRNA levels of Tnfrsf1a were also increased. Over the past
decade, it has been demonstrated that TNF-α is an inflammatory
cytokine important for the tumor initiation process (37). Consistent with the results of the
current study, the expression of TNF-α was elevated in the saliva
of patients with oral SCC compared with patients without oral
lesions (38). These results
indicated that NF-κB promoted an inflammatory response by
regulating the expression of TNF-α during oral carcinogenesis.
In addition to cell proliferation, apoptosis and
inflammatory reactions, the TCA cycle was also observed to be
involved in the early stages of oral carcinogenesis. In the present
study, the activity of key enzymes, such as SDH, isocitrate
dehydrogenase, fumarate hydratase, malate dehydrogenase and
pyruvate dehydrogenase were reduced during oral carcinogenesis.
This may explain why cancer cell morphology and structure change
and the number of mitochondria are markedly reduced in cancer
cells.
SDH consists of four subunits (A, B, C and D), and
acts as a mitochondrial TCA cycle enzyme and a tumor suppressor
(39,40). Inherited or somatic mutations in
subunits B, C or D of SDH may lead to pheochromocytoma (41), paraganglioma (42) or renal cell carcinoma (43). The downregulation of SDH was
observed in gastric carcinoma (44). Selak et al (40) determined that succinate, which
accumulates as a result of SDH inhibition, inhibited
hypoxia-inducible factor-α (HIF-α) prolyl hydroxylase, and then led
to the stabilization and activation of HIF-α. Subsequently, HIF-α
entered the nucleus and increased the expression of genes, such as
platelet-derived growth-factor receptor and EGFR, which in turn
facilitated glycolysis, metastasis and angiogenesis, eventually
leading to tumor progression (40). In addition, as SDH is embedded in
the inner mitochondrial membrane, mutant SDH subunits may alter the
membrane composition, and thus lead to a mitochondrion resistant to
apoptosis (45). This indicates
that the TCA cycle may be closely associated with oral
carcinogenesis through the regulation of SDH.
In summary, oral carcinogenesis is a multi-step and
multi-gene process, with a distinct pattern of alteration along a
continuum of malignant transformation. Further investigations are
necessary to validate these observations, which may enhance the
understanding of the molecular alterations associated with oral
carcinogenesis.
Acknowledgments
The authors would like to thank Shanghai Biochip
Co., Ltd. for their technical support. The present study was
supported by grants from the Youth Project of the National Natural
Science Foundation of China (grant no. 30700944) and the Shanghai
Municipal Health Bureau (grant no. 2012092).
References
|
1
|
Ferlay J, Bray F, Parkin DM and Pisani P:
Globocan 2000: Cancer Incidence and Mortality Worldwide. (IARC
Cancer Bases No. 5). IARCPress; Lyon: 2001
|
|
2
|
Warnakulasuriya S: Global epidemiology of
oral and oropha-ryngeal cancer. Oral Oncol. 45:309–316. 2009.
View Article : Google Scholar
|
|
3
|
Kademani D, Bell RB, Schmidt BL,
Blanchaert R, Fernandes R, Lambert P and Tucker WM; American
Association of Oral and Maxillofacial Surgeons Task Force on Oral
Cancer: A preliminary report from the American Association of Oral
and Maxillofacial Surgeons Task Force on Oral Cancer. J Oral
Maxillofac Surg. 66:2151–2157. 2008. View Article : Google Scholar : PubMed/NCBI
|
|
4
|
Ram H, Sarkar J, Kumar H, Konwar R, Bhatt
ML and Mohammad S: Oral cancer: Risk factors and molecular
pathogenesis. J Maxillofac Oral Surg. 10:132–137. 2011. View Article : Google Scholar :
|
|
5
|
Williams H: Molecular pathogenesis of oral
squamous carcinoma. Mol Pathol. 53:165–172. 2000. View Article : Google Scholar : PubMed/NCBI
|
|
6
|
Nagpal JK and Das BR: Oral cancer:
Reviewing the present understanding of its molecular mechanism and
exploring the future directions for its effective management. Oral
Oncol. 39:213–221. 2003. View Article : Google Scholar : PubMed/NCBI
|
|
7
|
Shaw R: The epigenetics of oral cancer.
Int J Oral Maxillofac Surg. 35:101–108. 2006. View Article : Google Scholar
|
|
8
|
Scully C, Field JK and Tanzawa H: Genetic
aberrations in oral or head and neck squamous cell carcinoma
(SCCHN): 1. Carcinogen metabolism, DNA repair and cell cycle
control. Oral Oncol. 36:256–263. 2000. View Article : Google Scholar : PubMed/NCBI
|
|
9
|
Todd R, Chou MY, Matossian K, Gallagher
GT, Donoff RB and Wong DT: Cellular sources of transforming growth
factor-alpha in human oral cancer. J Dent Res. 70:917–923. 1991.
View Article : Google Scholar : PubMed/NCBI
|
|
10
|
Partridge M, Gullick WJ, Langdon JD and
Sherriff M: Expression of epidermal growth factor receptor on oral
squamous cell carcinoma. Br J Oral Maxillofac Surg. 26:381–389.
1988. View Article : Google Scholar : PubMed/NCBI
|
|
11
|
McDonald JS, Jones H, Pavelic ZP, Pavelic
LJ, Stambrook PJ and Gluckman JL: Immunohistochemical detection of
the H-ras, K-ras, and N-ras oncogenes in squamous cell carcinoma of
the head and neck. J Oral Pathol Med. 23:342–346. 1994. View Article : Google Scholar : PubMed/NCBI
|
|
12
|
Williams HK, Sanders DS, Jankowski JA,
Landini G and Brown AM: Expression of cadherins and catenins in
oral epithelial dysplasia and squamous cell carcinoma. J Oral
Pathol Med. 27:308–317. 1998. View Article : Google Scholar : PubMed/NCBI
|
|
13
|
Ravi D, Ramadas K, Mathew BS, Nalinakumari
KR, Nair MK and Pillai MR: De novo programmed cell death in oral
cancer. Histopathology. 34:241–249. 1999. View Article : Google Scholar : PubMed/NCBI
|
|
14
|
Duggan DJ, Bittner M, Chen Y, Meltzer P
and Trent JM: Expression profiling using cDNA microarrays. Nat
Genet. 21(Suppl): 10–14. 1999. View
Article : Google Scholar : PubMed/NCBI
|
|
15
|
Kuo WP, Whipple ME, Sonis ST, Ohno-Machado
L and Jenssen TK: Gene expression profiling by DNA microarrays and
its application to dental research. Oral Oncol. 38:650–656. 2002.
View Article : Google Scholar : PubMed/NCBI
|
|
16
|
Hwang D, Alevizos I, Schmitt WA, Misra J,
Ohyama H, Todd R, Mahadevappa M, Warrington JA, Stephanopoulos G,
Wong DT and Stephanopolus G: Genomic dissection for
characterization of cancerous oral epithelium tissues using
transcription profiling. Oral Oncol. 39:259–268. 2003. View Article : Google Scholar : PubMed/NCBI
|
|
17
|
Alevizos I, Mahadevappa M, Zhang X, Ohyama
H, Kohno Y, Posner M, Gallagher GT, Varvares M, Cohen D, Kim D, et
al: Oral cancer in vivo gene expression profiling assisted by laser
capture microdissection and microarray analysis. Oncogene.
20:6196–6204. 2001. View Article : Google Scholar : PubMed/NCBI
|
|
18
|
Tang XH, Knudsen B, Bemis D, Tickoo S and
Gudas LJ: Oral cavity and esophageal carcinogenesis modeled in
carcinogen-treated mice. Clin Cancer Res. 10:301–313. 2004.
View Article : Google Scholar : PubMed/NCBI
|
|
19
|
Kramer IR, Lucas RB, Pindborg JJ and Sobin
LH: Definition of leukoplakia and related lesions: An aid to
studies on oral precancer. Oral Surg Oral Med Oral Pathol.
46:518–539. 1978. View Article : Google Scholar : PubMed/NCBI
|
|
20
|
Horcajadas JA, Sharkey AM, Catalano RD,
Sherwin JR, Domínguez F, Burgos LA, Castro A, Peraza MR, Pellicer A
and Simón C: Effect of an intrauterine device on the gene
expression profile of the endometrium. J Clin Endocrinol Metab.
91:3199–3207. 2006. View Article : Google Scholar : PubMed/NCBI
|
|
21
|
Xiao L, Wang K, Teng Y and Zhang J:
Component plane presentation integrated self-organizing map for
microarray data analysis. FEBS Lett. 538:117–124. 2003. View Article : Google Scholar : PubMed/NCBI
|
|
22
|
Dennis G Jr, Sherman BT, Hosack DA, Yang
J, Gao W, Lane HC and Lempicki RA: DAVID: Database for annotation,
visualization, and integrated discovery. Genome Biol. 4:32003.
View Article : Google Scholar
|
|
23
|
Livak KJ and Schmittgen TD: Analysis of
relative gene expression data using real-time quantitative PCR and
the 2−ΔΔCt method. Methods. 25:402–408. 2001. View Article : Google Scholar
|
|
24
|
Evan GI and Vousden KH: Proliferation,
cell cycle and apoptosis in cancer. Nature. 411:342–348. 2001.
View Article : Google Scholar : PubMed/NCBI
|
|
25
|
Smith BD and Haffty BG: Molecular markers
as prognostic factors for local recurrence and radioresistance in
head and neck squamous cell carcinoma. Radiat Oncol Investig.
7:125–144. 1999. View Article : Google Scholar : PubMed/NCBI
|
|
26
|
Quelle DE, Ashmun RA, Shurtleff SA, Kato
JY, Bar-Sagi D, Roussel MF and Sherr CJ: Overexpression of mouse
D-type cyclins accelerates G1 phase in rodent fibroblasts. Genes
Dev. 7:1559–1571. 1993. View Article : Google Scholar : PubMed/NCBI
|
|
27
|
Miyamoto R, Uzawa N, Nagaoka S, Hirata Y
and Amagasa T: Prognostic significance of cyclin D1 amplification
and overexpression in oral squamous cell carcinomas. Oral Oncol.
39:610–618. 2003. View Article : Google Scholar : PubMed/NCBI
|
|
28
|
Robinson CM, Prime SS, Huntley S, Stone
AM, Davies M, Eveson JW and Paterson IC: Overexpression of JunB in
undifferentiated malignant rat oral keratinocytes enhances the
malignant phenotype in vitro without altering cellular
differentiation. Int J Cancer. 91:625–630. 2001. View Article : Google Scholar : PubMed/NCBI
|
|
29
|
Cheng YH, Li LA, Lin P, Cheng LC, Hung CH,
Chang NW and Lin C: Baicalein induces G1 arrest in oral cancer
cells by enhancing the degradation of cyclin D1 and activating AhR
to decrease Rb phosphorylation. Toxicol Appl Pharmacol.
263:360–367. 2012. View Article : Google Scholar : PubMed/NCBI
|
|
30
|
Wilson GD, Saunders MI, Dische S, Richman
PI, Daley FM and Bentzen SM: bcl-2 expression in head and neck
cancer: An enigmatic prognostic marker. Int J Radial Oncol Biol
Phys. 49:435–441. 2001. View Article : Google Scholar
|
|
31
|
May MJ and Ghosh S: Signal transduction
through NF-kappaB. Immunol Today. 19:80–88. 1998. View Article : Google Scholar : PubMed/NCBI
|
|
32
|
Tracey L, Streck CJ, Du Z, Williams RF,
Pfeffer LM, Nathwani AC and Davidoff AM: NF-kappaB activation
mediates resistance to IFNbeta in MLL-rearranged acute
lymphoblastic leukemia. Leukemia. 24:806–812. 2010. View Article : Google Scholar : PubMed/NCBI
|
|
33
|
Shostak K and Chariot A: NF-κB, stem cells
and breast cancer: The links get stronger. Breast Cancer Res.
13:2142011. View
Article : Google Scholar
|
|
34
|
Fan Y, Mao R and Yang J: NF-κB and STAT3
signaling pathways collaboratively link inflammation to cancer.
Protein Cell. 4:176–185. 2013. View Article : Google Scholar : PubMed/NCBI
|
|
35
|
Thu YM, Su Y, Yang J, Splittgerber R, Na
S, Boyd A, Mosse C, Simons C and Richmond A: NF-κB inducing kinase
(NIK) modulates melanoma tumorigenesis by regulating expression of
pro-survival factors through the β-catenin pathway. Oncogene.
31:2580–2592. 2012. View Article : Google Scholar :
|
|
36
|
Nakayama H, Ikebe T, Beppu M and Shirasuna
K: High expression levels of nuclear factor kappa-B, IκB kinase α
and Akt kinase in squamous cell carcinoma of the oral cavity.
Cancer. 92:3037–3044. 2001. View Article : Google Scholar : PubMed/NCBI
|
|
37
|
Arnott CH, Scott KA, Moore RJ, Hewer A,
Phillips DH, Parker P, Balkwill FR and Owens DM: Tumour necrosis
factor-alpha mediates tumour promotion via a PKC alpha- and
AP-1-dependent pathway. Oncogene. 21:4728–4738. 2002. View Article : Google Scholar : PubMed/NCBI
|
|
38
|
Rhodus NL, Ho V, Miller CS, Myers S and
Ondrey F: NF-kappaB dependent cytokine levels in saliva of patients
with oral preneoplastic lesions and oral squamous cell carcinoma.
Cancer Detect Prev. 29:42–45. 2005. View Article : Google Scholar : PubMed/NCBI
|
|
39
|
Senthilnathan P, Padmavathi R, Magesh V
and Sakthisekaran D: Modulation of TCA cycle enzymes and electron
transport chain systems in experimental lung cancer. Life Sci.
78:1010–1014. 2006. View Article : Google Scholar
|
|
40
|
Selak MA, Armour SM, MacKenzie ED,
Boulahbel H, Watson DG, Mansfield KD, Pan Y, Simon MC, Thompson CB
and Gottlieb E: Succinate links TCA cycle dysfunction to
oncogenesis by inhibiting HIF-alpha prolyl hydroxylase. Cancer
Cell. 7:77–85. 2005. View Article : Google Scholar : PubMed/NCBI
|
|
41
|
Bayley JP, Devilee P and Taschner PE: The
SDH mutation database: An online resource for succinate
dehydrogenase sequence variants involved in pheochromocytoma,
paraganglioma and mitochondrial complex II deficiency. BMC Med
Genet. 6:392005. View Article : Google Scholar : PubMed/NCBI
|
|
42
|
Hao HX, Khalimonchuk O, Schraders M,
Dephoure N, Bayley JP, Kunst H, Devilee P, Cremers CW, Schiffman
JD, Bentz BG, et al: SDH5, a gene required for flavination of
succinate dehydrogenase, is mutated in paraganglioma. Science.
325:1139–1142. 2009. View Article : Google Scholar : PubMed/NCBI
|
|
43
|
Ricketts C, Woodward ER, Killick P, Morris
MR, Astuti D, Latif F and Maher ER: Germline SDHB mutations and
familial renal cell carcinoma. J Natl Cancer Inst. 100:1260–1262.
2008. View Article : Google Scholar : PubMed/NCBI
|
|
44
|
Janeway KA, Kim SY, Lodish M, Nosé V,
Rustin P, Gaal J, Dahia PL, Liegl B, Ball ER, Raygada M, et al NIH
Pediatric and Wild-Type GIST Clinic: Defects in succinate
dehydrogenase in gastrointestinal stromal tumors lacking KIT and
PDGFRA mutations. Proc Natl Acad Sci USA. 108:314–318. 2011.
View Article : Google Scholar :
|
|
45
|
Raimundo N, Baysal BE and Shadel GS:
Revisiting the TCA cycle: Signaling to tumor formation. Trends Mol
Med. 17:641–649. 2011. View Article : Google Scholar : PubMed/NCBI
|