Introduction
Parkinson's disease (PD) is the second most common
neurodegenerative disorder of the central nervous system, with an
estimated prevalence and incidence of 2 per 100,000 people and 797
per 100,000 person-years in China (1). PD is characterized by the progressive
degeneration of dopaminergic neurons in the substantia nigra pars
compacta and the accumulation of Lewy bodies;
α-synuclein-containing inclusions suggested to contribute to motor
impairment (2,3). Clinical symptoms include
bradykinesia, rigidity, tremors, gait impairment and postural
instability, which adversely affect survival and quality of life in
patients with PD (4,5). Thus, investigating the pathogenesis
of PD and exploring effective therapeutic approaches is of great
importance.
Significant effort has been applied to elucidating
the molecular mechanisms underlying PD using high throughput
microarray technology (6–13). Resultant data are deposited in
public databases including the Gene Expression Omnibus (GEO) and
ArrayExpress. For example, Zhang et al (7) analyzed gene expression profiles of
three brain regions, the substantia nigra, the putamen and Brodmann
area 9, demonstrating decreased expression of the proteasome
endopeptidase complex NADH, but increased expression of heat shock
proteins, metallothioneins, polypyrimidine tract-binding protein
and synucleins in PD. Garcia-Esparcia et al (13) investigated changes in gene
expression in the frontal cortex and reported downregulated
cortical olfactory receptor levels (including OR2L13, OR1E1, OR2J3,
OR52L1 and OR11H1) and upregulated taste receptor levels (TAS2R5
and TAS2R50) in patients with PD. However, these datasets are based
on different microarray platforms, different sample sources and use
small sample sizes, which make their results somewhat inconsistent
and difficult to use clinically. Therefore, to discover and
understand the common hallmark traits of PD, information from
multiple studies should be integrated (14,15).
In addition, despite the identification of several markers for the
progression of PD, the relationships between genes, the expression
of genes and clinical traits of PD remain unclear. Weighted gene
co-expression network analysis (WGCNA) can be used to explore these
relationships as previously reported (14–16).
The goal of the present study was to analyze a
dataset comprising 427 samples collected from 17 publically
available datasets, utilizing WGCNA to identify common PD risk
genes from different brain regions and functional modules
associated with clinical traits.
Materials and methods
Collection of gene expression
data
Gene expression data of PD, submitted prior to April
10th, 2015, were collected from ArrayExpress using the key word
‘Parkinson's disease’ under the two screening conditions
(organisms: Homo sapiens; experiment type: RNA array). The
following gene expression data were manually excluded: Non-PD
studies, studies using cell lines, samples exposed to drugs, blood
or leukocyte samples, in vitro studies and repeated
data.
Screening of microarray platforms
Annotated files of microarray platforms were also
downloaded from ArrayExpress. The total number of genes for each
microarray platform and the number of overlapping genes between
platforms was calculated. Microarray platforms with <10,000
genes or <6,000 overlapping genes were excluded.
Data pre-treatment
Raw data files (CEL files) of Affymetrix platforms
(excluding Affy HUGENE; Affymetrix; Thermo Fisher Scientific, Inc.,
Waltham, MA, USA) were read with the function ReadAffy of the
package Aff (Affymetrix; Thermo Fisher Scientific, Inc.) in R
(17). This was followed by
background correction, probe level normalization and expression
value calculation using the Robust Multi-array Average (RMA)
algorithm (18). Microarray data
from the Agilent platform (Agilent Technologies, Inc., Santa Clara,
CA, USA) were read with the function read.table of R and normalized
with linear models for microarray data (LIMMA) package (19). Extraction and normalization of the
microarray data from Affymetrix HUGENE was achieved using the
read.celfiles and RMA function of the package oligo (20). Probes were mapped into genes
according to the annotation files, and probes mapping to the same
gene were averaged as the final expression level of the gene.
Overlapping genes of different platforms were retained for further
analysis. To overcome variance in overall gene expression levels
resulting from diverse pretreatments, ComBat from the package sva
(21) was adopted to combine all
the microarray data.
Screening of commonly disturbed
genes
By combining gene co-expression networks and
clinical information, including brain region, age, sex and sample
type, a WGCNA package was adopted (22) to screen out commonly disturbed
genes in different brain regions. Cluster analysis was performed on
the samples, using the function hclust to exclude outliers. A
height of 125 was set as the cut-off point. Cluster analysis was
then performed again for the samples, using clinical information to
check the distribution of clinical features among samples.
Microarray platform information was also included in the analysis
to examine the effect of data normalization. A gene co-expression
network was constructed, from which gene co-expression modules
closely associated with clinical features (i.e. commonly disturbed
genes) were screened out.
Functional enrichment analysis
Functional enrichment analysis, using biological
processes from the Gene Ontology (GO) Consortium (http://david.ncifcrf.gov/) and pathways from the Kyoto
Encyclopedia of Genes and Genomes (KEGG) (23), was performed for commonly disturbed
genes using the Database for Annotation, Visualization, and
Integrated Discovery (DAVID) online tool (24). P-values were calculated using the
hypergeometric distribution and adjusted by the Benjamini and
Honchberg method (25). A false
discovery rate (FDR) of <0.05 was set as the cut-off point.
Co-pathway analysis
Pathway information was downloaded from KEGG
(26). Pathway expression level
was determined as the median expression level of all genes in the
pathway:
Pathik=Mediank(g1,g2,g3,…,gn)
Where Pathik represents the
expression level of pathway i in sample k.
g1, g2, g3,… gn
represent expression levels of all genes from pathway i in
sample k. A pathway expression network was established when
expression levels were determined for each pathway.
The correlation of two pathways in both PD samples
and normal samples was examined with Pearson's correlation
coefficient:
PX,Y=ε(X–X¯)(Y–Y¯)ε(X–X¯)2ε(Y–Y¯)2
Where Px,y represents Pearson's
correlation coefficient of pathway x and pathway y in
all samples. X and Y represent the average expression levels of
pathway x and pathway y in all samples. Co-pathway
relationships with a Pearson correlation coefficient >0.99 were
selected out.
If dysfunction of two pathways is associated with a
disease, then common genes in the two pathways are likely to be
involved in the disease. Therefore, disease-associated co-pathway
relationships were screened using a hypergeometric
distribution-based test:
p=1–εi=0k–1CMiCN–Mn–iCNn
Where n represents the number of common risk
genes; N represents the number of total genes in both
pathways and M represents the number of total risk genes in
both pathways. P<0.05 was set as the threshold.
Construction of risk gene pathway
network
Common risk genes were acquired from pathway pairs.
Risk gene pathway relationships were obtained and visualized with
Cytoscape (27).
Results
Microarray data collection
A total of 69 microarray datasets were obtained by
preliminary search. Based upon the exclusion criteria, 19 datasets
were used for further analysis. They were generated from 10
microarray platforms (Table I):
A-AFFY-33, A-AFFY-34, A-AFFY-37, A-AFFY-41, A-AFFY-44, A-AFFY-54
(Affymetrix; Thermo Fisher Scientific, Inc.), A-MEXP-1174
(Illumina, Inc., San Diego, CA, USA), A-AGIL-28 (Agilent),
A-GEOD-17047 and A-AFFY-168 (Affy HUGENE; Affymetrix; Thermo Fisher
Scientific, Inc.).
 | Table I.Summary of the 19 included microarray
datasets. |
Table I.
Summary of the 19 included microarray
datasets.
| ArrayExpress
ID | Number of
samples | Submission
date | Microarray
platform | (Refs.) |
|---|
| E-GEOD-20163 | 17 | 2011/1/20 | AFFY-33 | (6) |
| E-GEOD-20164 | 11 | 2011/1/20 | AFFY-33 | (6) |
| E-GEOD-20168 | 30 | 2010/2/22 | AFFY-33 | (7) |
| E-GEOD-20291 | 30 | 2010/3/23 | AFFY-33 | (7) |
| E-GEOD-20292 | 26 | 2010/3/23 | AFFY-33 | (7) |
| E-GEOD-20314 | 8 | 2011/1/20 | AFFY-33 | (6) |
| E-GEOD-8397 | 94 | 2008/6/16 | AFFY-33 | (8) |
|
|
|
| AFFY-34 |
|
|
E-GEOD-19587a | 22 | 2010/8/19 | AFFY-37 |
|
|
E-GEOD-20333b | 12 | 2010/3/23 | AFFY-41 |
|
| E-GEOD-20141 | 18 | 2010/2/22 | AFFY-44 | (6) |
| E-GEOD-20146 | 20 | 2010/2/22 | AFFY-44 | (6) |
| E-GEOD-7621 | 25 | 2008/11/6 | AFFY-44 | (9) |
| E-GEOD-24378 | 17 | 2011/1/20 | AFFY-54 | (6) |
| E-MEXP-1416 | 16 | 2008/1/19 | AFFY-54 | (10) |
|
E-GEOD-28894c | 114 | 2011/7/21 | MEXP-1174 |
|
| E-GEOD-43490 | 41 | 2015/1/11 | AGIL-28 | (11) |
| E-MTAB-812 | 53 | 2012/9/19 | AGIL-28 | (12) |
| E-GEOD-54282 | 33 | 2014/9/1 | GEOD-17047 | (12) |
| E-MTAB-1194 | 18 | 2013/6/2 | AFFY-168 | (13) |
Annotation files for the 10 platforms were
downloaded from ArrayExpress (Table
II). AFFY-34 and AFFY-41 were excluded due to containing only a
small number of genes (9,659 and 8,166 genes, respectively) and few
genes overlapped (2,508).
MEXP-1174 was also removed as it had <7,000 overlapping genes,
although it detected 10,742 genes. 7 platforms were retained:
AFFY-33, AFFY-37, AFFY-44, AFFY-54, AGIL-28, GEOD-17047 and
AFFY-168, containing a total of 10,898 genes.
| Table II.Number of overlapping genes between
platforms. |
Table II.
Number of overlapping genes between
platforms.
| Microarray
platform | AFFY-33 | AFFY-34 | AFFY-37 | AFFY-41 | AFFY-44 | AFFY-54 | AGIL-28 | GEOD-17047 | AFFY-168 | MEXP-1174 |
|---|
| AFFY-33 | 12504 |
|
|
|
|
|
|
|
|
|
| AFFY-34 | 4321 | 9659 |
|
|
|
|
|
|
|
|
| AFFY-37 | 12504 | 4231 | 12504 |
|
|
|
|
|
|
|
| AFFY-41 | 8166 | 2508 | 8166 | 8166 |
|
|
|
|
|
|
| AFFY-44 | 12504 | 9659 | 12504 | 8166 | 20150 |
|
|
|
|
|
| AFFY-54 | 12431 | 9626 | 12431 | 8132 | 20027 | 20084 |
|
|
|
|
| AGIL-28 | 11119 | 7127 | 11119 | 7747 | 15173 | 15123 | 27277 |
|
|
|
| GEOD-17047 | 12146 | 8497 | 12146 | 8078 | 17486 | 17438 | 17438 | 19594 |
|
|
| AFFY-168 | 12087 | 8461 | 12087 | 8044 | 17397 | 17347 | 17347 | 19430 | 19430 |
|
| MEXP-1174 | 6813 | 4049 | 6813 | 4075 | 8487 | 8464 | 8464 | 8604 | 8564 | 10742 |
Clinical information
Clinical information relating to 17 microarray
datasets from 7 open access platforms was collected and processed.
Clinical information was obtained for 427 cases, including 227
cases of PD and 200 controls. PD samples were obtained from 114
male patients and 54 female patients at the age of 54–94, while
control samples were obtained from 97 males and 55 females at the
age of 49–97. Thirteen different brain regions were covered, and
detailed information is displayed in Table III.
| Table III.Clinical information for the 17
selected microarray datasets. |
Table III.
Clinical information for the 17
selected microarray datasets.
|
| Gender |
|
|---|
|
|
|
|
|---|
|
| Male | Female | All | Age range |
|---|
| Brain region |
|
|
|
|
| Cerebellum |
|
|
|
|
| PD | NA | NA | 4 | 74–85 |
|
Control | NA | NA | 4 | 81–86 |
| Cortex |
|
|
|
|
| PD | 4 | 1 | 5 | 64–84 |
|
Control | 2 | 3 | 5 | 64–91 |
| Dopamine
neurons |
|
|
|
|
| PD | 4 | 4 | 16 | 66–94 |
|
Control | 4 | 4 | 17 | 61–89 |
| Dorsal motor
nucleus of the vagus |
|
|
|
|
| PD | 8 | 6 | 14 | 64–90 |
|
Control | 7 | 4 | 11 | 58–90 |
| Frontal lobe |
|
|
|
|
| PD | 6 | 5 | 11 | 54–79 |
|
Control | 3 | 4 | 7 | 49–82 |
| Globus pallidus
interna |
|
|
|
|
| PD | 7 | 4 | 11 | NA |
|
Control | 5 | 4 | 9 | NA |
| Inferior olivary
nucleus |
|
|
|
|
| PD | 3 | 3 | 6 | 74–81 |
|
Control | 3 | 1 | 4 | 73–84 |
| Locus
coeruleus |
|
|
|
|
| PD | 5 | 2 | 7 | 64–90 |
|
Control | 5 | 2 | 7 | 58–90 |
| Prefrontal cortex
BA9 |
|
|
|
|
| PD | 35 | 6 | 41 | 64–94 |
|
Control | 37 | 5 | 42 | 54–97 |
| Putamen |
|
|
|
|
| PD | 9 | 6 | 15 | 67–89 |
|
Control | 10 | 5 | 15 | (54, 94) |
| Striatum |
|
|
|
|
| PD | 4 | 2 | 6 | (60, 84) |
|
Control | 2 | 4 | 6 | (64, 91) |
| Substantia
nigra |
|
|
|
|
| PD | 30 | 14 | 86 | (64, 90) |
|
Control | 19 | 18 | 69 | (64, 94) |
| Superior frontal
gyrus |
|
|
|
|
| PD | NA | NA | 5 | NA |
|
Control | NA | NA | 3 | NA |
| Total |
|
|
|
|
| PD | 114 | 54 | 227 | (54, 94) |
|
Control | 97 | 55 | 200 | (49, 97) |
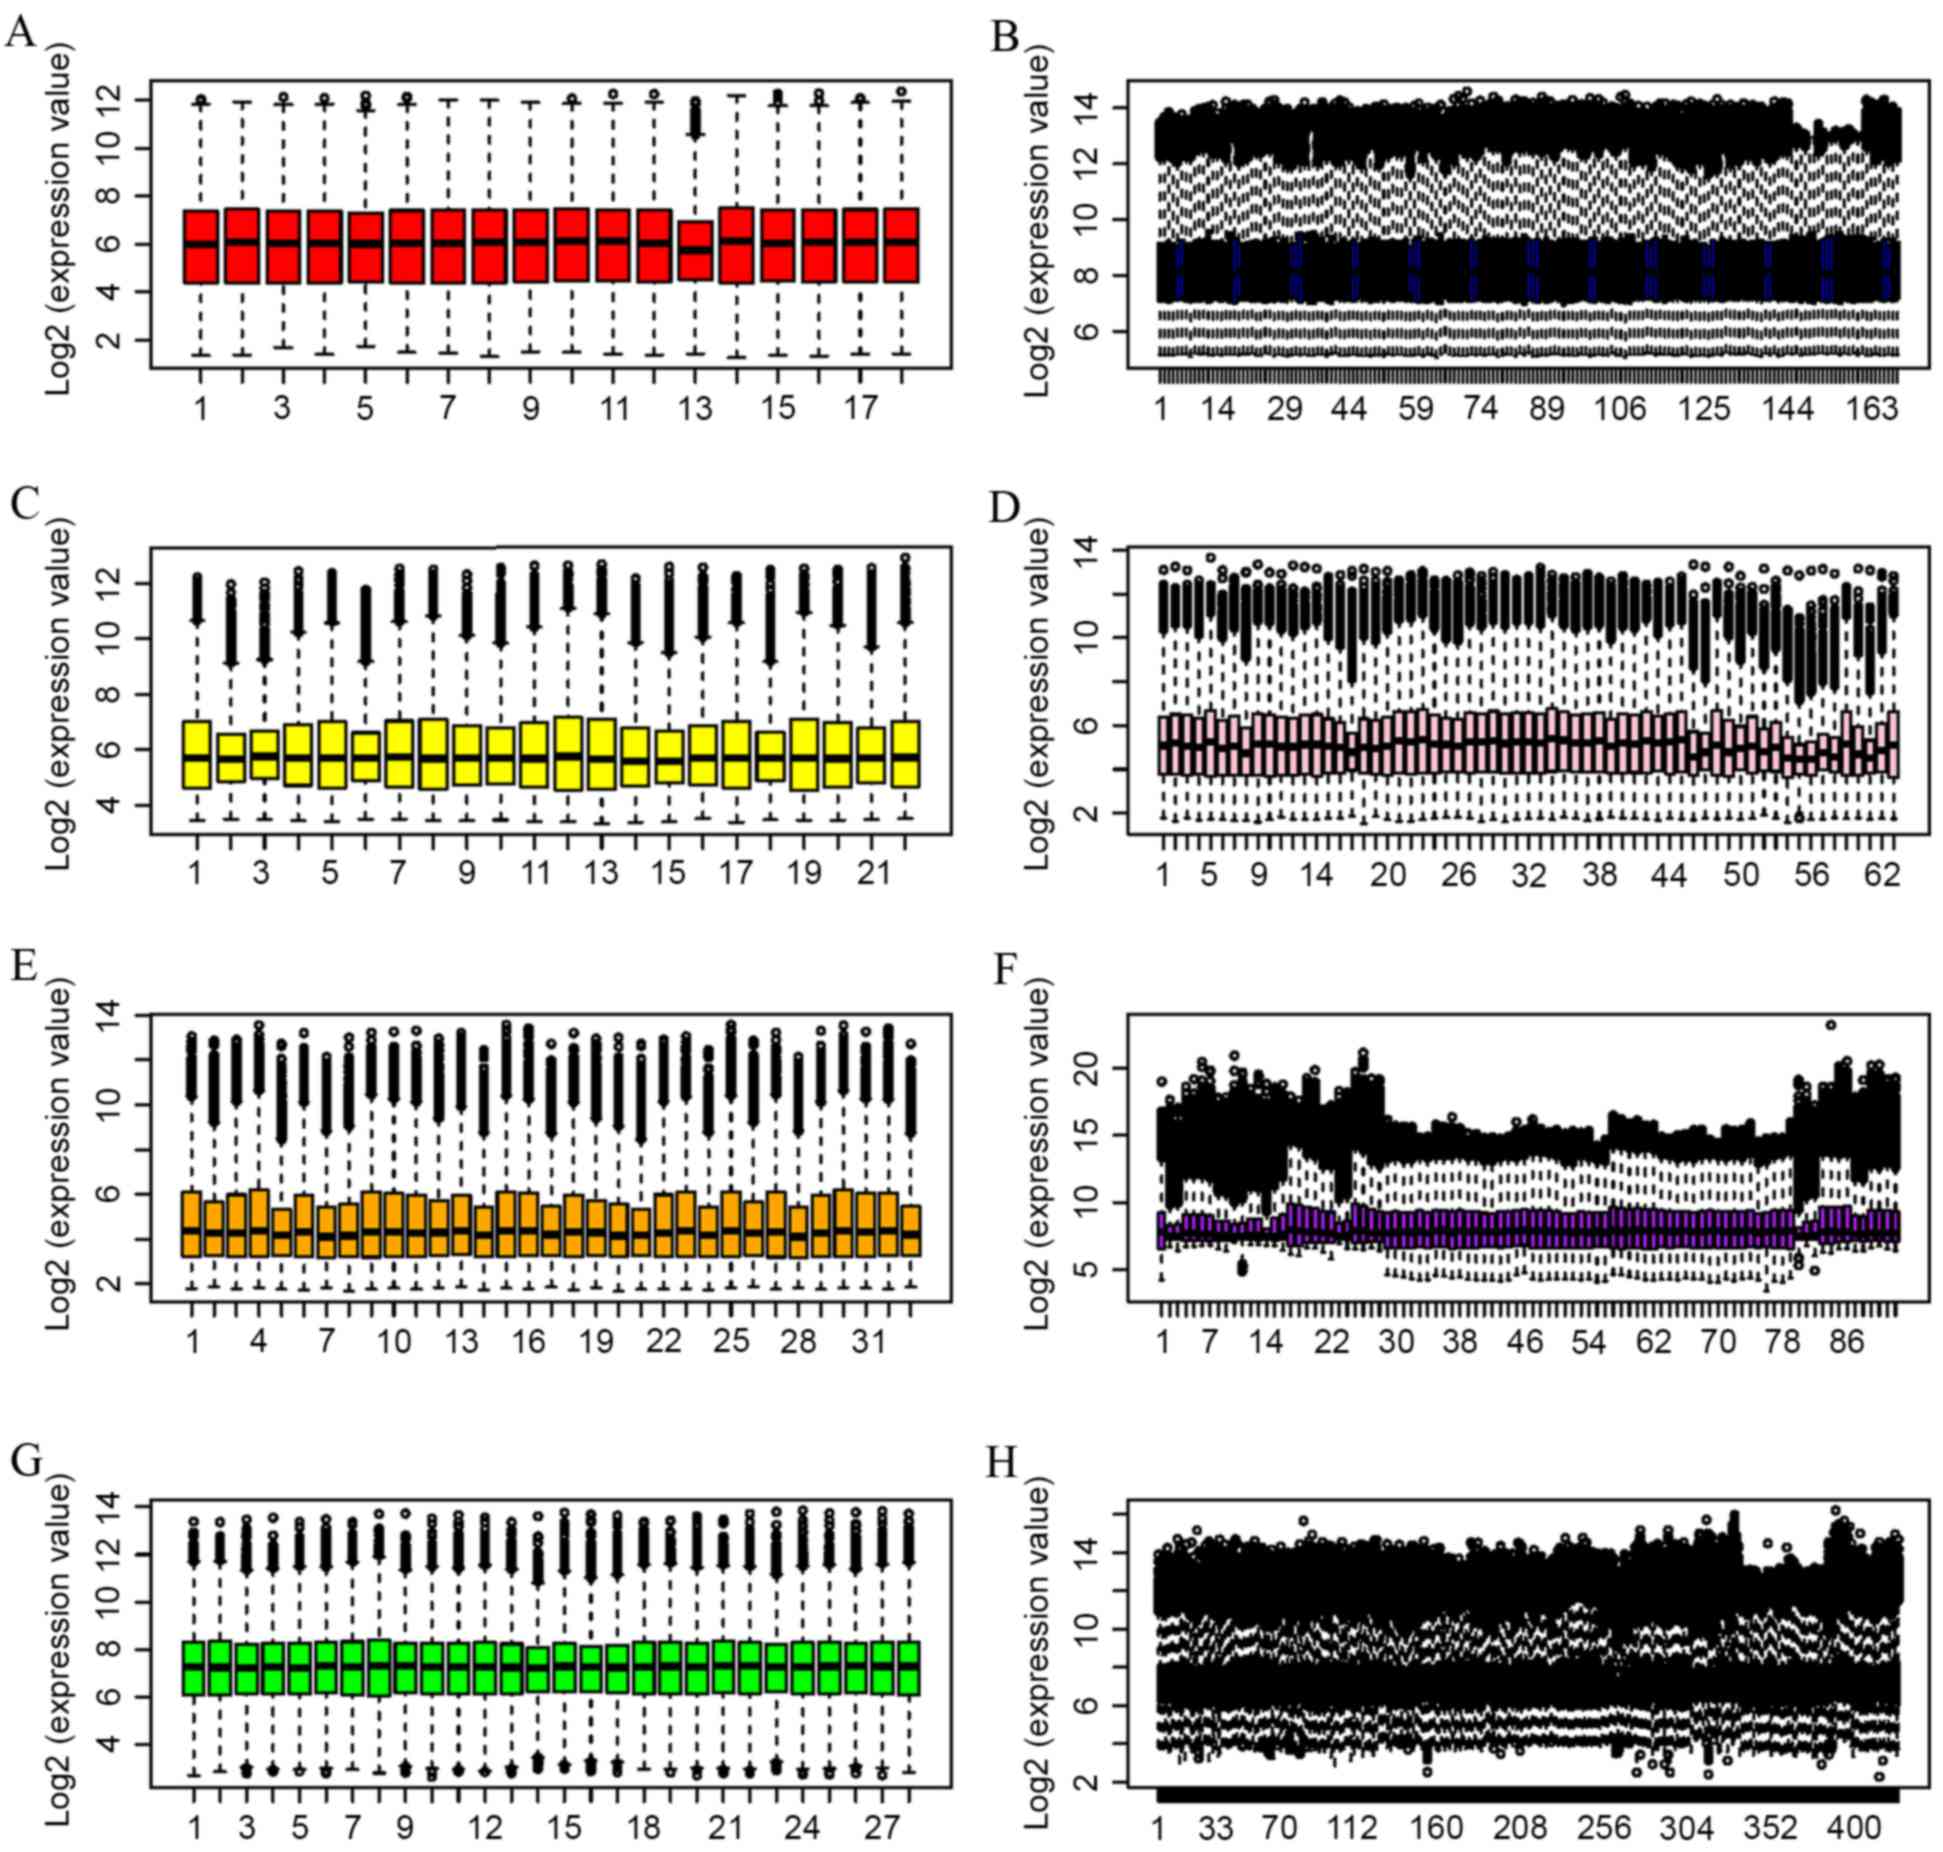
Pre-treatment of microarray data
R limma package (http://www.bioconductor.org/packages/release/bioc/html/limma.html)
was applied to normalize the raw data from different microarray
platforms. These data were subsequently combined and normalized. A
good performance of normalization was achieved (Fig. 1).
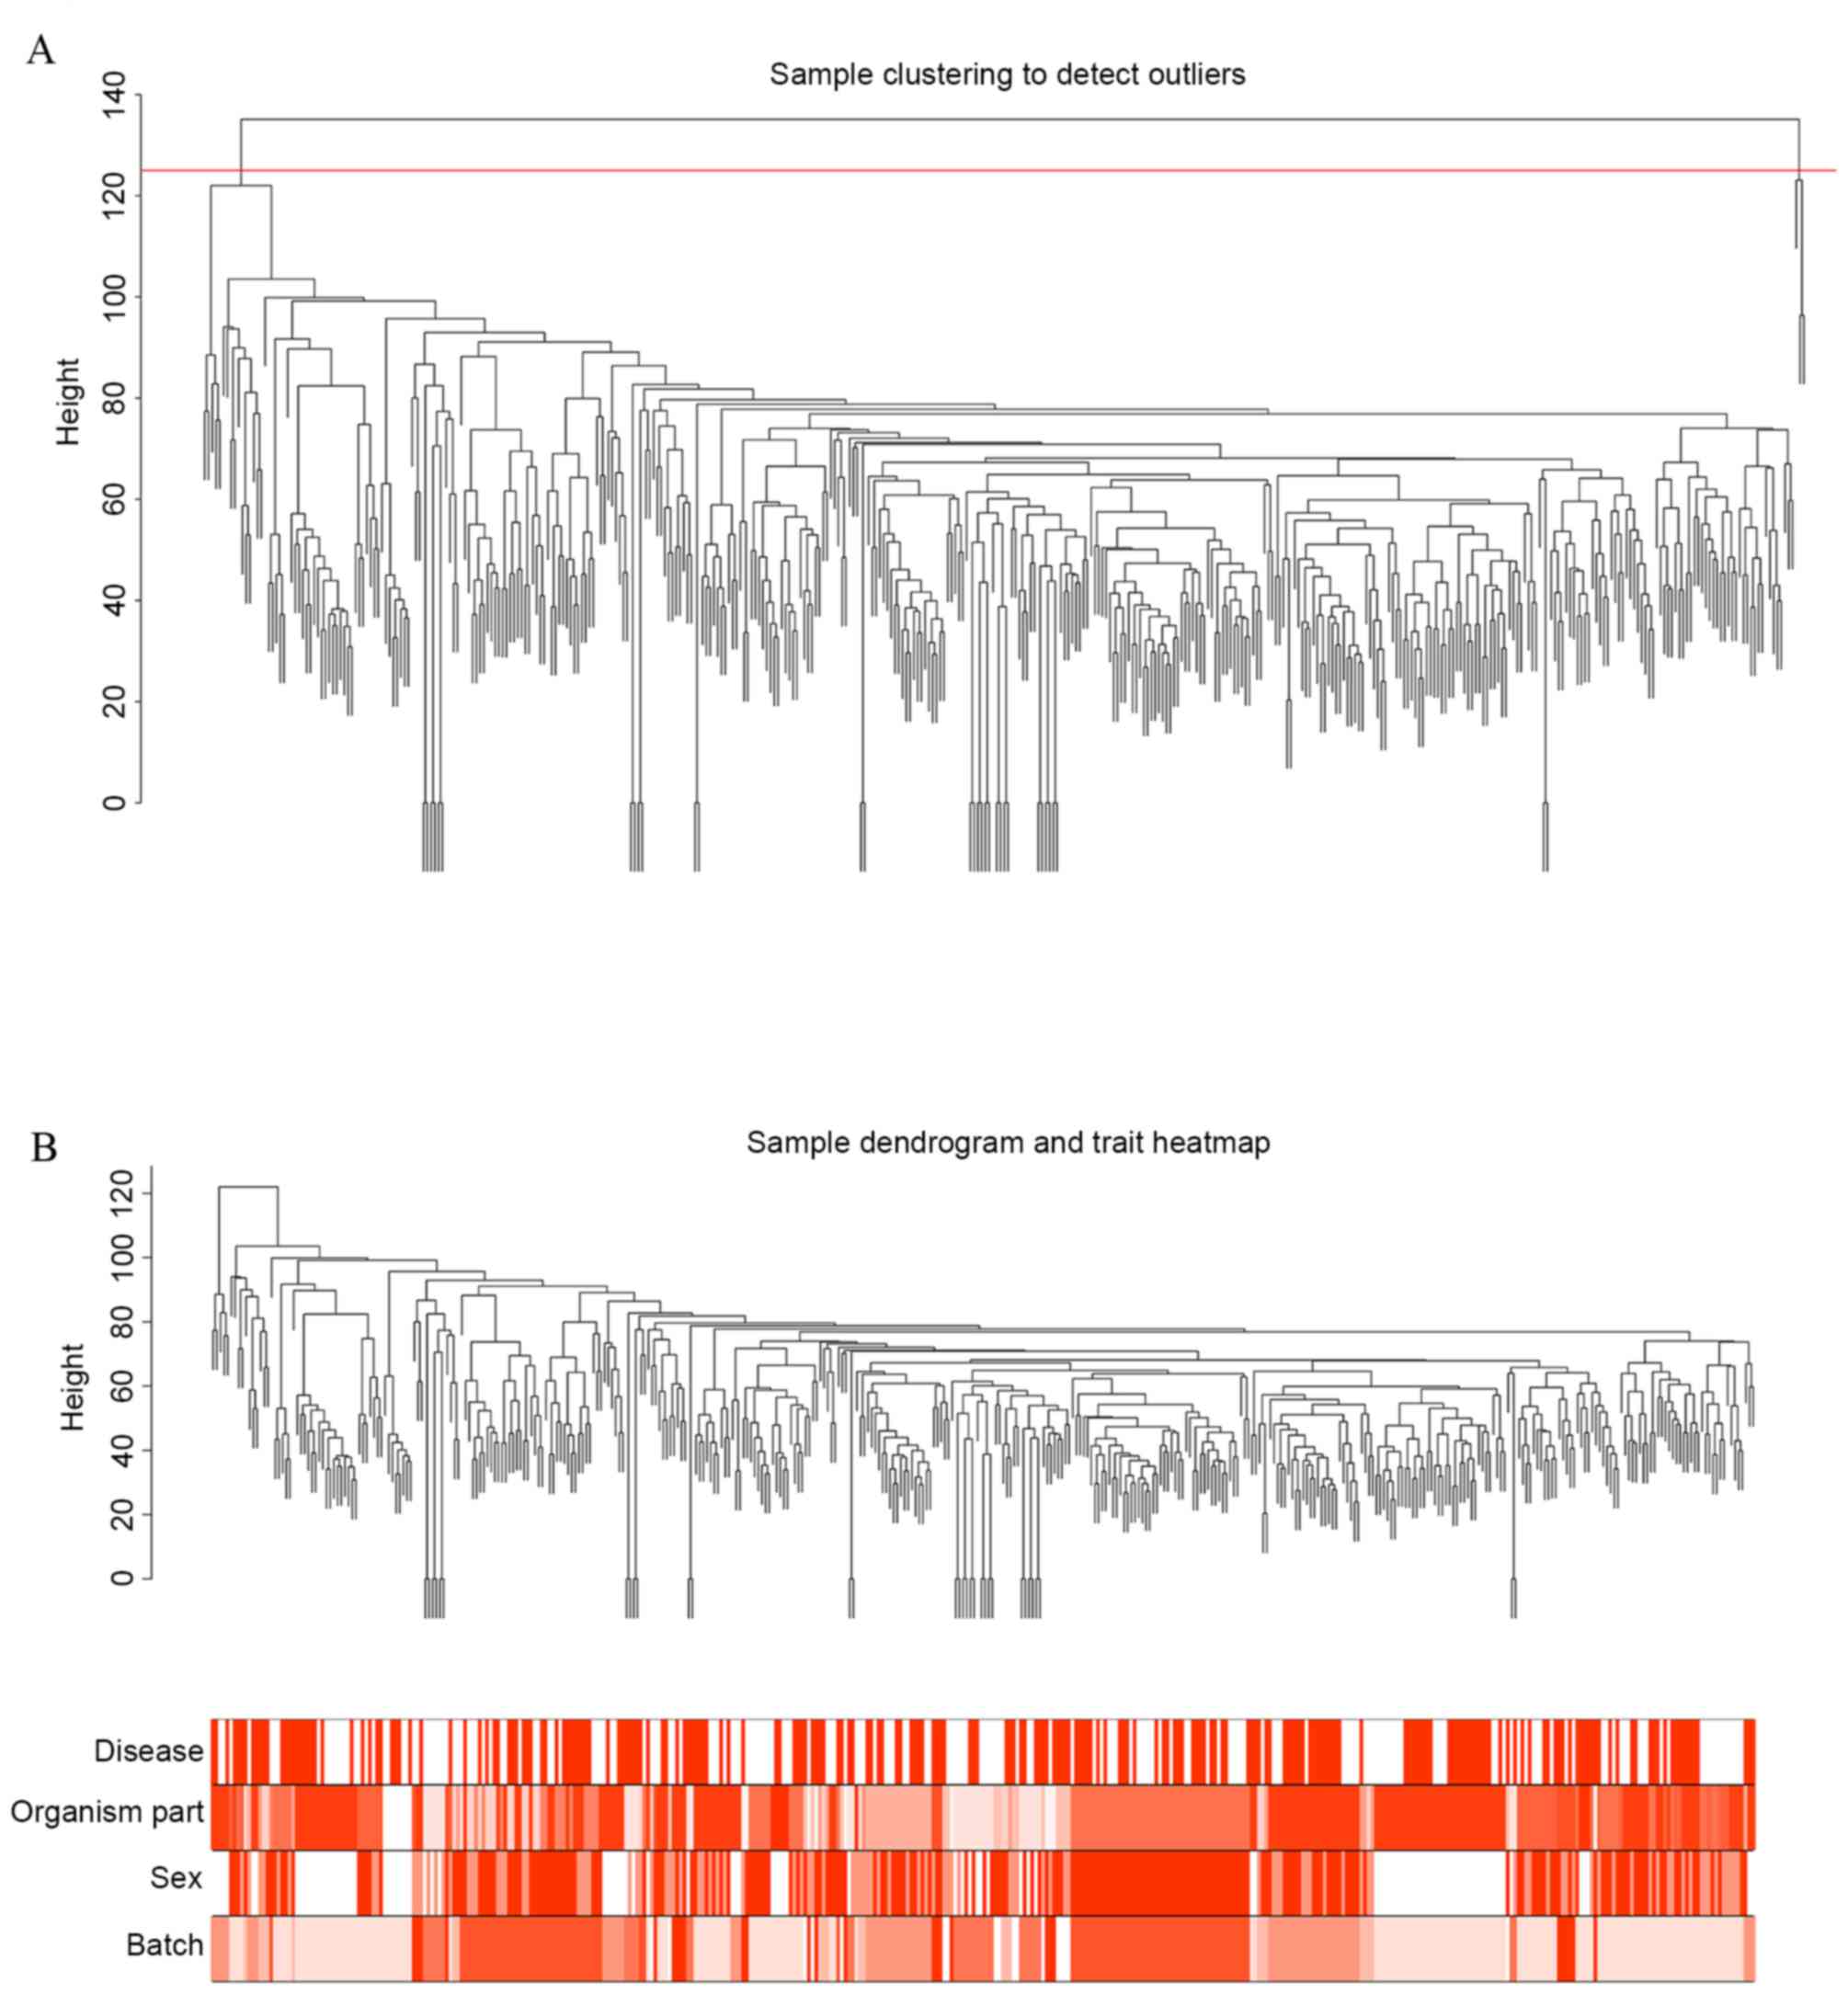
Gene coexpression modules
Cluster analysis was performed to remove outliers
based on the threshold value of a height cut of 125 (Fig. 2A). Three samples (GSM506020,
GSM1311832 and X21_G05_P2) were removed as outliers. Cluster
analysis was then conducted again with clinical information
(Fig. 2B). The results indicated
that brain region, gender and platform were distributed uniformly
among sample types (PD or control), suggesting that a single
clinical feature was not sufficient to classify samples. This
justified the pre-treatment methods of the present study.
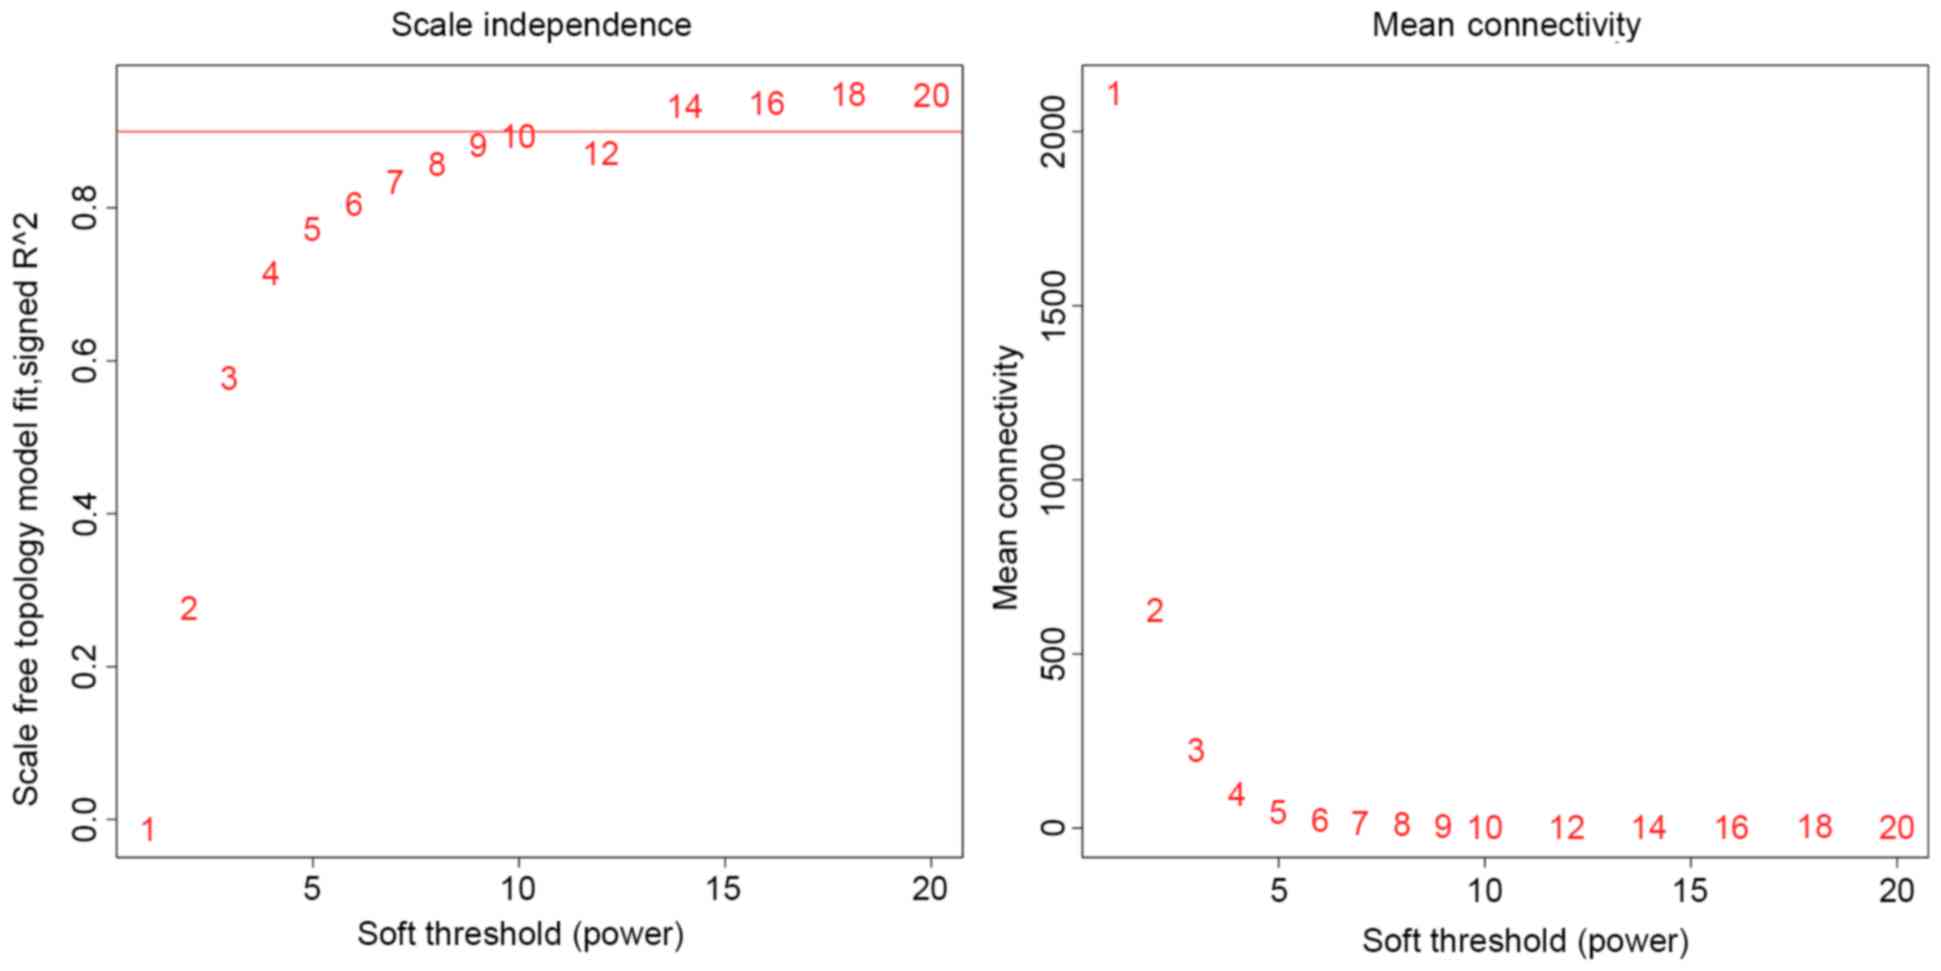
According to previous findings (28), the optimal soft thresholding power
is the minimum value where scale-free fit is best optimized.
Scale-free fit was set as 0.9 in the present analysis and the
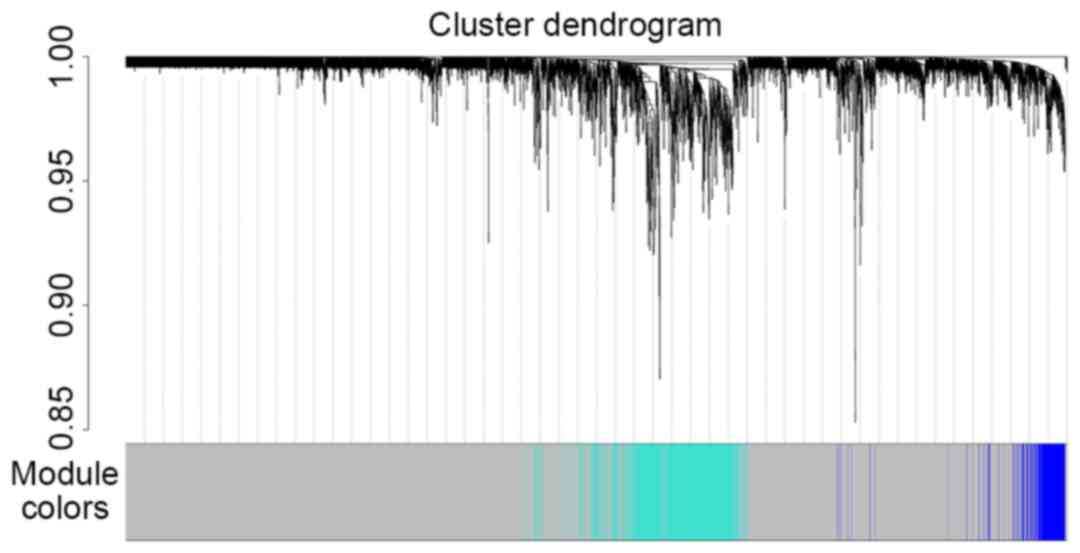
optimal soft-thresholding power was set as 14 (Fig. 3). Gene co-expression modules were
identified using the function blockwiseModules. Five modules
were obtained: Module 0 contained 9,745 genes (in grey, named
MEgrey); module 1,736 genes (in turquoise, named MEturquoise);
module 2,233 genes (in blue, named MEblue); module 3,101 genes (in
brown, named MEbrown); and module 4,93 genes (in yellow, named
MEyellow). The results of cluster analysis are displayed in
Fig. 4.
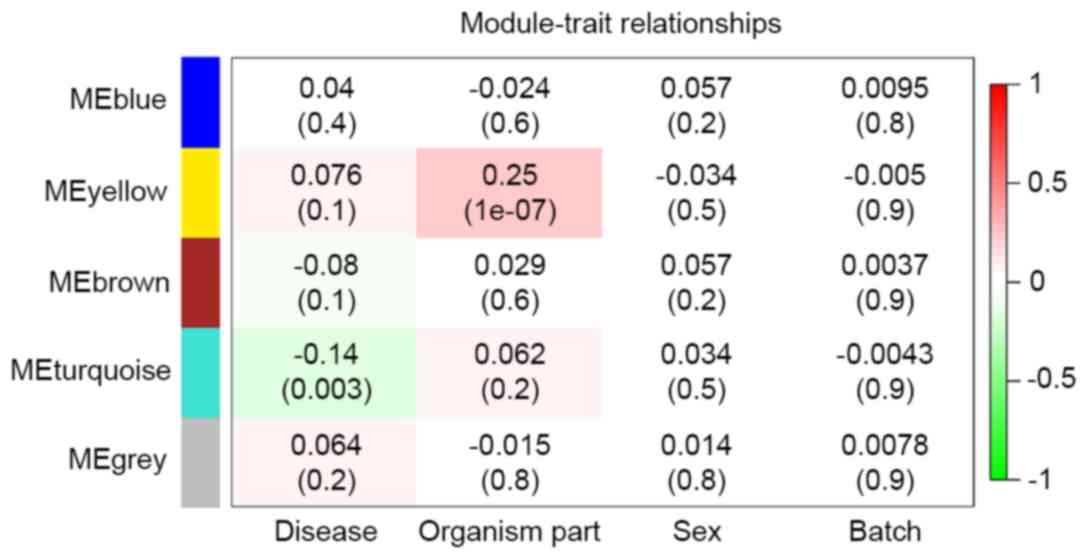
Correlation between modules and
clinical features
Three modules (MEgray, MEblue and MEbrown) had no
significant relationship with any clinical feature (Fig. 5). ‘Sex’ and ‘Batch’ revealed no
significant relationship with the 5 modules (Fig. 5), demonstrating the suitability of
the pre-treatment. ‘Organism part’ was significantly correlated
with MEyellow (correlation coefficient 0.25, P=1×10-07; Fig. 5), confirming different expression
patterns existed in different brain regions. ‘Disease’ was
significantly negatively correlated with MEturquoise (correlation
coefficient −0.14, P=0.003; Fig.
5), suggesting that there were commonly disturbed genes in
different brain regions. Therefore, the 736 genes from MEturquoise
were regarded as candidate PD-associated genes.
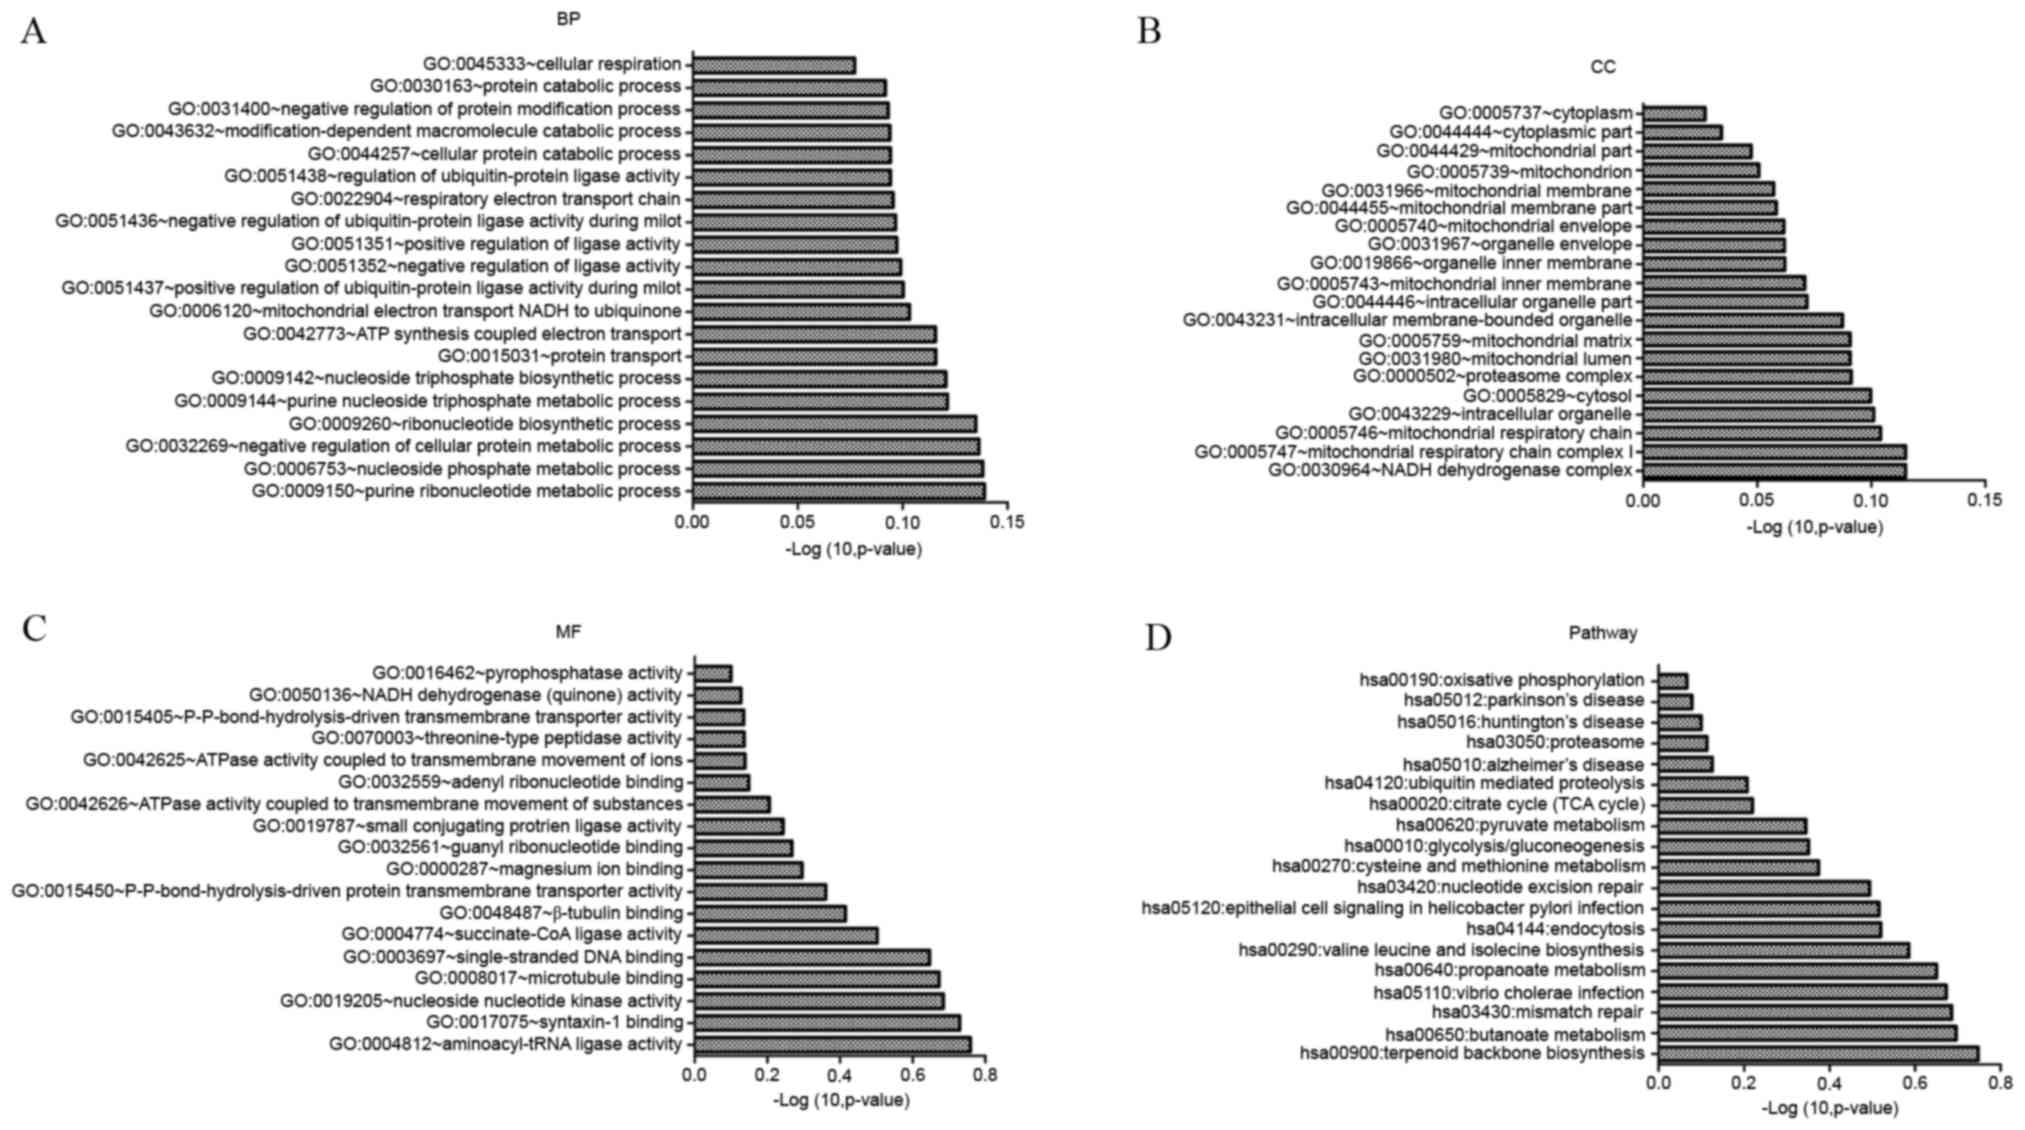
Biological functions of candidate
genes
Candidate genes were associated with cellular
respiration, protein catabolism and negative regulation of protein
modification (Fig. 6A). In terms
of cellular components, cytoplasm and mitochondrion were
overrepresented in candidate genes (Fig. 6B). In terms of molecular function,
pyrophosphatase activity and NADH dehydrogenase (quinone) activity
were overrepresented (Fig. 6C).
KEGG pathway enrichment indicated that these genes were involved in
oxidative phosphorylation and PD-associated pathways (Fig. 6D).
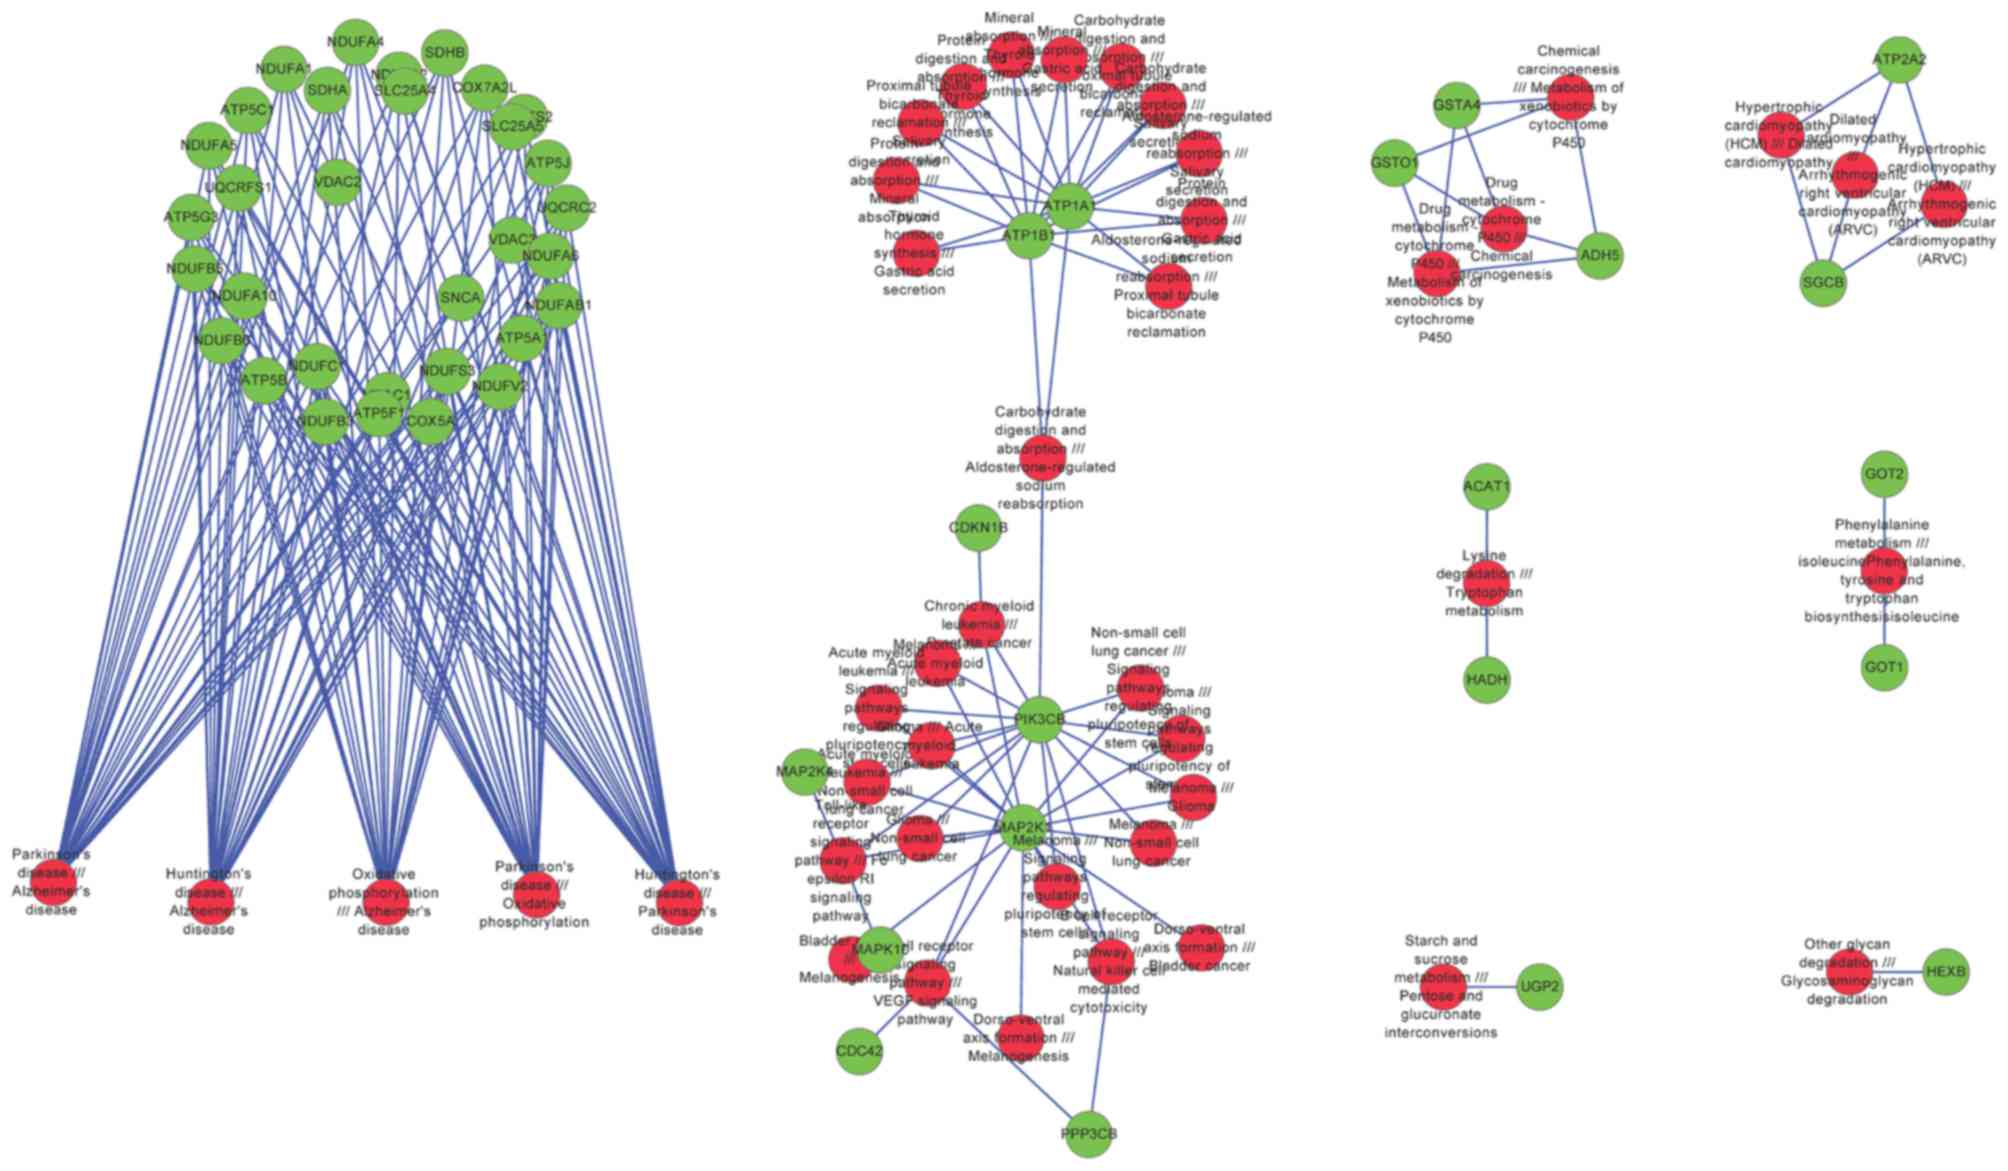
Risk genes and pathways
A total of 44 significant pathway pairs were
identified, from which 52 risk genes were revealed. The network
constructed by significant pathways and risk genes can be further
divided into 8 modules (Fig. 7).
Module 1 was associated with PD, module 2 was associated with
several cancers, and modules 3, 5, 6, 7 and 8 were associated with
the metabolism of drugs, amino acids and carbohydrates (Table IV).
| Table IV.Pathways and risk genes in the 8
modules. |
Table IV.
Pathways and risk genes in the 8
modules.
| Module | Pathways | Risk genes |
|---|
| 1 | Oxidative
phosphorylation, Alzheimer's disease, Parkinson's disease and
Huntington's disease | NDUFA5, VDAC3,
NDUFA2, ATP5C1, ATP5G3, NDUFAB1, ATP5J, SLC25A5, SLC25A4, NDUFA4,
COX5A, UQCRC2, NDUFS3, NDUFB6, VDAC1, VDAC2, ATP5A1, SNCA, ATP5F1,
NDUFB5, UQCRFS1, NDUFC1, SDHA, NDUFV2, NDUFA1, NDUFA10, COX7A2L,
ATP5B, NDUFS2, NDUFA6, NDUFB3, SDHB |
| 2 | Glioma, non-small
cell lung cancer, melanoma, signaling pathways regulating
pluripotency of stem cells, mineral absorption, gastric acid
secretion, carbohydrate digestion and absorption, proximal tubule
bicarbonate reclamation, aldosterone-regulated sodium reabsorption,
acute myeloid leukemia, salivary secretion, dorso-ventral axis
formation, bladder cancer, thyroid hormone synthesis, T cell
receptor signaling pathway, VEGF signaling pathway, B cell receptor
signaling pathway, natural killer cell mediated cytotoxicity,
protein digestion and absorption, melanogenesis, toll-like receptor
signaling pathway, Fc epsilon RI signaling pathway, chronic myeloid
leukemia and prostate cancer | MAPK10, ATP1B1,
ATP1A1, MAP2K4, PPP3CB, MAP2K1, CDKN1B, CDC42, PIK3CB |
| 3 | Drug metabolism
-cytochrome P450, metabolism of xenobiotics by cytochrome P450,
chemical carcinogenesis, metabolism of xenobiotics by cytochrome
P450 | GSTO1, GSTA4,
ADH5 |
| 4 | Hypertrophic
cardiomyopathy (HCM), Dilated cardiomyopathy, Arrhythmogenic right
ventricular cardiomyopathy (ARVC) | SGCB, ATP2A2 |
| 5 | Lysine degradation,
Tryptophan metabolism | ACAT1, HADH |
| 6 | Phenylalanine
metabolism, isoleucinePhenylalanine, tyrosine and tryptophan
biosynthesisisoleucine | GOT1, GOT2 |
| 7 | Starch and sucrose
metabolism, Pentose and glucuronate interconversions | UGP2 |
| 8 | Other glycan
degradation, Glycosaminoglycan degradation | HEXB |
Discussion
In the present study, a systematic analysis of 17
microarray datasets from 7 microarray platforms was performed. A
total of 736 PD-associated candidate genes were revealed through
functional enrichment analysis. Further co-pathway analysis
identified 44 significant pathway pairs and 52 risk genes. A
network containing pathway pairs and risk genes was constructed,
from which 8 modules were identified. Module 1 was associated with
oxidative phosphorylation and PD, while module 2 was associated
with diverse cancers. Other modules were associated with the
metabolism of xenobiotics, amino acids and carbohydrate.
Mitochondrial dysfunction and oxidative stress are
closely associated with PD (29,30).
Proteins associated with familial PD, including phosphatase and
tensin homolog-induced putative kinase 1 (PINK1), Parkinsonism
associated deglycase (DJ-1), synuclein alpha (SNCA) and leucine
rich repeat kinase 2 (LRRK2), are either mitochondrial proteins or
mitochondria-associated, and all interface with pathways involved
with oxidative stress and free radical damage (31). Mitochondrial import and
accumulation of α-synuclein impairs complex I (also known as
NADH-ubiquinone oxidoreductase) in human dopaminergic neuronal
cultures and the PD brain (32).
An increased prevalence of malignant melanoma and
skin carcinoma is observed in patients with PD (33) and some degree of overlap in the
underlying biochemical dysfunction of PD and cancers is known to
exist (34). Genes that underlie
familial forms of PD are often abnormally expressed in cancer.
Functional studies implicate these genes as being associated with
the maintenance of the cell cycle, so genes involved in the cell
cycle might be potential targets (35).
Cytochrome P450 (CYP) enzymes are responsible for
the metabolism of multiple exogenous and endogenous compounds.
Brain CYPs are also involved in the progression of PD (36). Morale et al (37) reported that loss of aromatase
cytochrome P450 function is a risk factor for PD, and McCann et
al (38) discovered that the
poor metabolizer genotype of CYP2D6 has a significant association
with PD.
Some of the 52 risk genes identified in the present
study have been implicated in the progression of PD, including SNCA
(39). Deficiencies in complex I
of the respiratory chain are frequent causes of mitochondrial
diseases, and have been associated with PD (40). Several structural subunits of
complex I were identified as risk genes in the present study,
inlcuding NADH-ubiquinone oxidoreductase 1 alpha subcomplex subunit
5 (NDUFA5), NDUFA2, NDUFAB1 and NDUFA4. Peralta et al
(41) reported that conditional
ablation of NDUFA5 results in a mild chronic encephalopathy but no
increase in oxidative damage. Three voltage-dependent anion
channels (VADCs; VADC1, VADC2 and VADC3) were also identified as
risk genes (42). They recruit
Parkin to defective mitochondria, which promotes mitochondrial
autophagy (42). Chu et al
(43) demonstrated that VADC1 is
downregulated in response to α-synuclein accumulation and
aggregation and thus leads to a decrease in mitochondrial function.
Glutathione S-transferase omega-1 (GSTO1) is involved in the
metabolism of xenobiotics and has been previously reported to
modify the age of PD onset (44,45).
GSTA4 may also be involved with PD, but confirmation of this
requires further studies.
Overall, a number of relevant pathways and risk
genes were revealed in the present study. The risk gene pathway
network produced may be useful to guide further research to
illustrate the molecular mechanisms underlying PD. Some of the
identified risk genes may also be potential therapeutic targets for
treatment of PD, although this too requires further study.
References
|
1
|
Ma CL, Su L, Xie JJ, Long JX, Wu P and Gu
L: The prevalence and incidence of Parkinson's disease in China: A
systematic review and meta-analysis. J Neural Transm (Vienna).
121:123–134. 2014. View Article : Google Scholar : PubMed/NCBI
|
|
2
|
Zhang W, Phillips K, Wielgus AR, Liu J,
Albertini A, Zucca FA, Faust R, Qian SY, Miller DS, Chignell CF, et
al: Neuromelanin activates microglia and induces degeneration of
dopaminergic neurons: Implications for progression of Parkinson's
disease. Neurotox Res. 19:63–72. 2011. View Article : Google Scholar : PubMed/NCBI
|
|
3
|
Wakabayashi K, Tanji K, Odagiri S, Miki Y,
Mori F and Takahashi H: The Lewy body in Parkinson's disease and
related neurodegenerative disorders. Mol Neurobiol. 47:495–508.
2013. View Article : Google Scholar : PubMed/NCBI
|
|
4
|
de Lau LM, Verbaan D, Marinus J and van
Hilten JJ: Survival in Parkinson's disease. Relation with motor and
non-motor features. Parkinsonism Relat Disord. 20:613–616. 2014.
View Article : Google Scholar : PubMed/NCBI
|
|
5
|
Müller B, Assmus J, Herlofson K, Larsen JP
and Tysnes OB: Importance of motor vs. non-motor symptoms for
health-related quality of life in early Parkinson's disease.
Parkinsonism Relat Disord. 19:1027–1032. 2013. View Article : Google Scholar : PubMed/NCBI
|
|
6
|
Zheng B, Liao Z, Locascio JJ, Lesniak KA,
Roderick SS, Watt ML, Eklund AC, Zhang-James Y, Kim PD, Hauser MA,
et al: PGC-1α, a potential therapeutic target for early
intervention in Parkinson's disease. Sci Transl Med. 2:52ra732010.
View Article : Google Scholar : PubMed/NCBI
|
|
7
|
Zhang Y, James M, Middleton FA and Davis
RL: Transcriptional analysis of multiple brain regions in
Parkinson's disease supports the involvement of specific protein
processing, energy metabolism and signaling pathways, and suggests
novel disease mechanisms. Am J Med Genet B Neuropsychiatr Genet.
137:5–16. 2005. View Article : Google Scholar
|
|
8
|
Moran LB, Duke DC, Deprez M, Dexter DT,
Pearce RK and Graeber MB: Whole genome expression profiling of the
medial and lateral substantia nigra in Parkinson's disease.
Neurogenetics. 7:1–11. 2006. View Article : Google Scholar : PubMed/NCBI
|
|
9
|
Lesnick TG, Papapetropoulos S, Mash DC,
Ffrench-Mullen J, Shehadeh L, de Andrade M, Henley JR, Rocca WA,
Ahlskog JE and Maraganore DM: A genomic pathway approach to a
complex disease: Axon guidance and Parkinson disease. PLoS Genet.
3:e982007. View Article : Google Scholar : PubMed/NCBI
|
|
10
|
Cantuti-Castelvetri I, Keller-McGandy C,
Bouzou B, Asteris G, Clark TW, Frosch MP and Standaert DG: Effects
of gender on nigral gene expression and parkinson disease.
Neurobiol Dis. 26:606–614. 2007. View Article : Google Scholar : PubMed/NCBI
|
|
11
|
Corradini BR, Iamashita P, Tampellini E,
Farfel JM, Grinberg LT and Moreira-Filho CA: Complex network-driven
view of genomic mechanisms underlying Parkinson's disease: Analyses
in dorsal motor vagal nucleus, locus coeruleus, and substantia
nigra. Biomed Res Int. 2014:5436732014. View Article : Google Scholar : PubMed/NCBI
|
|
12
|
Riley BE, Gardai SJ, Emig-Agius D,
Bessarabova M, Ivliev AE, Schüle B, Alexander J, Wallace W,
Halliday GM, Langston JW, et al: Systems-based analyses of brain
regions functionally impacted in Parkinson's disease reveals
underlying causal mechanisms. PloS One. 9:e1029092014. View Article : Google Scholar : PubMed/NCBI
|
|
13
|
Garcia-Esparcia P, Schlüter A, Carmona M,
Moreno J, Ansoleaga B, Torrejón-Escribano B, Gustincich S, Pujol A
and Ferrer I: Functional genomics reveals dysregulation of cortical
olfactory receptors in Parkinson disease: Novel putative
chemoreceptors in the human brain. J Neuropathol Exp Neurol.
72:524–539. 2013. View Article : Google Scholar : PubMed/NCBI
|
|
14
|
Clarke C, Madden SF, Doolan P, Aherne ST,
Joyce H, O'Driscoll L, Gallagher WM, Hennessy BT, Moriarty M, Crown
J, et al: Correlating transcriptional networks to breast cancer
survival: A large-scale coexpression analysis. Carcinogenesis.
34:2300–2308. 2013. View Article : Google Scholar : PubMed/NCBI
|
|
15
|
Liu R, Cheng Y, Yu J, Lv QL and Zhou HH:
Identification and validation of gene module associated with lung
cancer through coexpression network analysis. Gene. 563:56–62.
2015. View Article : Google Scholar : PubMed/NCBI
|
|
16
|
Shi K, Bing ZT, Cao GQ, Guo L, Cao YN,
Jiang HO and Zhang MX: Identify the signature genes for diagnose of
uveal melanoma by weight gene co-expression network analysis. Int J
Ophthalmol. 8:269–274. 2015.PubMed/NCBI
|
|
17
|
Gautier L, Cope L, Bolstad BM and Irizarry
RA: affy-analysis of Affymetrix GeneChip data at the probe level.
Bioinformatics. 20:307–315. 2004. View Article : Google Scholar : PubMed/NCBI
|
|
18
|
McCall MN, Bolstad BM and Irizarry RA:
Frozen robust multiarray analysis (fRMA). Biostatistics.
11:242–253. 2010. View Article : Google Scholar : PubMed/NCBI
|
|
19
|
Ritchie ME, Phipson B, Wu D, Hu Y, Law CW,
Shi W and Smyth GK: limma powers differential expression analyses
for RNA-sequencing and microarray studies. Nucleic Acids Res.
43:e472015. View Article : Google Scholar : PubMed/NCBI
|
|
20
|
Carvalho BS and Irizarry RA: A framework
for oligonucleotide microarray preprocessing. Bioinformatics.
26:2363–2367. 2010. View Article : Google Scholar : PubMed/NCBI
|
|
21
|
Leek JT, Johnson WE, Parker HS, Fertig EJ,
Jaffe AE and Storey JD: sva: Surrogate Variable Analysis.
Bioconductor. 2013.
|
|
22
|
Langfelder P and Horvath S: WGCNA: An R
package for weighted correlation network analysis. BMC
Bioinformatics. 9:5592008. View Article : Google Scholar : PubMed/NCBI
|
|
23
|
Kanehisa M, Sato Y, Kawashima M, Furumichi
M and Tanabe M: KEGG as a reference resource for gene and protein
annotation. Nucleic Acids Res. 44:D457–D462. 2016. View Article : Google Scholar : PubMed/NCBI
|
|
24
|
Dennis G Jr, Sherman BT, Hosack DA, Yang
J, Gao W, Lane HC and Lempicki RA: DAVID: Database for annotation,
visualization, and integrated discovery. Genome Biol. 4:P32003.
View Article : Google Scholar : PubMed/NCBI
|
|
25
|
Benjamini Y and Hochberg Y: Controlling
the false discovery rate: A practical and powerful approach to
multiple testing. Journal of the royal statistical society. Series
B (Methodological). 57:289–300. 1995.
|
|
26
|
Kanehisa M and Goto S: KEGG: Kyoto
encyclopedia of genes and genomes. Nucleic Acids Res. 28:27–30.
2000. View Article : Google Scholar : PubMed/NCBI
|
|
27
|
Shannon P, Markiel A, Ozier O, Baliga NS,
Wang JT, Ramage D, Amin N, Schwikowski B and Ideker T: Cytoscape: A
software environment for integrated models of biomolecular
interaction networks. Genome Res. 13:2498–2504. 2003. View Article : Google Scholar : PubMed/NCBI
|
|
28
|
Zhang B and Horvath S: A general framework
for weighted gene co-expression network analysis. Stat Appl Genet
Mol Biol. 4:Article172005.PubMed/NCBI
|
|
29
|
Lin MT and Beal MF: Mitochondrial
dysfunction and oxidative stress in neurodegenerative diseases.
Nature. 443:787–795. 2006. View Article : Google Scholar : PubMed/NCBI
|
|
30
|
Henchcliffe C and Beal MF: Mitochondrial
biology and oxidative stress in Parkinson disease pathogenesis. Nat
Clin Pract Neurol. 4:600–609. 2008. View Article : Google Scholar : PubMed/NCBI
|
|
31
|
Schapira AH: Mitochondria in the aetiology
and pathogenesis of Parkinson's disease. Lancet Neurol. 7:97–109.
2008. View Article : Google Scholar : PubMed/NCBI
|
|
32
|
Devi L, Raghavendran V, Prabhu BM,
Avadhani NG and Anandatheerthavarada HK: Mitochondrial import and
accumulation of alpha-synuclein impair complex I in human
dopaminergic neuronal cultures and Parkinson disease brain. J Biol
Chem. 283:9089–9100. 2008. View Article : Google Scholar : PubMed/NCBI
|
|
33
|
Olsen JH, Friis S and Frederiksen K:
Malignant melanoma and other types of cancer preceding Parkinson
disease. Epidemiology. 17:582–587. 2006. View Article : Google Scholar : PubMed/NCBI
|
|
34
|
West AB, Dawson VL and Dawson TM: To die
or grow: Parkinson's disease and cancer. Trends Neurosci.
28:348–352. 2005. View Article : Google Scholar : PubMed/NCBI
|
|
35
|
D'Amelio M, Ragonese P, Sconzo G, Aridon P
and Savettieri G: Parkinson's disease and cancer: Insights for
pathogenesis from epidemiology. Ann N Y Acad Sci. 1155:324–334.
2009. View Article : Google Scholar : PubMed/NCBI
|
|
36
|
Kaut O, Schmitt I and Wüllner U:
Genome-scale methylation analysis of Parkinson's disease patients'
brains reveals DNA hypomethylation and increased mRNA expression of
cytochrome P450 2E1. Neurogenetics. 13:87–91. 2012. View Article : Google Scholar : PubMed/NCBI
|
|
37
|
Morale MC, L'Episcopo F, Tirolo C,
Giaquinta G, Caniglia S, Testa N, Arcieri P, Serra PA, Lupo G,
Alberghina M, et al: Loss of aromatase cytochrome P450 function as
a risk factor for Parkinson's disease? Brain Res Rev. 57:431–443.
2008. View Article : Google Scholar : PubMed/NCBI
|
|
38
|
McCann SJ, Pond SM, James KM and Le
Couteur DG: The association between polymorphisms in the cytochrome
P-450 2D6 gene and Parkinson's disease: A case-control study and
meta-analysis. J Neurol Sci. 153:50–53. 1997. View Article : Google Scholar : PubMed/NCBI
|
|
39
|
Pan F, Dong H, Ding H, Ye M, Liu W, Wu Y,
Zhang X, Chen Z, Luo Y and Ding X: SNP rs356219 of the α-synuclein
(SNCA) gene is associated with Parkinson's disease in a Chinese Han
population. Parkinsonism Relat Disord. 18:632–634. 2012. View Article : Google Scholar : PubMed/NCBI
|
|
40
|
Sharma LK, Lu J and Bai Y: Mitochondrial
respiratory complex I: Structure, function and implication in human
diseases. Curr Med Chem. 16:1266–1277. 2009. View Article : Google Scholar : PubMed/NCBI
|
|
41
|
Peralta S, Torraco A, Wenz T, Garcia S,
Diaz F and Moraes CT: Partial complex I deficiency due to the CNS
conditional ablation of Ndufa5 results in a mild chronic
encephalopathy but no increase in oxidative damage. Hum Mol Genet.
23:1399–1412. 2014. View Article : Google Scholar : PubMed/NCBI
|
|
42
|
Sun Y, Vashisht AA, Tchieu J, Wohlschlegel
JA and Dreier L: Voltage-dependent anion channels (VDACs) recruit
Parkin to defective mitochondria to promote mitochondrial
autophagy. J Biol Chem. 287:40652–40660. 2012. View Article : Google Scholar : PubMed/NCBI
|
|
43
|
Chu Y, Goldman JG, Kelly L, He Y, Waliczek
T and Kordower JH: Abnormal alpha-synuclein reduces nigral
voltage-dependent anion channel 1 in sporadic and experimental
Parkinson's disease. Neurobiol Dis. 69:1–14. 2014. View Article : Google Scholar : PubMed/NCBI
|
|
44
|
Li YJ, Oliveira SA, Xu P, Martin ER,
Stenger JE, Scherzer CR, Hauser MA, Scott WK, Small GW, Nance MA,
et al: Glutathione S-transferase omega-1 modifies age-at-onset of
Alzheimer disease and Parkinson disease. Hum Mol Genet.
12:3259–3267. 2003. View Article : Google Scholar : PubMed/NCBI
|
|
45
|
Li YJ, Scott WK, Zhang L, Lin PI, Oliveira
SA, Skelly T, Doraiswamy MP, Welsh-Bohmer KA, Martin ER, Haines JL,
et al: Revealing the role of glutathione S-transferase omega in
age-at-onset of Alzheimer and Parkinson diseases. Neurobiol Aging.
27:1087–1093. 2006. View Article : Google Scholar : PubMed/NCBI
|