Introduction
Esophageal carcinoma is a leading malignancy in
China and the sixth leading cause of cancer-associated mortality
worldwide (1,2). Esophageal squamous cell carcinoma
(ESCC) accounts for 90% of esophageal carcinoma in China (3,4) and
~50% of patients exhibit tumor recurrence following radical
resection. Although a number of studies investigating esophageal
carcinoma have been conducted, the five-year survival rate of
patients with ESCC remains quite low. Invasion and metastasis are
key factors in poor prognosis following esophagectomy (5,6).
Consequently, ESCC invasion and metastasis-associated molecular
biomarkers require investigation in order to improve clinical
screening, diagnosis and prognosis.
At present, esophageal carcinoma proteomics research
focuses on comparing the expression levels of protein in cancer
tissue samples with normal tissue samples to explore its value in
the diagnosis of early esophageal carcinoma (7–9).
However, there have been few proteomic studies into esophageal
cancer invasion and metastasis. In the present study, the protein
expression profiles in pathological stage I and stage III ESCC
tissue samples were investigated using proteomics technology to
screen differentially expressed proteins associated with ESCC
invasion and metastasis, which were subsequently verified by
immunohistochemistry and western blotting.
Materials and methods
Chemicals
All chemicals were purchased from Sigma-Aldrich;
Merck Millipore (Darmstadt, Germany) unless otherwise
specified.
Patients and tissue samples
Patients in the present study were diagnosed with
ESCC and did not undergo preoperative radiotherapy and
chemotherapy, and their tumors were resected in 2008 and 2009 at
the Fujian Medical University Union Hospital (Fuzhou, China).
Cancerous tissue samples were collected from pathological stage I
and III ESCC patients for two-dimensional gel electrophoresis
(2-DE) and western blotting. Stage I and III patients were
60.7±10.4 and 62.5±7.7 years of age, respectively. The specimens
were collected immediately following surgery, rinsed thoroughly in
phosphate-buffered saline (PBS; pH 7.4), snap frozen in liquid
nitrogen and maintained at −80°C. This process was completed within
10 min. Tissue samples were collected for immunohistochemistry,
including 33 cases of pathological stage I specimens and 33 cases
of stage III specimens. All pathological diagnoses were confirmed
by two pathologists.
The present study was approved by the Ethics
Committee of the Fujian Medical University Union Hospital, and
informed consent was obtained from all patients.
Protein extraction and
quantification
Protein was extracted from stage I and III ESCC
epithelial tissue samples by liquid nitrogen homogenization. 2-DE
lysis buffer was added to each tissue sample, which was composed of
7 M urea, 4% CHAPS, 40 mM dithiothreitol (DTT), 2 M thiourea and 1%
immobilized pH gradient (IPG) buffer (pH3-11NL). Samples were
homogenized for 5 min, and liquid nitrogen was added a number of
times to maintain the low temperature. Samples were then removed
and placed into 1.5 ml microcentrifuge tubes. Protein concentration
in the samples was determined using the 2-D Quant kit (GE
Healthcare Life Sciences, Chalfont, UK), according to the
manufacturer's protocols. The extraction supernatants were
subsequently stored at −80°C.
2-DE and image analysis
Extracted proteins were separated by
isoelectrofocusing, which was conducted with an IPGphor-2
instrument (GE Healthcare Life Sciences). A volume of sample
equaling 600 µg protein was taken from each sample, and the volume
was made up to 450 µl using Destreak Rehydration solution (GE
Healthcare Life Sciences), which was subsequently loaded onto the
dry strip gel and incubated for 15 h at 20°C for passive
rehydration. Following 1-D separation for a total of 96,000 Vh at
20°C (100 V for 4 h, 400 V for 1 h, 1,000 V for 1 h, 2,000 V for 1
h, 4,000 V for 30 min, 8,000 V for 1 h and finally remained at
8,000 V until the value of Vh reached 96,000), strips were
sequentially equilibrated with 10 g/l DTT equilibration buffer for
15 min and 25 g/l iodoacetamide buffer (GE Healthcare Life
Sciences) for 15 min at room temperature. The 2-D separation was
conducted on 1-mm thick 12% sodium dodecyl sulfate-polyacrylamide
gel electrophoresis gel (SDS-PAGE), at a power setting of 2 W/gel
for the initial 1 h followed by 15 W/gel for 5 h at a temperature
of 15°C. Subsequently, the gels were placed into 0.02% Coomassie
Brilliant Blue dye R350 and dyed overnight. The gels were eluted
with eluent containing methanol, glacial acetic acid and water
(1:3:6) and immersed in distilled water for 2 h. Gels were scanned
using ImageScanner III (GE Healthcare Life Sciences), and image
analysis was performed using ImageMaster 2D Platinum 7.0 software
(GE Healthcare Life Sciences). Automatic spot detection and gel
matching were conducted. Pairs of 2-DE gels composed of stage I and
stage III ESCC gels from matched patients were used and the
percentage volume of each spot was estimated and analyzed. Protein
spots with >2-fold differences were selected for statistical
analysis.
Protein analysis
According to the result of the ImageMaster 2D
Platinum 7.0 gel image analysis software, spots from the 2-DE were
excised from the gel and placed in 0.5 ml centrifuge tubes. The
spots were washed three times by ddH2O. Gel particles
were washed with 50 mM NH4HCO3 for 30 min and
destained with 50% acetonitrile (twice, 30 min each) in 100 mM
NH4HCO3 until all traces of Coomassie
Brilliant Blue were removed, and washed with double distilled water
again. Gel particles were washed with ultrapure water and then
dried under vacuum for 30 min, and rehydrated with the digestion
solution (20 µg/µl trypsin in 25 mM NH4HCO3).
In order to absorb the trypsin enzyme fully, gel particles were
stored at 4°C for 30 min, and then at 37°C overnight. The peptides
were extracted with 67% acetonitrile/1% trifluoroacetic acid three
times. The extracts were subsequently pooled and dried completely
prior to mass spectrum identification.
The samples were mixed (1:1) with a saturated matrix
solution (4-hydroxycinnamic acid prepared in 50% acetonitrile/1%
trifluoroacetic acid). All mass spectra were obtained on the
matrix-assisted laser desorption/ionization-time-of-flight
(MALDI-TOF)/mass spectrometry (MS; Applied Biosystems 4800
Proteomics Analyzer; Thermo Fisher Scientific, Inc., Waltham, MA,
USA). The MS spectra were acquired in a mass range from 800–4000
Da. The CalMix 5 standard (from the 4800 Proteomics Analyzer
calibration mixture; Applied Biosystems; Thermo Fisher Scientific,
Inc.) was used to calibrate the instrument. The singly charged
peaks were analyzed using an interpretation method where the seven
most intense peaks were selected, excluding the trypsin autolysis
peaks and the matrix ion signal.
Spectra were analyzed by the Global Protein Server
Workstation (version 3.6; GPS; Applied Biosystems; Thermo Fisher
Scientific, Inc.). The peptide mass fingerprints and MS/MS data
were searched by Mascot version 2.1 software (Matrix Science, Ltd.,
London, UK). Searches were preformed against the National Center
for Biotechnology Information database with the following parameter
settings: Trypsin cleavage, one missed cleavage allowed; 50 ppm
mass accuracy; and 0.25 Da MS/MS accuracy. Identification with a
GPS confidence index ≥95% was considered acceptable.
Western blotting
Total proteins were extracted from 100 mg stage I
and stage III ESCC tissues and quantified using the Bradford assay
according to the manufacturer's protocols. Proteins were separated
by 12% SDS-PAGE and transferred onto polyvinylidene fluoride
membranes (EMD Millipore, Billerica, MA, USA). The membranes were
blocked in 0.5% bovine serum albumin (BSA) for 2 h at room
temperature. After washing with PBS three times, the membranes were
incubated with primary antibodies overnight at 4°C. The primary
antibodies were monoclonal mouse anti-human tropomyosin 3 (TPM3)
antibody (dilution, 1:1,000; cat. no. ab113692; Abcam, Cambridge,
UK) or anti-β-actin antibody (dilution, 1:1,500; cat. no. ab8226;
Abcam). Following washing with PBS three times, membranes were
incubated with horseradish peroxidase-conjugated goat anti-mouse
IgG secondary antibody (dilution, 1:1,500; cat. no. ab6728, Abcam)
for 1 h at room temperature. The signals were detected using the
BeyoECL Plus enhanced chemiluminescence kit (cat. no. P0018;
Beyotime Institute of Biotechnology, Haimen, China) and ImageQuant
LAS 4000mini (GE Healthcare Life Sciences). The results were
analyzed using ImageJ software (National Institutes of Health,
Bethesda, MD, USA).
Immunohistochemistry (IHC) staining
and assessment
IHC staining was performed on 5-mm thick sections
from paraffin-embedded specimens using Histostain®-Plus
kits (Invitrogen; Thermo Fisher Scientific, Inc.). The slides with
paraffin sections were deparaffinized with xylene and rehydrated in
a graded series of ethanol. For antigen retrieval, the slides were
heated in a microwave for 10 min in citrate buffer solution (pH 6)
and washed in PBS. Subsequently, the slides were incubated with
monoclonal mouse anti-human TPM3 antibody (dilution, 1:150; cat.
no. ab113692; Abcam) and BSA for 30 min at room temperature. Slides
were gently washed in PBS three times followed by incubation with
secondary antibody [dilution, 1:200; cat. no. KIT-5910; MaxVision
(Shanghai) Ltd., Shanghai, China] for 15 min at room temperature.
Slides were rinsed with PBS again, and the color was developed by
diaminobenzidine [MaxVision (Shanghai) Ltd.]. As a negative
staining control, the primary antibody was replaced with PBS.
Slides were observed by light microscopy (Olympus
Corporation, Tokyo, Japan). The results were independently
evaluated by two pathologists who were blinded to the
clinicopathological information. A semiquantitative scoring method
was used in which staining intensity and the proportion of cells
stained were considered. The values of staining intensity were
evaluated (0, no staining; 1, weak staining; 2, moderate staining;
or 3, strong staining), and the values of percentage of cells
stained were assessed (0, <1%; 1, 1–25%; 2, 26–50%; 3, 51–75%;
or 4, >75%). The two scores were multiplied and divided into two
grades, negative (score, 0–4), and positive (score, 5–12).
Statistical analysis
All data were analyzed with SPSS 19.0 (SPSS IBM,
Armonk, NY, USA). Fisher's exact tests were used to compare
differences between continuous variables. Categorical variables
were compared using Pearson's χ2 tests. P<0.05 was considered to
indicate a statistically significant difference.
Results
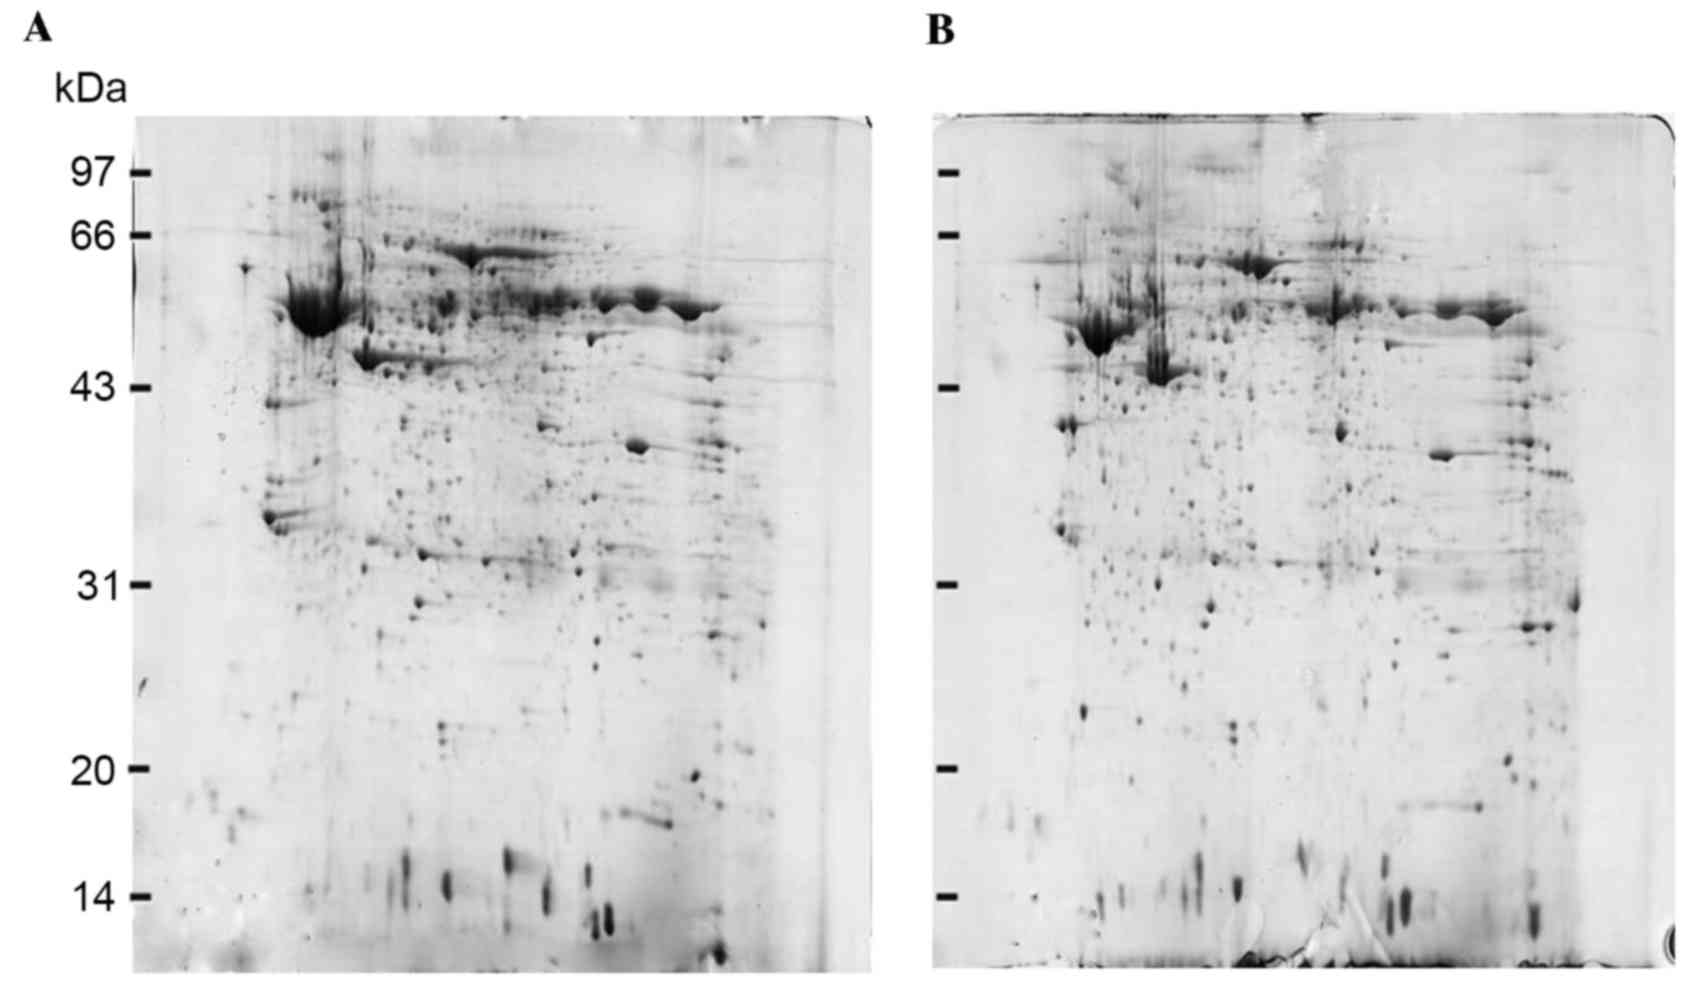
2-DE and image analysis
2-DE gels of stage I ESCC tissues were compared with
their corresponding matched stage III ESCC tissues. Protein spots
were detected according to the different protein expression
patterns of specimens and the similarity of the protein expression
spectrum. A total of 821±28 protein spots with 80.3% matching ratio
were observed in protein maps of stage I ESCC tissues, and 853±31
spots with 82.5% matching ratio were identified in protein maps of
stage III ESCC tissues. In addition, fifteen protein spots with
>2-fold differences were observed between stage I ESCC tissues
and stage III ESCC tissues (Fig.
1).
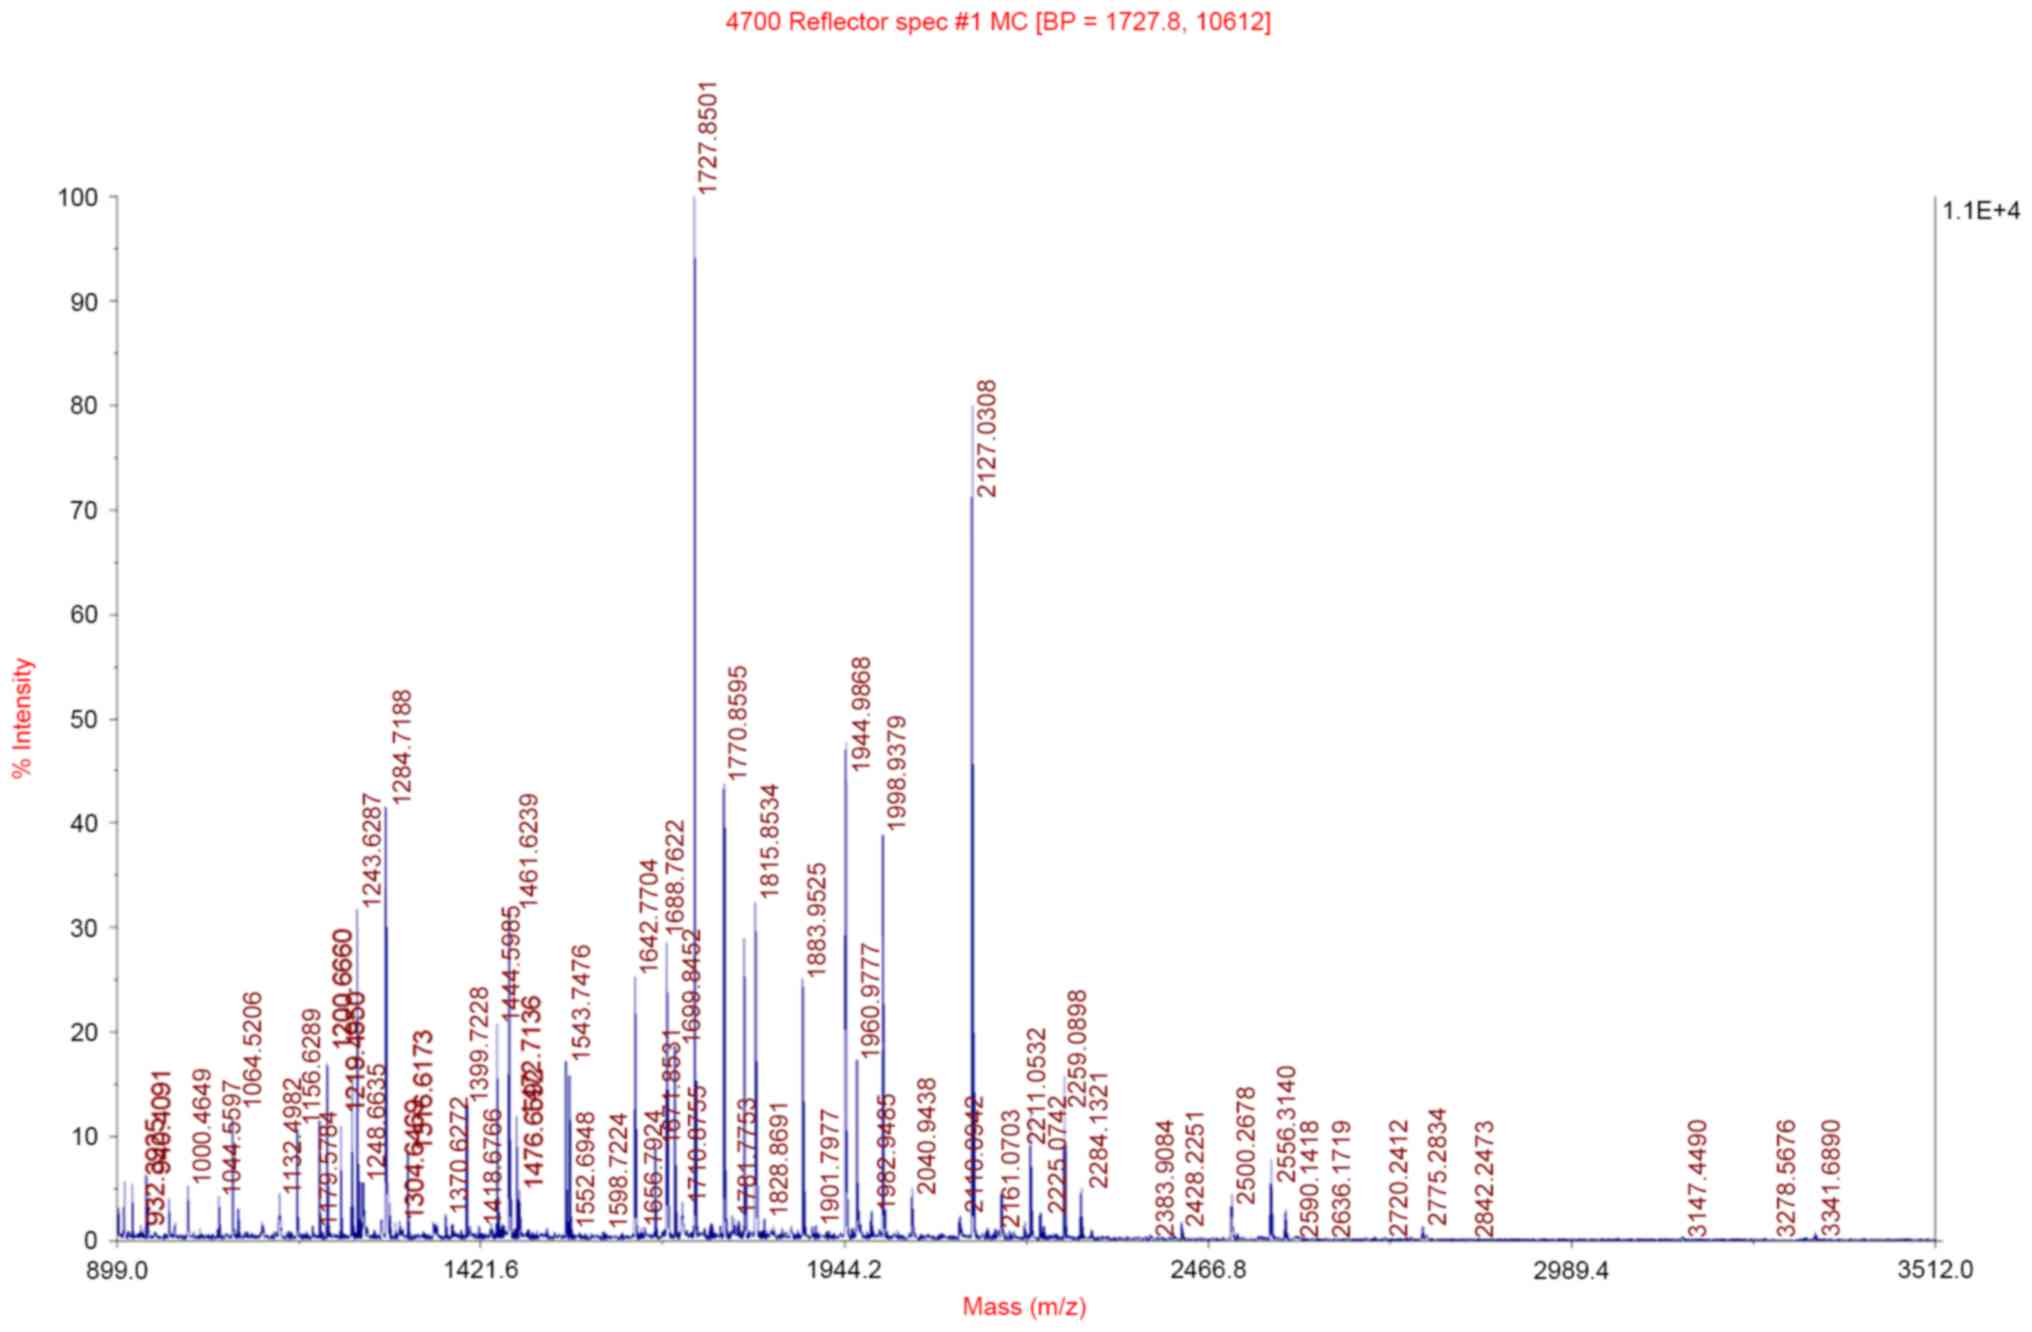
Mass spectrometric analysis
These fifteen protein spots with >2-fold
difference were then excised, in-gel digested and analyzed with a
MALDI-TOF/MS. The observed peptide mass spectra were analyzed by
peptide mass fingerprinting, and 12 differentially expressed
proteins were identified (listed in Table I). These proteins are closely
associated with ESCC invasion and metastasis, apoptosis and cell
signal transduction. The peptide mass fingerprinting of TPM3 is
presented in Fig. 2.
 | Table I.Characteristics of identified
differential expressed proteins in stage III ESCC tissue samples
compared with stage I samples. |
Table I.
Characteristics of identified
differential expressed proteins in stage III ESCC tissue samples
compared with stage I samples.
| Number | Protein name | Accession number | pI | MW | Score | CI (%) |
|---|
| 1 | TPM3 | IPI00218319 | 4.75 | 29014.7 | 312 | 100 |
| 2 | IL1RN | IPI00218573 | 4.73 | 19884.6 | 516 | 100 |
| 3 | MYL12B | IPI00033494 | 4.71 | 19766.5 | 294 | 100 |
| 4 | hnRNP F | IPI00003881 | 5.38 | 45642.9 | 307 | 100 |
| 5 | Albumin | IPI00878282 | 5.93 | 22844 | 242 | 100 |
| 6 | Desmin | IPI00465084 | 5.21 | 53502.1 | 841 | 100 |
| 7 | Cystatin-A | IPI00032325 | 5.38 | 10999.7 | 293 | 100 |
| 8 | RPSA 30 kDa
protein | IPI00927101 | 5.15 | 29487 | 442 | 100 |
| 9 | Involucrin | IPI00011692 | 4.62 | 69561.8 | 590 | 100 |
| 10 | MGC29506 | IPI00102821 | 5.37 | 20681.2 | 561 | 100 |
| 11 | Vimentin | IPI00418471 | 5.06 | 53619.3 | 364 | 100 |
| 12 | TPM2 | IPI00013991 | 4.66 | 32830.6 | 187 | 100 |
| 13 | HSPB1 | IPI00025512 | 5.98 | 22768.5 | 437 | 100 |
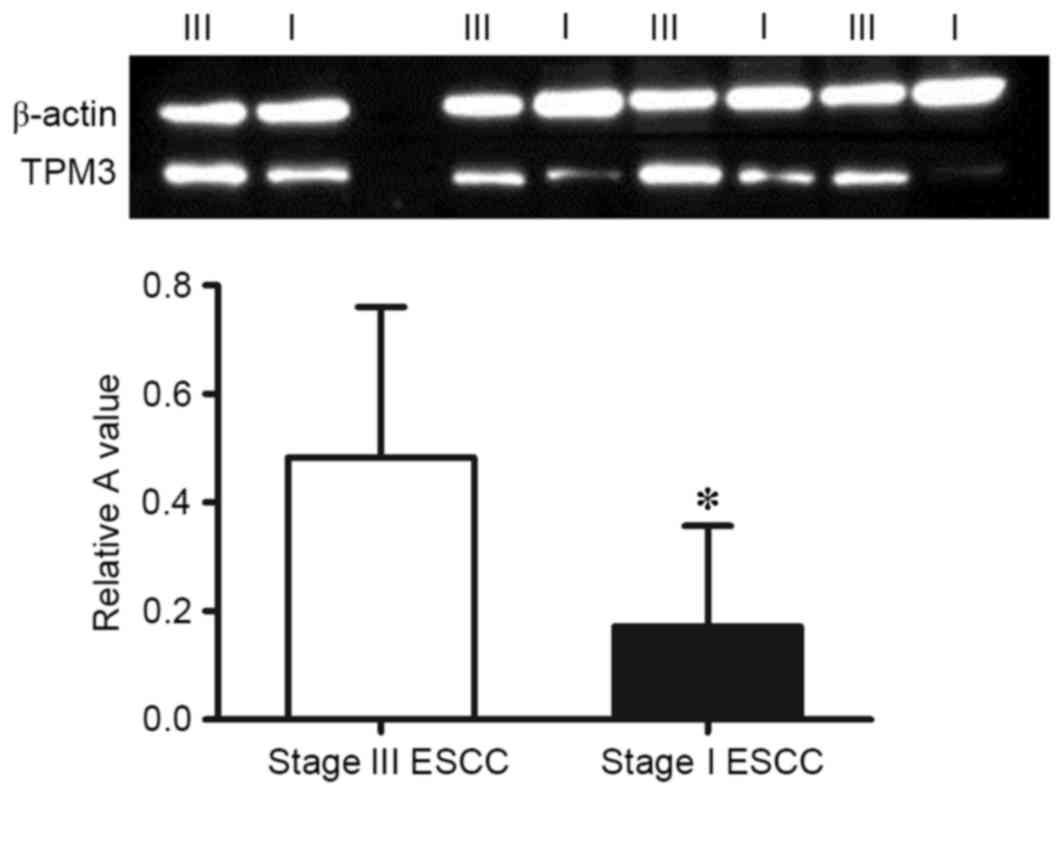
Western blot analysis
The protein expression levels of TPM3 in stage I and
stage III ESCC tissues were analyzed using western blotting. As
presented in Fig. 3, the
expression of TPM3 in stage III ESCC tissues was significantly
higher than in stage I ESCC tissues (P=0.009) which was consistent
with the results of the proteomic analysis.
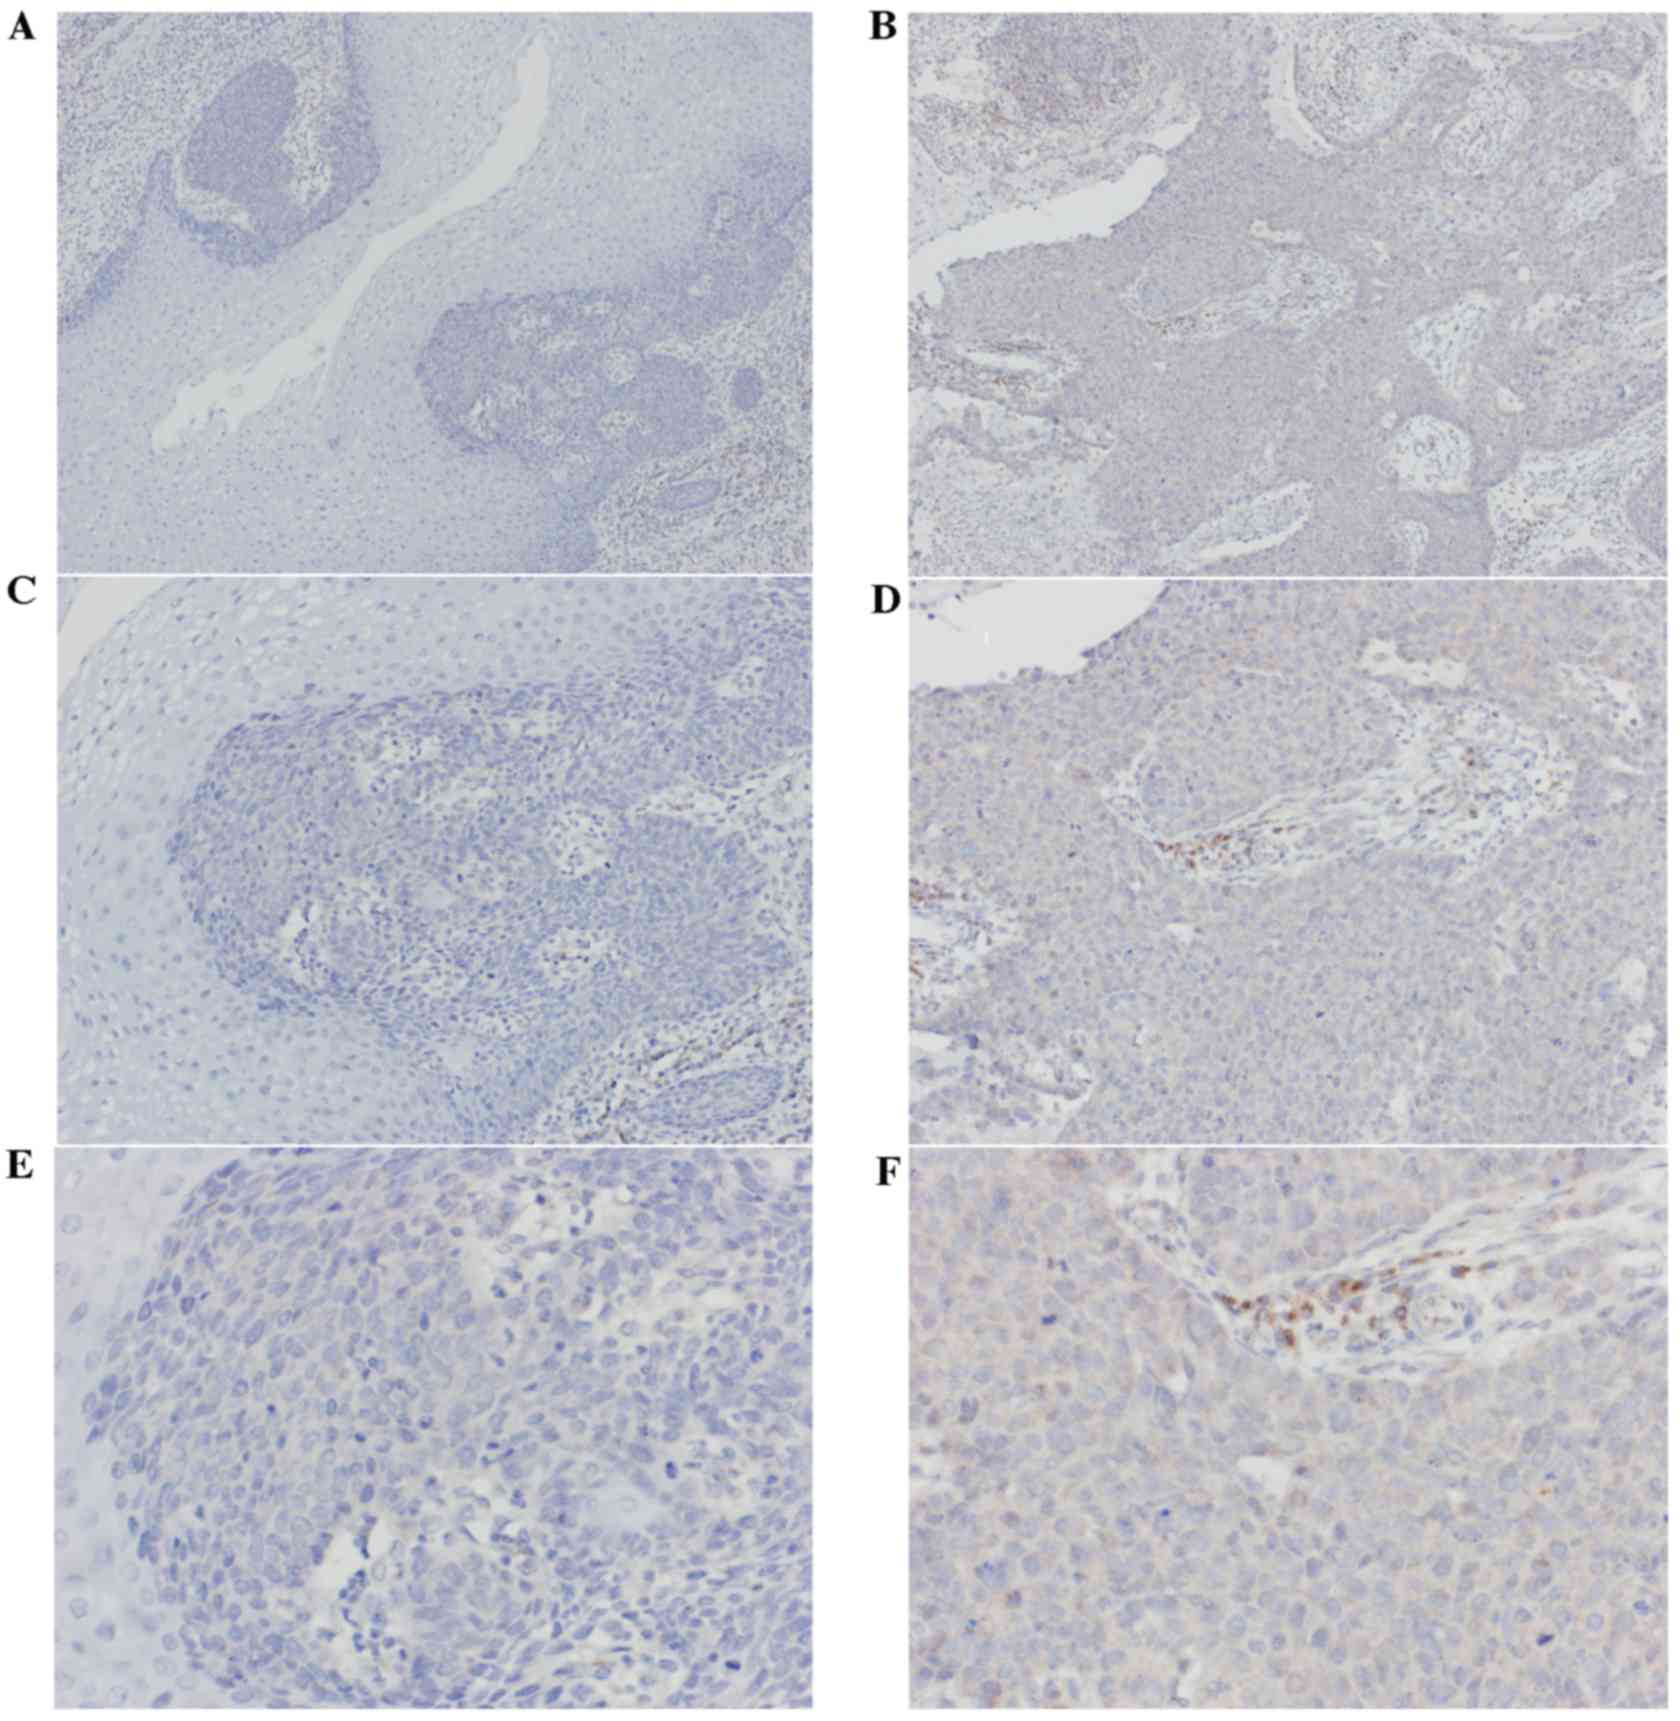
IHC
The expression levels of TPM3 protein in the 33
stage I specimens and 33 stage III specimens were observed using
immunohistochemical staining. Cytoplasm staining was considered as
positive. The levels of staining depended on the expression of TPM3
and the rate of positive cells (Fig.
4). The immunohistochemical results indicated the expression
levels of TPM3 in stage III ESCC tissues were significantly higher
than in stage I ESCC tissues (P=0.005; Table II).
| Table II.Clinical data and TPM3 expression in
stage I and III ESCC patients by immunohistochemistry. |
Table II.
Clinical data and TPM3 expression in
stage I and III ESCC patients by immunohistochemistry.
|
| Stage I | Stage III |
|
|---|
| Factors | ESCC | ESCC | P-value |
|---|
| Total | 33 | 33 |
|
| Gender |
|
| 0.108 |
|
Male | 20 | 26 |
|
|
Female | 13 | 7 |
|
| Age |
|
| 0.447 |
| <60
years | 19 | 22 |
|
| ≥60
years | 14 | 11 |
|
| Tumor
differentiation |
|
| 0.109 |
|
Well | 15 | 15 |
|
|
Moderate | 17 | 12 |
|
|
Poor | 1 | 6 |
|
| Tumor location |
|
| 0.649 |
|
Upper | 5 | 8 |
|
|
Middle | 20 | 18 |
|
|
Lower | 8 | 7 |
|
| Expression of
TPM3 |
|
| 0.005 |
|
Positive | 7 | 18 |
|
|
Negative | 26 | 15 |
|
Discussion
Previous studies have demonstrated that expression
changes of genes and proteins are associated with tumor progression
(6,10–13).
The mutant genes are transcribed and translated into proteins, and
the expression levels of proteins dictate the tumor phenotype and
regulate its biological behavior. Thus, proteomics can reflect the
features of tumor biology more effectively than genomics (8). Using the proteomics method, Uemura
et al (11) demonstrated
the high expression of transglutaminase 3 (TGM3) was associated
with ESCC lymph node metastasis and detecting the expression of
TGM3 may provide a novel strategy for preventing the recurrence of
ESCC. Fan et al (14)
performed a proteomic analysis and suggested that TP-α, collagen
type VI α-1 chain and S100 calcium-binding protein A9 may be
important in the development of ESCC (14).
ESCC tumor-node-metastasis (TNM) staging is
associated with the biological behavior of tumor cells and reflects
the degree of tumor malignancy. At present, proteins associated
with ESCC TNM staging have not been determined. The differential
expressed proteins were compared between stage I ESCC tissues and
stage III ESCC tissues in the present study using 2-DE and MS.
Twelve differentially expressed proteins were identified including
TPM3, isoform 3 of interleukin-1 receptor antagonist protein
(IL1RN), myosin regulatory light chain 12B RLC (MYL12B),
heterogeneous nuclear ribonucleoprotein F (hnRNP F), albumin,
desmin (DES), cystatin-A (CSTA), RPSA 30 kDa protein, involucrin,
isoform 1 of proapoptotic caspase adapter protein (MGC29506),
vimentin, tropomyosin 2 (TPM2), and heat shock protein β-1. These
differentially expressed proteins may be involved in ESCC invasion
and metastasis, apoptosis and cell signal transduction.
Previous studies have demonstrated the identified
differentially expressed proteins are important role in the
development of tumors. IL1RN promoted Helicobacter pylori
infection in the stomach and increased the risk of the formation of
non-cardia gastric cancer (15,16).
Cytoskeleton rearrangement altered the activity of colon cancer
cells, which was associated with MYL12B (17). Su et al (18) observed that the overexpression of
hnRNP F influenced the development of colon tumors and interfered
with normal apoptosis and energy metabolism of bladder cells, which
could result in bladder cancer. DES, TPM3, TPM2 and vimentin are
important in maintaining the stability of the cytoskeleton, and
changes in vimentin expression were associated with liver cancer
metastasis and recurrence (19). A
previous study indicated that smoking and chronic obstructive
pulmonary disease promoted respiratory tract squamous carcinoma by
upregulating CSTA expression levels (20). Downregulation of involucrin
participated in the development of squamous carcinomas via
influencing epithelial-mesenchymal transition (EMT) (21). MGC29506 promoted the progress of
gastric cancer via altering the cell cycle (22). Chen et al (23) reported that decreasing HSPB1
expression was associated with the low differentiation of ESCC
(23).
Choi et al (24) demonstrated the overexpression of
TPM3 altered liver cancer cell invasion and metastasis via
influencing EMT. Using 2-DE and MS, the present study observed the
expression levels of TPM3 in stage III ESCC tissues were
significantly higher than stage I. Thus, the effects of TPM3 on
ESCC invasion and metastasis were further investigated in the
current study.
TPM3 encodes an actin-binding protein, which is a
member of the tropomyosin family. In skeletal muscle, TPM3
meditates the reaction of myosin and actin with Ca2+
ions and stabilizes the microfilament cytoskeleton of muscle cells
(25). However, the functions of
TPM3 protein in non-muscle cells require further elucidation.
Previous studies have demonstrated that TPM3 contributes to
tumorigenesis in the thyroid papillary carcinoma and chronic
eosinophilic granulocyte leukemia by fusing with neurotrophic
receptor tyrosine kinase 1 and Platelet-derived growth factor
receptor β, respectively (26,27).
The results of the western blotting and IHC in the present study
demonstrated that the protein expression levels of TPM3 in stage
III ESCC tissues were significantly higher compared with stage I.
Thus, the present study hypothesized that the high expression
levels of TPM3 may be associated with the invasion and metastasis
of ESCC while the molecular mechanism remains to be elucidated.
Gene transfection and RNA interference technology will be applied
in further research. TPM3 plasmids will be constructed and stably
transfected in human ESCC cells in order to observe the influence
of changes in TPM3 gene expression on ESCC cell proliferation,
apoptosis, cell-cycle distribution and invasion ability.
In conclusion, a total of 12 differentially
expressed proteins were identified in the present study. All of
these proteins were closely associated with ESCC invasion and
metastasis, apoptosis and cell signal transduction. The
overexpression of TPM3 in stage III ESCC tissues was also verified,
which may be important in ESCC invasion and metastasis. The present
study helped to investigate the mechanism underlying the influence
of differentially expressed proteins on ESCC invasion and
metastasis, and search the markers associated with ESCC diagnosis,
which may optimize patient treatment strategies.
Acknowledgements
The present study was supported by the Fujian
Medical Innovation Fund (2014-CX-15), Fujian Young Teacher Fund
(JAT160209), Fujian Medical University Professor Fund (JS12008) and
Fujian Province Science and Technology Programmed Fund
(2012Y0030).
References
|
1
|
Pennathur A, Gibson MK, Jobe BA and
Luketich JD: Oesophageal carcinoma. Lancet. 381:400–412. 2013.
View Article : Google Scholar : PubMed/NCBI
|
|
2
|
Jia Y, Wang N, Wang J, Tian H, Ma W, Wang
K, Tan B, Zhang G, Yang S, Bai B and Cheng Y: Down-regulation of
stromal caveolin-1 expression in esophageal squamous cell
carcinoma: A potent predictor of lymph node metastases, early tumor
recurrence, and poor prognosis. Ann Surg Oncol. 21:329–336. 2014.
View Article : Google Scholar : PubMed/NCBI
|
|
3
|
Wang K, Ma W, Wang J, Yu L, Zhang X, Wang
Z, Tan B, Wang N, Bai B, Yang S, et al: Tumor-stroma ratio is an
independent predictor for survival in esophageal squamous cell
carcinoma. J Thorac Oncol. 7:1457–1461. 2012. View Article : Google Scholar : PubMed/NCBI
|
|
4
|
Zhu YH, Liu H, Zhang LY, Zeng T, Song Y,
Qin YR, Li L, Liu L, Li J, Zhang B and Guan XY: Downregulation of
LGI1 promotes tumor metastasis in esophageal squamous cell
carcinoma. Carcinogenesis. 35:1154–1161. 2014. View Article : Google Scholar : PubMed/NCBI
|
|
5
|
Xuan X, Li Q, Zhang Z, Du Y and Liu P:
Increased expression levels of S100A4 associated with
hypoxia-induced invasion and metastasis in esophageal squamous cell
cancer. Tumour Biol. 35:12535–12543. 2014. View Article : Google Scholar : PubMed/NCBI
|
|
6
|
Hu Y, Correa AM, Hoque A, Guan B, Ye F,
Huang J, Swisher SG, Wu TT, Ajani JA and Xu XC: Prognostic
significance of differentially expressed miRNAs in esophageal
cancer. Int J Cancer. 128:132–143. 2011. View Article : Google Scholar : PubMed/NCBI
|
|
7
|
Kashyap MK, Harsha HC, Renuse S, Pawar H,
Sahasrabuddhe NA, Kim MS, Marimuthu A, Keerthikumar S, Muthusamy B,
Kandasamy K, et al: SILAC-based quantitative proteomic approach to
identify potential biomarkers from the esophageal squamous cell
carcinoma secretome. Cancer Biol Ther. 10:796–810. 2010. View Article : Google Scholar : PubMed/NCBI
|
|
8
|
Liu Z, Feng JG, Tuersun A, Liu T, Liu H,
Liu Q, Zheng ST, Huang CG, Lv GD, Sheyhidin I and Lu XM: Proteomic
identification of differentially-expressed proteins in esophageal
cancer in three ethnic groups in Xinjiang. Mol Biol Rep.
38:3261–3269. 2011. View Article : Google Scholar : PubMed/NCBI
|
|
9
|
Zhang J, Wang K, Zhang J, Liu SS, Dai L
and Zhang JY: Using proteomic approach to identify tumor-associated
proteins as biomarkers in human esophageal squamous cell carcinoma.
J Proteome Res. 10:2863–2872. 2011. View Article : Google Scholar : PubMed/NCBI
|
|
10
|
Ying J, Shan L, Li J, Zhong L, Xue L, Zhao
H, Li L, Langford C, Guo L, Qiu T, et al: Genome-wide screening for
genetic alterations in esophageal cancer by aCGH identifies 11q13
amplification oncogenes associated with nodal metastasis. PLoS one.
7:e397972012. View Article : Google Scholar : PubMed/NCBI
|
|
11
|
Uemura N, Nakanishi Y, Kato H, Saito S,
Nagino M, Hirohashi S and Kondo T: Transglutaminase 3 as a
prognostic biomarker in esophageal cancer revealed by proteomics.
Int J Cancer. 124:2106–2115. 2009. View Article : Google Scholar : PubMed/NCBI
|
|
12
|
Yang Z, Guan B, Men T, Fujimoto J and Xu
X: Comparable molecular alterations in 4-nitroquinoline
1-oxide-induced oral and esophageal cancer in mice and in human
esophageal cancer, associated with poor prognosis of patients. In
vivo. 27:473–484. 2013.PubMed/NCBI
|
|
13
|
Moghanibashi M, Jazii FR, Soheili ZS, Zare
M, Karkhane A, Parivar K and Mohamadynejad P: Proteomics of a new
esophageal cancer cell line established from Persian patient. Gene.
500:124–133. 2012. View Article : Google Scholar : PubMed/NCBI
|
|
14
|
Fan NJ, Gao CF, Wang CS, Zhao G, Lv JJ,
Wang XL, Chu GH, Yin J, Li DH, Chen X, et al: Identification of the
up-regulation of TP-alpha, collagen alpha-1(VI) chain and S100A9 in
esophageal squamous cell carcinoma by a proteomic method. J
Proteomics. 75:3977–3986. 2012. View Article : Google Scholar : PubMed/NCBI
|
|
15
|
da Costa DM, Neves-Filho EH, Alves MK and
Rabenhorst SH: Interleukin polymorphisms and differential
methylation status in gastric cancer: An association with
Helicobacter pylori infection. Epigenomics. 5:167–175. 2013.
View Article : Google Scholar : PubMed/NCBI
|
|
16
|
Xue H, Lin B, Ni P, Xu H and Huang G:
Interleukin-1B and interleukin-1 RN polymorphisms and gastric
carcinoma risk: A meta-analysis. J Gastroenterol Hepatol.
25:1604–1617. 2010. View Article : Google Scholar : PubMed/NCBI
|
|
17
|
Dabrowska M, Skoneczny M and Rode W:
Functional gene expression profile underlying methotrexate-induced
senescence in human colon cancer cells. Tumor Biol. 32:965–976.
2011. View Article : Google Scholar
|
|
18
|
Su CC, Su JH, Lin JJ, Chen CC, Hwang WI,
Huang HH and Wu YJ: An investigation into the cytotoxic effects of
13-acetoxysarcocrassolide from the soft coral Sarcophyton
crassocaule on bladder cancer cells. Mar Drugs. 9:2622–2642. 2011.
View Article : Google Scholar : PubMed/NCBI
|
|
19
|
Dong P, He XW, Gu J, Wu WG, Li ML, Yang
JH, Zhang L, Ding QC, Lu JH, Mu JS, et al: Vimentin significantly
promoted gallbladder carcinoma metastasis. Chin Med J (Engl).
124:4236–4244. 2011.PubMed/NCBI
|
|
20
|
Butler MW, Fukui T, Salit J, Shaykhiev R,
Mezey JG, Hackett NR and Crystal RG: Modulation of cystatin A
expression in human airway epithelium related to genotype, smoking,
COPD, and lung cancer. Cancer Res. 71:2572–2581. 2011. View Article : Google Scholar : PubMed/NCBI
|
|
21
|
Lan YJ, Chen H, Chen JQ, Lei QH, Zheng M
and Shao ZR: Immunolocalization of vimentin, keratin 17, Ki-67,
Involucrin, β-catenin and E-cadherin in cutaneous squamous cell
carcinoma. Pathol Oncol Res. 20:263–266. 2014. View Article : Google Scholar : PubMed/NCBI
|
|
22
|
Xia L, Shen C, Fu Y, Tian L and Chen M:
MGC29506 induces cell cycle arrest and is downregulated in gastric
cancer. Cell Immunol. 281:31–36. 2013. View Article : Google Scholar : PubMed/NCBI
|
|
23
|
Chen JH, Chen LM, Xu LY, Wu MY and Shen
ZY: Expression and significance of heat shock proteins in
esophageal squamous cell carcinoma. Zhonghua zhong liu za zhi.
28:758–761. 2006.(In Chinese). PubMed/NCBI
|
|
24
|
Choi HS, Yim SH, Xu HD, Jung SH, Shin SH,
Hu HJ, Jung CK, Choi JY and Chung YJ: Tropomyosin3 overexpression
and a potential link to epithelial-mesenchymal transition in human
hepatocellular carcinoma. BMC cancer. 10:1222010. View Article : Google Scholar : PubMed/NCBI
|
|
25
|
Pieples K, Arteaga G, Solaro RJ, Grupp I,
Lorenz JN, Boivin GP, Jagatheesan G, Labitzke E, DeTombe PP,
Konhilas JP, et al: Tropomyosin 3 expression leads to
hypercontractility and attenuates myofilament length-dependent
Ca(2+) activation. Am J Physiol Heart Circ Physio. 283:H1344–H1353.
2002. View Article : Google Scholar
|
|
26
|
Greco A, Miranda C and Pierotti MA:
Rearrangements of NTRK1 gene in papillary thyroid carcinoma. Mol
Cell Endocrinol. 321:44–49. 2010. View Article : Google Scholar : PubMed/NCBI
|
|
27
|
Li Z, Yang R, Zhao J, Yuan R, Lu Q, Li Q
and Tse W: Molecular diagnosis and targeted therapy of a pediatric
chronic eosinophilic leukemia patient carrying TPM3-PDGFRB fusion.
Pediatr Blood Cancer. 56:463–466. 2011. View Article : Google Scholar : PubMed/NCBI
|