Introduction
Berberine, which is an alkaloid extracted from
Rhizoma coptidis, has been traditionally used in Chinese medicine
to treat gastrointestinal infections, due to its antimicrobial
properties. Previous clinical research and animal studies have
demonstrated that berberine can regulate glucose and lipid
metabolism, and attenuate insulin resistance (1–3).
Several mechanisms have been proposed to explain the actions of
berberine in in vitro and in vivo models; these
include: The activation of AMP-activated protein kinase to
downregulate the expression of lipogenesis genes and upregulate the
expression of energy expenditure genes (4); the inhibition of intestinal
disaccharidases and α-glucosidase (5,6); the
upregulation of the hepatic low-density lipoprotein receptor
(7); the inhibition of intestinal
cholesterol absorption (8); and
increased intestinal glucagon-like peptide-1 (GLP-1) secretion
(9,10). Since berberine has been reported to
have poor intestinal absorption and very low absolute
bioavailability, with values ranging between 0.36 and 0.68% in
rats, it may be hypothesized that berberine exerts its effects in
the intestinal tract prior to its absorption (11,12).
Accumulating evidence suggests that the gut
microbiome serves an important role in obesity and related
metabolic abnormalities. Taking into consideration the
antibacterial activity of berberine, modulation of the gut
microbiota has been suggested as another possible mechanism for its
actions. Xie et al (2)
reported that berberine significantly increased the intestinal
expression of fasting-induced adipose factor (Fiaf), which acts as
a lipoprotein lipase inhibitor, thereby inhibiting triglyceride
deposition in adipocytes. Furthermore, it has been reported that
Lactobacillus paracasei may upregulate Fiaf expression in
colonic epithelial cells (13).
These findings indicate that, through modulating the gut
microbiota, berberine may increase the expression of Fiaf.
The leakage of bacterial-derived lipopolysaccharide
(LPS) through the damaged intestinal mucosa into the circulation is
a well-established mechanism of metabolic endotoxemia that can
trigger systemic inflammation. Zhang et al (14) previously reported that berberine
may prevent obesity and insulin resistance in high-fat diet
(HFD)-fed rats by modulating the gut microbiota, thus contributing
to the alleviaton of inflammation via a reduction in serum
LPS-binding protein and monocyte chemotactic protein-1 (MCP-1).
However, there is currently little information available on whether
berberine can modulate endotoxemia and intestinal or systemic
inflammation.
Previous studies have suggested that gut microbiota
may contribute to the development of obesity and related disorders
by modulating the synthesis of enteroendocrine peptides involved in
glucose and energy homeostasis. A series of studies by Cani et
al (15–18) reported that prebiotic use can
interfere with plasma levels of intestinal peptides, causing an
increase in GLP-1, GLP-2 and peptide YY (PYY), and a decrease in
gastric inhibitory polypeptide (GIP) in rodent and human subjects.
Short-chain fatty acids (SCFAs), produced during the bacterial
fermentation of non-digestible carbohydrates, have been shown to
promote GLP-1 and PYY secretion by stimulating the expression of G
protein-coupled receptor 41 and 43 in enteroendocrine cells
(L-cells) (19–22). Furthermore, prebiotics have been
reported to promote GLP-2 production by increasing the number of
intestinal L-cells and the mRNA expression of proglucagon (15). Taken together, these studies
suggest that the fermentation of prebiotics by intestinal bacteria
can interfere with gut peptide production. In addition, previous
studies have revealed that berberine can increase the number of
intestinal L-cells and thereby increase plasma GLP-1 levels in
normal and diabetic rats (9,10,23).
Furthermore, berberine has been demonstrated to promote ileal GLP-2
secretion and thus decrease LPS plasma levels in diabetic rats
(24). Since GLP-2 is known to
regulate the proliferation of intestinal epithelial cells and thus
the integrity of the gut barrier, berberine may also promote
intestinal integrity through modulating GLP-2 levels. Although
previous studies have suggested that the effects of berberine on
glucose metabolism and energy homeostasis are related to its
modulatory effects on gut hormones, it remains to be elucidated
whether other hormones may also be involved.
In order to investigate the effects of berberine
administration on the gut and the gut microbiome, the present study
employed a rat model of diet-induced obesity. Alterations in gut
microbiota were assessed using 454 pyrosequencing, whereas
intestinal hormone levels were assessed using Luminex technology.
Intestinal permeability, the expression of tight junction proteins,
endotoxemia, and systemic inflammation were also investigated.
Materials and methods
Materials
Berberine and fluorescein isothiocyanate
(FITC)-dextran were purchased from Merck KGaA (Darmstadt, Germany).
All diets were purchased from Research Diets, Inc. (New Brunswick,
NJ, USA). Rat metabolic hormone kit, GLP-1 (cat. no. EGLP-35K) and
GLP-2 (cat. no. EZGLP2-37K) ELISA kits were purchased from Merck
KGaA. TRIzol® reagent and DAPI were purchased from
Invitrogen (Thermo Fisher Scientific, Inc., Waltham, MA, USA).
Reverse transcription kit and SYBR-Green were purchased from Takara
Biotechnology Co., Ltd. (Dalian, China). Optimal cutting
temperature (OCT) compound was purchased from Sakura Finetek USA,
Inc. (Torrance, CA, USA). Claudin1 (cat. no. ab203563), claudin2
(cat. no. ab53032) and GLP-1 antibodies (cat. no. ab22625) were
purchased from Abcam (Cambridge, MA, USA). Goat anti-rabbit
Cy3-conjugated secondary antibody (cat. no. 111-165-003) was
purchased from Jackson ImmunoResearch Laboratories, Inc. (West
Grove, PA, USA). QIAamp DNA stool minikit was purchased from
Qiagen, Inc. (Valencia, CA, USA). FastPfu polymerase was purchased
from TransGen Biotech Co., Ltd. (Beijing, China). Axy-Prep DNA Gel
Extraction kit was purchased from Axygen Biotechnology Co., Ltd.
(Taizhou, China).
Animals
Thirty male Sprague-Dawley rats (age, 6 to 8 weeks;
weight, ~260 g) were purchased from the SLAC Laboratory Animal Co.,
Ltd. (Shanghai, China), and were housed in a controlled environment
(21 to 25°C; inverted 12-h daylight cycle; lights-off at 6:00 p.m.)
in groups of 2 rats/cage and given free access to water and food.
Following an acclimation period of 1 week, the rats were fed a
control diet (Ctl group; n=10, 10% kcal from fat) or a HFD (HF
group; n=20, 45% kcal from fat) for 14 weeks. Following 14 weeks,
10 rats from the HF group were maintained on the HFD however, they
were given an oral supplement of berberine (150 mg/kg/day) for 6
weeks (HB group). For the duration of the study, the animals were
weighed once a week, and their food intake was measured twice a
week. All experimental procedures were validated by the Ethics
Committee of Changhai Hospital, The Second Military Medical
University (Shanghai, China).
Oral glucose tolerance test
The glucose tolerance tests were conducted following
6 weeks of berberine administration. Following a 12 h fast, the
rats received an oral load of 50% glucose solution (2.0 g/kg).
Blood glucose was sampled in the tail vein before and 15, 30, 60,
90 and 120 min following glucose administration with an ACCU-CHEK
glucose meter (Roche Diagnostics, Basel, Switzerland).
In vivo intestinal permeability
Rats from all groups were fasted for 6 h and were
subsequently administered FITC-dextran diluted in saline by gavage
(500 mg/kg, 125 mg/ml). Following 1 and 4 h, 500 µl of blood was
sampled from the tail vein, placed in ice-cold heparinized tubes
and centrifuged (12,000 × g for 3 min at 4°C). The obtained plasma
was then diluted with PBS (1:3 v/v) and the FITC-dextran
concentration was determined using a fluorescence spectrophotometer
(F7000; Hitachi, Ltd., Tokyo, Japan) at an excitation wavelength of
485 nm and an emission wavelength of 535 nm. A standard curve was
obtained by diluting serial concentrations of FITC-dextran in
non-treated plasma diluted with PBS (1:3 v/v).
Blood samples
At the end of the experiments, the rats were
anesthetized by an intraperitoneal injection of 30 mg/kg
pentobarbital following a 12-h fasting period. Blood samples were
collected from the orbital plexus and the hepatic portal vein and
centrifuged (2,000 × g for 10 min at 4°C) to obtain plasma for
further biochemical analyses. LPS concentration in portal plasma
was determined using a kit utilizing Tachypleus amebocyte lysate
(Endosafe; Charles River Laboratories International, Inc.,
Wilmington, MA, USA) and estimated using the kinetic turbidimetric
method. Intestinal hormone levels in portal plasma [total GIP,
total pancreatic polypeptide (PP) and PYY] were determined in
triplicate using a rat metabolic hormone kit (cat. no. RMHMAG-84K;
Merck KGaA) and Luminex technology (Bio-Plex Multiplex system;
Bio-Rad Laboratories, Inc., Hercules, CA, USA) according to the
manufacturer's protocol. Total portal GLP-1 and GLP-2 levels were
determined using ELISA kits. Plasma alanine triglycerides,
cholesterol aminotransferase (ALT) and aspartate aminotransferase
(AST) were determined using an automatic biochemistry analyser
(HITACHI 2000; Hitachi, Ltd.).
Tissue samples
The rats were anesthetized using chloral hydrate
(400 mg/kg) and sacrificed by cervical dislocation. The visceral
adipose tissue, and segments of the liver and proximal colon, were
then removed. Tissues were immediately immersed in liquid nitrogen
and stored at −80°C for further mRNA analysis. The remaining liver
samples were used for hepatic lipid analysis and were stained with
Oil Red O to detect fat droplets. The proximal colon samples were
used for further immunofluorescence analysis.
Reverse transcription quantitative
polymerase chain reaction (RT-qPCR)
Total RNA was extracted form tissue samples using
TRIzol® reagent according to the manufacturer's
protocol. Total RNA (1 µg) was reverse transcribed into cDNA using
the PrimeScript RT reagents kit (Takara Biotechnology Co., Ltd.).
Briefly, the sample was incubated at 37°C for 15 min and then at
85°C for 5 sec. The mRNA levels of the different genes were
examined using RT-qPCR. qPCR was conducted using the Rotor-Gene
3000 system and software (Qiagen, Inc., Valencia, CA, USA) using
SYBR-Green. The thermocycling conditions were as follows: 95°C for
2 min, followed by 40 cycles of 95°C for 10 sec, 55°C for 30 sec
and 72°C for 30 sec. The primer sequences for the targeted genes
are presented in Table I. The
relative expression of each gene was normalized to the expression
of the GAPDH gene and was calculated using the comparative Cq
method (ΔΔCq) (25).
 | Table I.Primer sequences used for reverse
transcription-quantitative polymerase chain reaction. |
Table I.
Primer sequences used for reverse
transcription-quantitative polymerase chain reaction.
| Gene | Forward primers
(5′→3′) | Reverse primers
(5′→3′) |
|---|
| TNF-α |
TACTGAACTTCGGGGTGATTGGTCC |
CAGCCTTGTCCCTTGAAGAGAACC |
| IL-1β |
GCTGTGGCAGCTACCTATGTCTTG |
AGGTCGTCATCATCCCACGAG |
| PAI-1 |
AGTCTTTCCGACCAAGAGCA |
CCAGTTTTGTCCCAAAGGAA |
| NADPHox |
AAGTCATCCCCGCAACTGTTC |
CCCGCTTCCTCATCTGCAATTC |
| STAMP-2 |
ATCCCATCAAAATTTGGCTT |
CGCTGTGATTTGGAAGATTTAATAC |
| MCP-1 |
CAGATGCAGTTAATGCCCCAC |
AGCCGACTCATTGGGATCAT |
| F4/80 |
CAGCTGTCTTCCCGACTTTC |
TAATCAAGATTCCGGCCTTG |
| claudin-1 |
GCTGTCATCGGGGGCATAATA |
CCTGGCATTGATAGGGGTCAT |
| claudin-2 |
GGACACTTATCAAGCGAG |
CAGCAATGGGATTTAGACT |
| occludin |
CCTCTGACCTTGTCCGTGGATG |
TCCCTGCTTTCCCCTTCGTG |
| ZO-1 |
CTACCTTATTGAATGTC |
AACTGAATGGTCTGATGCT |
| proglucogan |
CCTCTATGCCAACACAGT |
AGCCACCAATCCACACAG |
| β-actin |
GGCTGGATTGTTTGTAATGC |
GGCGTTTGTCTTCGTTTATCT |
| GAPDH |
GGCTCTCTGCTCCTCCCTGTTCTAG |
CGTCCGATACGGCCAAATCCGT |
Oil Red O staining
Hepatic fat accumulation was evaluated by Oil Red O
staining. Liver tissue was embedded in OCT compound and frozen in
liquid nitrogen. The tissue was sliced into 8-µm cryostat sections
and stained with 0.05% Oil Red O at room temperature for 30 min to
detect lipid droplets. Photomicrographs were taken with a Nikon
Eclipse E600 microscope (Nikon Corporation, Tokyo, Japan). The
percentage of positively stained Oil Red O areas was quantified
using the Image-Pro Plus software (version 6; Media Cybernetics,
Inc., Rockville, MD, USA).
Immunofluorescence
Segments of the proximal colon were removed, washed
with PBS and fixed immediately in 4% paraformaldehyde. The fixed
tissue was dehydrated in ethanol, cleared in xylene, and embedded
in paraffin. The paraffin sections (4-µm) were deparaffinized,
rehydrated, treated with EDTA antigen retrieval buffers for 25 min
at 4°C, and incubated with 5% bovine serum albumin (Sangon Biotech
Co., Ltd., Shanghai, China) for 20 min to block non-specific
binding. The slides were incubated with rabbit anti-claudin-1
(dilution, 1:300) or rabbit anti-claudin-2 primary antibodies
(dilution, 1:300) overnight at 4°C in a moist chamber. The number
of L-cells was determined by staining with rabbit anti-GLP-1
primary antibody (dilution, 1:300) overnight at 4°C. Subsequently,
slides were washed 3 times with PBS and incubated with goat
anti-rabbit Cy3-conjugated secondary antibody (dilution, 1:100) for
50 min at room temperature. The slides were washed a further 3
times with PBS, mounted with ProLong Gold antifade reagent with
DAPI, and analyzed under a Nikon Eclipse TE-2000-U fluorescent
microscope (Nikon Corporation). A total of 5 fields from each
intestinal segment were selected, and the mucosal area was manually
delineated and measured by an image analyzer (Motic Image Plus
2.0ML; Motic Incorporation, Ltd., Causeway Bay, Hong Kong) for
determining the number of L-cells. All stained samples were
analyzed in a double-blind manner by 2 experienced
investigators.
Pyrosequencing
DNA extraction from fecal samples
Cecal feces were collected from the caecum of each
rat whilst under abdominal anaesthesia (30 mg/kg sodium
pentobarbital) and were stored at −80°C prior to analysis. The
total bacterial genomic DNA was extracted from the frozen feces
(200 mg) using the QIAamp DNA stool minikit according to the
manufacturer's protocol.
PCR amplification of 16S rRNA and
pyrosequencing
The extracted DNA served as a template to amplify
the V1-3 region of the 16S rRNA gene. The primers used were as
follows: Forward primer 5′-NNNNNNNNAGAGTTTGATCCTGGCTCAG-3′ and
reverse primer 5′-NNNNNNNNTTACCGCGGCTGCTGGCAC-3′.
NNNNNNNN indicates the 8-base bar code sequence used to tag each
PCR product, and the underlined sequence indicates the broad-range
primers used to amplify the V1-3 region of the 16S rRNA gene. The
PCR amplification mixture (20 µl) contained 10 ng template DNA, 4
µl 5X PCR FastPfu buffer, 0.2 units FastPfu polymerase, 2.5 mM dNTP
mixture and 0.4 µM of each primer. The PCR reactions were performed
using a GeneAmp PCR system 9700 cycler (Applied Biosystems; Thermo
Fisher Scientific, Inc.). The PCR conditions were as follows:
Denaturation at 95°C for 2 min, followed by 25 cycles at 95°C for
30 sec, 55°C for 30 sec and 72°C for 30 sec, and a final extension
at 72°C for 5 min. The PCR products were separated by
electrophoresis and subsequently cut from the 2% agarose gel. The
products were purified using the Axy-Prep DNA Gel Extraction kit.
The purified DNA was quantified using the QuantiFluor system
(Promega Corporation, Madison, WI, USA). A total of 4 µg purified
DNA was added to a master pool, and the DNA pool was sent to Major
Biosystem Co., Ltd., (Taipei, Taiwan) for pyrosequencing using the
GS FLX system (Roche Diagnostics GmbH, Mannheim, Germany) according
to the manufacturer's protocol. The company analysed the data using
Weighted UniFrac principal coordinates analysis (PCoA), principal
component analysis (PCA), redundancy analysis (RDA), Monte Carlo
permutation and Mothur tests.
Statistical analysis
Experiments were repeated at least 3 times and data
are expressed as the mean ± standard deviation. P<0.05 was
considered to indicate a statistically significant difference. The
statistical significance of the difference between groups was
assessed by one-way analysis of variance, followed by a post hoc
Bonferroni's multiple comparison tests; or by Kruskal-Wallis test
for non-parametric data, followed by a Dunn's multiple comparison
test. Correlations between parameters were assessed by the
Spearman's correlation coefficent. The analysis was performed using
SPSS software version 16.0 (SPSS, Inc., Chicago, IL, USA) and
figures were created using GraphPad Prism 5.0 (GraphPad Software,
Inc., La Jolla, CA, USA).
Results
Berberine prevents obesity and
improves glucose homeostasis in HFD-fed rats
Rats maintained on a HFD for 14 weeks exhibited a
significant increase in body weight compared with the control rats
(636.26±44.83 vs. 591.34±30.65 g; P<0.01; Fig. 1A). Treatment with berberine for 6
weeks significantly reversed the body weight increase of HFD-fed
rats compared with untreated HFD-fed rats (658.58±54.04 vs.
715.59±46.70 g; P<0.05; Fig.
1A). As a result, rats in the HB treatment group had a body
weight similar to the control group (Fig. 1A). During the course of the study,
food intake was monitored twice a week. Average daily food intake
appeared to be smaller in the HB treatment group; however, no
significant difference was revealed when compared with the HF group
(Fig. 1B). These results suggested
that berberine may prevent obesity without interfering with food
intake.
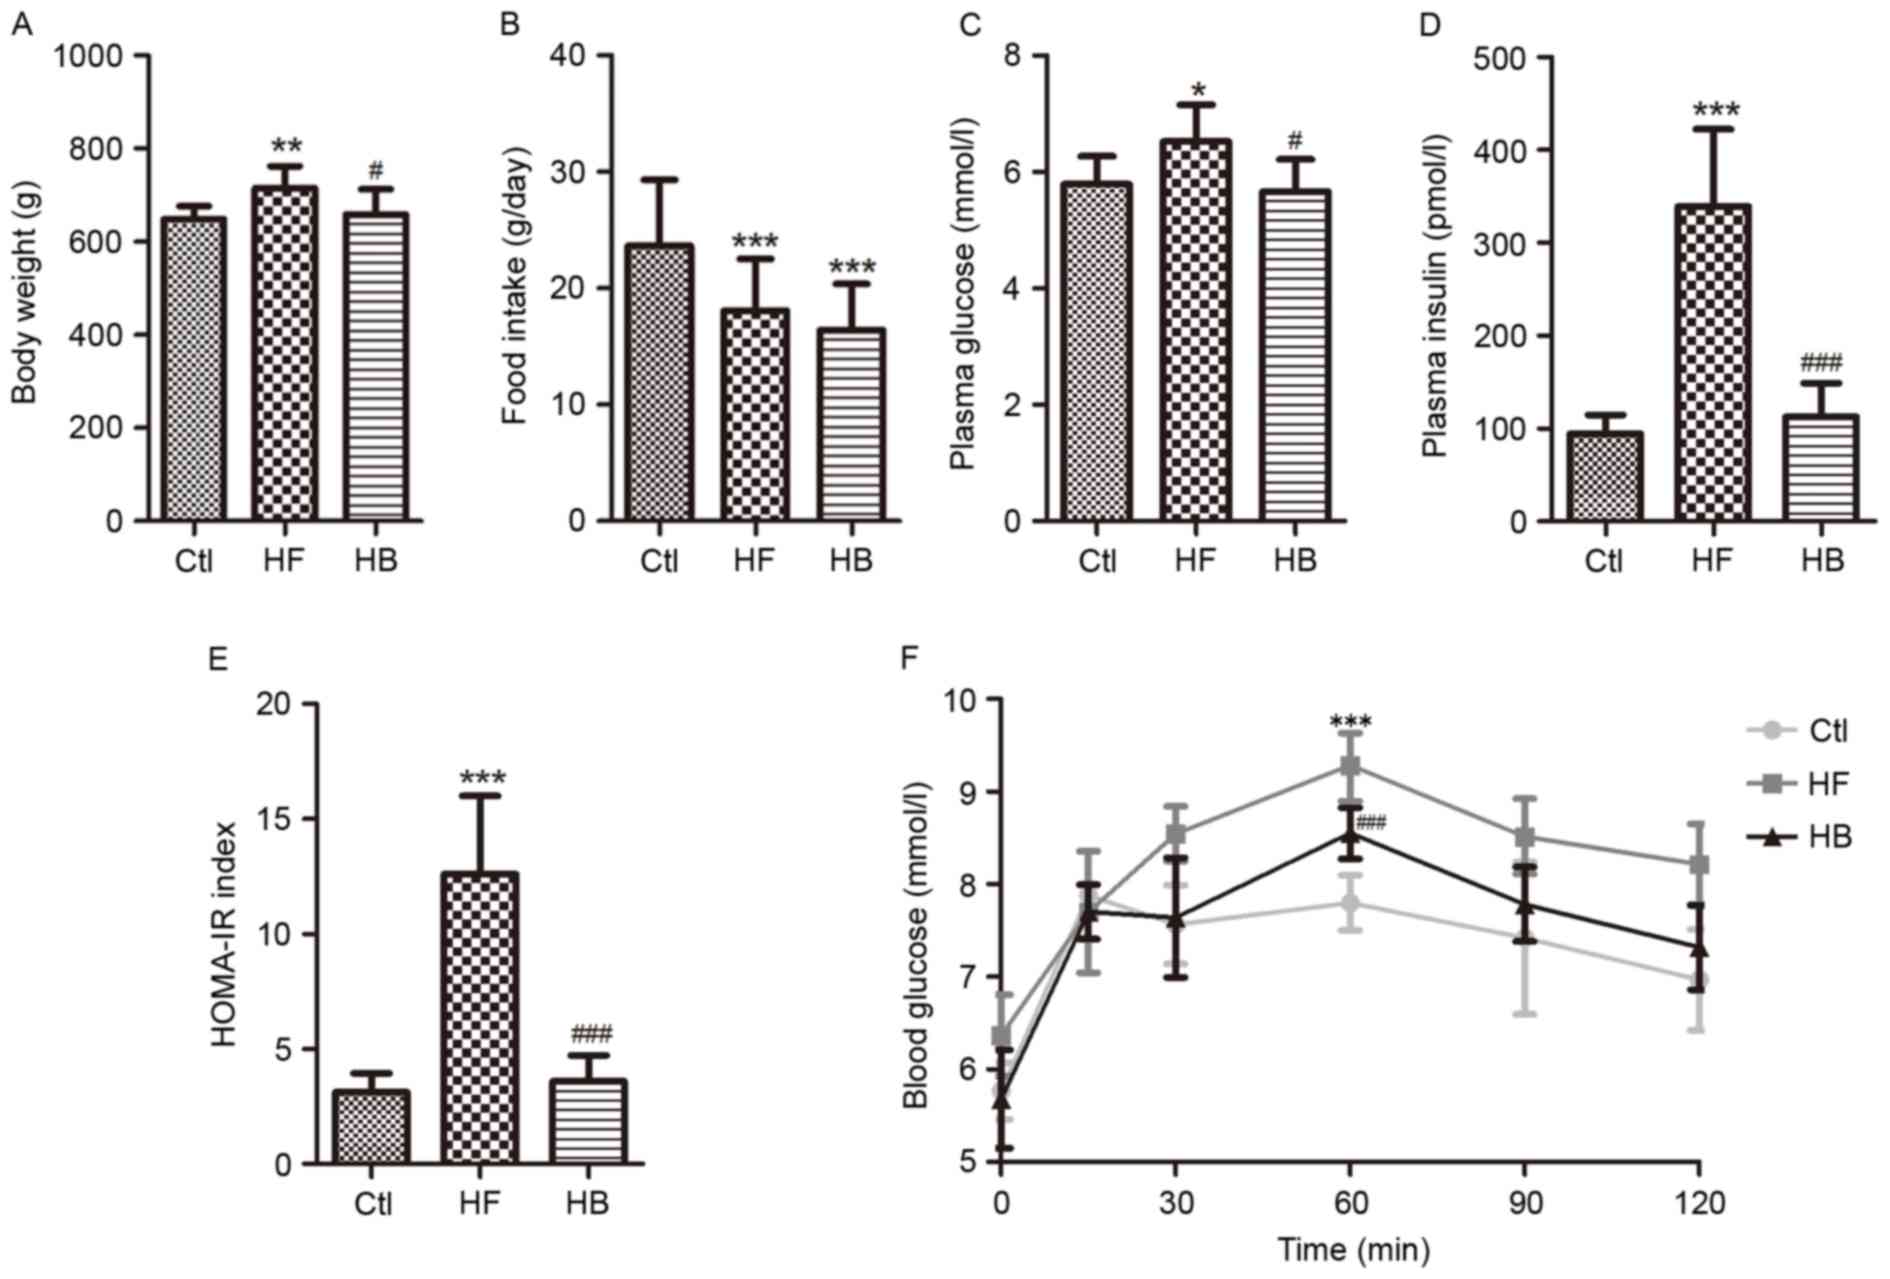 | Figure 1.Berberine reduced weight gain and
improved glucose homeostasis in HFD-fed rats. (A) Body weight. (B)
Daily food intake per rat. (C) Fasting plasma glucose
concentration. (D) Fasting plasma insulin concentration. (E)
HOMA-IR index, calculated using the following equation: FBG
(mmol/l) × FINS (mU/l)/22.5. (F) Oral glucose tolerance test. Data
are expressed as the mean ± standard deviation. *P<0.05,
**P<0.01, ***P<0.001 compared with the Ctl group;
#P<0.05, ###P<0.001 compared with the
HF group. Ctl, normal diet; HF, HFD; HB, HFD supplemented with
berberine for 6 weeks; HFD, high-fat diet; HOMA-IR, homeostasis
model assessment of insulin resistance; FBG, fasting blood glucose;
FINS, fasting blood insulin; OGTT, oral glucose tolerance test. |
Fasting blood glucose and fasting blood insulin
appeared to be significantly increased in rats of the HF group
compared with the control group (Fig.
1C and D). The HFD also caused impaired glucose tolerance and
insulin resistance, which was apparent by the significantly
increased homeostatic model assessment of insulin resistance index
and the significantly increased area under the curve following
glucose challenge (Fig. 1E and F).
Berberine treatment significantly improved fasting blood insulin
and insulin resistance, however, not fasting blood glucose
(Fig. 1C-F).
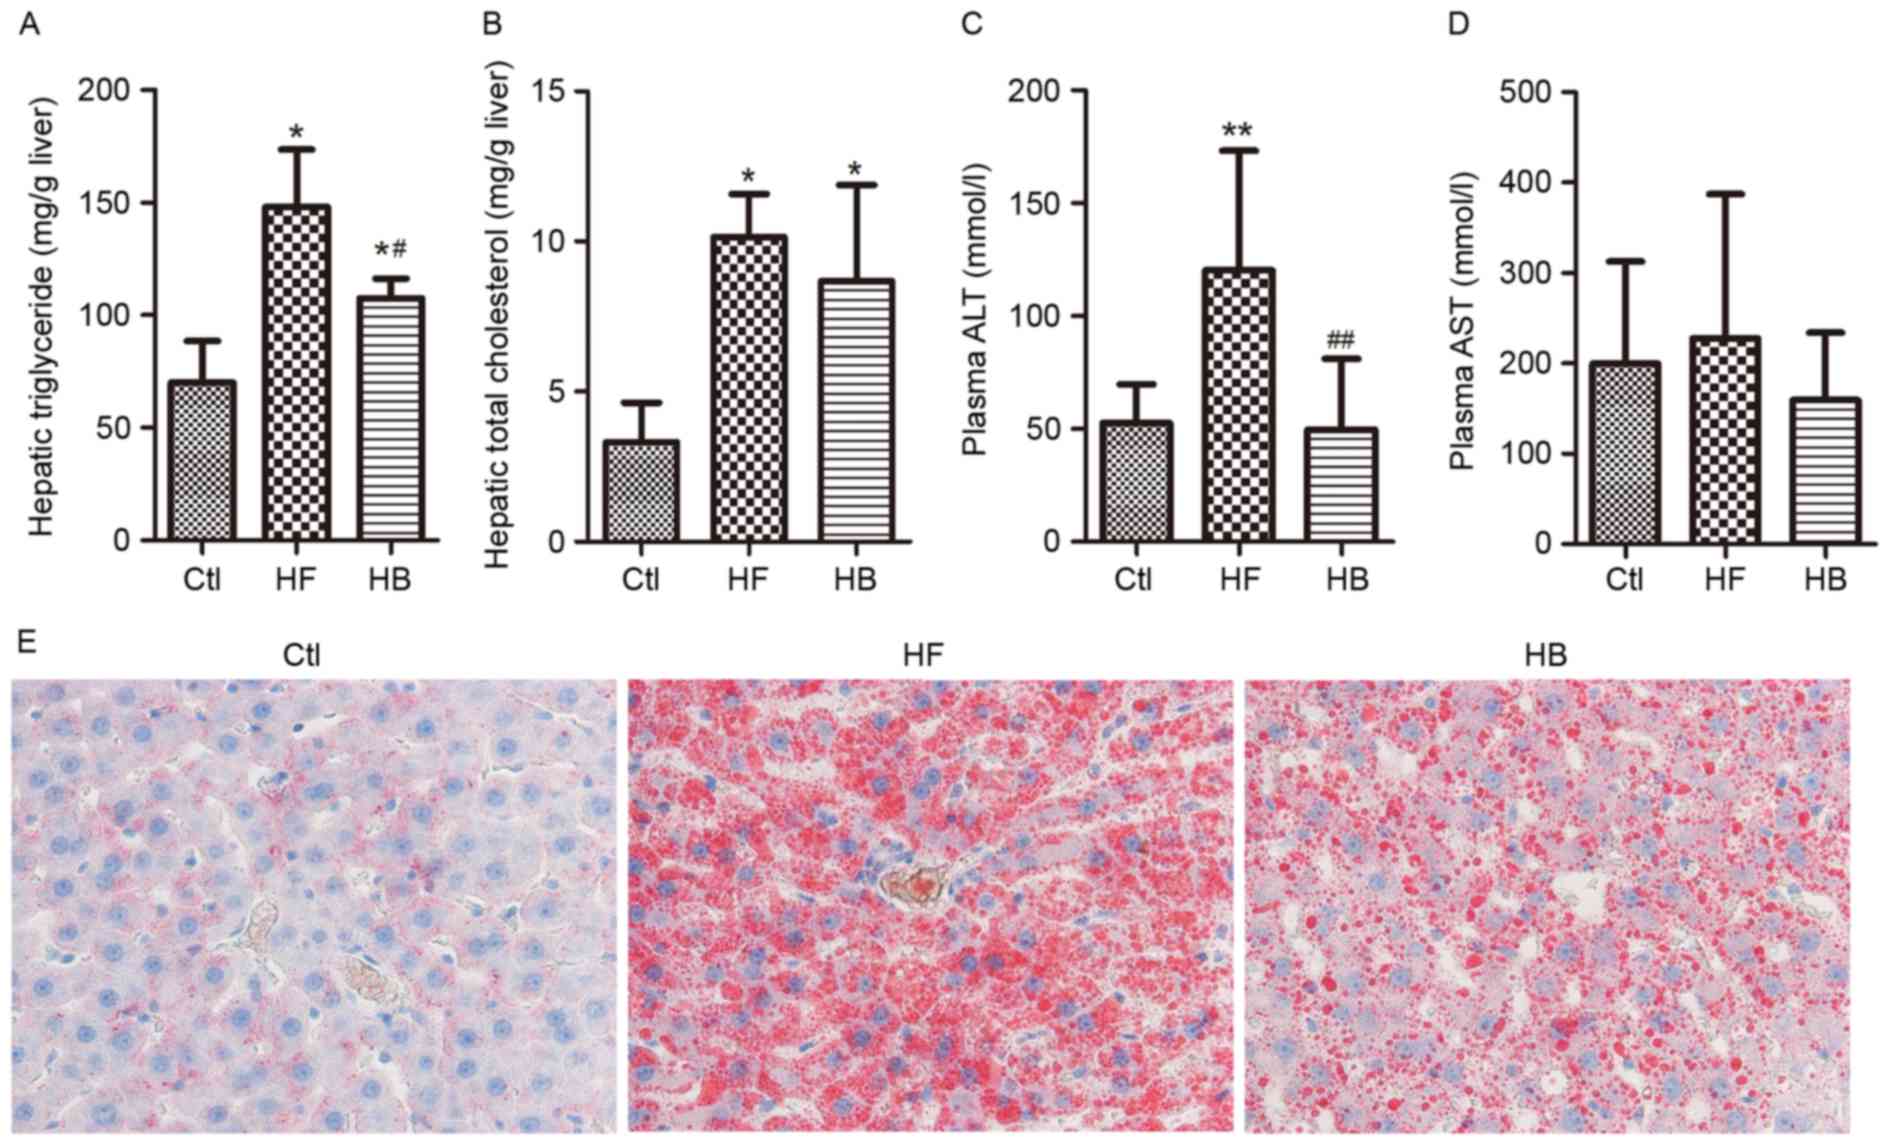
Berberine alleviates HFD-induced
hepatic steatosis and injury
Hepatic steatosis was evaluated by measuring hepatic
triglyceride contents via Oil Red O staining, whereas hepatic
injury was evaluated by measuring circulating liver enzyme levels.
Rats maintained on a HFD developed hepatic steatosis and injury, as
reflected by the significantly increased hepatic triglyceride
contents and ALT levels (Fig.
2A-D). Furthermore, Oil Red O staining demonstrated that large
lipid droplets accumulated in the liver of HFD-fed rats (Fig. 2E). Berberine supplementation
significantly decreased plasma ALT levels however, it did not
affect aspartate aminotransferase levels when compared with
untreated HFD-fed rats (Fig. 2C and
D). A marked decrease in the amount of Oil Red O-stained lipid
droplets in the berberine-treated group was also observed (Fig. 2E). These results suggested that
HFD-induced hepatic steatosis and injury may be significantly
alleviated by berberine.
Berberine reduces endotoxemia and
visceral adipose tissue inflammation in HFD-fed rats
LPS levels in portal plasma were significantly
higher in HFD-fed rats compared with control rats (Fig. 3A). Following treatment with
berberine for 6 weeks, LPS plasma levels in HFD-fed rats were
significantly reduced when compared with the untreated HFD-fed
rats; however, LPS levels in berberine-treated rats remained higher
than in control rats. With regards to inflammation and oxidative
stress in visceral adipose tissue, and their role in obesity and
insulin resistance, the following seven genes were investigated:
Tumor necrosis factor-α (TNF-α), interleukin-1β (IL-1β),
plasminogen activator inhibitor-1 (PAI-1), six transmembrane
protein of prostate-2 (STAMP-2), nicotinamide-adenine dinucleotide
phosphate oxidase (NADPHox), MCP-1 and EGF-like module-containing
mucin-like hormone receptor-like 1 (F4/80). In visceral adipose
tissue samples, the mRNA expression levels of these genes were
significantly increased in HFD-fed rats compared with in control
rats (Fig. 3B-H). Treatment with
berberine significantly reduced IL-1β, PAI-1, STAMP-2, NADPHox,
MCP-1 and F4/80 mRNA expression levels compared with in untreated
HFD-fed rats (Fig. 3C-H).
Berberine appeared to have no effect on TNF-α mRNA levels compared
with in untreated HFD-fed rats (Fig.
3B).
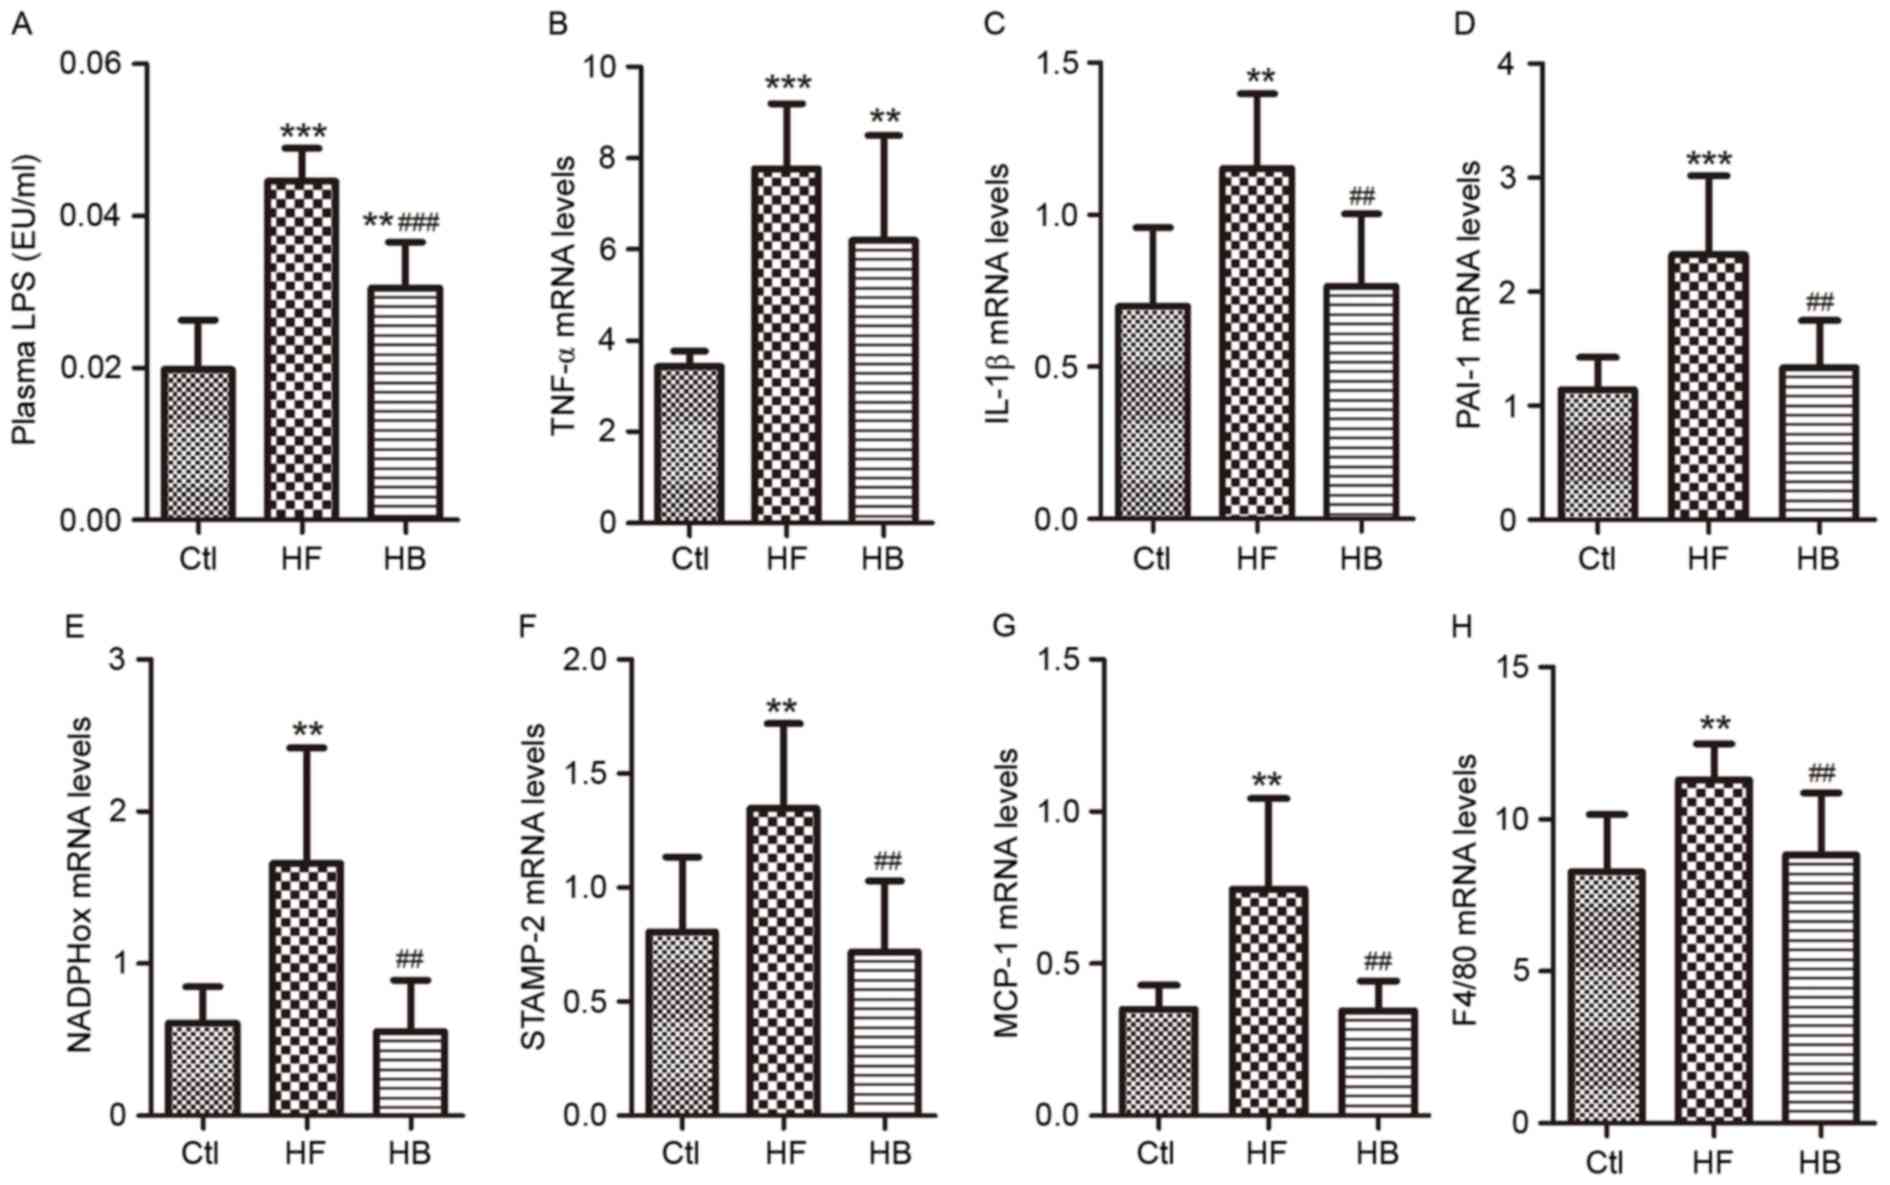 | Figure 3.Berberine reduced endotoxemia and
visceral adipose tissue inflammation in HFD-fed rats. (A) Portal
plasma LPS concentrations. (B) TNF-α mRNA expression levels. (C)
IL-1β mRNA expression levels. (D) PAI-1 mRNA expression levels. (E)
NADPHox mRNA expression levels. (F) STAMP-2 mRNA expression levels.
(G) MCP-1 mRNA expression levels. (H) F4/80 mRNA expression levels.
Data are expressed as the mean ± standard deviation. **P<0.01,
***P<0.001 compared with the Ctl group; ##P<0.01,
###P<0.001 compared with the HF group. Ctl, normal
diet; HF, HFD; HB, HFD supplemented with berberine for 6 weeks;
HFD, high-fat diet; LPS, lipopolysaccharide; EU, endotoxin unit;
TNF, tumor necrosis factor; IL, interleukin; PAI-1, plasminogen
activator inhibitor-1; NADPHox, nicotinamide-adenine dinucleotide
phosphate oxidase; STAMP-2, six transmembrane protein of
prostate-2; MCP-1, monocyte chemotactic protein-1; F4/80, EGF-like
module-containing mucin-like hormone receptor-like 1. |
To explore whether endotoxemia affected inflammatory
processes in visceral adipose tissue, the correlation between LPS
plasma levels and TNF-α, IL-1β, PAI-1, STAMP-2, NADPHox, MCP-1 and
F4/80 mRNA expression levels was investigated. The present results
indicated that LPS portal plasma levels were positively correlated
with the mRNA expression levels of TNFα, IL-1β, PAI-1, NADPHox,
STAMP2, MCP-1 and F4/80 in visceral adipose tissue (Fig. 4A-G). These multiple correlations
suggested that gut microbiota and endotoxemia may synergistically
contribute to inflammation, oxidative stress and macrophage
infiltration in HFD-fed rats.
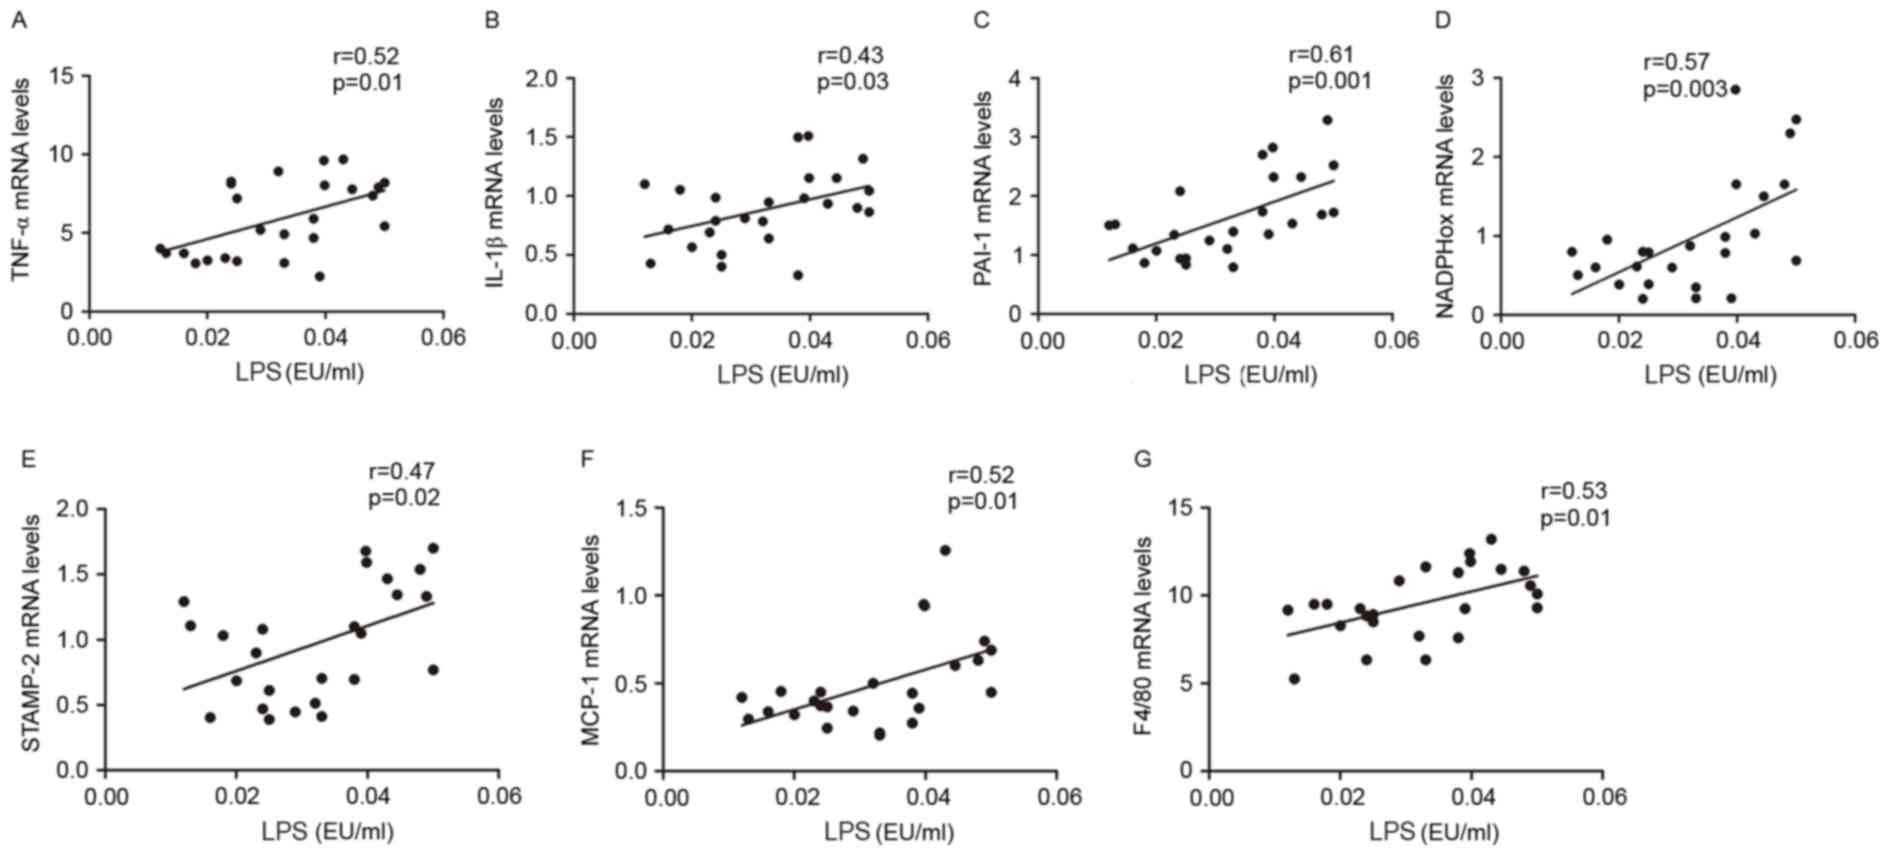 | Figure 4.Metabolic endotoxemia was positively
correlated with inflammation, oxidative stress and macrophage
infiltration markers. Correlation between: Portal plasma LPS level
and (A) TNF-α, (B) IL-1β, (C) PAI-1, (D) NADPHox, (E) STAMP-2, (F)
MCP-1 and (G) F4/80 mRNA levels in visceral adipose tissue of Ctl,
HF and HB rats. The inset corresponds to Pearson's correlation and
corresponding P-value. Ctl, normal diet; HF, HFD; HB, HFD
supplemented with berberine for 6 weeks; HFD, high-fat diet; LPS,
lipopolysaccharide; TNF, tumor necrosis factor; IL, interleukin;
PAI-1, plasminogen activator inhibitor-1; NADPHox,
nicotinamide-adenine dinucleotide phosphate oxidase; STAMP-2, six
transmembrane protein of prostate-2; MCP-1, monocyte chemotactic
protein-1; F4/80, EGF-like module-containing mucin-like hormone
receptor-like 1; EU, endotoxin unit. |
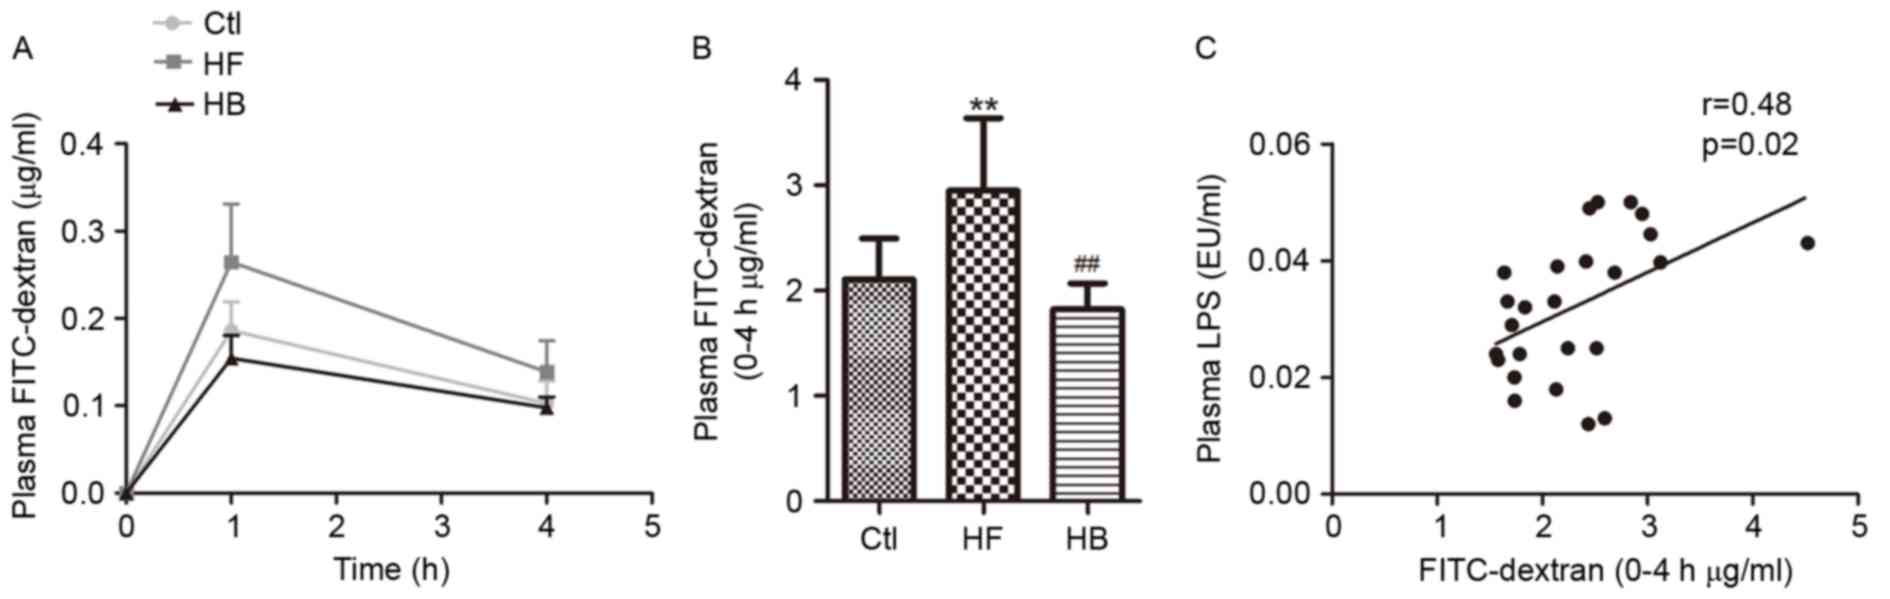
Berberine reduces intestinal
permeability and ameliorates the expression and distribution of
tight junction proteins in HFD-fed rats
To investigate whether endotoxemia could exert an
effect on intestinal permeability, the plasma concentration of
FITC-dextran was examined. In accordance with the changes in plasma
LPS levels, a marked increase in plasma FITC-dextran area under the
curve was observed in HFD-fed rats compared with in the control
rats (Fig. 5A). Treatment with
berberine significantly reduced plasma FITC-dextran concentration
in the HFD-fed rats compared with in untreated rats (Fig. 5A and B). Furthermore, portal plasma
LPS levels appeared to be positively correlated with plasma
FITC-dextran concentration (Fig.
5C). These findings suggested that berberine may reduce
HFD-induced endotoxemia, through interfering with the control of
intestinal permeability.
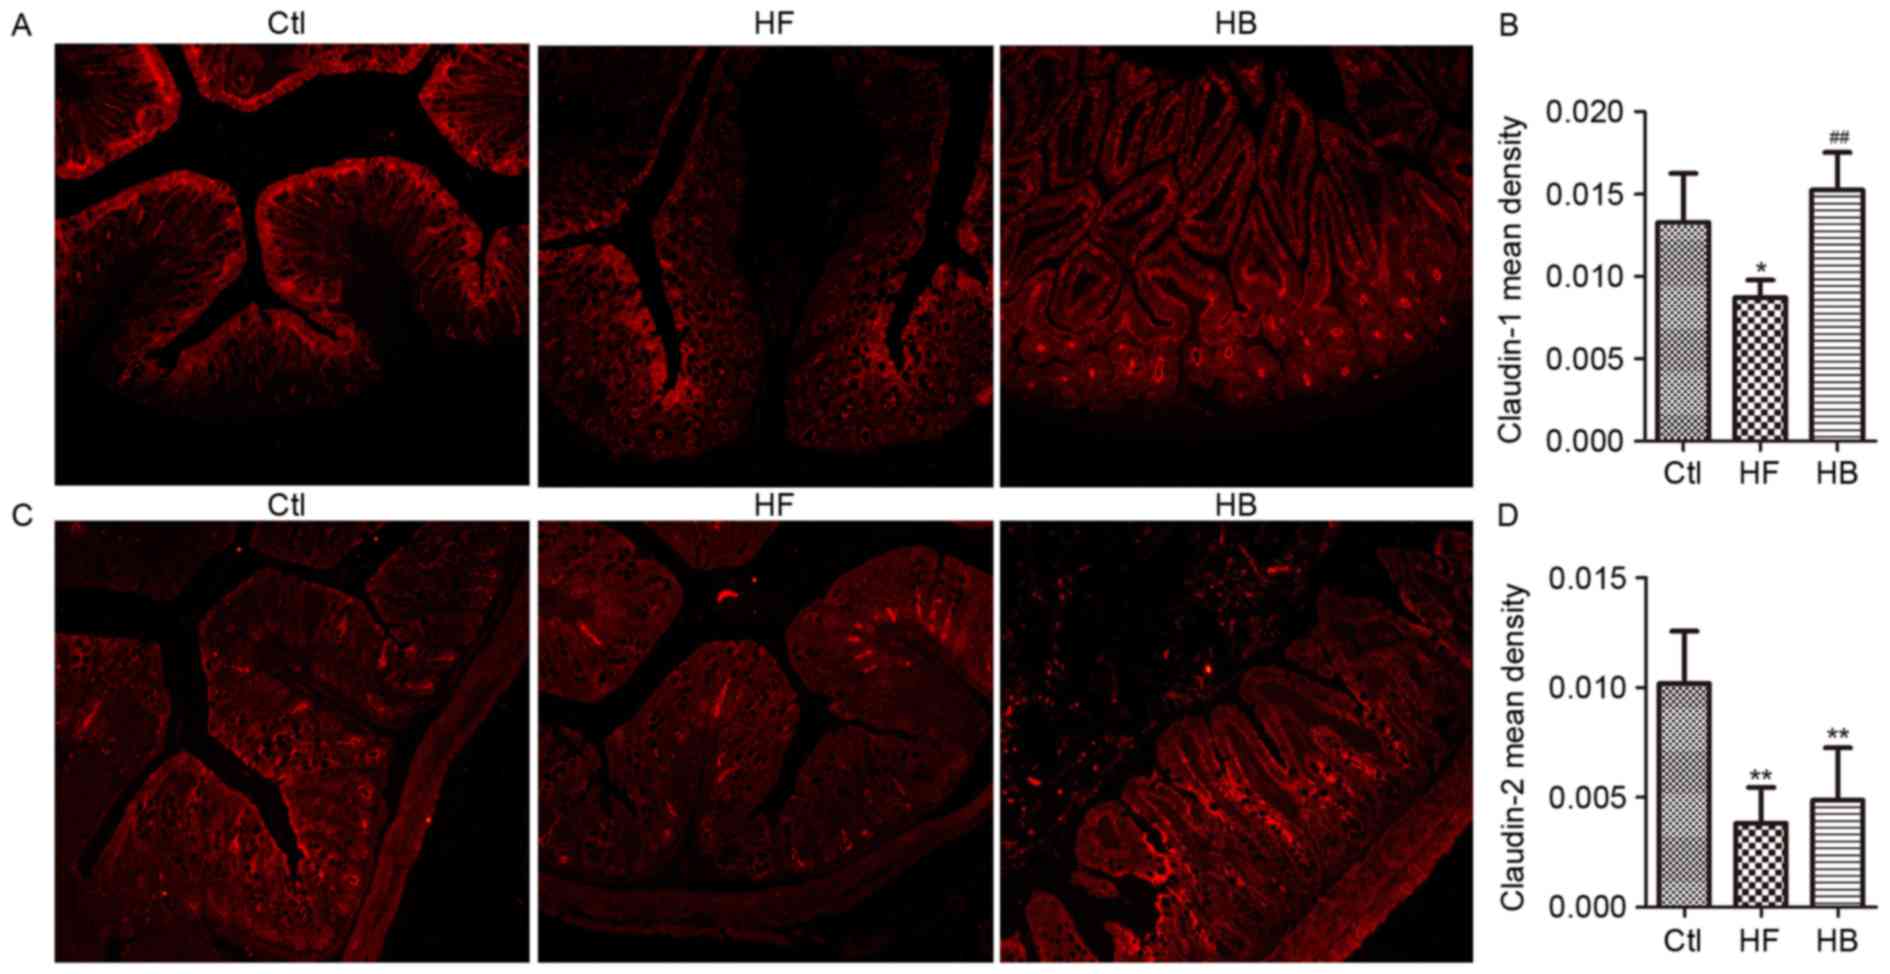
Tight junction proteins control paracellular
permeability. In the present study, the effect of berberine on the
expression and distribution of candidate tight junction proteins,
including claudin-1, claudin-2, zonula occludens-1 (ZO-1) and
occludin, was investigated using RT-qPCR and immunofluorescence.
Claudin-1, claudin-2, ZO-1 and occludin mRNA expression levels in
the proximal colon segments from HFD-fed rats were significantly
decreased, as compared with rats in the control group. Treatment
with berberine appeared to restore claudin-1 and ZO-1 mRNA
expression levels, however, it had no significant effect on
claudin-2 and occludin mRNA expression levels (Fig. 6A-D).
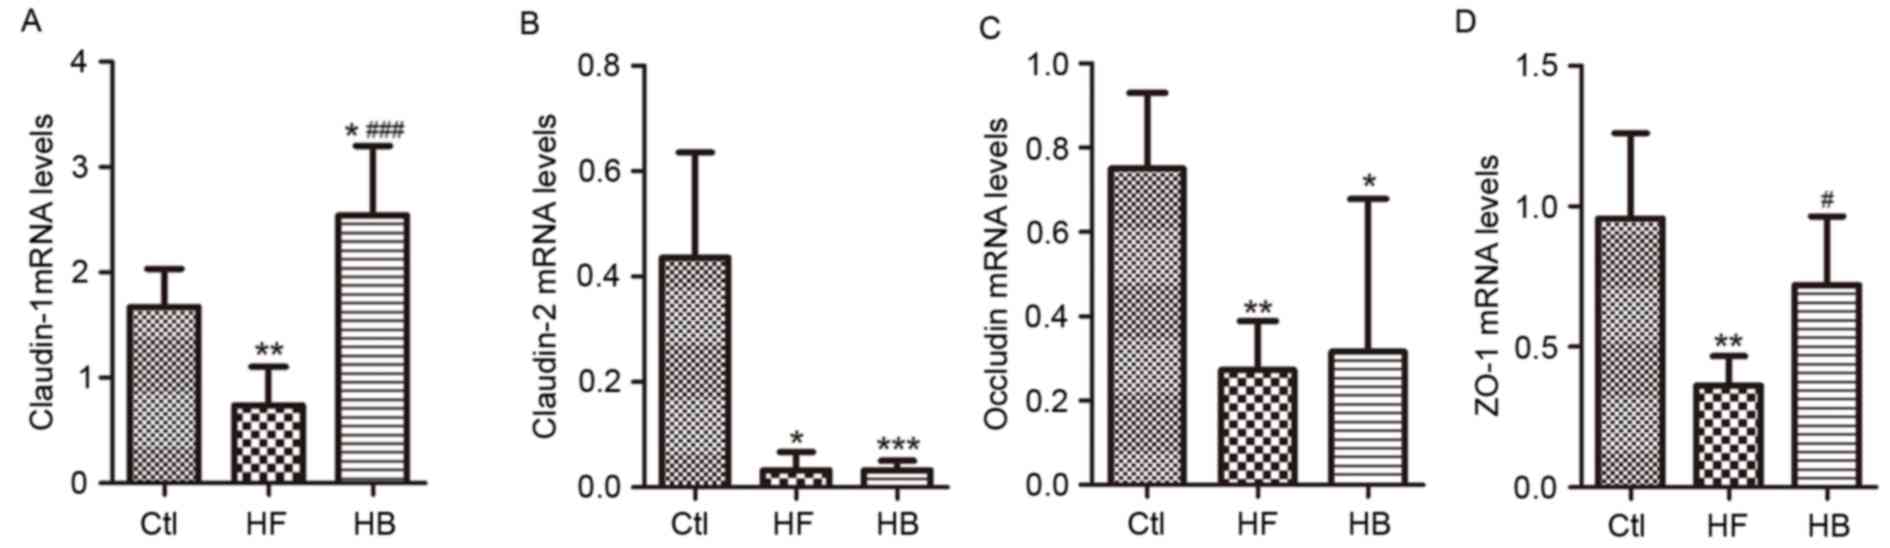 | Figure 6.Berberine restored the expression of
tight junction proteins in HFD-fed rats. mRNA expression levels of
colonic epithelial tight junction proteins (A) claudin-1, (B)
claudin-2, (C) occludin and (D) ZO-1. Data are expressed as the
mean ± standard deviation. *P<0.05, **P<0.01, ***P<0.001
compared with the Ctl group; #P<0.05,
###P<0.001 compared with the HF group. Ctl, normal
diet; HF, HFD; HB, HFD supplemented with berberine for 6 weeks;
HFD, high-fat diet; ZO-1, zonula occludens-1. |
As shown in Fig. 7,
immunofluorescence revealed that the tight junction proteins
claudin-1 and claudin-2 are normally distributed along the
epithelial sheet from the crypt to the villous, and the staining
for both proteins appeared continuous and dense. Conversely, in
HFD-fed rats, the staining revealed a translocation of claudin-1
and claudin-2 from the tight junction to the luminal side of the
crypt. Tissue from berberine-treated rats exhibited strong
claudin-1 and claudin-2 staining in the villous surface, similar to
the control group (Fig. 7A and C).
These observations suggested that berberine treatment may attenuate
the HFD-induced redistribution of claudin-1 and claudin-2.
Furthermore, in accordance with the mRNA analysis results, the
immunohistochemical staining scores (quantified by v.6 Image-Pro
Plus software) for claudin-1 protein appeared significantly higher
in berberine-treated rats compared with in untreated HFD-fed rats
(Fig. 7B and D).
Berberine modulates intestinal hormone
levels in portal plasma
Levels of the intestinal hormones GLP-1, GLP-2, PP
and PYY appeared to be significantly reduced, whereas GIP levels
were significantly increased in portal plasma samples of HFD-fed
rats. Treatment with berberine restored the concentrations of
GLP-1, GLP-2, PYY and GIP to those of the control rats (Fig. 8A-C). Furthermore, berberine almost
doubled the portal plasma GLP-1 and GLP-2 levels as compared with
HFD-fed rats. Berberine supplementation increased PP plasma levels
significantly (Fig. 8C). In
addition, berberine-treated rats exhibited a 3-fold increase in
proglucagon mRNA expression levels and in the number of
GLP-1-positive L-cells in the proximal colon compared with HFD-fed
untreated rats (Fig. 8D and
E).
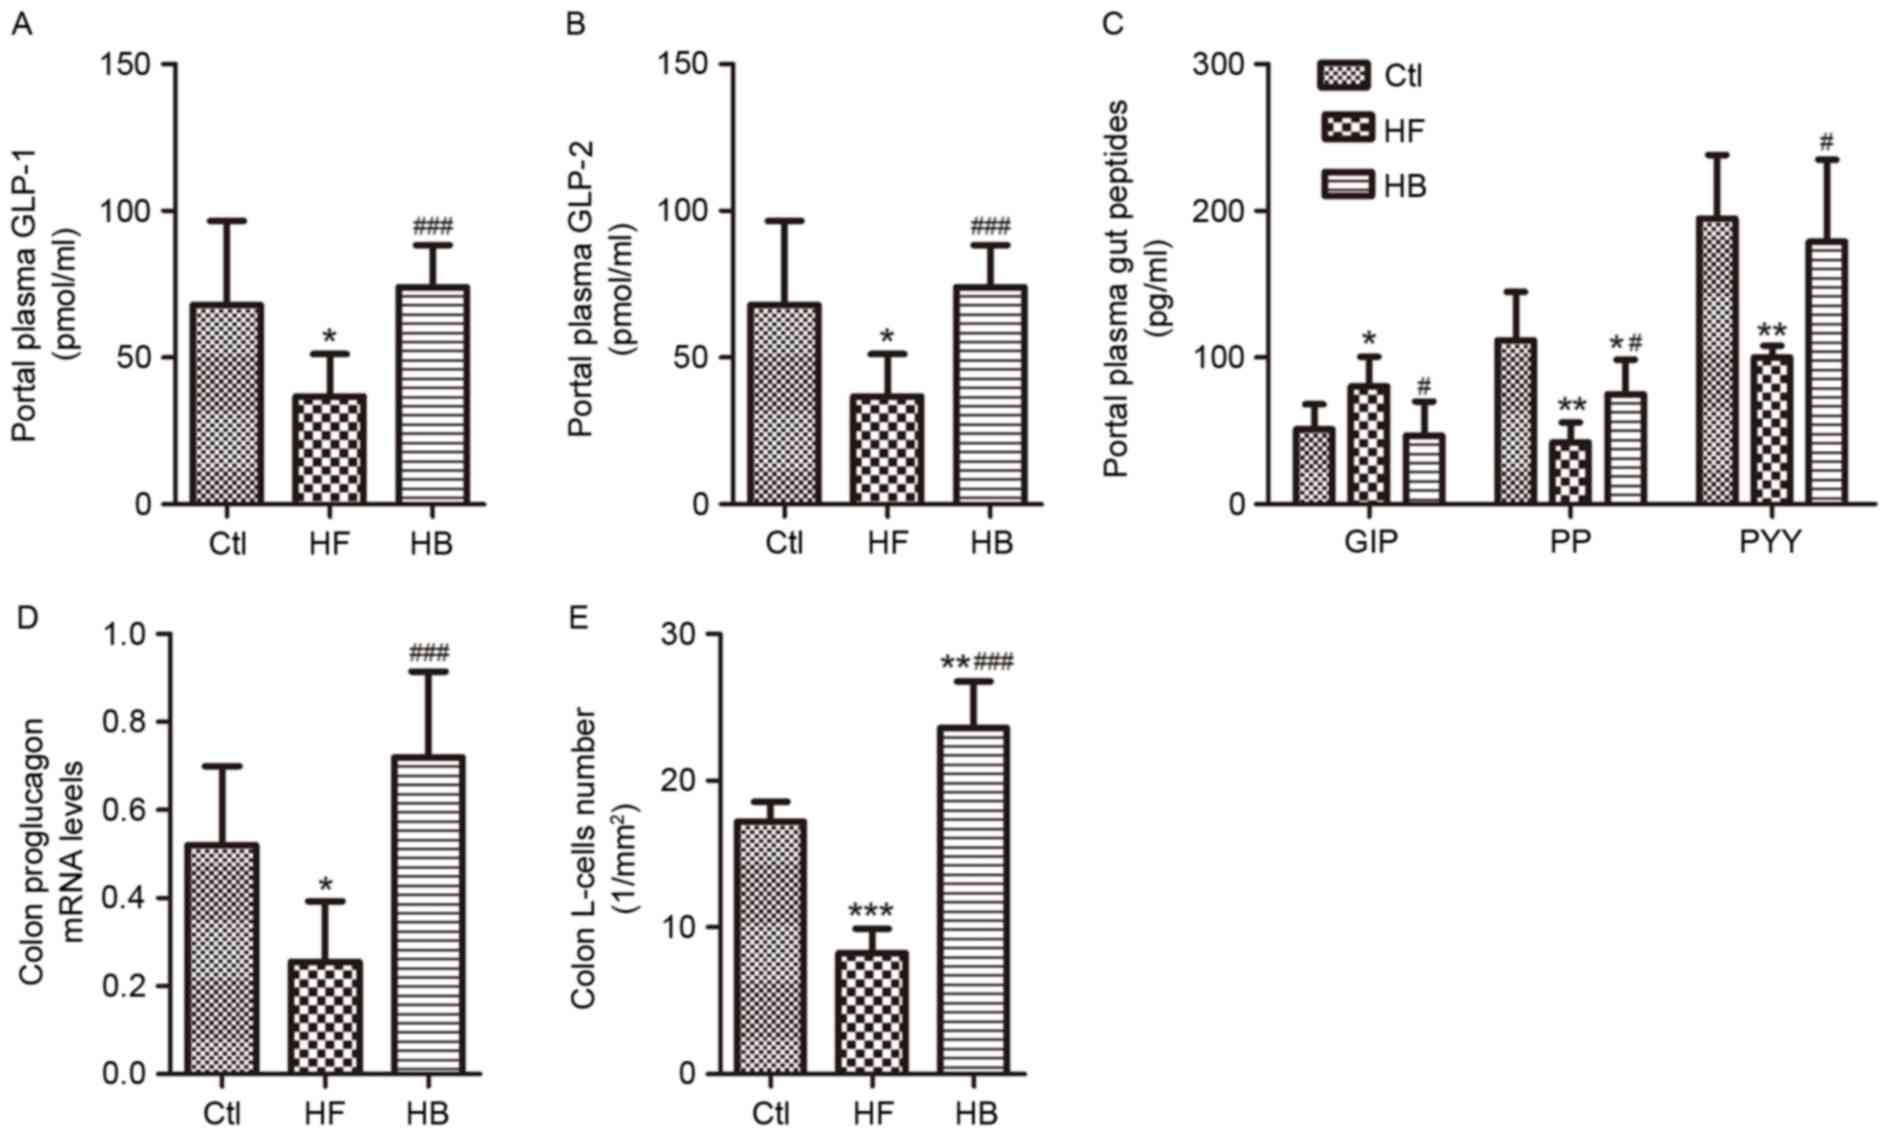 | Figure 8.Berberine modulated intestinal
hormone levels in portal plasma of HFD-fed rats. (A) Portal plasma
GLP-1 levels. (B) Portal plasma GLP-2 levels. (C) Portal plasma
GIP, PP and PYY levels. (D) Colonic proglucagon mRNA expression
levels. (E) Colonic L-cell numbers. Data are expressed as the mean
± standard deviation. *P<0.05, **P<0.01, ***P<0.001
compared with the Ctl group; #P<0.05,
###P<0.001 compared with the HF group. Ctl, normal
diet; HF, HFD; HB, HFD supplemented with berberine for 6 weeks;
HFD, high-fat diet; GLP, glucagon-like peptide; GIP, gastric
inhibitory polypeptide; PP, pancreatic polypeptide; PYY, peptide
YY. |
Berberine alters the composition of
the gut microbiome
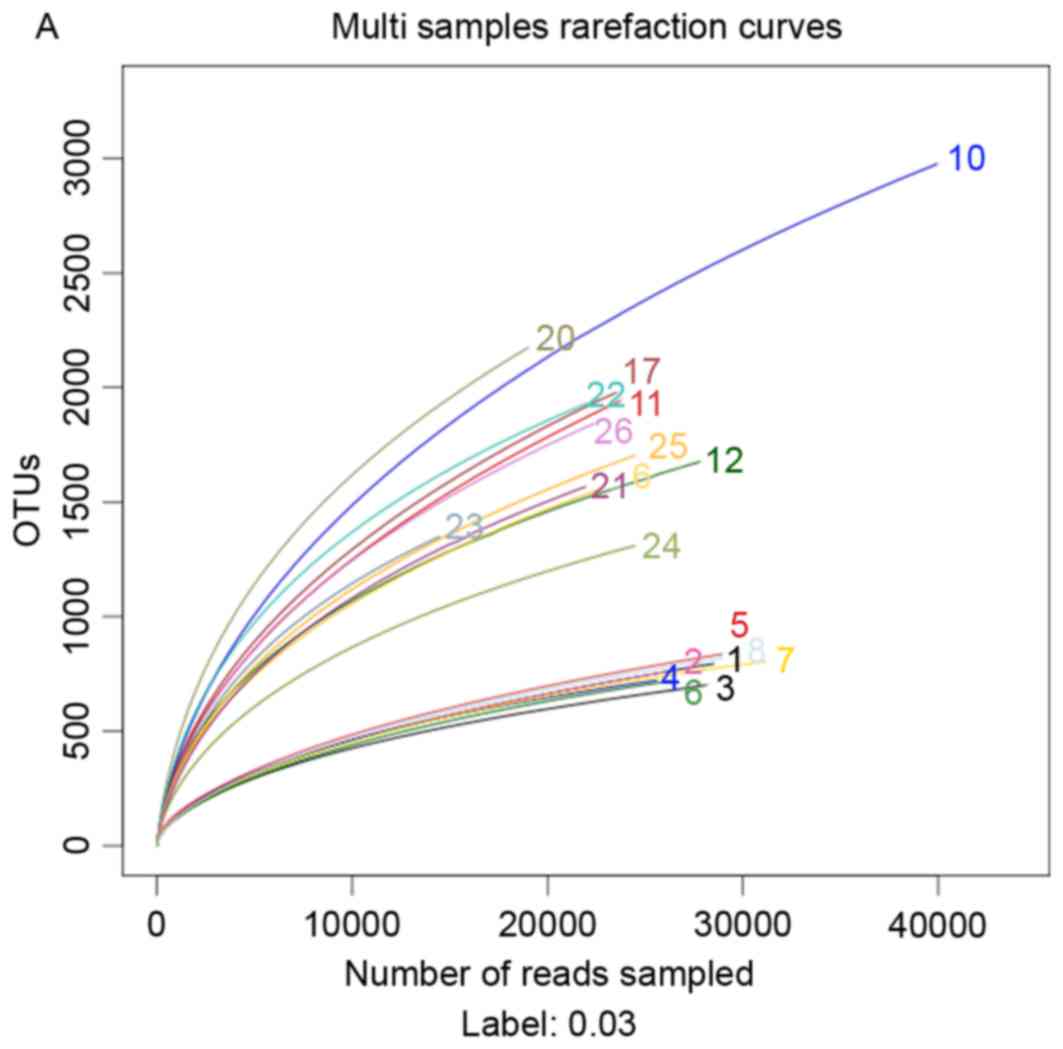
In order to investigate the effects of a HFD and
berberine intake on the composition of the gut microbiome, 454
pyrosequencing of the bacterial 16S rRNA gene V1-V3 region was
performed. A total of 602,852 usable reads (119,071 unique
sequences) obtained from 20 samples were delineated into 10,385
operational taxonomic units (OTUs) at the 97% similarity level.
Rarefaction curves indicated that most of the diversity of each
microbial group was successfully sampled (Fig. 9A). Berberine supplementation
appeared to cause a significant reduction in the richness of the
gut microbiota, as compared with HFD-fed untreated rats, which was
confirmed by Ace and Chao estimators (Table II). Berberine treatment also
appeared to significantly reduce the diversity of the gut
microbiota, which was confirmed by the Shannon and Simpson indices
(Table II).
| Table II.Community richness and diversity
estimator. |
Table II.
Community richness and diversity
estimator.
| Sample
IDa | Readsb | OTU numbers | Ace | Chao | Coverage | Shannon | Simpson |
|---|
| HB group |
|
|
|
|
|
|
|
|
1 | 28,506 | 794 | 1,932 | 1,493 | 0.986038 | 3.45 | 0.0915 |
|
2 | 26,026 | 759 | 2,039 | 1,394 | 0.985361 | 4.07 | 0.0376 |
|
3 | 27,962 | 697 | 1,462 | 1,234 | 0.988556 | 3.12 | 0.1485 |
|
4 | 25,582 | 721 | 1,385 | 1,145 | 0.987726 | 3.32 | 0.1273 |
|
5 | 28,941 | 836 | 1,867 | 1,406 | 0.986179 | 3.5 | 0.1033 |
|
6 | 26,300 | 719 | 1,560 | 1,153 | 0.987262 | 3.36 | 0.1037 |
|
7 | 31,163 | 805 | 1,636 | 1,310 | 0.988223 | 3.4 | 0.1044 |
|
8 | 28,936 | 819 | 1,795 | 1,354 | 0.986557 | 3.28 | 0.1215 |
| HF group |
|
|
|
|
|
|
|
| 10 | 39,945 | 2976 | 6,450 | 5,108 | 0.965578 | 5.71 | 0.0151 |
| 11 | 23,455 | 1931 | 4,621 | 3,464 | 0.959497 | 5.45 | 0.0173 |
| 12 | 27,799 | 1676 | 3,183 | 2,641 | 0.975143 | 5.47 | 0.0153 |
| 16 | 22,767 | 1558 | 3,283 | 2,577 | 0.969254 | 5.04 | 0.0389 |
| 17 | 23,426 | 1976 | 4,493 | 3,385 | 0.959959 | 5.59 | 0.012 |
| Ctl group |
|
|
|
|
|
|
|
| 20 | 19,005 | 2174 | 4,293 | 3,686 | 0.949277 | 6.2 | 0.0056 |
| 21 | 21,938 | 1567 | 3,157 | 2,568 | 0.968183 | 4.54 | 0.0821 |
| 22 | 22,005 | 1930 | 3,442 | 2,941 | 0.964281 | 5.7 | 0.0145 |
| 23 | 14,470 | 1349 | 2,441 | 2,039 | 0.960539 | 4.47 | 0.114 |
| 24 | 24,471 | 1310 | 2,556 | 2,186 | 0.976585 | 4.61 | 0.0424 |
| 25 | 24,497 | 1704 | 3,447 | 2,924 | 0.968813 | 5.16 | 0.0217 |
| 26 | 22,357 | 1842 | 3,873 | 3,162 | 0.961936 | 5.28 | 0.0218 |
A total of 10,119 OTUs (contributing to 98.8% of all
sequencing reads) were assigned to 19 phyla by Mothur analysis. The
most abundant phyla included Firmicutes (7,432 OTUs, 70.3%
of all reads), Bacteroidetes (1,044 OTUs, 10.4% of all
reads), Fusobacteria (457 OTUs, 8.2% of all reads),
Proteobacteria (509 OTUs, 6.1% of all reads) and
Actinobacteria (348 OTUs, 3.0% of all reads). As revealed by
taxon-based analysis, there was a significant decrease in the
abundance of the Actinobacteria phylum in the HFD-fed group
compared with in the control group, whereas no significant
differences were observed in the Firmicutes,
Bacteroidetes, Fusobacteria and Proteobacteria
phyla (Table III). Berberine
markedly altered the gut microbiota composition at the phylum
level, significantly increasing the abundance of
Fusobacteria and Proteobacteria, and decreasing the
abundance of Firmicutes and Actinobacteria (Table III). Berberine had no effect on
the abundance of the Bacteroidetes phylum. In addition, berberine
appeared to significantly affect the abundance of 59 genera
(Table III). Among these, 12
genera displayed a 10-fold increase, and 37 genera displayed a
10-fold decrease in average frequency, compared with the HFD group
rats. Furthermore, 37 genera were identified exclusively in
berberine-treated rats, whereas 18 genera were identified
exclusively in HFD-fed untreated animals.
| Table III.Differentially abundant features
analysis at the phylum or genus level. |
Table III.
Differentially abundant features
analysis at the phylum or genus level.
|
|
|
|
| P-value |
|---|
|
|
|
|
|
|
|---|
| Phylum/Genus | HB (%) mean ±
SD | HF (%) mean ±
SD | Ctl (%) mean ±
SD | HB vs. HF | HF vs. Ctl | HB vs. Ctl |
|---|
| Phylum |
|
|
|
|
|
|
|
Acidobacteria |
0.00135±0.00066 | 0.00293±0.0008 |
0.00199±0.00095 | 0.43870 | 0.71705 | 0.68879 |
|
Actinobacteria |
0.02004±0.00564 |
1.94705±0.72971 |
7.24482±2.45339 | 0.01408 | 0.04507 | 0.00631 |
|
Bacteroidetes |
11.37515±2.19301 |
14.64713±3.97861 |
7.62278±1.86003 | 0.51500 | 0.11850 | 0.18400 |
|
TM7 | 0.00182±0.0012 |
0.18116±0.09689 | 1.89118±0.6578 | 0.06685 | 0.01307 | 0.00685 |
|
Chloroflexi |
0.00043±0.00043 | 0±0 |
0.00058±0.00058 | 1.00000 | 1.00000 | 1.00000 |
|
Cyanobacteria |
0.00095±0.00095 |
0.08708±0.06498 |
0.06448±0.02119 | 0.20177 | 0.74114 | 0.00562 |
|
Deferribacteres | 0±0 |
0.00314±0.00194 |
0.00756±0.00683 | 0.02102 | 0.57029 | 0.25377 |
|
Deinococcus-Thermus |
0.00137±0.00095 |
0.00085±0.00085 |
0.00065±0.00065 | 1.00000 | 1.00000 | 1.00000 |
|
Elusimicrobia | 0±0 |
0.00207±0.00089 |
0.00232±0.00114 | 0.05521 | 1.00000 | 0.06384 |
|
Firmicutes |
34.07855±3.97821 |
79.44588±4.13566 |
79.69249±2.76575 | 0.00000 | 0.89414 | 0.00000 |
|
Fusobacteria |
40.28194±4.39043 |
0.12066±0.05127 | 0.0163±0.00883 | 0.00000 | 0.05379 | 0.00000 |
|
Gemmatimonadetes |
0.00095±0.00095 | 0±0 |
0.00058±0.00058 | 0.52842 | 1.00000 | 1.00000 |
|
Lentisphaerae | 0±0 |
0.00968±0.00386 |
0.00389±0.00251 | 0.01669 | 0.22271 | 0.00408 |
|
Nitrospirae | 0±0 |
0.00072±0.00072 | 0±0 | 0.38079 | 0.48016 | 1.00000 |
|
Planctomycetes |
0.00044±0.00044 |
0.00157±0.00097 | 0±0 | 0.56199 | 0.23056 | 1.00000 |
|
Proteobacteria |
11.05874±1.14416 |
2.45033±0.51587 |
2.29854±0.57357 | 0.00000 | 0.81821 | 0.00000 |
|
Spirochaetes | 0.0013±0.0013 |
0.89612±0.16617 |
0.20734±0.11901 | 0.00015 | 0.00286 | 0.07762 |
|
Tenericutes | 0.013±0.01151 |
0.12251±0.08587 |
0.88127±0.36557 | 0.22892 | 0.05143 | 0.02031 |
|
Verrucomicrobia |
3.14836±1.01832 |
0.00072±0.00072 |
0.00646±0.00424 | 0.00469 | 0.19707 | 0.00492 |
| Genus |
|
|
|
|
|
|
|
Acetanaerobacterium |
0.00595±0.00473 | 0±0 | 0±0 | 0.22569 | 1.00000 | 0.22139 |
|
Acetobacteraceae_uncultured | 0±0 | 0±0 |
0.00065±0.00065 | 1.00000 | 1.00000 | 0.39968 |
|
Acholeplasma | 0±0 | 0±0 |
0.00117±0.00117 | 1.00000 | 0.50079 | 0.15974 |
|
Acidobacteriaceae_uncultured | 0±0 | 0±0 |
0.00075±0.00075 | 1.00000 | 1.00000 | 0.39968 |
|
Acidothermus | 0±0 |
0.00072±0.00072 | 0±0 | 0.38079 | 0.48016 | 1.00000 |
|
Acidovorax |
0.00048±0.00048 | 0±0 |
0.00058±0.00058 | 1.00000 | 1.00000 | 1.00000 |
|
Acinetobacter |
0.00179±0.00133 | 0±0 | 0±0 | 0.30479 | 1.00000 | 0.15540 |
|
Actinomyces |
0.00315±0.00127 |
0.01949±0.01252 |
0.00564±0.00313 | 0.21147 | 0.30068 | 0.55334 |
|
Adlercreutzia | 0±0 |
0.00562±0.00501 |
0.03181±0.00825 | 0.29136 | 0.01312 | 0.00060 |
|
Aeribacillus |
0.00086±0.00086 |
0.00088±0.00088 | 0±0 | 1.00000 | 0.48016 | 0.52013 |
|
Aerococcaceae_uncultured |
0.00044±0.00044 | 0±0 | 0±0 | 1.00000 | 1.00000 | 1.00000 |
|
Aerococcus | 0±0 |
0.00088±0.00088 | 0±0 | 0.38079 | 0.48016 | 1.00000 |
|
Agrococcus |
0.00043±0.00043 | 0±0 | 0±0 | 1.00000 | 1.00000 | 1.00000 |
|
Akkermansia |
3.14836±1.01832 | 0±0 |
0.00447±0.00447 | 0.00472 | 0.34499 | 0.00353 |
|
Alcaligenes | 0±0 |
0.00288±0.00288 | 0±0 | 0.02102 | 0.05316 | 1.00000 |
|
Alistipes | 0±0 |
0.00423±0.00266 |
0.02031±0.00915 | 0.12302 | 0.10822 | 0.03099 |
|
Allobaculum |
0.00311±0.00079 |
10.84206±3.94134 | 8.82073±2.9406 | 0.01252 | 0.74820 | 0.00424 |
|
Anaerobiospirillum |
0.00049±0.00049 |
0.00088±0.00088 |
0.46779±0.17407 | 1.00000 | 0.01388 | 0.00936 |
|
Anaerofilum |
2.30376±0.73263 |
0.05499±0.02737 | 0.0219±0.01234 | 0.00482 | 0.28611 | 0.00332 |
|
Anaerofustis | 0±0 |
0.01313±0.01103 | 0.0104±0.00328 | 0.26065 | 0.84805 | 0.00274 |
|
Anaerolineaceae_uncultured | 0±0 | 0±0 |
0.00058±0.00058 | 1.00000 | 1.00000 | 0.39968 |
|
Anaerostipes |
1.29186±0.40432 |
0.04986±0.02226 |
0.01231±0.01159 | 0.00484 | 0.14894 | 0.00282 |
|
Anaerotruncus |
0.77713±0.36482 |
1.53538±0.27758 |
0.81297±0.35685 | 0.10951 | 0.12560 | 0.94840 |
|
Anaerovibrio |
1.03718±0.22773 |
1.00465±0.37017 |
0.78444±0.45957 | 0.93799 | 0.77328 | 0.70861 |
|
Anaerovorax | 0±0 |
0.01789±0.00528 |
0.02409±0.00572 | 0.00299 | 0.51230 | 0.00026 |
|
Anoxybacillus |
0.00183±0.00095 |
0.00072±0.00072 |
0.00239±0.00176 | 0.65574 | 0.37696 | 0.72123 |
|
Aquabacterium |
0.00044±0.00044 | 0±0 | 0.0013±0.0013 | 1.00000 | 0.50079 | 0.56788 |
|
Arenimonas | 0±0 | 0±0 |
0.00065±0.00065 | 1.00000 | 1.00000 | 0.39968 |
|
Bacillus |
0.00438±0.00295 | 0±0 |
0.00129±0.00083 | 0.14862 | 0.50079 | 0.33974 |
|
Bacteroides |
11.32657±2.19329 |
2.86663±1.50674 |
0.50319±0.25937 | 0.00396 | 0.13701 | 0.00010 |
|
Barnesiella | 0±0 | 0±0 |
0.00064±0.00064 | 1.00000 | 1.00000 | 0.39968 |
|
Bifidobacterium | 0±0 |
0.00085±0.00085 | 0±0 | 0.38079 | 0.48016 | 1.00000 |
|
Bilophila |
0.79589±0.15162 |
0.00085±0.00085 |
0.00157±0.00106 | 0.00046 | 1.00000 | 0.00003 |
|
Blautia |
0.80417±0.24782 |
6.23756±1.76412 |
6.90259±2.62767 | 0.00509 | 0.86245 | 0.02394 |
|
Brachybacterium | 0±0 | 0±0 |
0.00197±0.00197 | 1.00000 | 0.50079 | 0.15974 |
|
Bradyrhizobium | 0±0 | 0±0 |
0.00065±0.00065 | 1.00000 | 1.00000 | 0.39968 |
|
Brevundimonas |
0.00216±0.00113 | 0±0 | 0±0 | 0.16413 | 1.00000 | 0.16476 |
|
Burkholderia |
0.01374±0.00306 |
0.00895±0.00321 |
0.00898±0.00396 | 0.31982 | 0.98550 | 0.42879 |
|
Butyricicoccus | 0±0 | 0±0 |
0.00058±0.00058 | 1.00000 | 1.00000 | 0.39968 |
|
Butyricimonas | 0±0 |
0.00602±0.00423 |
0.00075±0.00075 | 0.16249 | 0.23333 | 0.39968 |
|
Candidatus_Arthromitus | 0±0 | 0.0005±0.0005 |
0.00559±0.00411 | 0.38079 | 0.23120 | 0.18080 |
|
Candidatus_Chloracidobacterium |
0.00091±0.00059 |
0.00135±0.00087 | 0±0 | 0.63837 | 0.23056 | 0.52013 |
|
Candidatus_Solibacter | 0±0 | 0±0 |
0.00065±0.00065 | 1.00000 | 1.00000 | 0.39968 |
|
Caulobacter |
0.00044±0.00044 | 0±0 | 0±0 | 1.00000 | 1.00000 | 1.00000 |
|
Cellulosilyticum |
0.00048±0.00048 | 0±0 | 0±0 | 1.00000 | 1.00000 | 1.00000 |
|
Christensenellaceae_uncultured | 0±0 | 0.50197±0.122 |
1.05035±0.29907 | 0.00139 | 0.10517 | 0.00119 |
|
Christensenella | 0±0 |
0.00765±0.00241 |
0.07967±0.01597 | 0.00398 | 0.00051 | 0.00007 |
|
Chryseobacterium |
0.00136±0.00066 | 0±0 | 0±0 | 0.29263 | 1.00000 | 0.28019 |
|
Clostridium | 1.0162±0.90173 |
0.00465±0.00191 | 0.0035±0.00288 | 0.29069 | 0.79322 | 0.27462 |
|
Collinsella | 0±0 |
1.75193±0.70971 |
6.94762±2.43052 | 0.02134 | 0.05349 | 0.00609 |
|
Comamonas |
0.00588±0.00213 |
0.00229±0.00148 |
0.00369±0.00194 | 0.18018 | 0.51090 | 0.54084 |
|
Coprococcus |
0.00187±0.00101 |
0.34846±0.07673 |
0.44409±0.23277 | 0.00092 | 0.76015 | 0.06288 |
|
Coriobacteriaceae_uncultured |
0.00044±0.00044 |
0.07323±0.01542 |
0.07895±0.02065 | 0.00080 | 0.85713 | 0.00067 |
|
Corynebacterium | 0±0 |
0.00751±0.00291 |
0.00305±0.00119 | 0.01717 | 0.17098 | 0.01020 |
|
Deinococcus |
0.00137±0.00095 |
0.00085±0.00085 |
0.00065±0.00065 | 1.00000 | 1.00000 | 1.00000 |
|
Delftia |
0.02537±0.00587 |
0.00866±0.00411 |
0.01068±0.00254 | 0.02783 | 0.74368 | 0.02491 |
|
Desemzia |
0.00048±0.00048 | 0±0 | 0±0 | 1.00000 | 1.00000 | 1.00000 |
|
Desulfovibrio | 0.13322±0.0136 |
2.12679±0.44718 |
1.30345±0.47798 | 0.00099 | 0.22106 | 0.01686 |
|
Devosia | 0.00092±0.0006 | 0±0 | 0±0 | 0.52842 | 1.00000 | 0.52013 |
|
Diaphorobacter |
0.00049±0.00049 | 0±0 |
0.00117±0.00117 | 1.00000 | 0.50079 | 0.56788 |
|
Elusimicrobium | 0±0 |
0.00207±0.00089 |
0.00232±0.00114 | 0.05521 | 1.00000 | 0.06384 |
|
Enhydrobacter |
0.00084±0.00055 | 0±0 | 0±0 | 0.52842 | 1.00000 | 0.52013 |
|
Enterococcus | 0.3229±0.06599 | 0.002±0.002 |
0.00649±0.00376 | 0.00075 | 0.31480 | 0.00011 |
|
Enterorhabdus |
0.00043±0.00043 |
0.01485±0.00579 | 0.07087±0.0206 | 0.02093 | 0.01589 | 0.00164 |
|
Epulopiscium | 0.1753±0.17421 |
0.00088±0.00088 | 0±0 | 0.36952 | 0.48016 | 0.34371 |
|
Erysipelothrix |
0.00096±0.00096 | 0±0 | 0±0 | 0.52842 | 1.00000 | 0.52013 |
|
Erysipelotrichaceae_Incertae_Sedis |
2.50531±0.39665 |
0.00672±0.00292 |
0.01301±0.00902 | 0.00017 | 0.58704 | 0.00002 |
|
Erysipelotrichaceae_uncultured | 0±0 |
0.00648±0.00587 |
0.01533±0.00785 | 0.30366 | 0.45472 | 0.05456 |
|
Escherichia-Shigella |
0.35447±0.11707 |
0.02743±0.00973 | 0.32604±0.1537 | 0.01092 | 0.07005 | 0.90572 |
|
Faecalibacterium |
0.00173±0.00131 |
0.81438±0.32885 |
0.00058±0.00058 | 0.02116 | 0.02256 | 0.65440 |
|
Family_XIII_Incertae_Sedis_Incertae_Sedis | 0±0 |
0.10057±0.02552 |
0.20788±0.04714 | 0.00163 | 0.06129 | 0.00018 |
|
Family_XIII_Incertae_Sedis_uncultured | 0±0 |
0.36272±0.09627 |
0.21403±0.05279 | 0.00193 | 0.19001 | 0.00036 |
|
Ferruginibacter | 0.0008±0.0008 | 0±0 |
0.00058±0.00058 | 0.52842 | 1.00000 | 1.00000 |
|
Flavobacterium |
0.00096±0.00096 |
0.00264±0.00264 |
0.00058±0.00058 | 0.37584 | 0.35637 | 1.00000 |
|
Flavonifractor |
0.01386±0.01386 |
0.00451±0.00451 | 0.0693±0.05199 | 0.61083 | 0.22530 | 0.32534 |
|
Flexibacter |
0.00048±0.00048 | 0±0 | 0.0013±0.0013 | 1.00000 | 0.50079 | 0.56788 |
|
Fusobacterium |
40.17087±4.4684 |
0.03271±0.01065 |
0.01066±0.00678 | 0.00004 | 0.09584 | 0.00000 |
|
GKS98_freshwater_group |
0.00088±0.00088 | 0±0 | 0±0 | 0.52842 | 1.00000 | 0.52013 |
|
Gelria | 0±0 | 0.0005±0.0005 | 0±0 | 0.38079 | 0.48016 | 1.00000 |
|
Gemella |
0.00776±0.00299 |
0.16081±0.06141 |
0.00508±0.00187 | 0.02078 | 0.01988 | 0.53684 |
|
Gemmatimonadaceae_uncultured |
0.00095±0.00095 | 0±0 | 0±0 | 0.52842 | 1.00000 | 0.52013 |
|
Geobacillus |
0.00087±0.00057 | 0±0 | 0±0 | 0.52842 | 1.00000 | 0.52013 |
|
Globicatella | 0±0 | 0±0 |
0.00129±0.00083 | 1.00000 | 0.50079 | 0.15974 |
|
Granulicatella | 0±0 |
0.00088±0.00088 | 0±0 | 0.38079 | 0.48016 | 1.00000 |
|
Haliangium |
0.00048±0.00048 | 0±0 | 0±0 | 1.00000 | 1.00000 | 1.00000 |
|
Helicobacter |
0.07094±0.02612 |
0.03422±0.01028 | 0.01257±0.006 | 0.20991 | 0.08585 | 0.03429 |
|
Herbaspirillum | 0±0 |
0.00144±0.00144 | 0±0 | 0.14500 | 0.23056 | 1.00000 |
|
Holdemania | 0±0 |
0.06632±0.01785 | 0.09885±0.0582 | 0.00208 | 0.66766 | 0.09437 |
|
Hydrogenoanaero
bacterium | 0±0 | 0.0005±0.0005 | 0±0 | 0.38079 | 0.48016 | 1.00000 |
|
Hydrogenophaga | 0±0 |
0.00072±0.00072 |
0.00065±0.00065 | 0.38079 | 1.00000 | 0.39968 |
|
Iamia |
0.00048±0.00048 | 0±0 | 0±0 | 1.00000 | 1.00000 | 1.00000 |
|
Janthinobacterium | 0.0004±0.0004 | 0±0 | 0±0 | 1.00000 | 1.00000 | 1.00000 |
|
Jeotgalicoccus |
0.00044±0.00044 | 0±0 | 0±0 | 1.00000 | 1.00000 | 1.00000 |
|
Klebsiella |
2.78132±0.76059 | 0.0005±0.0005 |
0.00122±0.00079 | 0.00220 | 1.00000 | 0.00088 |
|
Kocuria |
0.00654±0.00483 | 0±0 | 0±0 | 0.19016 | 1.00000 | 0.18444 |
|
Lachnospiraceae_Incertae_Sedis |
3.56313±0.69197 |
1.58603±0.57302 |
1.85636±0.36867 | 0.03981 | 0.75605 | 0.03432 |
|
Lachnospiraceae_uncultured |
0.01129±0.00569 |
6.64096±2.13871 |
10.66917±3.4409 | 0.00469 | 0.39685 | 0.00338 |
|
Lachnospira | 0±0 |
0.00171±0.00171 | 0.0047±0.00389 | 0.14500 | 0.45570 | 0.01020 |
|
Lactobacillus |
0.69316±0.42232 |
3.77028±2.08403 |
16.53313±5.33947 | 0.15694 | 0.03801 | 0.00458 |
|
Lactococcus | 0.0058±0.00206 |
0.00072±0.00072 | 0±0 | 0.02900 | 0.48016 | 0.00690 |
|
Leifsonia | 0±0 | 0±0 |
0.00065±0.00065 | 1.00000 | 1.00000 | 0.39968 |
|
Leptolyngbya | 0±0 | 0±0 |
0.00254±0.00194 | 1.00000 | 0.12618 | 0.02552 |
|
Leptothrix |
0.00043±0.00043 | 0±0 | 0±0 | 1.00000 | 1.00000 | 1.00000 |
|
Leucobacter |
0.00044±0.00044 |
0.00088±0.00088 | 0±0 | 1.00000 | 0.48016 | 1.00000 |
|
Leuconostoc |
0.00314±0.00103 | 0±0 | 0±0 | 0.04928 | 1.00000 | 0.04686 |
|
Luteimonas | 0±0 | 0±0 |
0.00099±0.00099 | 1.00000 | 1.00000 | 0.39968 |
|
Lysobacter | 0±0 | 0±0 |
0.00058±0.00058 | 1.00000 | 1.00000 | 0.39968 |
|
Marmoricola |
0.00048±0.00048 | 0±0 | 0±0 | 1.00000 | 1.00000 | 1.00000 |
|
Marvinbryantia | 0±0 |
0.15705±0.04201 |
0.13174±0.03237 | 0.00203 | 0.70828 | 0.00033 |
|
Megamonas | 0±0 | 0±0 |
0.00058±0.00058 | 1.00000 | 1.00000 | 0.39968 |
|
Methylobacillus | 0±0 | 0±0 |
0.00065±0.00065 | 1.00000 | 1.00000 | 0.39968 |
|
Methylobacterium |
0.00084±0.00055 | 0±0 |
0.00117±0.00117 | 0.52842 | 0.50079 | 0.65412 |
|
Microbacterium | 0±0 |
0.00176±0.00176 | 0±0 | 0.14500 | 0.23056 | 1.00000 |
|
Micrococcus | 0.0004±0.0004 | 0±0 | 0±0 | 1.00000 | 1.00000 | 1.00000 |
|
Mogibacterium | 0±0 |
0.10606±0.02317 |
0.06192±0.03252 | 0.00090 | 0.28500 | 0.06173 |
|
Morganella |
0.63669±0.10501 |
0.00122±0.00077 | 0±0 | 0.00024 | 0.23056 | 0.00002 |
|
Mucilaginibacter | 0±0 | 0±0 | 0.0013±0.0013 | 1.00000 | 0.50079 | 0.15974 |
|
Mucispirillum | 0±0 |
0.00314±0.00194 |
0.00756±0.00683 | 0.02102 | 0.61466 | 0.28153 |
|
Mycobacterium |
0.00088±0.00058 | 0±0 | 0±0 | 0.52842 | 1.00000 | 0.52013 |
|
Mycoplasma | 0.013±0.01151 | 0±0 |
0.00075±0.00075 | 0.28651 | 1.00000 | 0.30851 |
|
Nesterenkonia | 0±0 | 0±0 |
0.00064±0.00064 | 1.00000 | 1.00000 | 0.39968 |
|
Nitrospiraceae_uncultured | 0±0 |
0.00072±0.00072 | 0±0 | 0.38079 | 0.48016 | 1.00000 |
|
Ochrobactrum |
0.01515±0.00334 |
0.00684±0.00496 |
0.00507±0.00217 | 0.17780 | 0.79573 | 0.01367 |
|
Odoribacter |
0.02862±0.01189 | 0.0005±0.0005 |
0.00304±0.00111 | 0.02645 | 0.37696 | 0.03689 |
|
Opitutus | 0±0 |
0.00072±0.00072 |
0.00198±0.00094 | 0.38079 | 0.62618 | 0.06384 |
|
Oscillibacter |
0.00134±0.00092 | 1.91854±0.4873 |
0.47583±0.15936 | 0.00169 | 0.01063 | 0.00438 |
|
Oscillospira |
0.00043±0.00043 | 0.1396±0.06182 | 0.05487±0.0542 | 0.03471 | 0.32838 | 0.34728 |
|
Ottowia | 0±0 | 0±0 |
0.00409±0.00409 | 1.00000 | 0.34499 | 0.35432 |
|
Oxalobacter | 0±0 |
0.04147±0.01443 | 0±0 | 0.00911 | 0.00915 | 1.00000 |
|
Paenisporosarcina | 0±0 | 0±0 |
0.00233±0.00233 | 1.00000 | 0.12618 | 0.02552 |
|
Papillibacter | 0±0 |
0.00885±0.00248 |
0.01761±0.00523 | 0.00235 | 0.14454 | 0.00181 |
|
Parabacteroides |
0.00087±0.00057 |
0.29747±0.10585 |
0.76933±0.24052 | 0.01072 | 0.08878 | 0.00256 |
|
Pasteurella | 0.0104±0.00628 |
0.00144±0.00144 |
0.00442±0.00327 | 0.17627 | 0.49073 | 0.49161 |
|
Paucimonas | 0±0 |
0.00072±0.00072 | 0±0 | 0.38079 | 0.48016 | 1.00000 |
|
Pelomonas |
0.00266±0.00114 | 0±0 |
0.00058±0.00058 | 0.08916 | 1.00000 | 0.25499 |
|
Peptococcaceae_uncultured | 0±0 |
0.11683±0.04023 |
0.05492±0.01607 | 0.00863 | 0.16894 | 0.00164 |
|
Peptococcus | 0±0 |
0.01105±0.00382 |
0.01071±0.00654 | 0.00879 | 0.96040 | 0.10656 |
|
Peptostreptococc
aceae_Incertae_Sedis |
9.05387±0.70459 |
0.05952±0.03087 |
0.11667±0.03346 | 0.00000 | 0.22173 | 0.00000 |
|
Peptostreptococcus |
0.00048±0.00048 | 0±0 | 0±0 | 1.00000 | 1.00000 | 1.00000 |
|
Phascolarcto
bacterium |
4.99382±0.69833 |
3.28502±1.54339 | 0.532±0.40397 | 0.36342 | 0.09938 | 0.00003 |
|
Phyllobacterium |
0.00188±0.00101 | 0±0 | 0±0 | 0.30479 | 1.00000 | 0.15540 |
|
Pir4_lineage |
0.00044±0.00044 | 0±0 | 0±0 | 1.00000 | 1.00000 | 1.00000 |
|
Prevotellaceae_uncultured | 0±0 |
0.64183±0.16969 | 0.9912±0.41729 | 0.00190 | 0.52234 | 0.02007 |
|
Prevotella |
0.00545±0.00269 |
1.28652±0.75418 | 0.93156±0.2499 | 0.10279 | 0.72772 | 0.00083 |
|
Propionibacterium |
0.00362±0.00157 | 0.004±0.00177 |
0.00122±0.00079 | 0.89485 | 0.16840 | 0.17603 |
|
Proteiniphilum | 0±0 | 0±0 |
0.00467±0.00467 | 1.00000 | 0.34499 | 0.35432 |
|
Proteus |
0.03882±0.00637 | 0±0 | 0±0 | 0.00021 | 1.00000 | 0.00002 |
|
Pseudomonas | 0±0 | 0±0 |
0.00376±0.00376 | 1.00000 | 0.06348 | 0.01020 |
|
Pseudorhodoferax | 0.0008±0.0008 | 0±0 | 0±0 | 0.52842 | 1.00000 | 0.52013 |
|
Pseudoxanthomonas |
0.00048±0.00048 | 0.002±0.002 | 0±0 | 0.07310 | 0.05316 | 1.00000 |
|
RC9_gut_group | 0±0 | 0.2138±0.0391 |
0.25933±0.08393 | 0.00037 | 0.69826 | 0.00352 |
|
Ramlibacter | 0±0 |
0.00216±0.00216 | 0±0 | 0.05521 | 0.11070 | 1.00000 |
|
Rhodobacteraceae_uncultured |
0.00044±0.00044 | 0±0 | 0±0 | 1.00000 | 1.00000 | 1.00000 |
|
Rhodococcus |
0.00048±0.00048 | 0±0 |
0.00058±0.00058 | 1.00000 | 1.00000 | 1.00000 |
|
Rhodocytophaga |
0.00086±0.00086 | 0±0 | 0±0 | 0.52842 | 1.00000 | 0.52013 |
|
Rikenella | 0±0 | 0±0 |
0.00175±0.00175 | 1.00000 | 0.25118 | 0.06384 |
|
Robinsoniella |
1.60965±0.60768 |
0.00171±0.00171 |
0.00075±0.00075 | 0.01464 | 0.61074 | 0.01013 |
|
Roseburia |
0.00043±0.00043 |
3.29178±0.50767 |
0.72816±0.24779 | 0.00015 | 0.00045 | 0.00493 |
|
Roseomonas | 0±0 | 0.0005±0.0005 | 0±0 | 0.38079 | 0.48016 | 1.00000 |
|
Rothia |
0.00083±0.00055 |
0.02233±0.00892 |
0.01708±0.00747 | 0.02418 | 0.72530 | 0.03511 |
|
Ruminococcaceae_Incertae_Sedis |
0.53333±0.18071 | 1.4356±0.21452 |
0.98897±0.17647 | 0.00379 | 0.12410 | 0.07627 |
|
Ruminococcaceae_uncultured | 1.58302±0.3162 |
13.47235±2.72614 |
8.78594±2.20227 | 0.00104 | 0.19671 | 0.00236 |
|
Ruminococcus | 0±0 |
0.40738±0.06601 | 0.70982±0.1478 | 0.00019 | 0.07870 | 0.00011 |
|
Saccharopolyspora |
0.00048±0.00048 | 0±0 | 0±0 | 1.00000 | 1.00000 | 1.00000 |
|
Salinicoccus | 0±0 | 0±0 |
0.00064±0.00064 | 1.00000 | 1.00000 | 0.39968 |
|
Saprospiraceae_uncultured | 0±0 |
0.00144±0.00144 | 0±0 | 0.14500 | 0.23056 | 1.00000 |
|
Selenomonas | 0±0 |
0.01814±0.01216 |
0.01602±0.00427 | 0.14733 | 0.88951 | 0.00082 |
|
Sinobacteraceae_uncultured | 0±0 |
0.00072±0.00072 |
0.00075±0.00075 | 0.38079 | 1.00000 | 0.39968 |
|
Sphingobacteriaceae_uncultured | 0±0 | 0±0 |
0.00058±0.00058 | 1.00000 | 1.00000 | 0.39968 |
|
Sphingobium |
0.00043±0.00043 | 0±0 | 0±0 | 1.00000 | 1.00000 | 1.00000 |
|
Sphingomonas |
0.00253±0.00159 |
0.00232±0.00149 | 0±0 | 1.00000 | 0.11070 | 0.08762 |
|
Sphingopyxis |
0.00049±0.00049 | 0±0 | 0±0 | 1.00000 | 1.00000 | 1.00000 |
|
Staphylococcus | 0.00695±0.0036 |
0.01002±0.00518 | 0.0181±0.00654 | 0.69869 | 0.41635 | 0.13924 |
|
Stenotrophomonas |
0.00402±0.00308 |
0.00144±0.00144 |
0.00637±0.00439 | 0.53373 | 0.30516 | 0.73974 |
|
Streptococcus |
0.34317±0.15446 |
0.85093±0.48484 |
0.13616±0.05995 | 0.37540 | 0.16071 | 0.22702 |
|
Streptomyces | 0±0 |
0.00088±0.00088 | 0±0 | 0.38079 | 0.48016 | 1.00000 |
|
Subdoligranulum | 0±0 | 0.0005±0.0005 | 0±0 | 0.38079 | 0.48016 | 1.00000 |
|
Sutterella | 0.0004±0.0004 |
0.04729±0.01319 |
0.00962±0.00278 | 0.00254 | 0.01109 | 0.00213 |
|
Syntrophobacter
aceae_uncultured | 0.0008±0.0008 | 0±0 | 0±0 | 0.52842 | 1.00000 | 0.52013 |
|
Tetragenococcus | 0±0 | 0±0 |
0.00186±0.00131 | 1.00000 | 0.25118 | 0.06384 |
|
Thalassolituus | 0.0004±0.0004 | 0±0 | 0±0 | 1.00000 | 1.00000 | 1.00000 |
|
Thalassospira |
0.00048±0.00048 |
0.01421±0.00381 |
0.02303±0.00768 | 0.00233 | 0.32926 | 0.00499 |
|
Thauera | 0±0 | 0.0005±0.0005 |
0.00175±0.00175 | 0.38079 | 0.62618 | 0.06384 |
|
Thiobacillus | 0±0 | 0±0 |
0.00759±0.00759 | 1.00000 | 0.34499 | 0.35432 |
|
Thiotrichaceae_uncultured | 0±0 | 0±0 |
0.00075±0.00075 | 1.00000 | 1.00000 | 0.39968 |
|
Treponema | 0.0013±0.0013 |
0.89427±0.16598 |
0.20351±0.11878 | 0.00044 | 0.00327 | 0.09380 |
|
Trichococcus | 0±0 |
0.00085±0.00085 | 0±0 | 0.38079 | 0.48016 | 1.00000 |
|
Turicibacter |
0.02804±0.01479 |
0.00144±0.00144 | 0.00824±0.0025 | 0.08861 | 0.02923 | 0.20080 |
|
Veillonella |
0.00347±0.00128 | 0.00594±0.0033 |
0.00065±0.00065 | 0.57852 | 0.13088 | 0.05251 |
|
Victivallis | 0±0 | 0.0088±0.00401 |
0.00389±0.00251 | 0.04043 | 0.32513 | 0.00408 |
|
Xanthobacteraceae_uncultured | 0±0 | 0±0 |
0.00065±0.00065 | 1.00000 | 1.00000 | 0.39968 |
|
Xylanibacter | 0±0 | 0.22435±0.186 |
0.01461±0.00458 | 0.25461 | 0.27539 | 0.00258 |
|
vadinBC27_waste
water-sludge_group | 0±0 | 0±0 |
0.00075±0.00075 | 1.00000 | 1.00000 | 0.39968 |
Weighted UniFrac PCoA was performed to provide an
overview of the gut microbiota composition. The gut microbiota
composition changed significantly in response to HFD and berberine
administration (Fig. 9B). PCo 1
(accounting for 77.68% of total variance) mainly reflected the
effects of berberine on gut microbiota composition, as PCo 1
separated the HB group from the HF and Ctl groups. PCo 2
(accounting for 9.8% of total variance) mainly reflected the effect
of different diets, as PCo 2 separated the Ctl group from the HB
and HF groups. These results suggested that berberine can shift the
composition of the gut microbiome of HFD-fed rats towards that of
control rats. Similar results were obtained from the PCA (Fig. 9C).
Specific genera of gut bacteria
responded to treatment with berberine
RDA was used to identify specific bacterial genera
whose abundance was affected by HFD or berberine supplementation.
Results indicated that a HFD caused a slight change in the
composition of gut microbiota (Fig.
9D), whereas berberine treatment led to a significant change in
the gut microbiota composition (Fig.
9E), which was proven by the Monte Carlo permutation tests
(MCPP; P=0.002). Following treatment with berberine, the
composition of the gut microbiome changed along the first
ordination axis, which accounted for 72.8% of total variance
(Fig. 9F).
Berberine appeared to significantly alter the
abundance of 34 genera, 14 of which were increased, whereas the
remaining 20 were decreased or eliminated (Table IV). Notably, the genus
Akkermansia of the Verrucomicrobia phylum could not
be detected in the HF group however, it was detected in the HB
group. The genera Collinsella,
Prevotellaceae_uncultured,
Christensenellaceae_uncultured and Ruminococcus were
detected in the HF group however, not in the HB group. Furthermore,
the relative abundance of 21 genera appeared significantly
increased in the HF group compared with in the control group. Among
these, treatment with berberine significantly decreased the
abundance of 11 genera, including Roseburia,
Allobaculum, Oscillibacter, Faecalibacterium,
Prevotella and Desulfovibrio. A total of 3 genera
(Coprococcus, Collinsella and Blautia)
remained unaffected by the HFD, however, they were significantly
decreased following berberine supplementation. In addition, 10
genera appeared significantly decreased in the HFD-fed group, of
which 4 were significantly increased following treatment with
berberine, including Erysipelotrichaceae_Incertae_Sedis,
Peptostreptococcaceae_Incertae_Sedis and
Escherichia-Shigella. Furthermore, the genera
Fusobacterium, Anaerostipes, Bacteroides and
Phascolarctobacterium were also significantly increased by
treatment with berberine.
| Table IV.Differences of the 34 genera
identified by RDA between HB and HF groups. |
Table IV.
Differences of the 34 genera
identified by RDA between HB and HF groups.
| Genus | Genus for
short | Phylum | Class | Order | Family | HB (%) | HF (%) | Change (%) |
|---|
|
Akkermansia | Akke_man |
Verrucomicrobia |
Verrucomicrobiae |
Verrucomicrobiales |
Verrucomicrobiaceae |
3.14836±1.01832 |
0.00000±0.00000 | HBa |
|
Anaerofilum | Anae_fil | Firmicutes | Clostridia | Clostridiales |
Ruminococcaceae |
2.30376±0.73263 |
0.05499±0.02737 | 4089.2 |
|
Anaerostipes | Anae_sti | Firmicutes | Clostridia | Clostridiales |
Lachnospiraceae |
1.29186±0.40432 |
0.04986±0.02226 | 2490.8 |
|
Bacteroides | Bact_oid | Bacteroidetes | Bacteroidia | Bacteroidales | Bacteroidaceae |
11.32657±2.19329 |
2.86663±1.50674 | 295.1 |
|
Bilophila | Bilo_phi | Proteobacteria |
Deltaproteobacteria |
Desulfovibrionales |
Desulfovibrionaceae |
0.79589±0.15162 |
0.00085±0.00085 | 93122.1 |
|
Erysipelotrichaceae_Incertae_Sedis | Erys_Sed | Firmicutes |
Erysipelotrichi |
Erysipelotrichales |
Erysipelotrichaceae |
2.50531±0.39665 |
0.00672±0.00292 | 37190.7 |
|
Escherichia-Shigella | Esch_Shi | Proteobacteria |
Gammaproteobacteria |
Enterobacteriales |
Enterobacteriaceae |
0.35447±0.11707 |
0.02743±0.00973 | 1192.4 |
|
Fusobacterium | Fuso_bac | Fusobacteria | Fusobacteria |
Fusobacteriales |
Fusobacteriaceae |
40.17087±4.46840 |
0.03271±0.01065 | 122701.9 |
|
Klebsiella | Kleb_sie | Proteobacteria |
Gammaproteobacteria |
Enterobacteriales |
Enterobacteriaceae |
2.78132±0.76059 |
0.00050±0.00050 | 555400.0 |
|
Lachnospiraceae_Incertae_Sedis | Lach_Sed | Firmicutes | Clostridia | Clostridiales |
Lachnospiraceae |
3.56313±0.69197 |
1.58603±0.57302 | 124.7 |
|
Morganella | Morg_nel | Proteobacteria |
Gammaproteobacteria |
Enterobacteriales |
Enterobacteriaceae |
0.63669±0.10501 |
0.00122±0.00077 | 52081.4 |
|
Peptostreptococcaceae_Incertae_Sedis | Pept_Sed | Firmicutes | Clostridia | Clostridiales |
Peptostreptococcaceae |
9.05387±0.70459 |
0.05952±0.03087 | 15110.5 |
|
Phascolarctobacterium | Phas_bac | Firmicutes | Clostridia | Clostridiales |
Veillonellaceae |
4.99382±0.69833 |
3.28502±1.54339 | 52.0 |
|
Robinsoniella | Robi_son | Firmicutes | Clostridia | Clostridiales |
Lachnospiraceae |
1.60965±0.60768 |
0.00171±0.00171 | 94285.6 |
|
Allobaculum | Allo_bac | Firmicutes |
Erysipelotrichi |
Erysipelotrichales |
Erysipelotrichaceae |
0.00311±0.00079 |
10.84206±3.94134 | −100.0 |
|
Anaerotruncus | Anae_tru | Firmicutes | Clostridia | Clostridiales |
Ruminococcaceae |
0.77713±0.36482 |
1.53538±0.27758 | −49.4 |
| Blautia | Blautia | Firmicutes | Clostridia | Clostridiales |
Lachnospiraceae |
0.80417±0.24782 |
6.23756±1.76412 | −87.1 |
|
Christensenellaceae_uncultured | Chri_unc | Firmicutes | Clostridia | Clostridiales |
Christensenellaceae |
0.00000±0.00000 |
0.50197±0.12200 | HFb |
|
Collinsella | Coll_sel | Actinobacteria | Actinobacteria |
Coriobacteriales |
Coriobacteriaceae |
0.00000±0.00000 |
1.75193±0.70971 | HFb |
|
Coprococcus | Copr_coc | Firmicutes | Clostridia | Clostridiales |
Lachnospiraceae |
0.00187±0.00101 |
0.34846±0.07673 | −99.5 |
|
Desulfovibrio | Desu_vib | Proteobacteria |
Deltaproteobacteria |
Desulfovibrionales |
Desulfovibrionaceae |
0.13322±0.01360 |
2.12679±0.44718 | −93.7 |
|
Faecalibacterium | Faec_bac | Firmicutes | Clostridia | Clostridiales |
Ruminococcaceae |
0.00173±0.00131 |
0.81438±0.32885 | −99.8 |
|
Lachnospiraceae_uncultured | Lach_unc | Firmicutes | Clostridia | Clostridiales |
Lachnospiraceae |
0.01129±0.00569 |
6.64096±2.13871 | −99.8 |
|
Lactobacillus | Lact_bac | Firmicutes | Bacilli |
Lactobacillales |
Lactobacillaceae |
0.69316±0.42232 |
3.77028±2.08403 | −81.6 |
|
Oscillibacter | Osci_bac | Firmicutes | Clostridia | Clostridiales |
Ruminococcaceae |
0.00134±0.00092 |
1.91854±0.48730 | −99.9 |
|
Parabacteroides | Para_bac | Bacteroidetes | Bacteroidia | Bacteroidales |
Porphyromonadaceae |
0.00087±0.00057 |
0.29747±0.10585 | −99.7 |
|
Prevotella | Prev_tel | Bacteroidetes | Bacteroidia | Bacteroidales | Prevotellaceae |
0.00545±0.00269 |
1.28652±0.75418 | −99.6 |
|
Prevotellaceae_uncultured | Prev_unc | Bacteroidetes | Bacteroidia | Bacteroidales | Prevotellaceae |
0.00000±0.00000 |
0.64183±0.16969 | HFb |
|
Roseburia | Rose_bur | Firmicutes | Clostridia | Clostridiales |
Lachnospiraceae |
0.00043±0.00043 |
3.29178±0.50767 | −100.0 |
|
Ruminococcaceae_Incertae_Sedis | Rumi_Sed | Firmicutes | Clostridia | Clostridiales |
Ruminococcaceae |
0.53333±0.18071 |
1.43560±0.21452 | −62.8 |
|
Ruminococcaceae_uncultured | Rumi_unc | Firmicutes | Clostridia | Clostridiales |
Ruminococcaceae |
1.58302±0.31620 |
13.47235±2.72614 | −88.2 |
|
Ruminococcus | Rumi_coc | Firmicutes | Clostridia | Clostridiales |
Ruminococcaceae |
0.00000±0.00000 |
0.40738±0.06601 | HFb |
|
Streptococcus | Stre_coc | Firmicutes | Bacilli |
Lactobacillales |
Streptococcaceae |
0.34317±0.15446 |
0.85093±0.48484 | −59.7 |
|
Treponema | Trep_nem | Spirochaetes |
Spirochaetes(class) | Spirochaetales |
Spirochaetaceae |
0.00130±0.00130 |
0.89427±0.16598 | −99.9 |
In order to identify the specific genera of
intestinal bacteria that could be associated with the beneficial
effects of berberine, Spearman's correlation analysis was performed
between the 34 genera whose distribution appeared to be altered
following berberine supplementation and a number of physiological
parameters. The analyses revealed that weight, glucose intolerance,
FITC-dextran area and L-cell number were correlated with the
abundance of several genera (Table
V).
| Table V.Spearman's correlation between the
specific genera altered by berberine administration according to
redundancy analysis and host metabolic parameters. |
Table V.
Spearman's correlation between the
specific genera altered by berberine administration according to
redundancy analysis and host metabolic parameters.
|
| Body weight | FBG | FINS | HOMA-IR | AUC of OGTT | FITC-dextran
area | claudin-1 | claudin-2 | ZO-1 | occludin | L-cells | GLP-1 | GLP-2 | GIP | PP | PYY |
|---|
|
Akkermansia | −0.467 | ns | ns | ns | ns | ns | ns | ns | ns | 0.558 | 0.628 | ns | ns | ns | ns | ns |
|
Anaerofilum | ns | ns | ns | ns | 0.537 | ns | ns | ns | ns | ns | ns | ns | ns | ns | ns | ns |
|
Anaerostipes | ns | ns | ns | ns | ns | ns | ns | ns | ns | ns | 0.56 | ns | ns | ns | ns | ns |
|
Bacteroides | ns | ns | ns | ns | ns | ns | 0.436 | ns | ns | ns | ns | 0.54 | ns | ns | ns | ns |
|
Bilophila | ns | ns | ns | ns | ns | ns | ns | ns | ns | ns | 0.558 | ns | ns | ns | ns | ns |
|
Escherichia-Shigella | ns | ns | ns | ns | ns | ns | ns | ns | ns | ns | ns | ns | ns | ns | ns | ns |
|
Fusobacterium | ns | ns | ns | ns | ns | ns | 0.595 | ns | ns | ns | ns | 0.796 | 0.524 | ns | ns | ns |
|
Klebsiella | ns | ns | ns | ns | ns | ns | ns | ns | ns | ns | ns | ns | ns | ns | ns | ns |
|
Lachnospiraceae_Incertae_Sedis | ns | ns | ns | ns | ns | ns | ns | ns | ns | ns | ns | ns | ns | ns | ns | ns |
|
Morganella | ns | ns | ns | ns | ns | ns | ns | 0.582 | 0.507 | 0.495 | ns | ns | ns | ns | ns | ns |
|
Peptostreptococcaceae_Incertae_Sedis | −0.462 | ns | ns | ns | ns | ns | 0.524 | ns | ns | ns | ns | ns | ns | ns | ns | ns |
|
Phascolarctobacterium | ns | ns | ns | ns | ns | −0.522 | ns | ns | 0.483 | ns | ns | ns | ns | ns | ns | ns |
|
Robinsoniella | ns | ns | ns | ns | ns | ns | ns | ns | ns | ns | ns | ns | ns | −0.683 | ns | ns |
|
Allobaculum | ns | −0.531 | ns | ns | ns | ns | ns | −0.531 | ns | ns | ns | ns | −0.643 | ns | ns | ns |
|
Anaerotruncus | 0.683 | ns | ns | ns | ns | 0.435 | ns | ns | ns | ns | ns | ns | ns | ns | ns | ns |
| Blautia | ns | −0.605 | ns | ns | ns | ns | ns | −0.474 | ns | ns | ns | −0.52 | −0.867 | ns | ns | −0.496 |
|
Christensenellaceae_uncultured | ns | ns | ns | ns | ns | ns | ns | ns | ns | ns | ns | ns | ns | ns | ns | ns |
|
Collinsella | ns | ns | ns | ns | ns | −0.792 | ns | ns | ns | ns | ns | ns | ns | ns | ns | ns |
|
Coprococcus | ns | ns | ns | ns | ns | ns | ns | ns | ns | ns | ns | ns | ns | ns | ns | ns |
|
Desulfovibrio | ns | ns | ns | ns | ns | ns | −0.521 | ns | ns | ns | ns | ns | ns | ns | ns | ns |
|
Faecalibacterium | ns | ns | ns | ns | ns | ns | ns | ns | ns | ns | ns | ns | ns | ns | ns | ns |
|
Lachnospiraceae_uncultured | ns | ns | ns | ns | ns | ns | −0.524 | ns | ns | ns | ns | ns | ns | ns | ns | ns |
|
Lactobacillus | ns | ns | ns | ns | ns | ns | ns | ns | ns | ns | −0.541 | −0.503 | ns | ns | ns | ns |
|
Oscillibacter | ns | 0.525 | 0.565 | 0.543 | 0.697 | 0.473 | ns | ns | −0.638 | ns | 0.522 | ns | ns | ns | −0.721 | ns |
|
Parabacteroides | ns | ns | ns | ns | ns | ns | ns | ns | ns | ns | ns | ns | ns | ns | ns | 0.817 |
|
Prevotella | ns | ns | ns | ns | ns | ns | ns | ns | ns | ns | ns | ns | ns | ns | ns | ns |
|
Prevotellaceae_uncultured | ns | ns | ns | ns | ns | ns | ns | ns | ns | ns | ns | ns | ns | ns | ns | ns |
|
Roseburia | 0.555 | ns | ns | ns | ns | ns | ns | ns | ns | ns | ns | ns | ns | ns | −0.617 | −0.738 |
|
Ruminococcaceae_Incertae_Sedis | ns | ns | ns | ns | ns | ns | ns | ns | ns | ns | ns | ns | ns | ns | ns | ns |
|
Ruminococcaceae_uncultured | 0.441 | ns | ns | ns | ns | ns | −0.541 | ns | ns | ns | ns | −0.552 | ns | ns | ns | ns |
|
Ruminococcus | ns | ns | ns | ns | ns | ns | ns | 0.602 | ns | ns | ns | ns | ns | ns | ns | ns |
|
Streptococcus | ns | ns | ns | ns | ns | ns | ns | ns | ns | ns | ns | ns | ns | ns | ns | −0.514 |
|
Treponema | 0.588 | ns | 0.714 | 0.686 | 0.78 | ns | ns | ns | ns | ns | ns | ns | ns | ns | −0.753 | ns |
Discussion
It has previously been demonstrated that berberine
participates in the regulation of glucose and lipid metabolism
through targeting gut microbiota; however, the implication of its
modulatory effects on gut microbiota in metabolic disorders has not
yet been examined. Growing evidence has suggested that the gut
microbiome contributes to the systemic low-grade inflammation that
is characteristic of metabolic disorders. LPS from intestinal
bacteria can leak into the circulation through the damaged
intestinal mucosa (15), where it
can cause metabolic endotoxemia and the production of
proinflammatory cytokines, thereby contributing to insulin
resistance and related metabolic disorders (26,27).
Plasma LPS levels are a direct biomarker of systemic inflammation.
The present study revealed that berberine can significantly
decrease plasma LPS levels, which is in accordance with previous
results reporting that berberine can significantly prevent
HFD-induced systemic inflammation by decreasing serum LPS-binding
protein levels (14). Since
macrophage infiltration and oxidative stress in adipose tissue
participate in inflammation and insulin resistance (28–30),
a number of inflammatory and oxidative stress factors were
investigated in order to evaluate the role of berberine in systemic
inflammation. Berberine appeared to reduce the HFD-induced mRNA
expression levels of markers of inflammation (IL-1β and PAI-1),
oxidative stress (NADPHox and STAMP-2) and macrophage infiltration
(MCP-1 and F4/80) in visceral adipose tissue. Berberine has
previously been reported to downregulate the expression of the
proinflammatory cytokines TNF-α, IL-1, IL-6 and MCP-1 in white
adipose tissue from db/db mice (31). Furthermore, the correlations that
were revealed in the present study between these markers and plasma
LPS levels further support the hypothesis that berberine can
improve the endotoxemia-induced systemic inflammation in HFD-fed
rats.
The present results suggested that the beneficial
effect of berberine on endotoxemia is unlikely to be a result of a
decrease in Gram-negative bacteria (Table III), thus indicating that
berberine may reduce endotoxemia through reducing intestinal
permeability. Alterations in intestinal permeability have
previously been associated with alterations in the expression,
localization and distribution of tight junction proteins, including
claudins, ZO-1 and occludin (32).
It has also been suggested that berberine may directly affect the
expression of tight junction proteins. Amasheh et al
(33) reported that in HT-29/B6
cells, berberine increased the mRNA expression levels of claudin-1,
however, not claudin-2. In a rat model of LPS-induced injury,
berberine administration following LPS injection did not appear to
ameliorate the expression and distribution of the tight junction
proteins claudin-1, claudin-4, ZO-1 and occludin, and had no effect
on intestinal permeability. However, pretreatment with berberine
for 7 days was reported to partially attenuate the LPS-induced
destruction and redistribution of tight junction proteins (34). Considering the pharmacokinetic
features of berberine, it may be hypothesized that berberine
required a longer time-frame to reach its effective concentration.
The present study demonstrated that berberine supplementation for 6
weeks significantly increased the expression of claudin-1 and ZO-1
in the proximal colon of HFD-induced obese rats. In addition,
berberine appeared to partially restore the intestinal distribution
of claudin-1 and claudin-2. These results suggested that berberine,
through increasing the expression and restoring the distribution of
tight junction proteins may contribute to the restoration of
intestinal epithelial integrity.
In addition to its direct effects on the expression
of tight junction proteins, berberine has been reported to
indirectly restore gut permeability, through modulating gut
microbiota. Previous studies have suggested that gut microbiota may
regulate epithelial permeability (32,35,36).
SCFAs, which are the main metabolic products of bacterial
fermentation, have been suggested to improve the function of the
gut barrier by promoting epithelial cell growth and facilitating
tight junction formation (37,38).
Zhang et al (14) reported
that berberine, through increasing the SCFA-producing genera
Blautia and Allobaculum, enhanced intestinal
integrity and thus antagonized obesity. However, the results of the
present study revealed that berberine significantly decreased
Blautia and Allobaculum bacteria, although intestinal
permeability was improved. The present results agree with a
previous report by Xie et al (2) demonstrating that berberine exerted
anti-obesity effects partly by decreasing the degradation of
dietary polysaccharides and fecal SCFA production to inhibit energy
harvest. Previous studies have suggested that the relationship
between fecal SCFAs and the regulation of host metabolism is
important and complex (2,16). In contrast to the model used by
Zhang et al (14), the
present study evaluated the effect of berberine in rats maintained
on a HFD for 14 weeks, resembling the clinical situation. However,
future studies are required to investigate the role of berberine on
SCFA-producing genera of intestinal bacteria.
In the present study, a Spearman's correlation
analysis revealed a negative correlation between intestinal
permeability and the abundance of the Phascolarctobacterium
and Collinsella genera, and berberine supplementation
significantly increased the abundance of the genus
Phascolarctobacterium. Intestinal permeability appeared
positively correlated with the abundance of the
Anaerotruncus and Oscillibacter genera (Table V). The present findings indicated
that Phascolarctobacterium, Anaerotruncus and
Oscillibacter may be solely responsible for the beneficial
effects of berberine on intestinal permeability. A significant
10-fold decrease in the genus Oscillibacter was observed in
berberine-treated HFD-fed rats. It has previously been reported
that a HFD significantly increased the abundance of
Oscillibacter, which was negatively correlated with
transepithelial resistance and ZO-1 mRNA expression levels in the
proximal colon (39). In
accordance with the previous study, the present results suggested
that berberine may increase ZO-1 mRNA expression levels and
intestinal permeability, possibly by inhibiting
Oscillibacter abundance. In addition, the genus
Akkermansia was reported to be present exclusively in
berberine-treated rats. Previous studies have suggested that
Akkermansia muciniphila may restore the thickness of the
intestinal mucosa and counteract HFD-induced mucosal barrier
dysfunction in the colon (40),
whereas it has been suggested that this species may hold a key role
in gut barrier function and metabolic inflammation (41). However, a significant correlation
between the genus Akkermansia and intestinal permeability
was not observed in the present study. Further work is required to
explore the putative relationship between the abundance of
Akkermansia bacteria and the integrity of the gut
barrier.
The modulation of gut hormone levels by berberine
has been reported to serve an important role in improving energy
homeostasis. Previous studies have revealed that berberine
increased the number of L-cells and the mRNA expression levels of
proglucagon in the ileum, whereas it promoted GLP-1 secretion in
normal and diabetic rats (9,10).
In the present study, berberine significantly increased the portal
plasma levels of GLP-1 and GLP-2, whereas it also increased the
number of L-cells and the mRNA expression levels of proglucagon in
the proximal colon. Multiple lines of evidence have linked gut
microbiota with the enteroendocrine system, whereas SCFAs are the
most studied among gut microbial metabolites (42). In the present study, Spearman's
correlation analysis revealed that L-cell numbers were positively
correlated with the abundance of 4 genera (Akkermansia,
Anaerostipes, Bilophila and Oscillibacter) and
negatively correlated with the abundance of the genus
Lactobacillus (Table V).
Previous studies reported a positive correlation between the
abundance of bacteria of the Akkermansia genus and L-cell
numbers in the colon, whereas Akkermansia muciniphila
administration significantly increased GLP-1 release from colonic
L-cells (43,44). Sequencing results of the present
study revealed that the abundance of Akkermansia was
significantly increased by berberine, although the correlation
between Akkermansia and GLP-1 levels was not significant.
Based on previous research that correlated the abundance of 10
genera with L-cell numbers (43),
the present study confirmed that berberine increased the abundance
of the genus Akkermansia and decreased the abundance of the
genus Lactobacillus, which appeared to be associated with
the increase in L-cell numbers and enteroendocrine peptide
secretion from L-cells. In addition, Spearman's correlation
analysis revealed plasma GIP levels to be negatively correlated
with the abundance of the Robinsoniella genus.
The present study suggested that the wide shift in
the gut microbiota composition induced by berberine may attenuate
insulin resistance and related metabolic disorders in HFD-fed rats
via several pathways. Firstly, berberine supplementation alleviated
metabolic endotoxemia and subsequent systemic inflammation, via
restoring the integrity of the gut barrier through increasing the
expression and restoring the distribution of tight junction
proteins. Furthermore, berberine modulated the plasma levels of gut
hormones involved in glucose regulation and energy homeostasis,
possibly via interfering with the composition of the gut
microbiome. In conclusion, the present results suggested that
berberine may be a potential therapeutic strategy for the treatment
of obesity and insulin resistance. However, further study is
required to delineate the mechanism of action of berberine.
Acknowledgements
This study was supported by the National Natural
Science Foundation of China (grant no. 81170738).
References
|
1
|
Zhang Y, Li X, Zou D, Liu W, Yang J, Zhu
N, Huo L, Wang M, Hong J, Wu P, et al: Treatment of type 2 diabetes
and dyslipidemia with the natural plant alkaloid berberine. J Clin
Endocrinol Metab. 93:2559–2565. 2008. View Article : Google Scholar : PubMed/NCBI
|
|
2
|
Xie W, Gu D, Li J, Cui K and Zhang Y:
Effects and action mechanisms of berberine and Rhizoma coptidis on
gut microbes and obesity in high-fat diet-fed C57BL/6J mice. PLoS
One. 6:e245202011. View Article : Google Scholar : PubMed/NCBI
|
|
3
|
Gomes AP, Duarte FV, Nunes P, Hubbard BP,
Teodoro JS, Varela AT, Jones JG, Sinclair DA, Palmeira CM and Rolo
AP: Berberine protects against high fat diet-induced dysfunction in
muscle mitochondria by inducing SIRT1-dependent mitochondrial
biogenesis. Biochim Biophys Acta. 1822:185–195. 2012. View Article : Google Scholar : PubMed/NCBI
|
|
4
|
Lee YS, Kim WS, Kim KH, Yoon MJ, Cho HJ,
Shen Y, Ye JM, Lee CH, Oh WK, Kim CT, et al: Berberine, a natural
plant product, activates AMP-activated protein kinase with
beneficial metabolic effects in diabetic and insulin-resistant
states. Diabetes. 55:2256–2264. 2006. View Article : Google Scholar : PubMed/NCBI
|
|
5
|
Liu L, Yu YL, Yang JS, Li Y, Liu YW, Liang
Y, Liu XD, Xie L and Wang GJ: Berberine suppresses intestinal
disaccharidases with beneficial metabolic effects in diabetic
states, evidences from in vivo and in vitro study. Naunyn
Schmiedebergs Arch Pharmacol. 381:371–381. 2010. View Article : Google Scholar : PubMed/NCBI
|
|
6
|
Pan GY, Huang ZJ, Wang GJ, Fawcett JP, Liu
XD, Zhao XC, Sun JG and Xie YY: The antihyperglycaemic activity of
berberine arises from a decrease of glucose absorption. Planta Med.
69:632–636. 2003. View Article : Google Scholar : PubMed/NCBI
|
|
7
|
Kong W, Wei J, Abidi P, Lin M, Inaba S, Li
C, Wang Y, Wang Z, Si S, Pan H, et al: Berberine is a novel
cholesterol-lowering drug working through a unique mechanism
distinct from statins. Nat Med. 10:1344–1351. 2004. View Article : Google Scholar : PubMed/NCBI
|
|
8
|
Wang Y, Yi X, Ghanam K, Zhang S, Zhao T
and Zhu X: Berberine decreases cholesterol levels in rats through
multiple mechanisms, including inhibition of cholesterol
absorption. Metabolism. 63:1167–1177. 2014. View Article : Google Scholar : PubMed/NCBI
|
|
9
|
Lu SS, Yu YL, Zhu HJ, Liu XD, Liu L, Liu
YW, Wang P, Xie L and Wang GJ: Berberine promotes glucagon-like
peptide-1 (7–36) amide secretion in streptozotocin-induced diabetic
rats. J Endocrinol. 200:159–165. 2009. View Article : Google Scholar : PubMed/NCBI
|
|
10
|
Yu Y, Liu L, Wang X, Liu X, Liu X, Xie L
and Wang G: Modulation of glucagon-like peptide-1 release by
berberine: In vivo and in vitro studies. Biochem Pharmacol.
79:1000–1006. 2010. View Article : Google Scholar : PubMed/NCBI
|
|
11
|
Liu YT, Hao HP, Xie HG, Lai L, Wang Q, Liu
CX and Wang GJ: Extensive intestinal first-pass elimination and
predominant hepatic distribution of berberine explain its low
plasma levels in rats. Drug Metab Dispos. 38:1779–1784. 2010.
View Article : Google Scholar : PubMed/NCBI
|
|
12
|
Chen W, Miao YQ, Fan DJ, Yang SS, Lin X,
Meng LK and Tang X: Bioavailability study of berberine and the
enhancing effects of TPGS on intestinal absorption in rats. AAPS
PharmSciTech. 12:705–711. 2011. View Article : Google Scholar : PubMed/NCBI
|
|
13
|
Aronsson L, Huang Y, Parini P,
Korach-André M, Håkansson J, Gustafsson JÅ, Pettersson S,
Arulampalam V and Rafter J: Decreased fat storage by Lactobacillus
paracasei is associated with increased levels of angiopoietin-like
4 protein (ANGPTL4). PLoS One. 5:e130872010. View Article : Google Scholar : PubMed/NCBI
|
|
14
|
Zhang X, Zhao Y, Zhang M, Pang X, Xu J,
Kang C, Li M, Zhang C, Zhang Z, Zhang Y, et al: Structural changes
of gut microbiota during berberine-mediated prevention of obesity
and insulin resistance in high-fat diet-fed rats. PLoS One.
7:e425292012. View Article : Google Scholar : PubMed/NCBI
|
|
15
|
Cani PD, Possemiers S, Van de Wiele T,
Guiot Y, Everard A, Rottier O, Geurts L, Naslain D, Neyrinck A,
Lambert DM, et al: Changes in gut microbiota control inflammation
in obese mice through a mechanism involving GLP-2-driven
improvement of gut permeability. Gut. 58:1091–1103. 2009.
View Article : Google Scholar : PubMed/NCBI
|
|
16
|
Cani PD, Lecourt E, Dewulf EM, Sohet FM,
Pachikian BD, Naslain D, De Backer F, Neyrinck AM and Delzenne NM:
Gut microbiota fermentation of prebiotics increases satietogenic
and incretin gut peptide production with consequences for appetite
sensation and glucose response after a meal. Am J Clin Nutr.
90:1236–1243. 2009. View Article : Google Scholar : PubMed/NCBI
|
|
17
|
Cani PD, Neyrinck AM, Maton N and Delzenne
NM: Oligofructose promotes satiety in rats fed a high-fat diet:
Involvement of glucagon-like peptide-1. Obes Res. 13:1000–1007.
2005. View Article : Google Scholar : PubMed/NCBI
|
|
18
|
Cani PD, Hoste S, Guiot Y and Delzenne NM:
Dietary non-digestible carbohydrates promote L-cell differentiation
in the proximal colon of rats. Br J Nutr. 98:32–37. 2007.
View Article : Google Scholar : PubMed/NCBI
|
|
19
|
Tazoe H, Otomo Y, Karaki S, Kato I, Fukami
Y, Terasaki M and Kuwahara A: Expression of short-chain fatty acid
receptor GPR41 in the human colon. Biomed Res. 30:149–156. 2009.
View Article : Google Scholar : PubMed/NCBI
|
|
20
|
Tolhurst G, Heffron H, Lam YS, Parker HE,
Habib AM, Diakogiannaki E, Cameron J, Grosse J, Reimann F and
Gribble FM: Short-chain fatty acids stimulate glucagon-like
peptide-1 secretion via the G-protein-coupled receptor FFAR2.
Diabetes. 61:364–371. 2012. View Article : Google Scholar : PubMed/NCBI
|
|
21
|
des Rieux A, Pourcelle V, Cani PD,
Marchand-Brynaert J and Préat V: Targeted nanoparticles with novel
non-peptidic ligands for oral delivery. Adv Drug Deliv Rev.
65:833–844. 2013. View Article : Google Scholar : PubMed/NCBI
|
|
22
|
Psichas A, Sleeth ML, Murphy KG, Brooks L,
Bewick GA, Hanyaloglu AC, Ghatei MA, Bloom SR and Frost G: The
short chain fatty acid propionate stimulates GLP-1 and PYY
secretion via free fatty acid receptor 2 in rodents. Int J Obes
(Lond). 39:424–429. 2015. View Article : Google Scholar : PubMed/NCBI
|
|
23
|
Feng Y, Li Y, Chen C, Lin X, Yang Y, Cai
H, Lv Z, Cao M, Li K, Xu J, et al: Inhibiting roles of berberine in
gut movement of rodents are related to activation of the endogenous
opioid system. Phytother Res. 27:1564–1571. 2013.PubMed/NCBI
|
|
24
|
Shan CY, Yang JH, Kong Y, Wang XY, Zheng
MY, Xu YG, Wang Y, Ren HZ, Chang BC and Chen LM: Alteration of the
intestinal barrier and GLP2 secretion in Berberine-treated type 2
diabetic rats. J Endocrinol. 218:255–262. 2013. View Article : Google Scholar : PubMed/NCBI
|
|
25
|
Livak KJ and Schmittgen TD: Analysis of
relative gene expression data using real-time quantitative PCR and
the 2(−Delta Delta C(T)) method. Methods. 25:402–408. 2001.
View Article : Google Scholar : PubMed/NCBI
|
|
26
|
Kim KA, Gu W, Lee IA, Joh EH and Kim DH:
High fat diet-induced gut microbiota exacerbates inflammation and
obesity in mice via the TLR4 signaling pathway. PLoS One.
7:e477132012. View Article : Google Scholar : PubMed/NCBI
|
|
27
|
Glass CK and Olefsky JM: Inflammation and
lipid signaling in the etiology of insulin resistance. Cell Metab.
15:635–645. 2012. View Article : Google Scholar : PubMed/NCBI
|
|
28
|
Furukawa S, Fujita T, Shimabukuro M, Iwaki
M, Yamada Y, Nakajima Y, Nakayama O, Makishima M, Matsuda M and
Shimomura I: Increased oxidative stress in obesity and its impact
on metabolic syndrome. J Clin Invest. 114:1752–1761. 2004.
View Article : Google Scholar : PubMed/NCBI
|
|
29
|
Shoelson SE, Lee J and Goldfine AB:
Inflammation and insulin resistance. J Clin Invest. 116:1793–1801.
2006. View Article : Google Scholar : PubMed/NCBI
|
|
30
|
Shoelson SE, Herrero L and Naaz A:
Obesity, inflammation and insulin resistance. Gastroenterology.
132:2169–2180. 2007. View Article : Google Scholar : PubMed/NCBI
|
|
31
|
Jeong HW, Hsu KC, Lee JW, Ham M, Huh JY,
Shin HJ, Kim WS and Kim JB: Berberine suppresses proinflammatory
responses through AMPK activation in macrophages. Am J Physiol
Endocrinol Metab. 296:E955–E964. 2009. View Article : Google Scholar : PubMed/NCBI
|
|
32
|
Everard A and Cani PD: Diabetes, obesity
and gut microbiota. Best Pract Res Clin Gastroenterol. 27:73–83.
2013. View Article : Google Scholar : PubMed/NCBI
|
|
33
|
Amasheh M, Fromm A, Krug SM, Amasheh S,
Andres S, Zeitz M, Fromm M and Schulzke JD: TNFalpha-induced and
berberine-antagonized tight junction barrier impairment via
tyrosine kinase, Akt and NFkappaB signaling. J Cell Sci.
123:4145–4155. 2010. View Article : Google Scholar : PubMed/NCBI
|
|
34
|
Ma JY, Feng R, Tan XS, Ma C, Shou JW, Fu
J, Huang M, He CY, Chen SN, Zhao ZX, et al: Excretion of berberine
and its metabolites in oral administration in rats. J Pharm Sci.
102:4181–4192. 2013. View Article : Google Scholar : PubMed/NCBI
|
|
35
|
Yu LC, Wang JT, Wei SC and Ni YH:
Host-microbial interactions and regulation of intestinal epithelial
barrier function: From physiology to pathology. World J
Gastrointest Pathophysiol. 3:27–43. 2012. View Article : Google Scholar : PubMed/NCBI
|
|
36
|
Greiner T and Bäckhed F: Effects of the
gut microbiota on obesity and glucose homeostasis. Trends
Endocrinol Metab. 22:117–123. 2011. View Article : Google Scholar : PubMed/NCBI
|
|
37
|
Ichikawa H and Sakata T: Stimulation of
epithelial cell proliferation of isolated distal colon of rats by
continuous colonic infusion of ammonia or short-chain fatty acids
is nonadditive. J Nutr. 128:843–847. 1998.PubMed/NCBI
|
|
38
|
Peng L, Li ZR, Green RS, Holzman IR and
Lin J: Butyrate enhances the intestinal barrier by facilitating
tight junction assembly via activation of AMP-activated protein
kinase in Caco-2 cell monolayers. J Nutr. 139:1619–1625. 2009.
View Article : Google Scholar : PubMed/NCBI
|
|
39
|
Lam Y, Ha CW, Campbell CR, Mitchell AJ,
Dinudom A, Oscarsson J, Cook DI, Hunt NH, Caterson ID, Holmes AJ,
et al: Increased gut permeability and microbiota change associate
with mesenteric fat inflammation and metabolic dysfunction in
diet-induced obese mice. PLoS One. 7:e342332012. View Article : Google Scholar : PubMed/NCBI
|
|
40
|
Everard A, Belzer C, Geurts L, Ouwerkerk
JP, Druart C, Bindels LB, Guiot Y, Derrien M, Muccioli GG, Delzenne
NM, et al: Cross-talk between Akkermansia muciniphila and
intestinal epithelium controls diet-induced obesity. Proc Natl Acad
Sci USA. 110:9066–9071. 2013. View Article : Google Scholar : PubMed/NCBI
|
|
41
|
Anhê FF, Roy D, Pilon G, Dudonné S,
Matamoros S, Varin TV, Garofalo C, Moine Q, Desjardins Y, Levy E,
et al: A polyphenol-rich cranberry extract protects from
diet-induced obesity, insulin resistance and intestinal
inflammation in association with increased Akkermansia spp.
population in the gut microbiota of mice. Gut. 64:872–883. 2015.
View Article : Google Scholar : PubMed/NCBI
|
|
42
|
Cani PD, Everard A and Duparc T: Gut
microbiota, enteroendocrine functions and metabolism. Curr Opin
Pharmacol. 13:935–940. 2013. View Article : Google Scholar : PubMed/NCBI
|
|
43
|
Everard A, Lazarevic V, Derrien M, Girard
M, Muccioli GG, Neyrinck AM, Possemiers S, Van Holle A, François P,
de Vos WM, et al: Responses of gut microbiota and glucose and lipid
metabolism to prebiotics in genetic obese and diet-induced
leptin-resistant mice. Diabetes. 60:2775–2786. 2011. View Article : Google Scholar : PubMed/NCBI
|
|
44
|
Hansen KB, Rosenkilde MM, Knop FK, Wellner
N, Diep TA, Rehfeld JF, Andersen UB, Holst JJ and Hansen HS:
2-Oleoyl glycerol is a GPR119 agonist and signals GLP-1 release in
humans. J Clin Endocrinol Metab. 96:E1409–E1417. 2011. View Article : Google Scholar : PubMed/NCBI
|