Introduction
Esophageal squamous cell carcinoma (ESCC), which
ranks the 6th in mortality and the 7th in morbidity in China, is
one of the most prevalent malignant neoplasm around the world
(1). Low intake of fruits and
vegetables, poor nutritional status, smoking, and drinking all
contribute to the etiology of ESCC (2). Despite improvements in ESCC
treatments, the five-year survival rate of patients with ESCC is
still low, because of poor understanding of the molecular
pathogenesis of ESCC and infrequent early-stage diagnosis (3,4).
Although studies have indicated that some oncogenes and tumor
suppressor genes are involved in the progression of esophageal
cancer including Phospholipase C epsilon 1 (PLCE1), the molecular
mechanisms are still poorly known. Therefore, it is imperative to
study the functioning of genes that could be involved in the
mechanism of the occurrence and development of ESCC.
Recently, a novel ESCC susceptibility loci located
in chromosome10q23 in PLCE1 gene was identified by three
genome-wide association studies (GWAS) in Chinese Han populations
(5–7). Accumulated evidences have showed
PLCE1 plays crucial roles in types of several cancers, such as head
and neck (8), bladder (9–11),
gastric (12,13), skin (14), prostate (15). Our previous studies revealed
increased of PLCE1 expression was significantly associated with
lymph node metastasis and advanced TNM stage of Kazakh ESCC, which
implicated that PLCE1 could be a novel biomarker for patients of
Kazakh ESCC (16). Afterwards, we
have stably knockdown PLCE1 by siRNA in ESCC cell lines Eca109 and
EC9706, knockdown of PLCE1 resulted in an increase of the
apoptosis, a decrease in cell proliferation as well as migration
and invasion, and an inhibition of the formation of lamellipodia
and filopodia of F-actin in vitro, the effect of PLCE1 on
cell migration, invasiveness, and motility is correlated with
epithelial-mesenchymal transition (EMT) and cytoskeleton dynamics
(4). These results suggested that
PLCE1 might play important roles in oncogenesis and progression of
ESCC. Therefore, further research must be carried out to understand
the exact role of PLCE1 in ESCC. To better understand the
molecular mechanism of PLCE1, the mRNA expression profile of
PLCE1 knockdown was analyzed by the Affymetrix Gene Chip
Human genome arrays. Nevertheless, a comprehensive analysis of the
knockdown of PLCE1 has not been reported for
microarray-based techniques in previous studies.
In this study, we explored the functional roles of
PLCE1 on downstream genes and signaling pathways in ESCC.
Hundreds of differentially expressed genes (DEGs), especially
inflammation or immune-related genes, were identified in
PLCE1-siRNA-treated cells compared with the control cells.
Based on Gene Ontology enrichment and KEGG pathway analysis, we
found that PLCE1 knockdown could impact a number of genes
involved in proliferation, apoptosis, invasion and metastasis of
tumor cells, et al and pathways including MAPK,
Toll-like receptor, p53, Focal adhesion, et al. To
the best of our knowledge, this is the first paper to perform a
systematic analysis of how PLCE1 can influence DEGs and signal
pathways in ESCC by microarray-based techniques.
Materials and methods
Cell culture and transfections
Esophageal cancer cell lines (Eca109 and EC9706)
were purchased from Institute of Biochemistry and cell biology,
Chinese Academy of Sciences (Shanghai, China) Cells was cultured in
Dulbecco's modified Eagle's medium (DMEM) or RPMI-1640 (Gibco,
Grand Island, NY, USA) containing 10% fetal bovine serum (FBS) at
37°C under 5% CO2. The transfection of RNA was in the
case of the final concentration of 5 nM with HiPerFect transfection
reagents (Qiagen, Hilden, Germany) in serum-free conditions. The
target sequences for PLCE1-siRNA is
5′-AGCGUUGGUCCAUGCUUAATT-3′.
The DEGs
Raw data were normalized by MAS 3.0 algorithm. The
main criterion for selection of DEGs between the two groups of
samples being compared: i) q-value ≤ 5% (t-test); ii) fold change
≥2 and ≤0.5; given that there are three types of call values of
each detected probe, at lowest one group among the values of three
repetition should be non-A values. The expression level of the
appropriate gene was the tallest number of P signs, for those genes
including a lot of probes. A scatter plot was visualized to
evaluate variations from chip to chip.
Gene ontology and pathway enrichment
analyses
Molecular annotation system (MAS3.0) was used for
gene ontology (GO) enrichment analysis. The ‘conditional’ option
was designed to correct, while ‘p value Cutoff’ was designed to
0.05. For those GO terms including at least one DEG, a false
discovery rate (FDR) was performed by the Benjamini-Hochberg
method. FDR was set to 0.1 (cutoff: 0.1).
Pathway enrichment analysis was used to perform via
the Kyoto Encyclopedia of Genes and Genomes (KEGG; http://www.genome.jp/kegg/.html) database. The
KEGG maps of biological functions associated with DEGs were
identified. The P-value of the enrichment of DEGs in different
pathways was reckoned by the super-geometric test, the significance
threshold of false discovery rate (FDR) was also designed to
0.1.
Verification for gene expression using quantitative
real-time polymerase chain reaction (qRT-PCR). Total RNA was
extracted from ESCC cell lines with mRNA Extraction kit (Qiagen)
according to the standard protocol. The cDNA of mRNA was
synthesized with One Step PrimeScript mRNA cDNA Synthesis kit
(Qiagen). All qRT-PCR data was standardized to β-actin expression.
An ABI Prism 7500 Sequence Detection System (Applied Biosystems,
Foster City, CA, USA) was used to detect the response.
Amplification occurred at an initial denaturation cycle of 95°C for
5 min followed by 40 cycles of 95°C for 10 sec, 60°C for 30 sec.
All experiments were performed in triplicate at least three times.
The 2-ΔΔCq method was used to quantify the results. The primers
used have been listed in Table
I.
 | Table I.The primers used for Q-RT-PCR. |
Table I.
The primers used for Q-RT-PCR.
| Gene name | Primers | Annealing
temperature (°C) | The length of
product (bp) |
|---|
| PLCE1 |
F:GAGCTGCAATCGAAGTCTGG | 60 | 192 |
|
|
R:AAGGCCTTCTGTGAGTCCTC |
|
|
| IL-1a |
F:ACGACTGGGTTTCAATCAGG | 60 | 142 |
|
|
R:CTGCATGACTCGCCTTATCA |
|
|
| IL-1b |
F:CCAGGATGAGGACCTGAGAA | 60 | 149 |
|
|
R:CGAGGCATTTCTGTTGTTCA |
|
|
| CXCl1 |
F:CCCAAACCGAAGTCATAGCC | 58 | 109 |
|
|
R:GATTTGTCACTGTTCAGCATCTTT |
|
|
| CXCL2 |
F:CGAAGTCATAGCCACACTCAAG | 58 | 116 |
|
|
R:CTTCTGGTCAGTTGGATTTGC |
|
|
| CCL2 |
F:GCACTCTCGCCTCCAGCATGA | 50 | 121 |
|
|
R:CAGCAGGTGACTGGGGCATTGA |
|
|
| CCL20 |
F:TGCTGTACCAAGAGTTTGCTC | 58 | 217 |
|
|
R:CGCACACAGACAACTTTTTCTTT |
|
|
| β-actin |
F:TGAAGTGTGACGTGGACATCCGC | 60 | 356 |
|
|
R:GCCAATCTCATCTTGTTTTCTGCGC |
|
|
Western blot analysis
Transfected cells were lysed using RIPA buffer
supplemented with Protease Inhibitor (PMSF). Protein was separated
by SDS-PAGE, transferred to the PVDF membrane, and prevented by
blocking with 0.1% Tween-20 in TBST including 5% nonfat milk for 2
h at room temperature, then, membranes were incubated at 4°C
overnight with primary antibodies against PLCE1 (1:200;
rabbit. no. sc-368932; Santa Cruz Biotechnology, Inc., Santa Cruz,
CA, USA) and β-Actin (1:500; rabbit. no. PR-0255; ZSGB-BIO,
Beijing, China), and then incubated with secondary antibodies
(1:10,000; rabbit. no. zf-0311; ZSGB-BIO) for 2 h at 37°C. After
washing, membranes were exposed in the darkroom. Finally, the
objective bands were analyzed with the ECL procedure.
Statistics
Statistical analysis was carried out by Graphpad
Prism 5.0e Software. Results were expressed as mean ± standard
deviation comparison between two groups. Differences between means
were investigated by paired t-test within two groups. P<0.05 was
considered to indicate a statistically significant difference.
Results
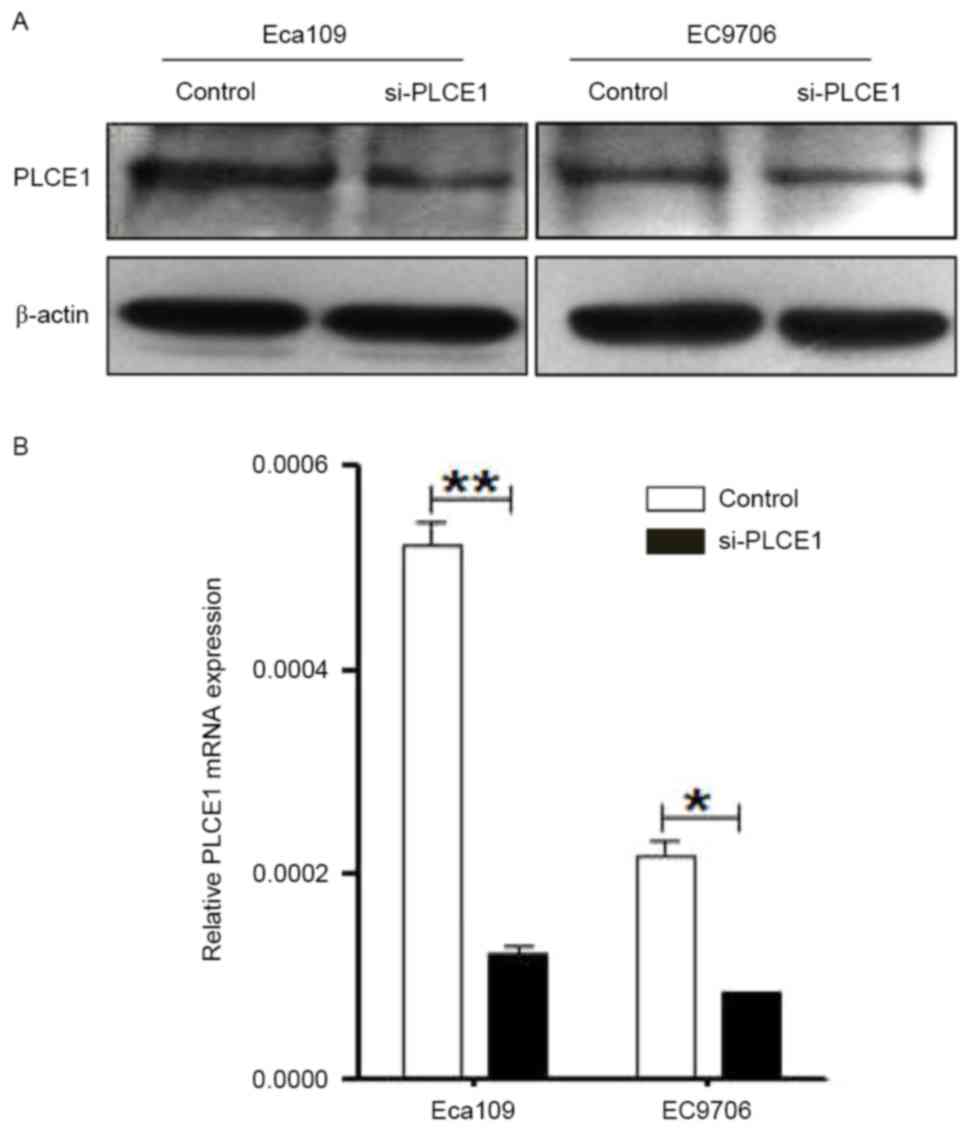
Si-PLCE1 inhibited PLCE1 mRNA and
protein expression
To determine the oncogenic function of PLCE1,
si-PLCE1 was used to interfere with PLCE1 expression in
Eca109 and EC9706 cells. The endogenous expression of PLCE1
was detected by qRT-PCR and western blot analysis after
transfection. The expression of PLCE1 at both mRNA and
protein levels was significantly reduced in the PLCE1
knockdown cells, compared with control groups (Fig. 1). These results indicated that the
expression levels of PLCE1 mRNA and protein were markedly silenced
after transfection in Eca109 and EC9706 cells.
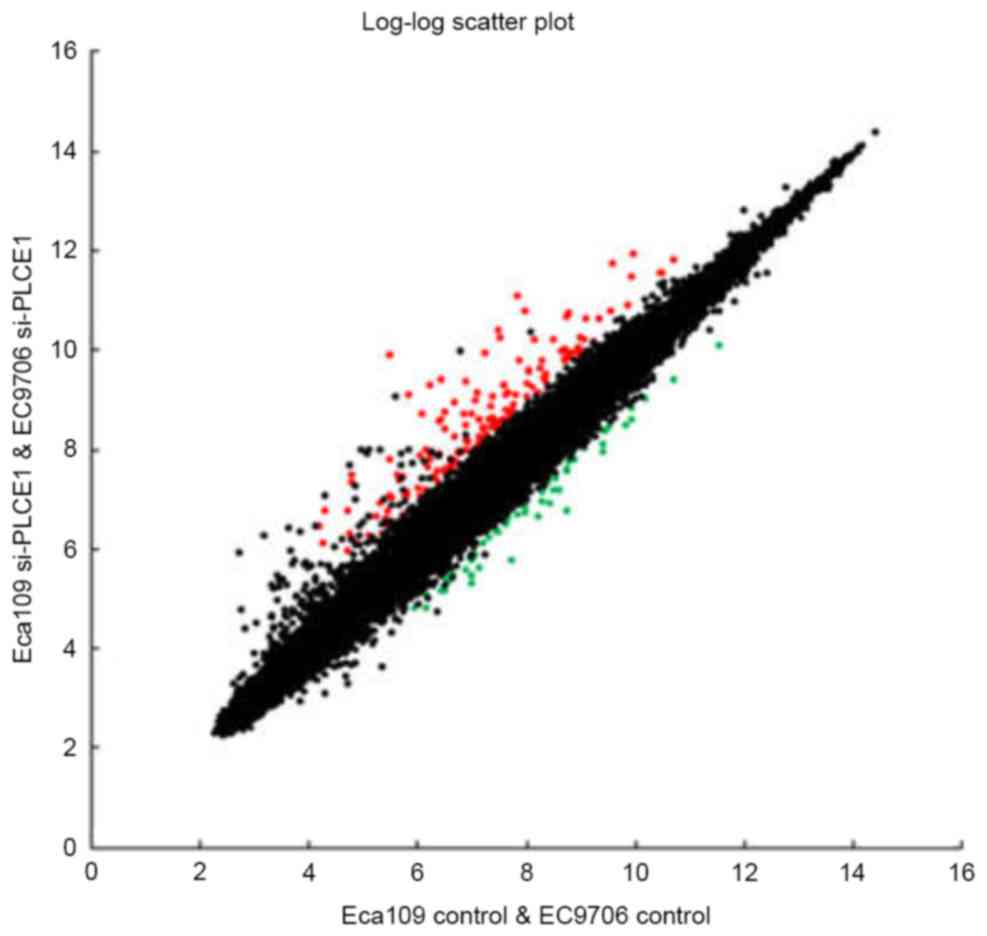
Analysis of the DEGs
To explore the influence of PLCE1 on
downstream genes, the mRNA expression profile was analyzed using
the Affymetrix GeneChip Human genome 3, IVT arrays which contain
49294 genes in Eca109 and EC9706 transfected with PLCE1
siRNA compared to control groups.
Results compared with control groups, a total of 223
DEGs were identified by greater than 2.0-fold, of these, 168 DEGs
were robustly upregulated and 55 DEGs were robustly downregulated.
Primitively, the significantly increased genes were identified,
such as DUSP5, IL8, IER3, IL6 and so on, while significantly
downregulated genes including TMEM30A, SNTB2, TMEM106B and so on
(Table II). Interestingly, the
expression of inflammatory factors was significantly increased
after PLCE1 gene silencing, such as IL-8, IL-6, CXCR4 and so
on. Contrary to popular belief, inflammation was regarded as a
promoter of tumor formation and metastasis. The results of our
study suggested that PLCE1 might inhibit inflammatory
factors expression. A two-dimensional rectangular coordinate plane
was shown a scatter plot (Fig. 2).
Collectively, PLCE1 might have a significant impact on
expressions of PLCE1-modulated downstream genes.
Accordingly, a lot more researches are needed to figure out the
possible relationship between these genes and PLCE1.
| Table II.Differentially expressed genes in
PLCE1 siRNA-Treated esophageal squamous cell carcinoma cells,
compared with control cells. |
Table II.
Differentially expressed genes in
PLCE1 siRNA-Treated esophageal squamous cell carcinoma cells,
compared with control cells.
| A, Upregulated
genes |
|---|
|
|---|
| Gene symbol | Fold change | Gene symbol | Fold change | Gene symbol | Fold change |
|---|
| IL8 | 22.624 | HSPA5 | 3.007 | TNRC6A | 2.27 |
| CXCL2 | 10.224 | SAT1 | 3 | IFI16 | 2.26 |
| IFI27 | 10.111 | CLDN1 | 2.966 | HSPA5 | 2.26 |
| IFIT2 |
8.896 | PRIC285 | 2.929 | CXCR4 | 2.252 |
| CXCL2 |
8.1833 | PLSCR1 | 2.925 | SOD2 | 2.249 |
| OASL |
7.9428 | PHLDA1 | 2.908 | JUN | 2.246 |
|
11762907_at |
7.457 | RELB | 2.908 | DUSP6 | 2.242 |
|
11760093_at |
7.012 | NFKBIZ | 2.879 | FNDC3A | 2.241 |
| IFIT1 |
6.821 | NT5E | 2.808 | GDF15 | 2.238 |
| DDIT3 |
6.788 | STC2 | 2.802 | SAMD9 | 2.232 |
| DDX58 |
6.5573 | OAS1 | 2.734 | HIF1A | 2.23 |
| DDIT3 |
6.071 | FNDC3A | 2.715 | FNDC3A | 2.225 |
| IFIT3 |
5.934 |
SERPINE2 | 2.691 | TNRC6A | 2.214 |
| IL6 |
5.899 | F3 | 2.663 | ZC3HAV1 | 2.214 |
| TRAC |
5.221 | ZC3H12C | 2.663 | IFITM1 | 2.202 |
| GDF15 |
5.007 | SAT1 | 2.613 | PLSCR1 | 2.198 |
| PTGS2 |
5.005 | ADM | 2.61 | ADRB2 | 2.197 |
| ISG20 |
4.985 | IRF7 | 2.596 | CDKN1A | 2.194 |
|
TNFRSF21 |
4.789 | ABCD3 | 2.592 | SPINK1 | 2.193 |
| IRF9 |
4.719 | OAS2 | 2.59 | CLEC2B | 2.181 |
|
11761908_at |
4.698 | ADM | 2.562 | PMAIP1 | 2.157 |
| GDF15 |
4.418 | FNDC3A | 2.522 | ZC3H12C | 2.156 |
| PTGS2 |
4.31 | ITGA2 | 2.506 | FGF2 | 2.143 |
| C5orf41 |
4.295 | IRF1 | 2.503 | SIPA1L2 | 2.136 |
| ISG15 |
4.122 | PARP9 | 2.503 | FICD | 2.129 |
| GDF15 |
4.091 | PLSCR1 | 2.501 | DUSP6 | 2.114 |
|
TNFRSF21 |
4.05 | DNAJB9 | 2.5 | HSPA5 | 2.112 |
| STC2 |
4.024 | ICAM1 | 2.495 | RSPO3 | 2.108 |
| DUSP5 |
4.003 | MAFF | 2.482 | ANGPTL4 | 2.107 |
| TNFAIP3 |
3.996 | FAIM3 | 2.475 | SAMHD1 | 2.105 |
|
SERPINE2 |
3.81 |
SAA1/SAA2 | 2.47 |
PPP1R15A | 2.103 |
| PLSCR1 |
3.805 | STX11 | 2.454 | B3GNT5 | 2.086 |
| RND3 |
3.796 | CDKN1A | 2.441 | FNDC3B | 2.078 |
| TNFAIP3 |
3.743 | DUSP6 | 2.44 | USP18 | 2.076 |
| AMIGO2 |
3.664 | ICAM1 | 2.427 | RND3 | 2.069 |
| PTGS2 |
3.533 | CXCR4 | 2.422 | FNDC3B | 2.068 |
|
SERPINE2 |
3.492 | STAT1 | 2.415 | ELL2 | 2.062 |
| HSPA5 |
3.483 | PMAIP1 | 2.407 | JAG1 | 2.049 |
| IFI6 |
3.462 | PTGER4 | 2.386 | MCL1 | 2.048 |
| FOS |
3.427 | HERC5 | 2.385 | TLR4 | 2.048 |
| FOSL1 |
3.419 | FOSL1 | 2.378 | DRAM1 | 2.044 |
| HSPA5 |
3.417 | BIRC3 | 2.347 | OAS1 | 2.043 |
| SAMD9L |
3.409 | BIRC3 | 2.346 | SIPA1L2 | 2.038 |
| ATF3 |
3.387 | FGF2 | 2.346 | OTUD1 | 2.037 |
| C5orf41 |
3.231 | PLSCR1 | 2.345 | GFPT1 | 2.032 |
| FOSL1 |
3.196 | VEGFC | 2.336 | OSMR | 2.026 |
| HIVEP2 |
3.148 | OAS1 | 2.335 | GADD45A | 2.023 |
| BIRC3 |
3.131 | JUN | 2.33 | ETV4 | 2.021 |
| CLDN1 |
3.128 | HRASLS2 | 2.317 | PLAUR | 2.019 |
| CPA4 |
3.123 | ZFP36 | 2.316 | JUN | 2.016 |
| FOSL1 |
3.12 | ABCD3 | 2.297 | IRF9 | 2.014 |
| IRAK2 |
3.089 | IFITM1 | 2.294 | DUSP4 | 2.011 |
| IER3 |
3.081 | OAS1 | 2.293 |
SERPINE1 | 2.009 |
| GABBR1 |
3.052 | CXCR4 | 2.293 | KRT34 | 2.005 |
| RHEBL1 |
3.032 | SAMHD1 | 2.281 | SLC6A6 | 2.0008 |
| SOD2 |
3.013 | DUSP6 | 2.271 | HERPUD1 | 2.0004 |
|
| B, Downregulated
genes |
|
| Gene symbol | Fold change | Gene symbol | Fold change | Gene symbol | Fold change |
|
| TMEM30A |
0.255 | C5orf53 | 0.418 | SEPP1 | 0.468 |
| TMEM30A |
0.259 | SUV39H1 | 0.42 | NEURL1B | 0.474 |
| SNTB2 |
0.311 |
NCRNA00201 | 0.426 | MOBKL2B | 0.476 |
|
C21orf45 |
0.345 | GNA11 | 0.43 | LOXL1 | 0.477 |
| IGSF8 |
0.348 | VEPH1 | 0.439 | SUV39H1 | 0.478 |
| STYX |
0.357 | CAV1 | 0.446 | CHST13 | 0.48 |
|
C21orf45 |
0.36 | C8orf83 | 0.453 | PSKH1 | 0.481 |
| STYX |
0.371 | MOBKL2B | 0.454 |
TMEM106B | 0.482 |
| DAZAP1 |
0.374 | CLIC3 | 0.455 | ZNF362 | 0.483 |
| C7orf41 |
0.385 | METTL7A | 0.456 | BMP8B | 0.483 |
| FAM107B |
0.398 | SORBS2 | 0.458 | SGOL2 | 0.486 |
| CCNF |
0.399 | LMO1 | 0.459 |
TMEM106B | 0.486 |
| FAM107B |
0.403 | CBX5 | 0.46 | FAM47E | 0.488 |
| HNRNPU |
0.404 | SORBS2 | 0.463 | CBX5 | 0.49 |
| SNTB2 |
0.406 | CBX5 | 0.463 | RNF34 | 0.491 |
| GNA11 |
0.408 |
SREK1IP1 | 0.464 | AMY1A | 0.492 |
| ALPI |
0.409 | SAMD11 | 0.465 | EXD3 | 0.494 |
| DPH3 |
0.41 | MXD3 | 0.468 | PABPC4L | 0.495 |
|
|
|
|
| SUV39H1 | 0.497 |
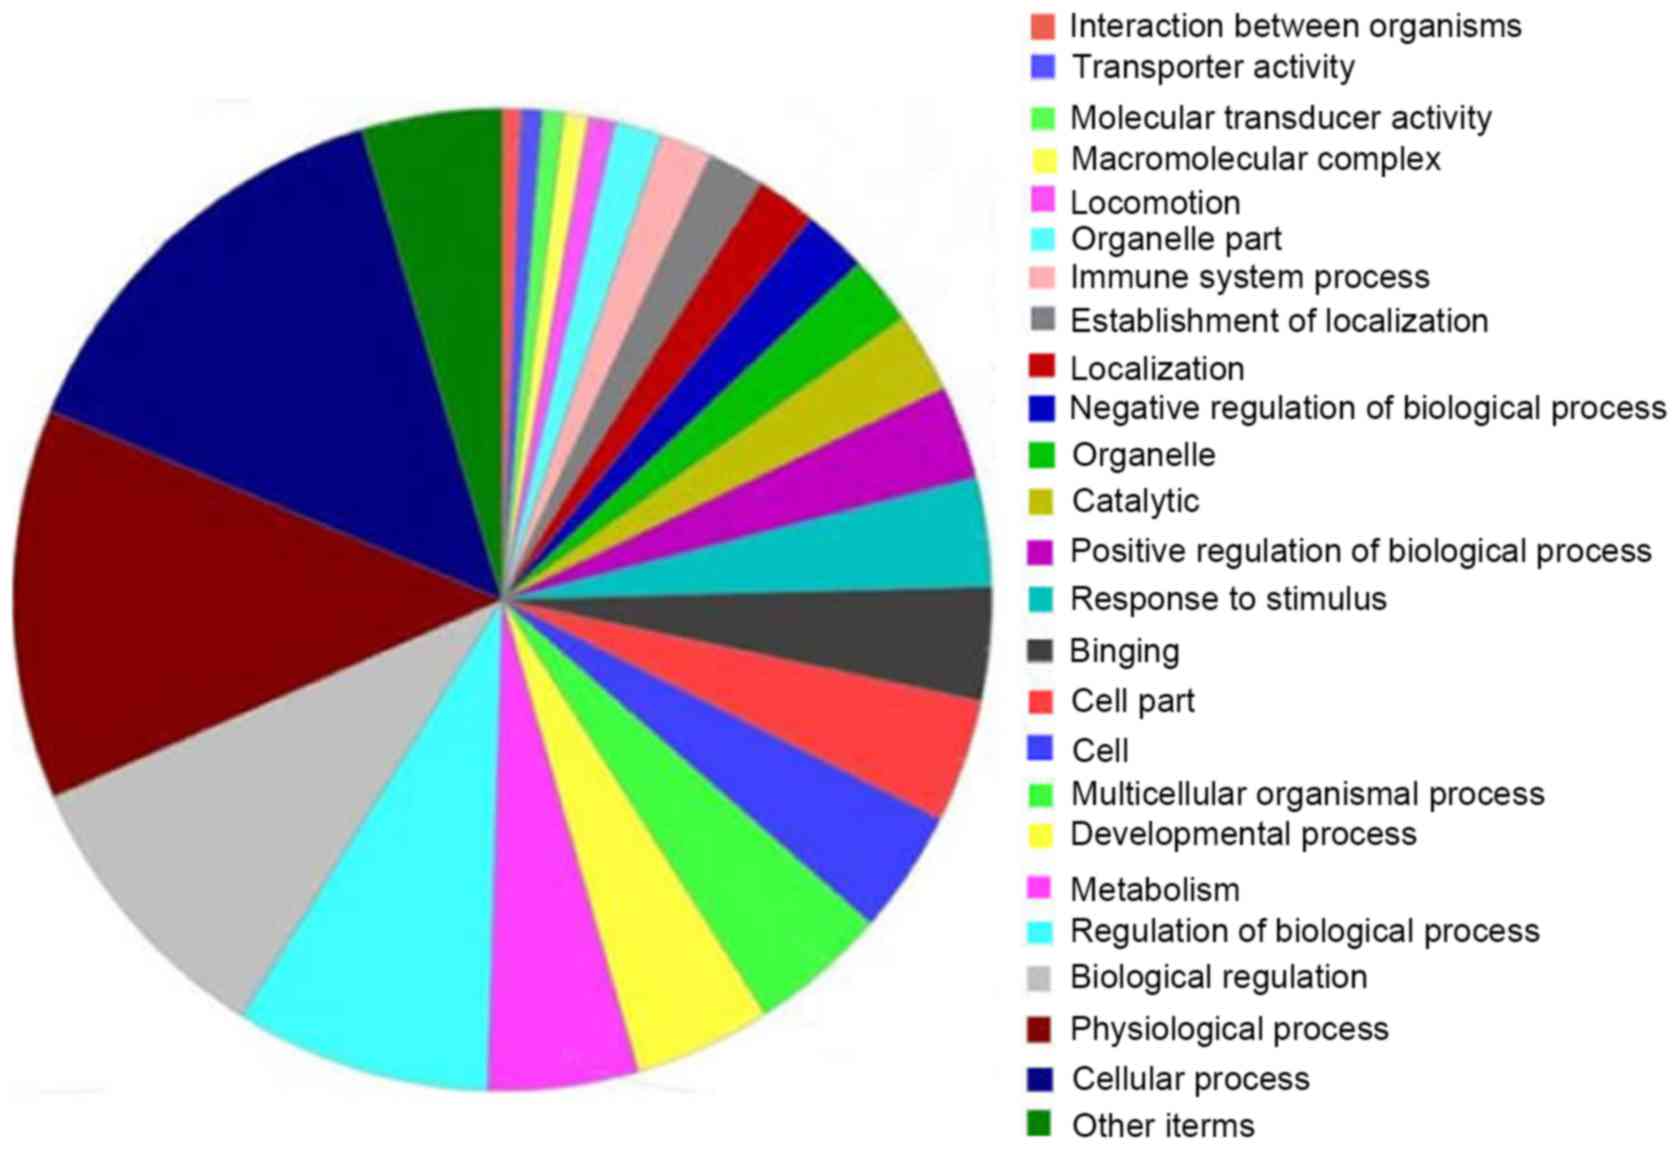
GO enrichment analyses
In order to have a command of the functional
categories of that DEGs involved in and to find out which GO terms
can be strongly enriched or significantly associated with our
selected genes, GO term enrichment analysis was performed by
MAS3.0. As is shown in Fig. 3,
these DEGs were sorted and categorized into 26 different functional
categories by PLCE1 knockdown in ECa109 and EC9706 cells.
While 442, 178 and 94 significant GO terms for these DEGs were
identified in Biological Process, Molecular Function and Cellular
Component.
Remarkably, among the Biological Process,
predominant terms were identified as follows. Firstly, the
downregulated DEGs involved in cell division (GO:0051301), as well
as upregulated DEG linked to cell cycle arrest (GO:0007050) and
negative regulation of cell proliferation (GO:0008285) were
represented, which revealed the inhibition of the
PLCE1-mediated cell might block cell proliferation via these
DEGs. Secondly, upregulated DEGs were enriched in anti-apoptosis
(GO:0006916), negative regulation of apoptosis (GO:0043066),
indicating theses terms might have direct or immediate adverse
effect on apoptosis induction in PLCE1-siRNA-treated Eca109 and
EC9706 cells. Thirdly, upregulated genes were also enriched in
cell-cell signaling (GO:0007267), cell adhesion (GO:0007155), cell
motility (GO:0006928), implying the terms might play a negative
role in regulation of metastasis and invasion of PLCE1
knockdown cells. Fourthly, we also found that many DEGs were
significant enrichment in regulation of transcription,
DNA-dependent (GO:0006355), signal transduction (GO:0007165),
G-protein coupled receptor protein signaling pathway (GO:0007186),
cell surface receptor linked signal transduction (GO:0007166),
which suggested these changes were likely to participate in the
oncogenesis and tumor development of ESCC. To our interest, a
significant proportion of clusters was enriched in ‘response to
virus (GO:0009615)’, ‘immune response (GO:0006955)’, ‘chemotaxis
(GO:0006935)’ and ‘inflammatory response (GO:0006954)’ in the
biological process category, suggesting that the changes related to
these terms might take place during the genesis of ESCC.
Besides, a few terms connected to cytoskeleton
organization were identified from Molecular Function and Cellular
Component, including actin binding (GO:0003779), actin cytoskeleton
(GO:0015629), focal adhesion (GO:0005925), integrin complex
(GO:0008305), indicated that PLCE1 might exert significant
influence in the metastasis, invasion and mobility of ESCC through
the functions of genes implicated in these terms.
KEGG pathway enrichment analyses
To find out how the DEGs from PLCE1 knockdown
influence process of cell biological function, KEGG pathway
enrichment analysis was carried out to identify relevant pathways.
Based on the KEGG pathway analyses, these DEGs were enriched in 46
pathways which changed significantly (q-value <0.05), containing
MAPK, Toll-like receptor, p53, JAK-STAT signaling pathway, small
cell lung cancer, renal cell carcinoma, bladder cancer, prostate
cancer, cytokine-cytokine receptor interaction, focal adhesion,
ECM-receptor interaction concluding consist of ITGA2, Starch and
sucrose metabolism consisting of AMY1A, AMY1B, AMY1B, AMY1C, AMY2A,
AMY2B, AMY2B, glutamate metabolism covering GFPT1, Nitrogen
metabolism extending to NT5E and so on (Table III). The majority of these
pathways were involved in cell biological function, including
proliferation, invasiveness and apoptosis. Nevertheless, compared
with the other signaling pathway, the majority of DEGs were
significantly enriched in MAPK, JAK-STAT, P53, TLRs signaling
pathways and the Focal adhesion. We should therefore concentrate
our interest on the genes associated with the above pathways. The
DEGs involved in the above signaling pathways are represented.
There were alterations involved in the focal adhesion including 5
upregulated and 1 downregulated DEGs. Among the MAPK signaling
pathways -related genes, expression changes mainly occurred in 10
genes, including DUSP6, RELB, FGF2, FOS, DUSP4, DDIT3 (GADD153),
DUSP5, and JUN between the PLCE1 siRNA and control group. The data
of gene chip shown 4 upregulated genes (PMAIPI, SERAIPI (PAI-1),
CDKN1A (P21), GADD45) in P53 signaling pathway, deregulated with a
>2-fold difference following PLCE1 siRNA transfection in
Eca109 and EC9706 cells. There were 7 upregulated genes (STAT1,
FOS, TLR4, IL6, IL-8) with >2-fold changes between the treatment
and un-treatment cell involved in TLRs signaling pathways. Thus,
our results indicated a strong interaction between PLCE1 and
these pathways that DEGs were involved in.
| Table III.KEGG pathway analysis of DEGs in
response to PLCE1 knockdown. |
Table III.
KEGG pathway analysis of DEGs in
response to PLCE1 knockdown.
| Pathway | Count | P-value | Gene |
|---|
| MAPK signaling
pathway | 10 | 2.03E-09 | DUSP6; RELB;
FGF2; FGF13; FOS; DUSP4; DDIT3; GADD45A; DUSP5; JUN |
| Toll-like receptor
signaling pathway | 7 | 7.46E-09 | STAT1; FOS;
TLR4; IL6; JUN; IL8; IRF7 |
| Starch and sucrose
metabolism | 5 | 2.07E-07 | AMY1A; AMY1A;
AMY1B; AMY1C; AMY2A; AMY2A; AMY2B |
| Cytokine-cytokine
receptor interaction | 7 | 4.52E-06 | CXCR4; TNFRSF21;
OSMR; CXCL2; IL6; IL8; VEGFC |
| Focal adhesion | 6 | 1.33E-05 | BIRC3; ITGA2;
CAV1; PAK3; JUN; VEGFC |
| p53 signaling
pathway | 4 | 2.78E-05 | PMAIP1;
SERPINE1; CDKN1A; GADD45A |
| Renal cell
carcinoma | 4 | 3.11E-05 | HIF1A; PAK3;
JUN; VEGFC |
| Bladder cancer | 3 | 0.00016 | CDKN1A; IL8;
VEGFC |
| Jak-STAT signaling
pathway | 4 | 0.00063 | STAT1; OSMR;
IRF9; IL6 |
| Complement and
coagulation cascades | 3 | 0.0007 | PLAUR; SERPINE1;
F3 |
| Melanoma | 3 | 0.00076 | FGF2; FGF13;
CDKN1A |
| B cell receptor
signaling pathway | 3 | 0.00089 | FOS; IFITM1;
JUN |
| Small cell lung
cancer | 3 | 0.00132 | BIRC3; PTGS2;
ITGA2 |
| ErbB signaling
pathway | 3 | 0.00137 | CDKN1A; PAK3;
JUN |
| Regulation of actin
cytoskeleton | 4 | 0.00221 | FGF2; FGF13;
ITGA2; PAK3 |
| T cell receptor
signaling pathway | 3 | 0.0026 | FOS; PAK3;
JUN |
| Leukocyte
transendothelial migration | 3 | 0.00349 | CXCR4; CLDN1;
ICAM1 |
| Cell adhesion
molecules (CAMs) | 3 | 0.00465 | CLDN1; ICAM1;
CNTN1 |
| mTOR signaling
pathway | 2 | 0.00751 | HIF1A;
VEGFC |
| Pathogenic
Escherichia coli infection - EHEC | 2 | 0.00837 | CLDN1;
TLR4 |
| Pathogenic
Escherichia coli infection - EPEC | 2 | 0.00837 | CLDN1;
TLR4 |
| Epithelial cell
signaling in Helicobacter pylori infection | 2 | 0.01328 | JUN;
IL8 |
| Pancreatic
cancer | 2 | 0.01438 | STAT1;
VEGFC |
| Colorectal
cancer | 2 | 0.01874 | FOS;
JUN |
| Hematopoietic cell
lineage | 2 | 0.02002 | ITGA2;
IL6 |
| Apoptosis | 2 | 0.02089 | BIRC3;
IRAK2 |
| Neuroactive
ligand-receptor interaction | 3 | 0.02635 | GABBR1; PTGER4;
ADRB2 |
| GnRH signaling
pathway | 2 | 0.02939 | GNA11;
JUN |
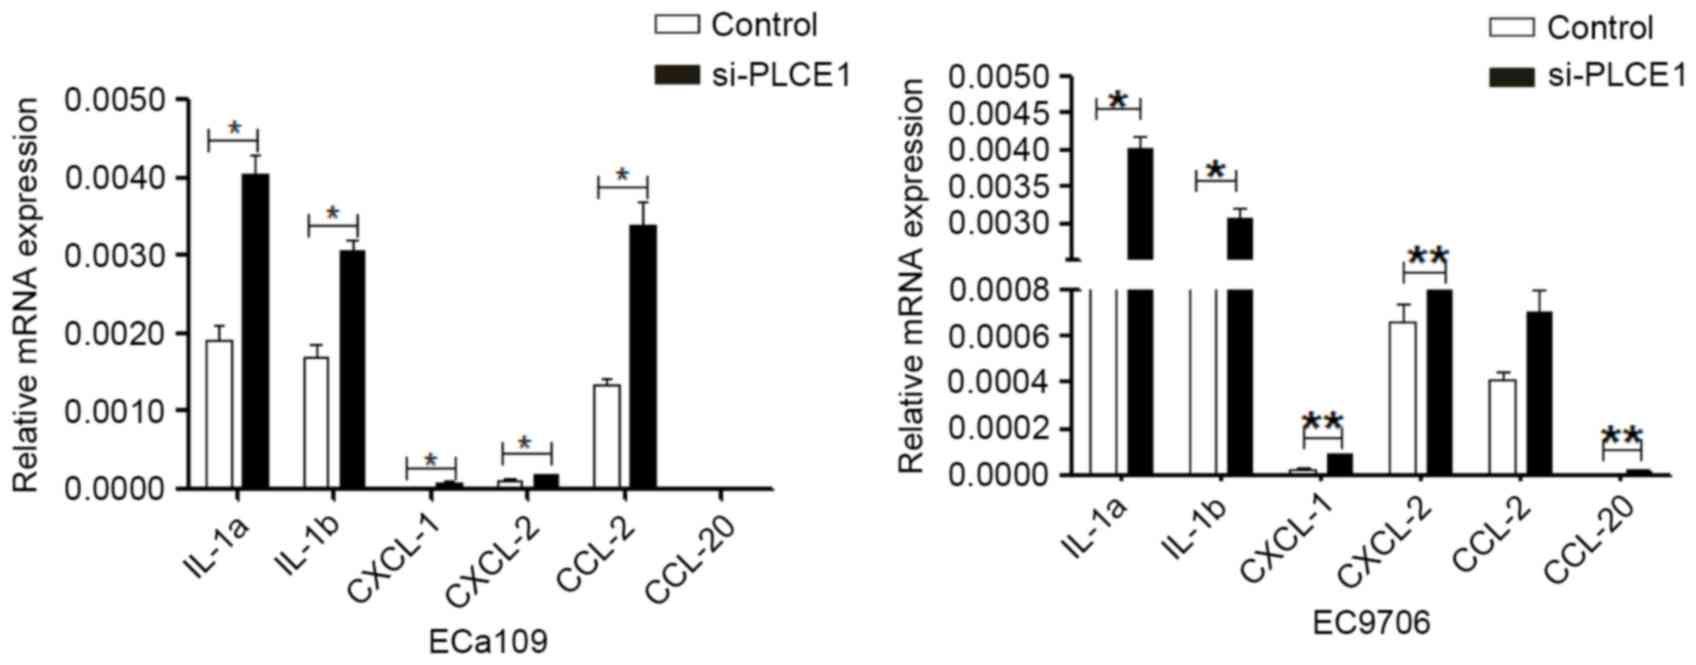
Confirmation of genes associated with
inflammatory factors by qRT-PCR after PLCE1-siRNA transfection
To approve or confute the results of our mRNA
microarray analysis, qRT-PCR analysis was performed to evaluate
mRNA levels of six pivotal DEGs selected in EC9706 and ECa109
transfected with PLCE1-siRNA. As expected, the results were
consistent with the results of microarray findings that implicated
involvement of IL-1a, IL-1b, CXCL-1, CXCL-2, CCl-2, CCL-20 genes.
Compared with control group, by Q-RT-PCR analysis, all 6 genes were
upregulated by PLCE1-siRNA treatment of EC9706 and ECa109
cells (Fig. 4). The results were
corresponded to that of microarray data, which bore out the
reliability of the results.
Discussion
ESCC, which is the fourth leading cause of cancer
death, is one of the most aggressively malignant tumors in China
(17). It was reported that
PLCE1 was a susceptibility gene in ESCC. Although
PLCE1 has been extensively studied, it was not consistent
with its role in cancer. Previous findings demonstrated
PLCE1 has been identified as a tumor-suppressor gene of
colorectal tumor (18). However,
PLCE1 has also acted as a novel oncogene in a variety of
human tumors, such as bladder cancer (9) and head and neck cancer (8). Hence, PLCE1 promoting or
inhibiting the occurrence and development of tumor is still to be
further studied. Our previous studies showed increased expression
of PLCE1 could be used as a potential biomarker for the
early diagnosis and poor prognosis of ESCC (16). Furthermore, we also found
PLCE1 knockdown effectively inhibited cell
growth/proliferation and increased apoptosis as well as reduced the
invasion and migration in ESCC (4). Our results demonstrated that
PLCE1 could play a tumor-oncogenic function in ESCC. Thus,
it would be of great use to have systematic understanding of the
functions of PLCE1. Here we presented a comprehensive
analysis of mRNA profile of PLCE1 knockdown in ESCC cells by
multiple bioinformatic analyses.
In the present study, a total of 223 DEGs, including
168 upregulated and 55 downregulated DEGs, were identified. In
order to have a command of the functions of these DEGs, the DEGs
were analyzed by GO enrichment tools. In the present study, these
upregulated DEGs were significantly enriched in cell cycle arrest
(PPP1R15A, DDIT3, CDKN1A, GADD45A, IL8), negative regulation of
cell proliferation (PTGS2, FGF2, IL6, CDKN1A, IFITM1, IL8),
apoptosis (FGF2, CXCR4, TNFRSF21, PPP1R15A, RNF34, GADD45A,
TNFAIP3, IER3, PHLDA1), cell-cell signaling (STC2, FGF2, ADM,
GDF15, ISG15, IL8), cell adhesion (CLDN1, AMIGO2, RND3, ITGA2, F3),
these results supported such an assumption that oncogenic
PLCE1 was involved in esophageal proliferation, apoptosis
and metastasis. Besides that, KEGG pathway enrichment analysis was
carried out to identify relevant pathways, these DEGs were
identified significantly enriched in 46 pathways. Among them, DEGs
are closely linked to a variety of different signaling networks,
including the MAPK, p53, JAK-STAT, Toll-like receptor signaling
pathways. A following discussion focuses mainly on the alteration
of genes involved primarily in MAPK, p53, Toll-like
receptor signaling pathways.
In the MAPK signaling pathway, several genes from
the MAPK signaling pathway are altered in cells of PLCE1
downregulation, including 10 upregulated genes (DUSP6, DUSP4,
DUSP5, RELB, FGF2, FGF13, FOS, DDIT3, GADD45A, JUN).
Mitogen-activated protein kinase (MAPK) pathways, which has
extracellular regulated kinases 1 and 2 (ERK1/2), c-Jun-N-terminal
and p38, regulate many cellular functions including cell
proliferation, differentiation, migration and apoptosis. Study
showed that CDC25 homology domain of PLCE exhibited GEF activity
toward Rap1, transiting from the Rap1.GDP-bound state to the
Rap1.GTP-bound state facilitated by GEF, leading to the
accumulation of the formation of Rap1GTP, thereby, which in
turn stimulates B-Raf/MEK/ERK pathways within the cell, in
addition, activation of Rap2B stimulates PLCE1, then activating
H-Ras results in cascade response corresponding to MAPK, finally
MAPK was activated, and promoting cell proliferation. In addition,
our previous study has shown that ERKl protein expression was
significantly increased in the ESCC tissues (19), thus it can be seen that
PLCE1 might promote the incidence of esophageal carcinoma
indirectly via MAPK/ERK1/2 pathways. Fibroblast growth
factor 2 (FGF2) activated a series of intracellular signal
transduction pathways by tyrosine kinase receptors (FGFR) to form a
complete pathway: FGF2/MAPK/ERK1/2 (20,21),
which finally induces various cellular activities, including
mitosis, differentiation, proliferation, and cell migration
(22,23). However, DUSP6, DUSP5 and DUSP4,
belonging to dual specificity phosphatase (DUSP) family, limits
over-activation of the FGFs/MAPK/ERKl/2 signal transduction
pathways in a negative feedback manner (24). This implies that the PLCE1
siRNA-induced apoptosis and proliferative inhibition in ESCC are
related to DUSPs/FGFs/MAPK/ERKl/2 signal pathways. These findings
provide a novel mentality to study the pathogenesis of ESCC in MAPK
signaling pathway.
As known, p53 is one of the most important tumor
suppressor genes in cancer-associated diseases and plays a crucial
role in regulating cell cycle arrest, apoptosis and senescence
(25), recent study also revealed
p53 is involved in PLCE1-knockdown induced apoptosis in
Esophageal Cancer cells (26). Our
results demonstrated 2 key upregulated components CDKN1A (P21) and
GADD45A involved in the p53 signaling pathway were upregulated in
PLCE1 siRNA treated cells. Following the downstream target
of p53, p21 and GADD45A are activated and block the cell cycle at
the G1 and G2 phases (27,28). This result suggests that
PLCE1 inhibition may lead to an increase in p53 function by
upregulating CDKN1A (P21) and GADD45A, and that a new
PLCE1/P53/P21 pathway is involved in PLCE1-knockdown
induced apoptosis and cell cycle arrest in ESCC. In addition,
cellular senescence is primarily regulated by p53/p21 and p16/pRb
pathways, where the p53/p21 pathway mediates the replicative
senescence and plays crucial roles in DNA damage response (29). Therefore, PLCE1 suppression
might have an effect on the p53/p21 signaling pathway
through p53 and p21 upregulation, leading to proliferation
inhibition and inducing cell senescence and in Eca109 and EC9706
cells.
In this study, we have shown that inflammation or
immune-related molecules (TLR4, IL-8, IL-6, CXCL2) were
significantly increased after PLCE1 suppression, and the
results by qRT-PCR analysis were in agreement with that of
microarray data. However, these results did not agree with recent
reports in which PLCE was shown to enhance tumor development in
many human cancers (30–32), by increasing the production of
inflammatory cytokines in local tissues, obviously, our results
suggested that PLCE1 might be involved a yet unknown
signaling pathway linking tumor promotion and cytokines.
Interestingly, it was reported that the expression of cytokines
IL-1a, IL-6, and IL-8 initiated and supported cellular senescence
(33). Similar report also showed
that IL-1a activated tumor-suppressive pathways to maintain
senescent growth (34).
Nevertheless, cellular senescence restricts unlimited cell
proliferation and plays an essential role in tumor suppression.
Therefore, we investigate whether PLCE1 could enhance
carcinogenesis and progression of ESCC via loss of
cytokines-supported senescence. In addition, it was well recognized
that toll-like receptor 4 (TLR4), an intensively studied member in
the TLR family, results in transcriptional activation of
pro-inflammatory genes including cytokines (IL-1, IL-6, CXCL-2)
(35). Importantly, TLR4
activation inhibited hepatocellular carcinogenesis due to immune
networks (IL-1a/b, IL-6, CXCL-2) triggering cellular senescence
(36). These results taken
together suggested PLCE1 could decrease cellular senescence
via inhibition of the TLR4 signaling pathway, which contributed to
the development of ESCC. In future studies, it will be worthwhile
to determine whether PLCE1 has a role in esophageal
carcinoma by loss of TLR4-mediated immunity supporting
senescence.
In summary, the comprehensive understanding the role
of PLCE1 in ESCC was obtained by bioinformatics workflow of
mRNA profile after PLCE1 knockdown by multiple
bioinformatics analysis. A total of 223 DEGs, 168 DEGs upregulated
and 55 downregulated DEGs, were identified in
PLCE1-siRNA-treated cells compared with the control cells.
Alterations genes in the Focal adhesion, MAPK, P53
and TLRs signaling pathways may be important during PLCE1
siRNA-induced apoptosis, and proliferation, invasive and migrant
inhibition of Eca109 and EC9706 cells. These findings provide
information useful for combination targeted therapy in
PLCE1-relevant neoplasm. We need to characterize DEGs and
identify the exact molecular mechanism PLCE1 involved in
proliferation, apoptosis, invasion and metastasis.
Acknowledgements
This study was supported by Grants from the National
Natural Science Foundation of China (nos. 81560399, 81360358 and
81460362), the Major Science and Technology Projects of Shihezi
University (no. gxjs2014 zdgg06), the Applied Basic Research
Projects of Xinjiang Production and Construction Corps (no.
2016AG020), the high level talent project of Shihezi University
(no. RCZX201533), and the Foundation for Distinguished Young
Scholars of Shihezi University (no. 2015ZRKXJQ02).
References
|
1
|
Liu M, Hu Y, Zhang MF, Luo KJ, Xie XY, Wen
J, Fu JH and Yang H: MMP1 promotes tumor growth and metastasis in
esophageal squamous cell carcinoma. Cancer Lett. 377:97–104. 2016.
View Article : Google Scholar : PubMed/NCBI
|
|
2
|
Wu M, Liu AM, Kampman E, Zhang ZF, Van't
Veer P, Wu DL, Wang PH, Yang J, Qin Y, Mu LN, et al: Green tea
drinking, high tea temperature and esophageal cancer in high- and
low-risk areas of Jiangsu Province, China: A population-based
case-control study. Int J Cancer. 124:1907–1913. 2009. View Article : Google Scholar : PubMed/NCBI
|
|
3
|
Cui XB, Zhang SM, Xu YX, Dang HW, Liu CX,
Wang LH, Yang L, Hu JM, Liang WH, Jiang JF, et al: PFN2, a novel
marker of unfavorable prognosis, is a potential therapeutic target
involved in esophageal squamous cell carcinoma. J Transl Med.
14:1372016. View Article : Google Scholar : PubMed/NCBI
|
|
4
|
Cui XB, Li S, Li TT, Peng H, Jin TT, Zhang
SM, Liu CX, Yang L, Shen YY, Li SG, et al: Targeting oncogenic
PLCE1 by miR-145 impairs tumor proliferation and metastasis of
esophageal squamous cell carcinoma. Oncotarget. 7:1777–1795. 2016.
View Article : Google Scholar : PubMed/NCBI
|
|
5
|
Abnet CC, Freedman ND, Hu N, Wang Z, Yu K,
Shu XO, Yuan JM, Zheng W, Dawsey SM, Dong LM, et al: A shared
susceptibility locus in PLCE1 at 10q23 for gastric adenocarcinoma
and esophageal squamous cell carcinoma. Nat Genet. 42:764–767.
2010. View
Article : Google Scholar : PubMed/NCBI
|
|
6
|
Wang LD, Zhou FY, Li XM, Sun LD, Song X,
Jin Y, Li JM, Kong GQ, Qi H, Cui J, et al: Genome-wide association
study of esophageal squamous cell carcinoma in Chinese subjects
identifies susceptibility loci at PLCE1 and C20orf54. Nat Genet.
42:759–763. 2010. View
Article : Google Scholar : PubMed/NCBI
|
|
7
|
Wu C, Hu Z, He Z, Jia W, Wang F, Zhou Y,
Liu Z, Zhan Q, Liu Y, Yu D, et al: Genome-wide association study
identifies three new susceptibility loci for esophageal
squamous-cell carcinoma in Chinese populations. Nat Genet.
43:679–684. 2011. View
Article : Google Scholar : PubMed/NCBI
|
|
8
|
Ma H, Wang LE, Liu Z, Sturgis EM and Wei
Q: Association between novel PLCE1 variants identified in published
esophageal cancer genome-wide association studies and risk of
squamous cell carcinoma of the head and neck. BMC Cancer.
11:2582011. View Article : Google Scholar : PubMed/NCBI
|
|
9
|
Ou L, Guo Y, Luo C, Wu X, Zhao Y and Cai
X: RNA interference suppressing PLCE1 gene expression decreases
invasive power of human bladder cancer T24 cell line. Cancer Genet
Cytogenet. 200:110–119. 2010. View Article : Google Scholar : PubMed/NCBI
|
|
10
|
Ling Y, Chunli L, Xiaohou W and Qiaoling
Z: Involvement of the PLCε/PKCα pathway in human BIU-87 bladder
cancer cell proliferation. Cell Biol Int. 35:1031–1036. 2011.
View Article : Google Scholar : PubMed/NCBI
|
|
11
|
Zhang Y, Yan L, Zhao Y, Ou L, Wu X and Luo
C: Knockdown of phospholipase C-epsilon by short-hairpin
RNA-mediated gene silencing induces apoptosis in human bladder
cancer cell lines. Cancer Biother Radiopharm. 28:233–239. 2013.
View Article : Google Scholar : PubMed/NCBI
|
|
12
|
Xue W, Zhu M, Wang Y, He J and Zheng L:
Association between PLCE1 rs2274223 A >G polymorphism and cancer
risk: Proof from a meta-analysis. Sci Rep. 5:79862015. View Article : Google Scholar : PubMed/NCBI
|
|
13
|
Yuan J, Li Y, Tian T, Li N, Zhu Y, Zou J,
Gao J and Shen L: Risk prediction for early-onset gastric
carcinoma: A case-control study of polygenic gastric cancer in Han
Chinese with hereditary background. Oncotarget. 7:33608–33615.
2016. View Article : Google Scholar : PubMed/NCBI
|
|
14
|
Oka M, Edamatsu H, Kunisada M, Hu L,
Takenaka N, Dien S, Sakaguchi M, Kitazawa R, Norose K, Kataoka T
and Nishigori C: Enhancement of ultraviolet B-induced skin tumor
development in phospholipase Cε-knockout mice is associated with
decreased cell death. Carcinogenesis. 31:1897–1902. 2010.
View Article : Google Scholar : PubMed/NCBI
|
|
15
|
Wang Y, Wu X, Ou L, Yang X, Wang X, Tang
M, Chen E and Luo C: PLCε knockdown inhibits prostate cancer cell
proliferation via suppression of Notch signalling and nuclear
translocation of the androgen receptor. Cancer Lett. 362:61–69.
2015. View Article : Google Scholar : PubMed/NCBI
|
|
16
|
Chen YZ, Cui XB, Hu JM, Zhang WJ, Li SG,
Yang L, Shen XH, Liu CX, Pan QF, Yu SY, et al: Overexpression of
PLCE1 in Kazakh esophageal squamous cell carcinoma: Implications in
cancer metastasis and aggressiveness. APMIS. 121:908–918. 2013.
View Article : Google Scholar : PubMed/NCBI
|
|
17
|
Cui XB, Pang XL, Li S, Jin J, Hu JM, Yang
L, Liu CX, Li L, Wen SJ, Liang WH, et al: Elevated expression
patterns and tight correlation of the PLCE1 and NF-κB signaling in
Kazakh patients with esophageal carcinoma. Med Oncol. 31:7912014.
View Article : Google Scholar : PubMed/NCBI
|
|
18
|
Wang X, Zhou C, Qiu G, Yang Y, Yan D, Xing
T, Fan J, Tang H and Peng Z: Phospholipase C epsilon plays a
suppressive role in incidence of colorectal cancer. Med Oncol.
29:1051–1058. 2012. View Article : Google Scholar : PubMed/NCBI
|
|
19
|
Cui X, Li S, Li T, Pang X, Zhang S, Jin J,
Hu J, Liu C, Yang L, Peng H, et al: Significance of elevated ERK
expression and its positive correlation with EGFR in Kazakh
patients with esophageal squamous cell carcinoma. Int J Clin Exp
Pathol. 7:2382–2391. 2014.PubMed/NCBI
|
|
20
|
Akl MR, Nagpal P, Ayoub NM, Tai B, Prabhu
SA, Capac CM, Gliksman M, Goy A and Suh KS: Molecular and clinical
significance of fibroblast growth factor 2 (FGF2/bFGF) in
malignancies of solid and hematological cancers for personalized
therapies. Oncotarget. 7:44735–44762. 2016. View Article : Google Scholar : PubMed/NCBI
|
|
21
|
Pierozan P, Biasibetti H, Schmitz F, Ávila
H, Parisi MM, Barbe-Tuana F, Wyse AT and Pessoa-Pureur R:
Quinolinic acid neurotoxicity: Differential roles of astrocytes and
microglia via FGF-2-mediated signaling in redox-linked cytoskeletal
changes. Biochim Biophys Acta. 1863:3001–3014. 2016. View Article : Google Scholar : PubMed/NCBI
|
|
22
|
He Q, Ren X, Chen J, Li Y, Tang X, Wen X,
Yang X, Zhang J, Wang Y, Ma J and Liu N: miR-16 targets fibroblast
growth factor 2 to inhibit NPC cell proliferation and invasion via
PI3K/AKT and MAPK signaling pathways. Oncotarget. 7:3047–3058.
2016. View Article : Google Scholar : PubMed/NCBI
|
|
23
|
Lee MN, Kim JW, Oh SH, Jeong BC, Hwang YC
and Koh JT: FGF2 stimulates COUP-TFII expression via the MEK1/2
pathway to inhibit osteoblast differentiation in C3H10T1/2 cells.
PLoS One. 11:e01592342016. View Article : Google Scholar : PubMed/NCBI
|
|
24
|
Rios P, Nunes-Xavier CE, Tabernero L, Köhn
M and Pulido R: Dual-specificity phosphatases as molecular targets
for inhibition in human disease. Antioxid Redox Signal.
20:2251–2273. 2014. View Article : Google Scholar : PubMed/NCBI
|
|
25
|
Majumder M, House R, Palanisamy N, Qie S,
Day TA, Neskey D, Diehl JA and Palanisamy V: Correction:
RNA-binding protein FXR1 regulates p21 and TERC RNA to bypass
p53-mediated cellular senescence in OSCC. PLoS Genet.
12:e10064112016. View Article : Google Scholar : PubMed/NCBI
|
|
26
|
Li Y, An J, Huang S, Liao H, Weng Y, Cai S
and Zhang J: PLCE1 suppresses p53 expression in esophageal cancer
cells. Cancer Invest. 32:236–240. 2014. View Article : Google Scholar : PubMed/NCBI
|
|
27
|
Tront JS, Huang Y, Fornace AJ Jr, Hoffman
B and Liebermann DA: Gadd45a functions as a promoter or suppressor
of breast cancer dependent on the oncogenic stress. Cancer Res.
70:9671–9681. 2010. View Article : Google Scholar : PubMed/NCBI
|
|
28
|
Cho JG, Park S, Lim CH, Kim HS, Song SY,
Roh TY, Sung JH, Suh W, Ham SJ, Lim KH and Park SG: ZNF224, Kruppel
like zinc finger protein, induces cell growth and
apoptosis-resistance by down-regulation of p21 and p53 via
miR-663a. Oncotarget. 7:31177–31190. 2016. View Article : Google Scholar : PubMed/NCBI
|
|
29
|
Park H, Kim CH, Jeong JH, Park M and Kim
KS: GDF15 contributes to radiation-induced senescence through the
ROS-mediated p16 pathway in human endothelial cells. Oncotarget.
7:9634–9644. 2016. View Article : Google Scholar : PubMed/NCBI
|
|
30
|
Li M, Edamatsu H, Kitazawa R, Kitazawa S
and Kataoka T: Phospholipase Cepsilon promotes intestinal
tumorigenesis of Apc(Min/+) mice through augmentation of
inflammation and angiogenesis. Carcinogenesis. 30:1424–1432. 2009.
View Article : Google Scholar : PubMed/NCBI
|
|
31
|
Yang X, Ou L, Tang M, Wang Y, Wang X, Chen
E, Diao J, Wu X and Luo C: Knockdown of PLCε inhibits inflammatory
cytokine release via STAT3 phosphorylation in human bladder cancer
cells. Tumour Biol. 36:9723–9732. 2015. View Article : Google Scholar : PubMed/NCBI
|
|
32
|
Oka M, Edamatsu H, Kunisada M, Hu L,
Takenaka N, Sakaguchi M, Kataoka T and Nishigori C: Phospholipase
Cε has a crucial role in ultraviolet B-induced
neutrophil-associated skin inflammation by regulating the
expression of CXCL1/KC. Lab Invest. 91:711–718. 2011. View Article : Google Scholar : PubMed/NCBI
|
|
33
|
Oubaha M, Miloudi K, Dejda A, Guber V,
Mawambo G, Germain MA, Bourdel G, Popovic N, Rezende FA, Kaufman
RJ, et al: Senescence-associated secretory phenotype contributes to
pathological angiogenesis in retinopathy. Sci Transl Med.
8:362ra1442016. View Article : Google Scholar : PubMed/NCBI
|
|
34
|
Freund A, Orjalo AV, Desprez PY and
Campisi J: Inflammatory networks during cellular senescence: Causes
and consequences. Trends Mol Med. 16:238–246. 2010. View Article : Google Scholar : PubMed/NCBI
|
|
35
|
Lin H, Yan J, Wang Z, Hua F, Yu J, Sun W,
Li K, Liu H, Yang H, Lv Q, et al: Loss of immunity-supported
senescence enhances susceptibility to hepatocellular carcinogenesis
and progression in Toll-like receptor 2-deficient mice. Hepatology.
57:171–182. 2013. View Article : Google Scholar : PubMed/NCBI
|
|
36
|
Wang Z, Yan J, Lin H, Hua F, Wang X, Liu
H, Lv X, Yu J, Mi S, Wang J and Hu ZW: Toll-like receptor 4
activity protects against hepatocellular tumorigenesis and
progression by regulating expression of DNA repair protein Ku70 in
mice. Hepatology. 57:1869–1881. 2013. View Article : Google Scholar : PubMed/NCBI
|