Introduction
The disruption of homeostasis causes stress in
response to damage to the body. However, sustained stress can lead
to organ injury and diseases, including hypertension, diabetes,
gastric ulcers and cancer. Gastric lesions are a typical organ
injury associated with stress (1).
A water immersion restraint stress (WRS) model, which has been
widely used in investigating stress-associated organ injury,
imitates the clinical acute gastric lesions resulting from surgery,
trauma and sepsis (2). Elucidation
of the mechanism underlying gastric injury induced by stress, and
the development of specific therapeutic drugs are practically and
clinically important. Physiological and psychological stress are
involved in the pathogenesis of gastric ulceration. Anxiety,
depression, helplessness and fear are considered to be the
psychological responses (3).
Neurohormonal and immunological activation are incorporated in the
physiological responses, and these two systems can interact under
circumstances of stress (4,5).
However, the mechanisms underlying stress-induced acute gastric
lesions remain to be elucidated.
The novel gastric dramatic downrelated gene (GDDR),
which was also known as gastrokine 2, was first cloned using the
Ends-Marathon Racein method, described in our previous study
(6). The expression of GDDR has
been confirmed to be high in gastric mucosa epithelial cells in
particular (7), however, the
expression of GDDR is significantly reduced in gastric cancer
(8). In the gastrointestinal
tract, the secretion of GDDR is regulated by a series of cytokines,
including interleukin (IL)-8 and IL-6, in addition to transforming
growth factors (TGF)s (9). The
loss of GDDR drives premalignant gastric inflammation and tumor
progression (10). Poor prognosis
and lymph node metastasis in gastric cancer have been closely
linked to the loss of GDDR (11).
The expression of GDDR may suppress cancer cell proliferation
through a TFF1-dependent manner, and induces apoptosis through the
extrinsic apoptotic pathway (12,13).
Therefore, GDDR contributes to gastric mucosa homeostasis (14) and acts as a putative tumor
suppressor (15). The function of
GDDR remains to be fully elucidated unclear, however our previous
study (16) found that GDDR
aggravated stress-induced gastric lesions, however, no significant
differences were found between wild-type (WT) mice and
GDDR-knockout (KO) mice without stress.
As it was previously shown that the expression of
GDDR in gastric cancer significantly aggravated gastric lesions,
based on biological functions and pathways analysis, the present
study aimed to examine the process underlying gastric lesions at
the molecular level, and provide insight for the identification of
potential candidate biomarkers for drug targets, diagnosis and
prognosis.
Materials and methods
Formation of WRS-induced gastric
mucosal lesions in mice
A total of 8 KO mice (male; age, 6–8 weeks; weight,
~20 g) were purchased from the Mutant Mouse Resource Research
Center (Sacramento, CA, USA). The handling and care of the animals
was implemented with reference to the National Institutes of Health
guidelines. The temperature within the cages was controlled at
25±3°C, and the humidity was kept at 50±5%. Mice were given free
access to water and food. The present study was performed following
the approval of the Animal Experimentation Ethics Committee of
Fudan University (Shanghai, China). The WRS model used in the
present study has been widely used in investigations of gastric
lesions (17). The WRS model can
mimic acute gastric lesions in humans to a high degree. GDDR shows
stomach-restricted expression and is highly conserved among mammals
(18); therefore, GDDR shares
similar functions among mammals. Prior to each experiment, the
animals were starved for 24 h. The immersing of animals in water
was performed to the extent of the xiphoid process in a restraint
cage as previously described (19). Following exposure to stress for the
indicated duration (0 to 8 h), the animals were sacrificed. The
stomachs of the animals were removed and immersed in RNAlater
(Thermo Fisher Scientific, Inc., Waltham, MA, USA) for 1 day. By
cutting along the greater curvature, the stomachs were cut open and
used for RNA extraction.
RNA extraction and quality
control
TRIzol® reagent (Thermo Fisher
Scientific, Inc.) was used to extract total RNA from each sample,
according to the manufacturer's protocol. The concentrations of all
samples were determined using a NanoDrop ND-2000 spectrophotometer
(Thermo Fisher Scientific, Inc.). The Agilent Bioanalyzer 2100
(Agilent Technologies, Inc., Santa Clara, CA, USA) was used to
evaluate the quality.
Preparation of whole transcriptome
libraries and deep sequencing
The Ion Total RNA-Seq kit v2 (Thermo Fisher
Scientific, Inc.) was used to construct the sequencing library of
the RNA samples in accordance with the manufacturer's protocol
(Thermo Fisher Scientific, Inc.). In brief, Dynabeads mRNA
purification (Thermo Fisher Scientific, Inc.) was utilized for
refining poly(A)-containing mRNA. Fragmentation of the mRNA was
implemented with the use of RNaseIII, following which the mRNA was
purified. Subsequently, reverse transcription of the RNA fragments
was performed by SuperScript™ II Reverse Transcriptase (Thermo
Fisher Scientific, Inc.). The reverse transcribed mRNA was then
amplified into double-stranded cDNA (42°C, 50 min; 70°C, 15 min),
and was purified using a magnetic bead-based approach, following
which concentrations of the samples were detected for the cDNA
library. Sequencing quality was analyzed by RSeQC (version 2.6;
http://rseqc.sourceforge.net/).
Raw read filtering and mapping
The filtered raw reads ≥50 bp were used for the
mapping. The TopHat (version 2.0.9; http://ccb.jhu.edu/software/tophat/index.shtml) tool
was used for the RNA sequencing (RNA-seq) data mapping analysis
based on spliced mapping, which is able to immediately and
accurately identify the eukaryotic splicing (20). EdgeR (version 3.5; http://www.bioconductor.org/packages/release/bioc/html/edgeR.html)
was used to identified the differentially-expressed genes
(DEGs).
Gene Ontology (GO) and pathway
enrichment analysis of DEGs
For the functional analysis of the DEGs, GO analysis
was used to annotate genes and gene products, and to identify
characteristic biological properties for high-throughput
transcriptome or genome data (21). Kyoto Encyclopedia of Genes and
Genomes pathway (KEGG; http://www.genome.jp/) was used for systematic genetic
functional analysis, to connect higher-order functional information
with genomic information (22).
The genes were mapped to the relevant biological annotation in the
Database for Annotation, Visualization and Integrated Discovery
(DAVID; https://david.ncifcrf.gov/) to
perform high-throughput gene functional analysis (23). P<0.05 was considered to indicate
a statistically significant difference.
Co-expression network
For each gene pair, the Pearson correlation
coefficient was calculated and important correlation pairs were
selected in order to establish the network (24). The degree of centrality of a gene
in the network was measured to determine the relative significance.
By definition, the degree of centrality is the number of links of
one node relative to another (25).
Integrative analysis of
protein-protein interaction (PPI) networks and modules
The Search Tool for the Retrieval of Interactive
Genes (STRING) database is an online tool for evaluating PPI
information. The STRING database (version 10.0; https://string-db.org/) contains 9,600,000 types of
protein in 2,000 organisms. For the assessment of interactions
among DEGs in the present study, the DEGs were uploaded to the
STRING database, and only interactions with a composite score
>0.4, which were experimentally validated, were considered to be
significant. Cytoscape software (version 3.5.1; www.cytoscape.org) was then used to construct the PPI
networks. Plug-in Molecular Complex Detection (MCODE) was then
utilized for screening the PPI network modules in Cytoscape. The
outcomes of the pathway and functional enrichment analysis were
used for analyzing DEGs in the modules.
Reverse-transcription-quantitative
polymerase chain reaction (RT-qPCR) analysis
The RT-qPCR assay was performed on the CFX96 Touch™
(Bio-Rad Laboratories, Inc., Hercules, CA, USA). According to the
manufacturer's protocol, TRIzol® reagent (Thermo Fisher
Scientific, Inc.) was used to extract RNA from each sample.
According to the manufacturer's protocol, cDNA synthesis was
performed from 1 µg RNA with the use of a FastQuant RT kit (Tiangen
Biotech Co., Ltd., Beijing, China). Subsequently, the PCR mixtures
(25 µl) were prepared in triplicate, each containing 12.5 µl
SYBR® Premix Ex Taq (Takara Bio, Inc., Otsu, Japan), 1
µl of cDNA template, 0.5 µl primer (10 mM; Genewiz, Inc., Suzhou,
China) and 3.6 ml DEPC-treated water. The primers included the
following: Chemokine (C-X-C motif) ligand 2 (Cxcl2) forward,
5′-CCAACCACCAGGCTACAGG-3′ and reverse, 5′-GCGTCACACTCAAGCTCTG-3′;
Tgf-β1 forward, 5′-CTCCCGTGGCTTCTAGTGC-3′ and reverse,
5′-GCCTTAGTTTGGACAGGATCTG-3′; IL-1β forward, 5′GCA ACT GTT CCT GAA
CTC AAC T-3′ and reverse, 5′-ATCTTTTGGGGTCCGTCAACT-3′; insulin II
(Ins2) forward, 5′-GCTTCTTCTACACACCCATGTC-3′ and reverse,
5′-AGCACTGATCTACAATGCCAC-3′; serine/threonine kinase 2 (Sgk2)
forward, 5′-CCATTGGTTACCTTCACTCTCTC-3′ and reverse,
5′-GTCTCCTCAGGCTCTACACAT-3′; tuberous sclerosis 1 (Tsc1) forward,
5′-ACTCTCCCTTCTACCGAGACA-3′ and reverse,
5′-GAGGCTGCCGAATGAGTCTTC-3′; erb-B2 receptor tyrosine kinase 3
(Erbb3) forward, 5′-AAGTGACAGGCTATGTACTGGT-3′ and reverse,
5′-GCTGGAGTTGGTATTGTAGTTCA-3′; heparin-binding epidermal growth
factor-like growth factor (Hbegf) forward,
5′-CGGGGAGTGCAGATACCTG-3′ and reverse, 5′-TTCTCCACTGGTAGAGTCAGC-3′;
prostaglandin-endoperoxide synthase 2 (Ptgs2) forward,
5′-TTCAACACACTCTATCACTGGC-3′ and reverse,
5′-AGAAGCGTTTGCGGTACTCAT-3′; adhesion G protein-coupled receptor B1
(Adgrb1) forward, 5′-TTGCTCCACTCCTGCTGTTAC-3′ and reverse,
5′-GTAGCCGAAGAACTTTCCCTG-3′; glyceraldehyde 3-phosphate
dehydrogenase (GAPDH) forward, 5′-TGGATTTGGACGCATTGGTC-3′ and
reverse, 5′-TTTGCACTGGTACGTGTTGAT-3′. The conditions included
initial denaturation at a temperature of 95°C for 30 sec, followed
by 40 cycles (95°C, 5 sec; 60°C, 30 sec). Finally all quantified
values were normalized to the endogenous GAPDH control. The
2−∆∆Cq method was used to analyze gene expression levels
(26).
Statistical analysis
The statistical analyses of data were performed
using Student's t-test with SPSS software version 17.0 (SPSS, Inc.,
Chicago, IL, USA). Data are presented as the mean ± standard
deviation. P<0.05 was considered to indicate a statistically
significant difference.
Results
Overview of sequencing data from
RNA-seq analyses
The overall raw reads of the eight samples fell in
the range of 46,000,000–82,000,000. Through strict quality checks,
>95% of the reads had a quality score of ≥Q20. The RSeQC package
was used to analyze the sequencing quality (27). The raw sequence data of each sample
produced ~6 GB of data. Of the total raw reads, 96.5%
(~5.87±2.15×10⁷ reads) were mapped onto the mouse genome
sequence in the eight separate samples (Table I) and 89.1% of the total raw reads
(5.42±1.92×10⁷ reads) were uniquely aligned to the mouse
genome. The RNA-seq data was normalized to RPKM values for
quantifying transcript expression levels.
 | Table I.Statistical results of raw and mapped
reads from RNA sequencing analysis of the two sample groups. |
Table I.
Statistical results of raw and mapped
reads from RNA sequencing analysis of the two sample groups.
| Sample ID | All reads (n) | Mapped reads
(n) | Mapped pair reads
(n) | Mapped unique reads
(n) | Mapped multi reads
(n) | Mapping ratio
(%) |
|---|
| WT1 | 61,240,034 | 59,117,022 | 56,525,230 | 55,294,584 | 3,822,438 | 96.53 |
| WT2 | 46,121,381 | 44,464,612 | 42,679,266 | 41,326,294 | 3,138,318 | 96.41 |
| WT3 | 54,133,981 | 52,125,800 | 49,324,700 | 49,085,506 | 3,040,294 | 96.29 |
| WT4 | 54,339,065 | 52,141,402 | 49,743,718 | 48,844,972 | 3,296,430 | 95.96 |
| KO1 | 72,474,184 | 70,219,525 | 65,940,540 | 63,560,829 | 6,658,696 | 96.89 |
| KO2 | 82,629,329 | 80,169,680 | 75,009,586 | 73,414,418 | 6,755,262 | 97.02 |
| KO3 | 56,526,935 | 54,505,009 | 52,003,246 | 50,639,935 | 3,865,074 | 96.42 |
| KO4 | 58,853,154 | 56,795,811 | 54,334,810 | 51,286,425 | 5,509,386 | 96.50 |
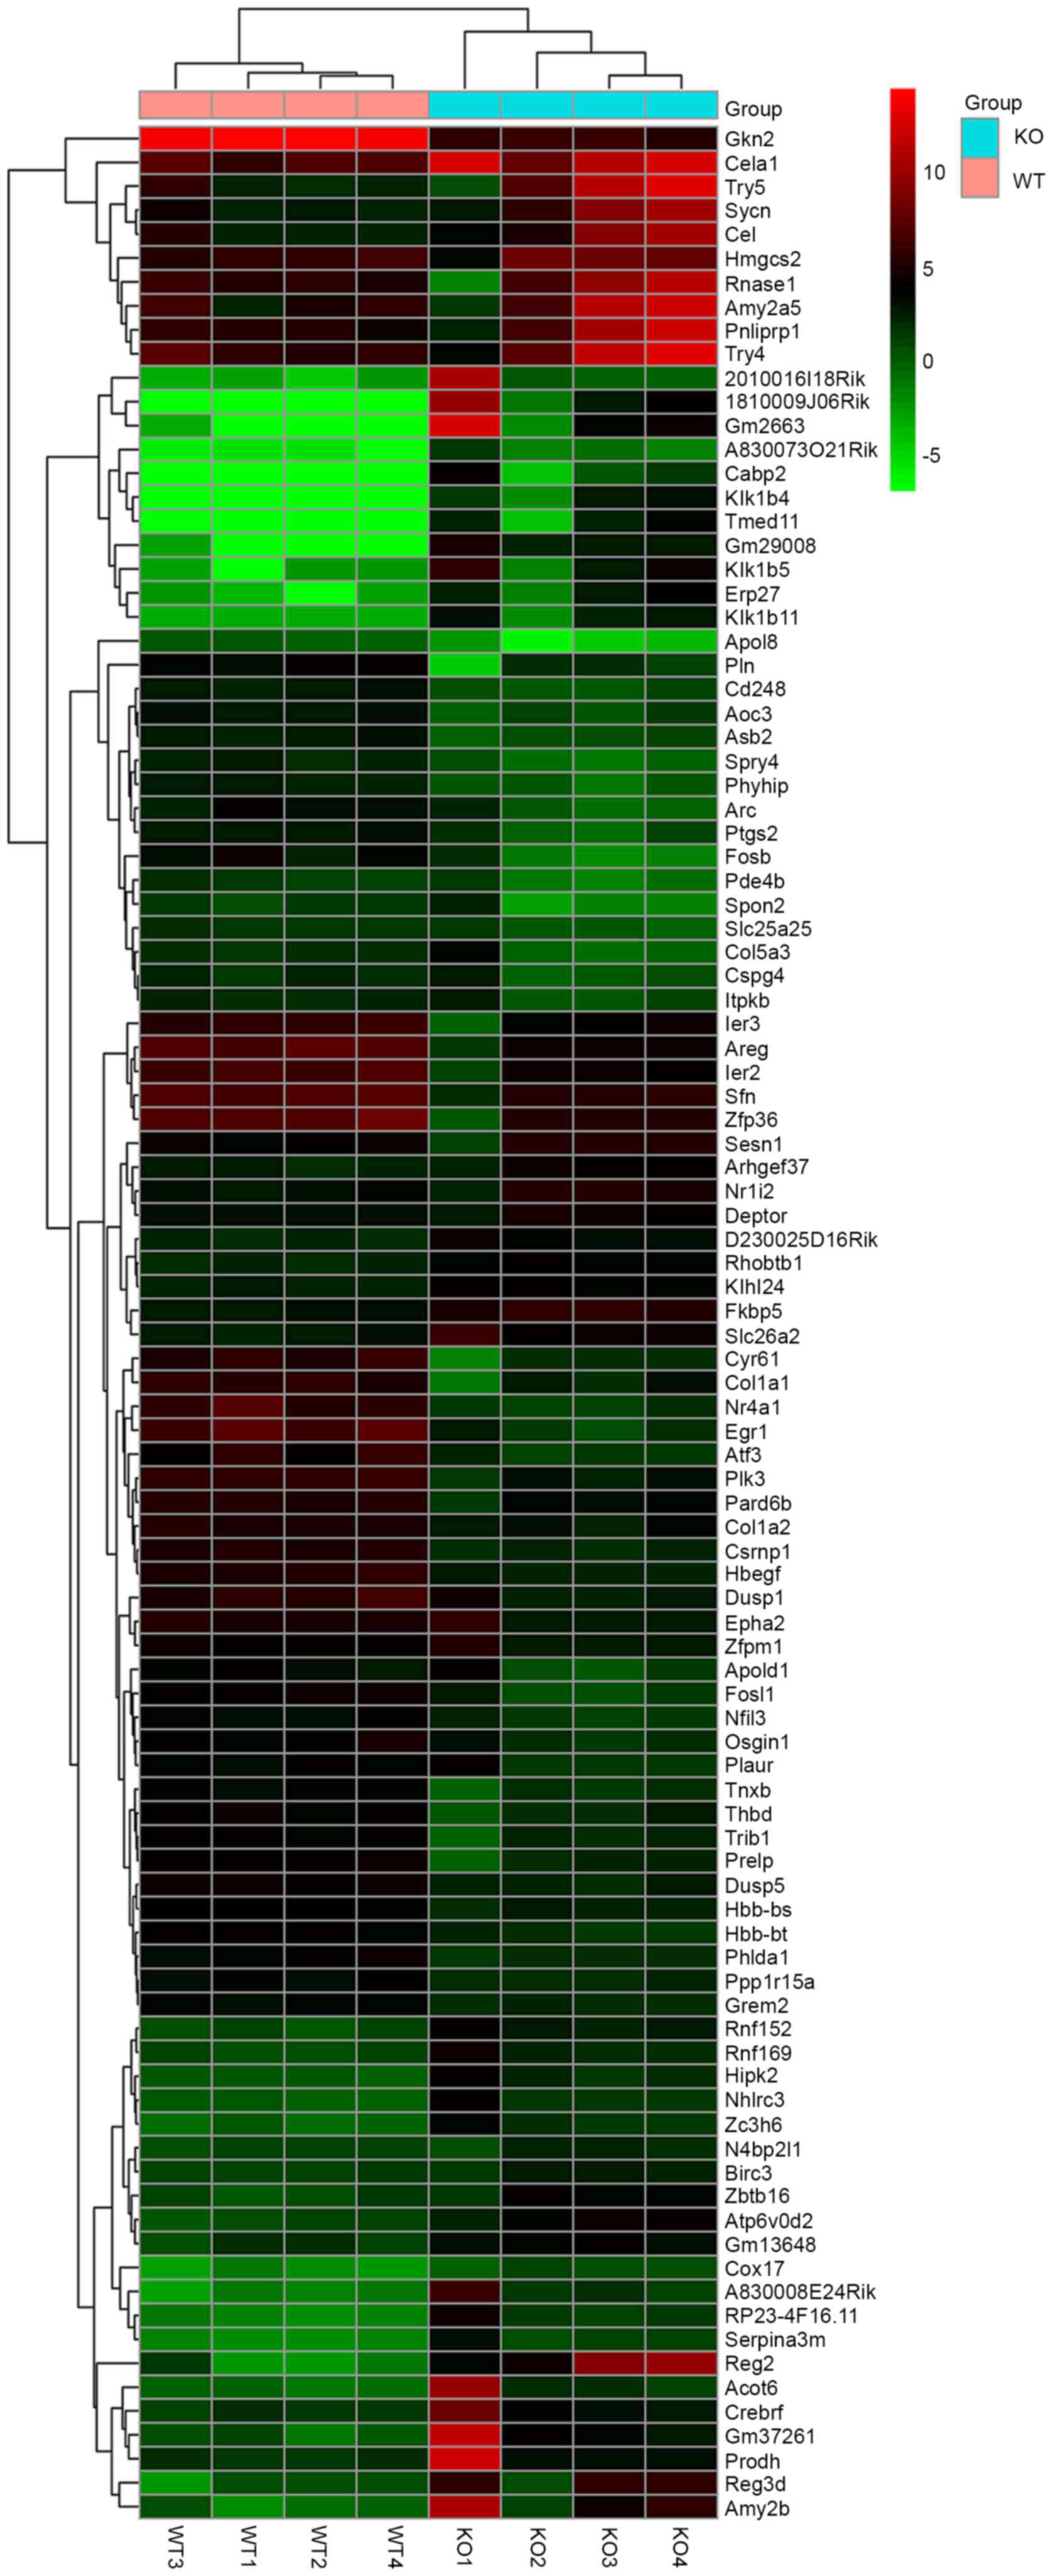
Selection of DEGs
The total samples analyzed in the present study
comprised four WT stomach samples and four KO stomach samples. The
data were analyzed individually with the use of edgeR and the lists
of DEGs were identified. According to the results of the analyses,
using the criteria of fold control >2.0 and P<0.05, a total
of 1,704 genes were identified, of which 710 were downregulated and
994 were upregulated, respectively. The DEG gene expression heatmap
is shown in Fig. 1, comprising the
top 50 downregulated and upregulated genes. For targeting the DEGs,
the DEGs were screened by GO terms, which were associated with
phenotype (Table II).
| Table II.Differentially-expressed genes
associated with functions and phenotypes. |
Table II.
Differentially-expressed genes
associated with functions and phenotypes.
| Gene symbol | Description | Log2FC | P-value | Gene ontology
term |
|---|
| Upregulated |
| Hbegf | Heparin binding
EGF-like growth factor | −2.86 |
3.79×10⁻³⁴ | Angiogenesis;
extracellular space; epidermal growth factor receptor signaling
pathway; growth factor activity |
| Ptgs2 |
Prostaglandin-endoperoxide synthase 2 | −1.88 |
2.83×10−09 | Negative regulation
of toll-like receptor signaling pathway; prostaglandin biosynthetic
process; |
| Cxcl2 | C-X-C motif
chemokine ligand 2 | −3.97 |
3.80×10−07 | Cytokine activity;
extracellular region; inflammatory response; G-protein coupled
receptor signaling pathway; neutrophil chemotaxis |
| Tgf-β1 | Transforming growth
factor-β1 | −1.48 |
1.55×10−06 | Transcription
coactivator activity; focal adhesion; positive regulation of
epithelial to mesenchymal transition; Wnt signaling pathway |
| IL-1β | Interleukin-1β | −2.58 |
2.28×10−04 | Activation of MAPK
activity; positive regulation of protein phosphorylation cytokine
activity |
| Downregulated |
| Ins2 | Insulin II | 5.01 |
7.42×10⁻¹¹ | Negative regulation
of transcription from RNA polymerase II promoter; MAPK cascade;
negative regulation of acute inflammatory response; extracellular
region |
| Tsc1 | Tuberous sclerosis
1 | 1.31 |
4.44×10−09 | Regulation of
cell-matrix adhesion; adaptive immune response; protein binding;
cytoplasm |
| Sgk2 | Serine/threonine
kinase 2 | 1.22 |
1.06×10−08 | Nucleotide binding;
regulation of cell growth; protein serine/threonine kinase
activity; cytoplasm |
| Erbb3 | Erb-B2 receptor
tyrosine kinase 3 | 1.07 |
3.75×10−07 | Nucleotide binding;
protein kinase activity; transmembrane receptor protein tyrosine
kinase activity; receptor signaling protein tyrosine kinase
activity; protein binding |
| Adgrb1 | Adhesion G
protein-coupled receptor B1 | 1.17 |
1.24×10−06 | Transmembrane
signaling receptor activity; G-protein coupled receptor activity;
protein binding; plasma membrane |
GO term enrichment analysis
In order to identify the overrepresented categories
(GO and KEGG pathways), all DEGs were uploaded to the online DAVID
software. Based on the results of the GO analysis, there was
significant enrichment of upregulated DEGs in biological processes
(BP) encompassing muscle contraction, cell adhesion, and locomotion
and response to wounding (Table
III); there was significant enrichment of the downregulated
DEGs in BPs encompassing regulation of nitrogen compound metabolic
process, regulation of RNA metabolic process, and response to
peptide hormone (Table III). For
molecular function (MF), there was enrichment of the upregulated
DEGs in transcription factor activity, cytoskeletal protein
binding, sequence-specific binding by RNA polymerase II core
promoter region, and calcium ion binding, and there was enrichment
of the downregulated DEGs in serine-type peptidase activity, and
serine-type endopeptidase activity, and serine hydrolase activity
(Table III). In addition, based
on the GO cell component (CC) analysis, there was significant
enrichment of the upregulated DEGs in contractile fiber, myofibril,
and contractile fiber part, and also significant enrichment of
downregulated DEGs in extracellular space, zymogen granule and
extracellular region part (Table
III).
| Table III.GO analysis of
differentially-expressed genes associated with gastric lesions. |
Table III.
GO analysis of
differentially-expressed genes associated with gastric lesions.
| Expression | Category | Term/gene
function | Gene count | % | P-value |
|---|
| Upregulated | BP | GO:0006936-muscle
contraction | 69 |
7.2 |
3.1×10⁻³² |
|
| BP | GO:0007155-cell
adhesion | 144 | 14.9 |
1.9×10⁻¹⁶ |
|
| BP |
GO:0040011-locomotion | 138 | 14.3 |
1.5×10⁻¹⁵ |
|
| BP | GO:0009611-response
to wounding | 69 |
7.2 |
3.7×10⁻¹⁵ |
|
| BP |
GO:0030198-extracellular matrix
organization | 42 |
4.4 |
1.5×10⁻¹⁴ |
|
| CC |
GO:0043292-contractile fiber | 72 |
7.5 |
1.7×10−36 |
|
| CC |
GO:0030016-myofibril | 70 |
7.3 |
5.3×10−36 |
|
| CC |
GO:0044449-contractile fiber part | 67 |
7.0 |
1.1×10⁻³⁴ |
|
| CC |
GO:0030017-sarcomere | 65 |
6.7 |
2.3×10⁻³⁴ |
|
| CC |
GO:0005578-proteinaceous extracellular
matrix | 78 |
8.1 |
2.5×10⁻²⁷ |
|
| MF |
GO:0008092-cytoskeletal protein
binding | 87 |
9.0 |
1.9×10⁻¹² |
|
| MF |
GO:0000982-transcription factor activity,
RNA polymerase II core promoter region sequence-specific
binding | 53 |
5.5 |
6.1×10⁻¹² |
|
| MF | GO:0005509-calcium
ion binding | 76 |
7.9 |
6.9×10⁻¹² |
|
| MF | GO:0000981-RNA
polymerase II transcription factor activity, sequence-specific DNA
binding | 74 |
7.7 |
1.6×10⁻¹¹ |
|
| MF | GO:0003779-actin
binding | 50 |
5.2 |
1.0×10⁻¹⁰ |
| Downregulated | BP |
GO:0051252-regulation of RNA metabolic
process | 105 | 18.5 |
3.1×10−06 |
|
| BP |
GO:0051171-regulation of nitrogen compound
metabolic process | 115 | 20.3 |
2.9×10−05 |
|
| BP |
GO:0010468-regulation of gene
expression | 115 | 20.3 |
4.8×10−05 |
|
| BP | GO:0044242-cellular
lipid catabolic process | 12 |
2.5 |
8.5×10−04 |
|
| BP | GO:0043434-response
to peptide hormone | 17 |
2.6 |
1.5×10−02 |
|
| CC |
GO:0005615-extracellular space | 62 | 10.9 |
1.5×10−08 |
|
| CC | GO:0042588-zymogen
granule |
5 |
0.9 |
1.0×10−03 |
|
| CC |
GO:0044421-extracellular region part | 96 | 16.9 |
1.2×10−03 |
|
| CC |
GO:0005576-extracellular region | 107 | 18.9 |
1.3×10−03 |
|
| CC | GO:0005576-zymogen
granule membrane |
4 |
0.7 |
2.3×10−03 |
|
| MF |
GO:0004252-serine-type endopeptidase
activity | 29 |
5.1 |
1.6×10⁻¹⁵ |
|
| MF |
GO:0008236-serine-type peptidase
activity | 29 |
5.1 |
2.2×10⁻¹⁴ |
|
| MF | GO:0017171-serine
hydrolase activity | 29 |
5.1 |
3.0×10⁻¹⁴ |
|
| MF | GO:0043169-cation
binding | 139 | 24.5 |
4.4×10⁻¹² |
|
| MF | GO:0046872-metal
ion binding | 138 | 24.5 |
4.6×10⁻¹² |
KEGG pathway analysis
Based on the results of the KEGG pathway analysis,
the most significantly enriched pathways of the downregulated DEGs
and the upregulated DEGs were identified, as listed in Table IV. There was significant
enrichment of the upregulated DEGs in the cGMP-PKG signaling
pathway, focal adhesion, ECM-receptor interaction, PI3K-Akt
signaling pathway and gastric acid secretion. There was enrichment
of the downregulated DEGs in the endocrine, renin-angiotensin
system, and other factor-regulated calcium reabsorption, PPAR
signaling pathway, glycerolipid metabolism, and neuroactive
ligand-receptor interaction.
| Table IV.Kyoto Encyclopedia of Genes and
Genomes pathway analysis of differentially-expressed genes
associated with gastric lesions |
Table IV.
Kyoto Encyclopedia of Genes and
Genomes pathway analysis of differentially-expressed genes
associated with gastric lesions
| Pathway ID | Name | Gene count | % | P-value | Genes |
|---|
| Upregulated |
| mmu04512 | ECM-receptor
interaction | 22 |
2.3 |
1.6×10⁻¹⁰ | Col1a1, Col1a2,
Col3a1, Col4a, Col4a2, Col4a, Col4a6, Col5a1, Col5a2, Col5a3,
Col6a1, Col6a, Col6a3, Fn1, Itga11, Itga3, Lamb2, Npnt, Hspg2,
Tnxb, Thbs1, Thbs4 |
| mmu04510 | Focal adhesion | 32 |
3.3 |
2.1×10−09 | Shc2, Actn2, Actn3,
Col1a1, Col1a2, Col3a1, Col4a1, Col4a2, Col4a5, Col4a6, Col5a1,
Col5a2, Col5a, Col6a1, Col6a2, Col6a3, Fn1, Flnc, Itga11, Itga3,
Jun, Lamb2, Mylk3, Mylk4, Mylpf, Mylk2, Mylk, Tnxb, Thbs1, Thbs4,
Vegfc, Zyx |
| mmu04022 | Cgmp-PKG signaling
pathway | 23 |
2.5 |
6.7×10−06 | Atp2a1, Atp1a2,
Atp1b2, Atf6b, Adcy1, Adcy3, Adcy7, Adra1a, Cacna1s, Gucy1b3, Irs2,
MEF2C, Mylk3, Mylk4, Mylk2, Mylk, Nfatc4, Pde5a, Pln, Kcnmb1, Srf,
Slc8a2, Tprc6 |
| mmu05146 | PI3K-Akt signaling
pathway | 34 |
3.5 |
3.7×10−05 | Epha2, Atf6b,
Chrm2, Col1a1, Col1a2, Col3a1, Col4a1, Col4a2, Col4a5, Col4a6,
Col5a1, Col5a2, Col5a3, Col6a1, Col6a2, Col6a3, Efna3, Fgf10,
Fgf11, Fgf1, Fn1, Gnb4, Itga11, Itga3Lamb2, Ngfr, Ngf, Osm, Nr4a,
Ppp2r5b, Tnxb, Thbs1, Thbs4, Vegfc |
| mmu05414 | Gastric acid
secretion | 12 |
1.2 |
3.2×10−04 | Atp1a2, Atp1b2,
Adcy1, Adcy3, Adcy7, Camk2a, Gast, Mylk3, Mylk4, Mylk2, Myl,
Kcne2 |
| Downregulated |
| mmu04614 | Renin-angiotensin
system | 8 |
1.4 |
1.7×10−06 | Mas1, Klk1,
Klk1b11, Klk1b24, Klk1b, Klk1b5, Klk1b8, Klk1b26 |
| mmu04961 | Endocrine and other
factor-regulated calcium reabsorption | 7 |
1.2 |
2.5×10−04 | Klk1, Klk1b11,
Klk1b24, Klk1b3, Klk1b5, Klk1b8, Klk1b26 |
| mmu00561 | Glycerolipid
metabolism | 6 |
1.3 |
2.9×10−03 | Cel, Lpin1, Lpin2,
Phliprp1, Pnli, Pnliprp2 |
| mmu03320 | PPAR signaling
pathway | 5 |
1.0 |
4.7×10−02 | Acox2, Angptl4,
Cpt1a, Cyp4a32, Ehhdh |
| mmu04080 | Neuroactive
ligand-receptor interaction | 10 |
2.1 |
5.3×10−02 | Gpr156, Mas,
1810009j06Rik, 2210010c04Rik, Oprd1, Try5, Gm10334, Prss2, Sctr,
Try4 |
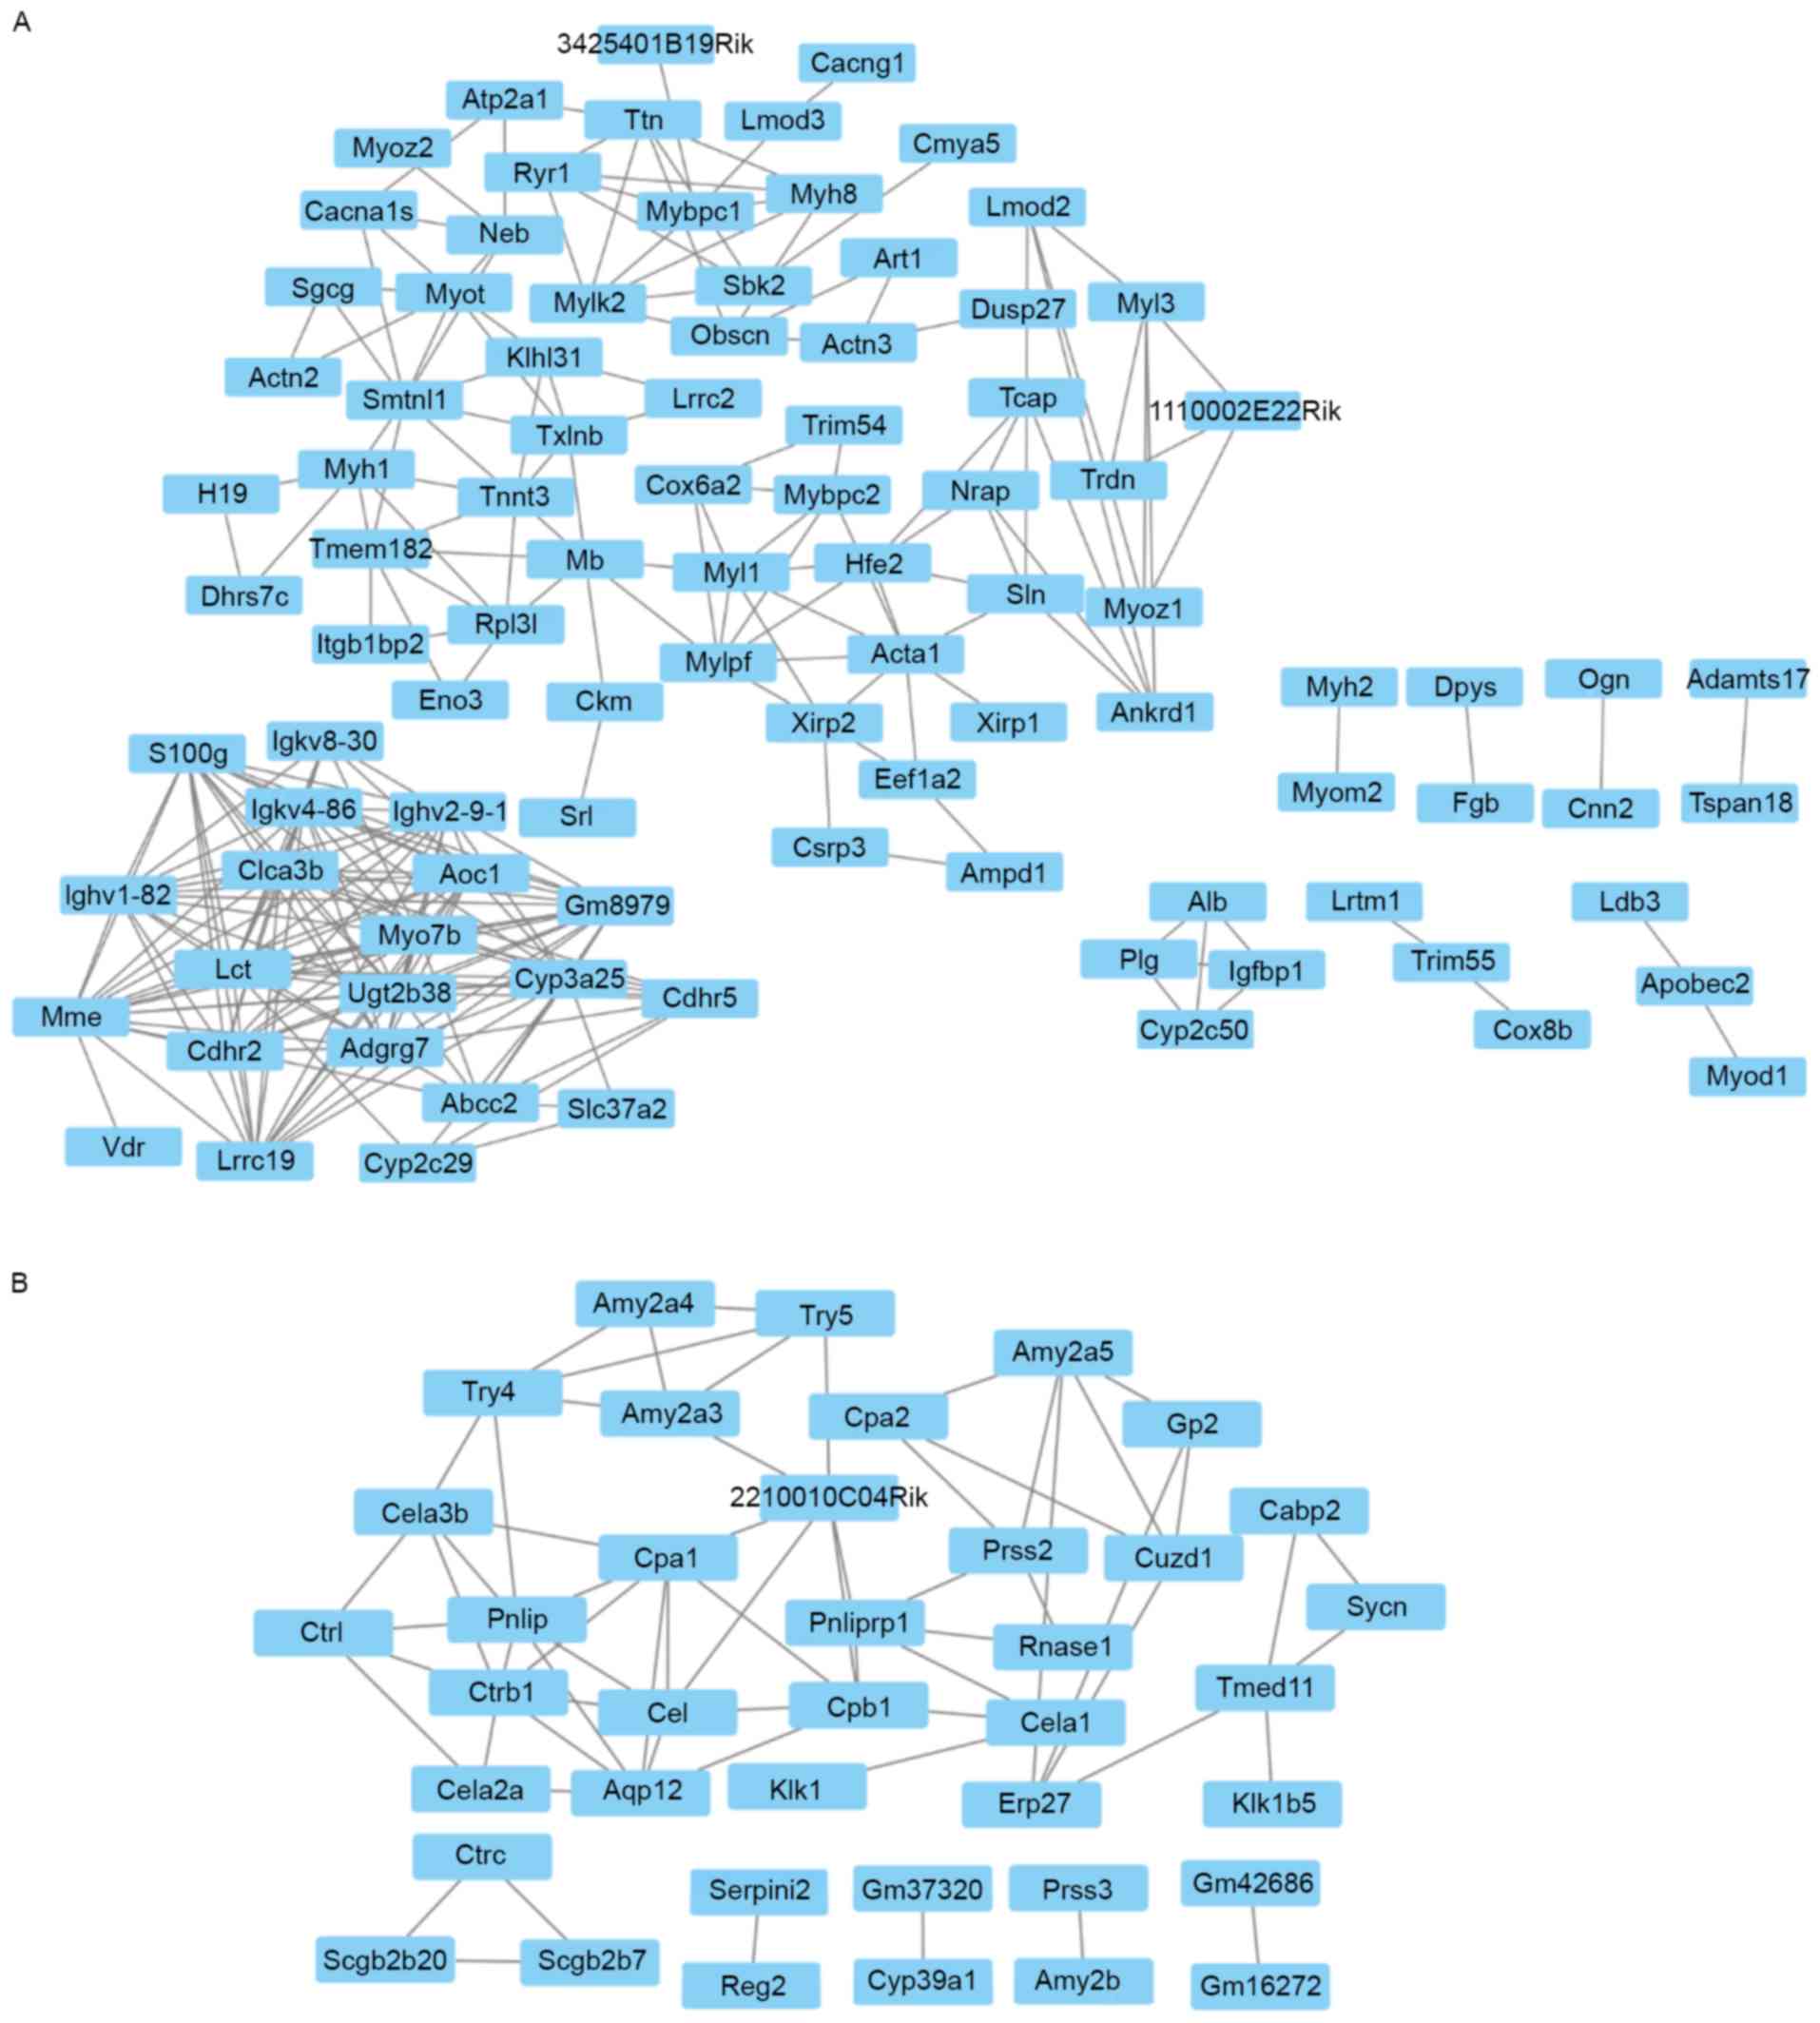
Gene co-expression network
Gene co-expression network analysis was performed
between the highlighted groups of DEGs in synergy with possible
involvement in BPs resulting in phenotypic changes. As shown in
Fig. 2A, there was a positive
correlation between the expression levels of insulin-like growth
factor-binding protein 1 and plasminogen (Pearsons r=0.99), and
these genes were involved in wound healing (Fig. 2A). In addition, a family of genes
were associated with wound healing, including calponin 2, enolase
3, fibrinogen β chain, myogenic differentiation 1 and myosin heavy
chain 2 (Myh2), in the WT mice (Fig.
2A). A group of genes associated with tight junction and focal
adhesion, including actinin α2, actinin α3, myosin light chain,
phosphorylatable, fast skeletal muscle and Myh2, were also
correlated in the WT group. In the GDDR-/-group, it was found that
12 gene pairs of genes with similar expression profiles had
involvement with proteolysis, which included CUB and zona
pellucida-like domains 1/carboxypeptidase A2 (Cpa2),
2210010c04Rik/carboxypeptidase B1 (Cpb1), 2210010c04Rik/trypsin 5
(Try5), Cpa1/2210010c04Rik, Cpa2/protease, serine, 2 (Prss2),
Cpb1/chymotrypsin-like elastase family member 1 (Cela1),
Cela1/kallikrein 1 (Klk1), Cela2a/chymotrypsin-like (Ctrl),
Try4/Cela3a, Ctrb1/Ctrl and Try4/Try5 (Fig. 2B).
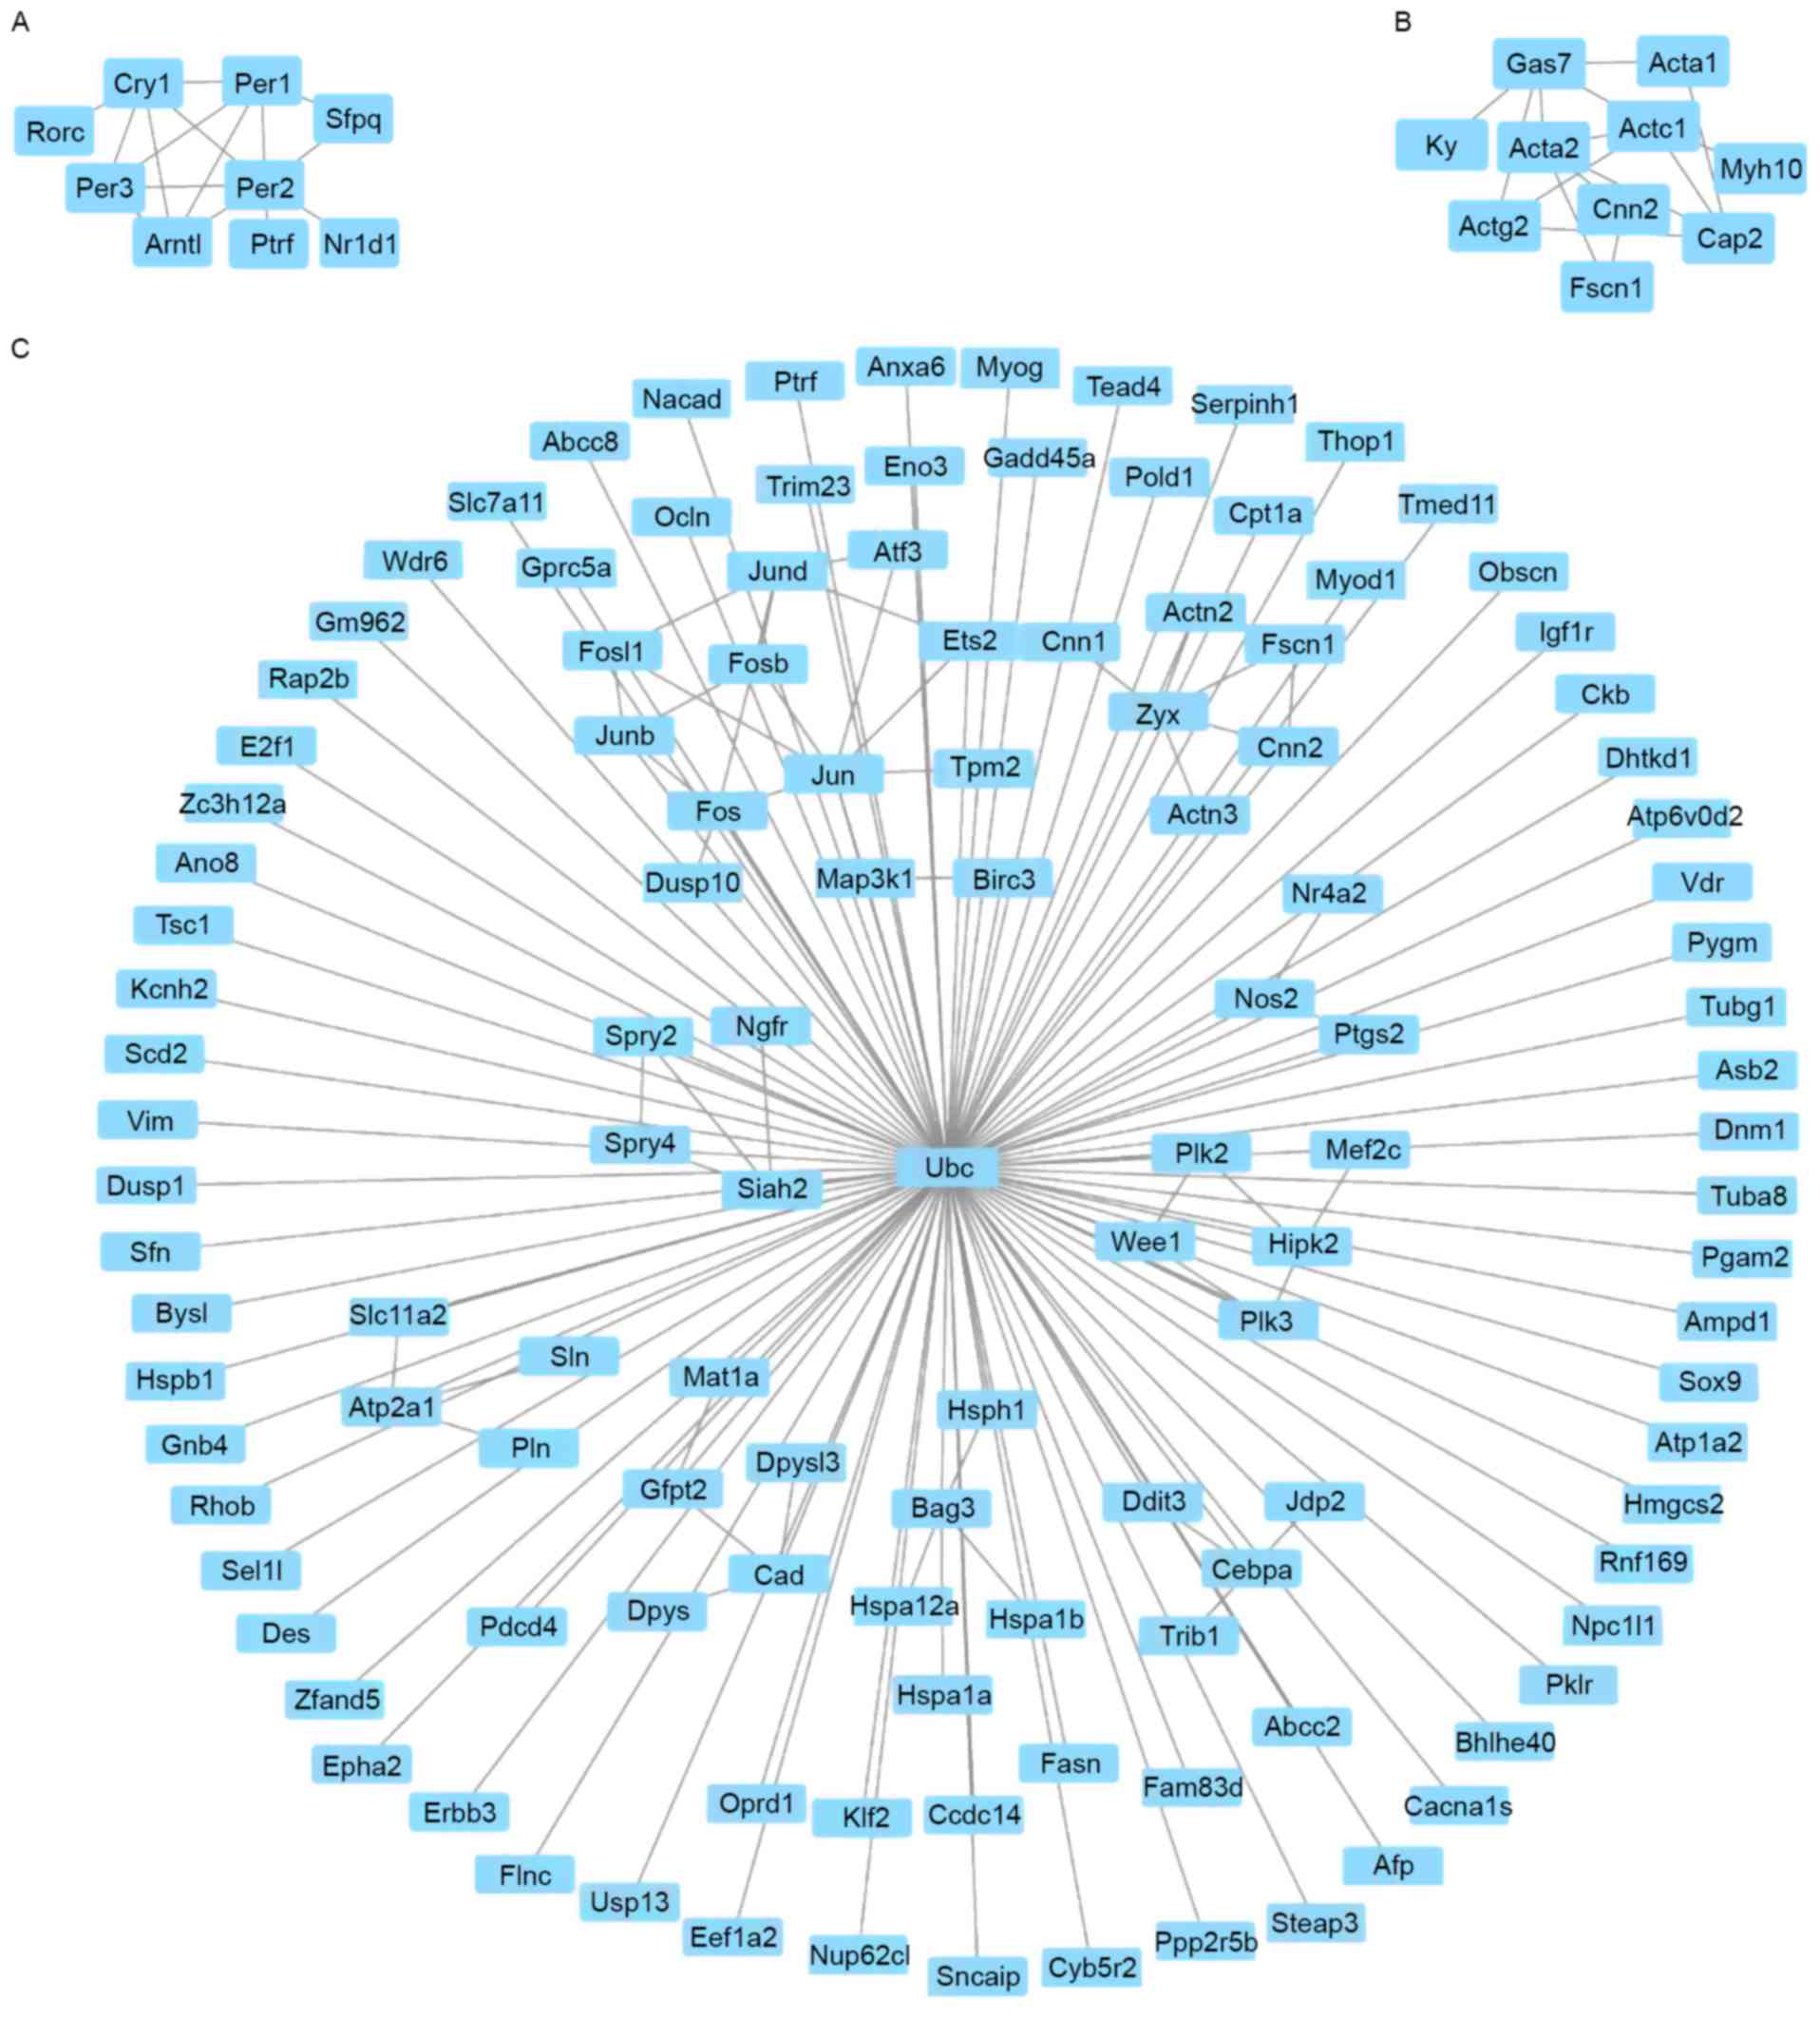
Module screening from the PPI
network
According to the STRING database results, the
screening of top hub nodes with high degrees higher linked to
phenotype was implemented. These encompassed period circadian clock
3 (Per3), period circadian clock 2 (Per2), Ptgs2, period circadian
clock 3 (Per1), cryptochrome circadian clock 1 (Cry1), α-actin-3
(Actg2), cardiac muscle 1 (Actc1), nitric oxide synthase 2 (Nos2),
mitogen-activated protein kinase kinase kinase 1 (Map3k1), and
growth arrest specific 7 (Gas7). In addition, 317 edges and 282
nodes were analyzed with the use of MCODE plug-ins. In this
process, the top three significant modules were selected, and the
functional genetic annotation of these modules was analyzed
(Fig. 3). Based on the enrichment
analysis, the genes in the top three modules were highly associated
with negative regulation of the signaling pathway of glucocorticoid
receptor, mesenchyme migration and response to organic substance
(Table V).
| Table V.Pathways enriched in modules of the
protein-protein interaction network. |
Table V.
Pathways enriched in modules of the
protein-protein interaction network.
| Gene set | P-value | FDR | Nodes |
|---|
| Module 1 |
| Negative regulation
of glucocorticoid receptor signaling pathway |
1.79×10−07 |
9.81×10−07 | Per1, Cry1,
Arntl |
| Regulation of
hormone secretion |
4.21×10−03 |
2.01×10−04 | Per2, Nr1d1, Cry1,
Arntl |
| Regulation of
cellular response to stress |
3.48×10−03 |
7.03×10−03 | Sfpq, Per1, Cry1,
Arntl |
| Module 2 |
| Mesenchyme
migration |
1.23×10−08 |
1.30×10−09 | Acta1, Actc1,
Acta2, Actg2 |
| Mesenchyme
morphogenesis |
5.54×10−05 |
6.76×10−06 | Acta1, Actc1,
Acta2, Actg2 |
| Cytoskeleton
organization |
4.26×10−04 |
4.64×10−04 | Gas7, Cap2, Cnn2,
Fscn1, Myh10, Acta1 |
| Module 3 |
| Response to organic
substance |
1.34×10−02 |
4.48×10⁻¹⁰ | Zyx, Pygm, Slc11a2,
Nos2, Ptgs2, Slc7a11, Ampd1, Epha2, Zx3h12a, Hspa1a, Hsph1, Afp,
Myod1, Map3k1, Jun, Dusp1, Cpt1a, Dusp10, Tsc1, Fosb, Fos1, Junb,
Atf3, Ddit3, HmgcS2, Hipk2, Oprd1, E2f1, Bysl, Cad, Dpysl2, Abcc2,
Fasn, Sel1l, Klf2, Trib1, Abcc2, Atp1a2, Melf2c |
| Response to
lipid |
5.13×10−03 |
2.73×10−09 | Fosb, Fosl1, Fos,
Jun, Nos2, Ptgs2, Dusp1, Junb, Dusp10, Hmgcc2, Jund, Cebpa, Nr4a2,
Trib1, Myod1, Sox9, Atp1a2, E2f1, Bysl, Cad, Mef2c, Zc3h12a, Abcc2,
Cpt1a |
| Regulation of cell
death |
8.13×10−03 |
5.26×10−08 | Nr4a2, Fosl1,
Ptgs2, Slc11a2, Map3k1, Birc3, Junb, Jund, Atf3, Ddit3, Hspb1,
Gadd45a, Erbb3, Bag3, Hsph1, Plk, Plk2, Sfn, Sox, Hipk2, Mef2, Vdr,
Pdc, Igf1r, Rhob, Spry2, Steap3, Siah2, Ngfr |
Gene validation via RT-qPCR
The gene expression profiles of the DEGs were
examined (Table II). Based on the
results of the RT-qPCR analysis, the gene expression profiles of
the DEGs in the two groups of samples were consistent with the
RNA-seq data, with the exception of Adgrb (Fig. 4). Of note, the expression level of
Ptgs2 in the WT group was ~5-fold of that in the KO group. Adgrb1
in the KO mice was marginally higher than that in the WT mice
(P>0.05). Therefore, Adgrb1 may not contribute to the protection
of the gastric mucosa under stress.
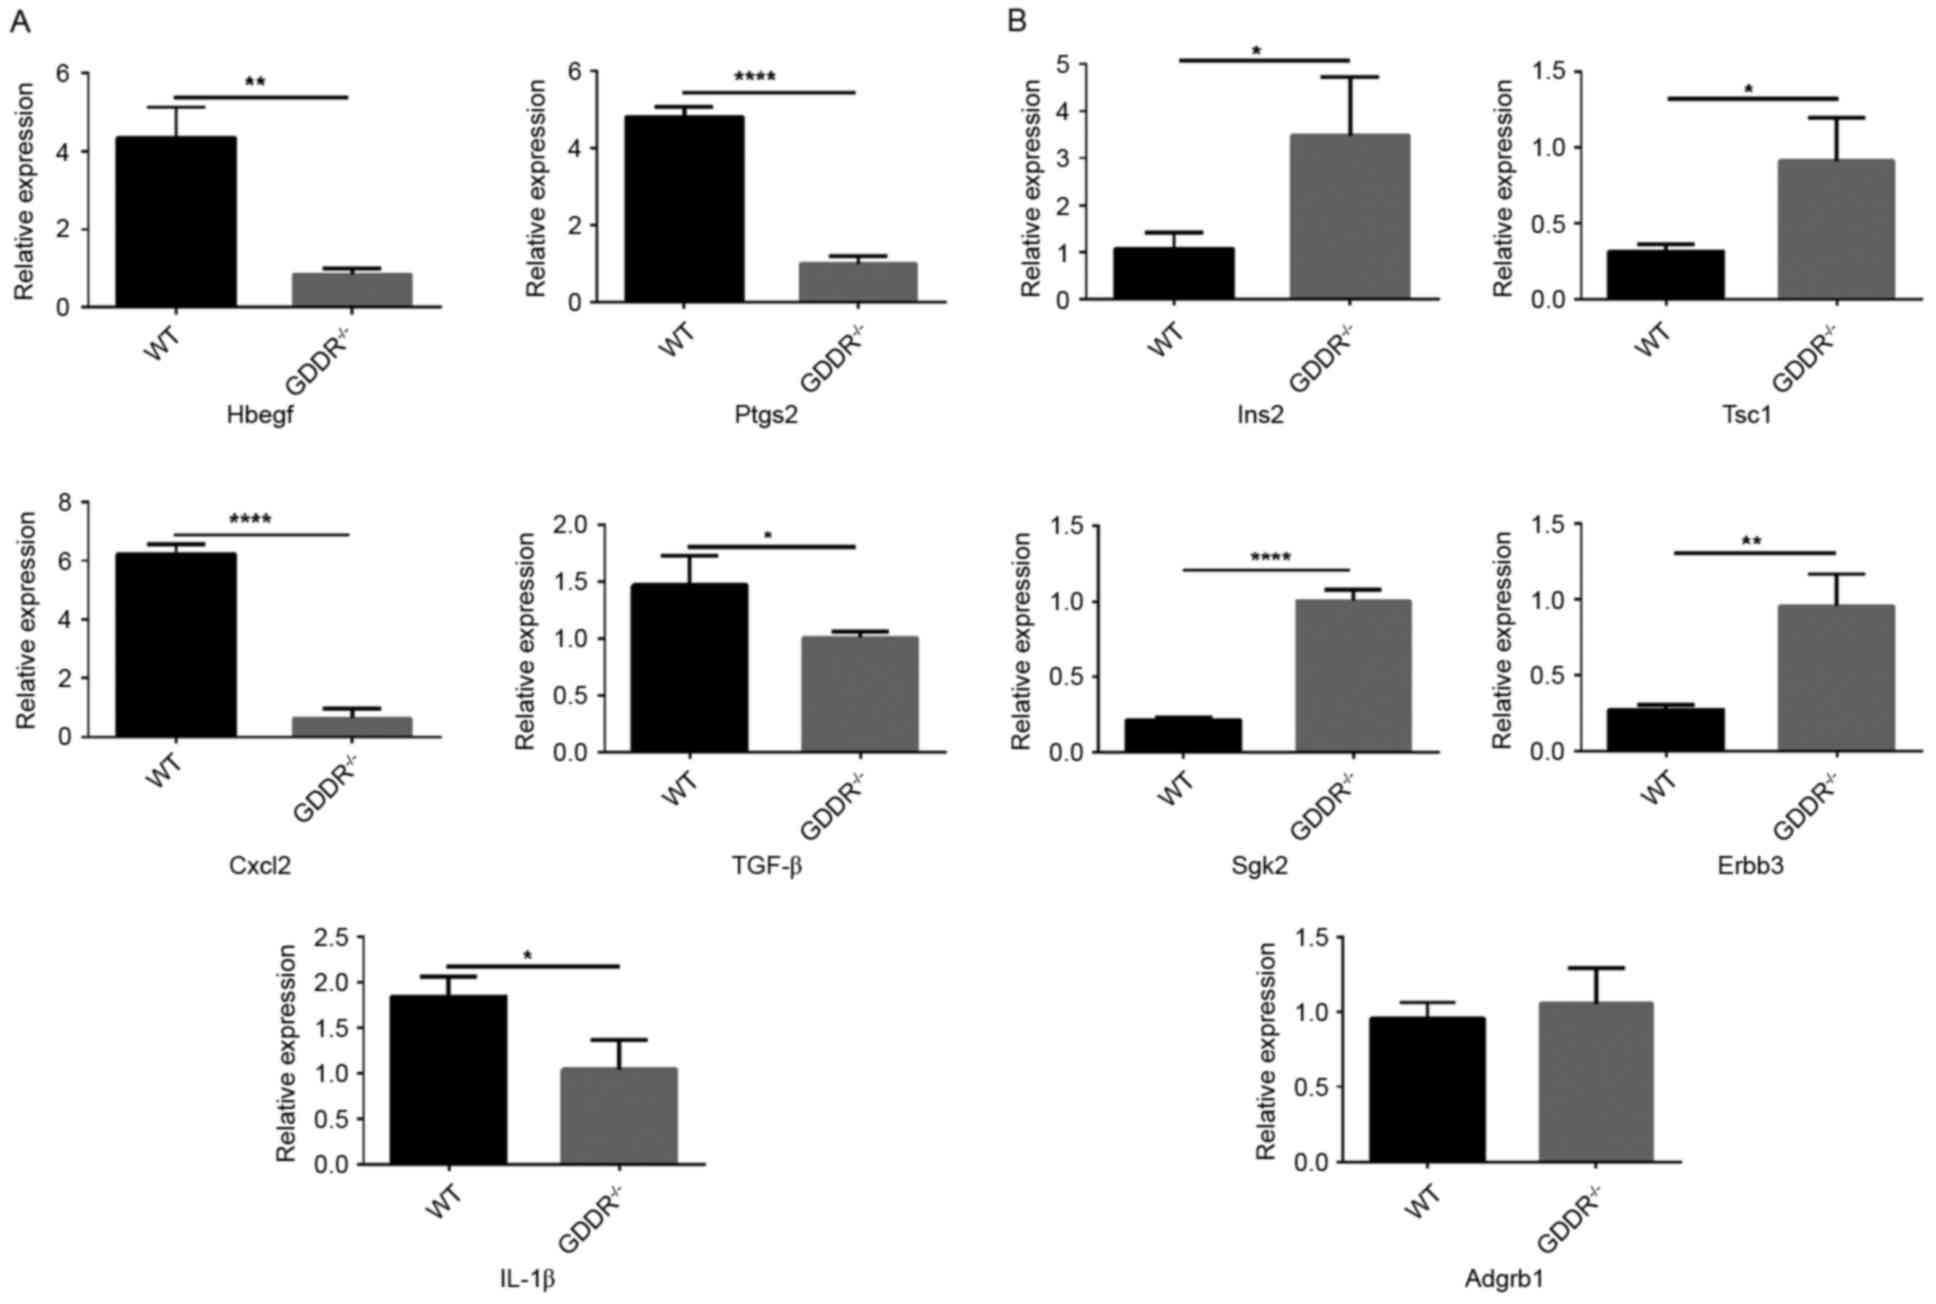 | Figure 4.Reverse transcription-quantitative
polymerase chain reaction analysis for validation of relative
expression levels of representative differentially-expressed genes.
(A) Upregulated genes in WT mice; (B) upregulated genes in knockout
mice. *P<0.05, **P<0.01, ***P<0.001, ****P<0.0001. WT,
wild-type; GDDR, gastric dramatic downrelated gene; Hbegf, heparin
binding EGF-like growth factor; Ptgs2, prostaglandin-endoperoxide
synthase 2; Ins2, insulin II; Tsc1, tuberous sclerosis 1; Cxcl2,
C-X-Cmotif chemokine ligand 2; Tgf-β, transforming growth factor-β;
Sgk2, serine/threonine kinase 2; IL-1β, interleukin; Adgrb,
adhesion G protein-coupled receptor B1. |
Discussion
In the present study, the gene expression data of
four WT mice and four KO mice were retrieved using the RNA-seq
technique. In total, 1,704 DEGs were identified between the four KO
samples and WT samples, of which 710 were downregulated and 994
were upregulated. The upregulated genes included Hbegf, Ptgs2,
Cxcl2, Tgf-β1 and IL-1β. These genes are involved in the
inflammatory response and immune response, and may aggravate
gastric lesions. The downregulated genes included Ins2, Tsc1, Sgk2,
Erbb3 and Map3k1. These genes are essential in proliferation,
response to oxidative stress and negative regulation of acute
inflammatory response. These genes can enhance the resistance of
the gastric epithelia against damage and inhibit the acute
inflammatory response. It has been reported that co-expressed genes
are generally composed of a family of genes, which have similar
expression profiles, and are frequently involved in parallel
biological process. In the present study, a co-expression network
was constructed among the DEGs from the WT mice and KO mice. The
network may indicate how GDDR upregulates or downregulates DEGs,
however, the results obtained in the present study were obtained
from the whole stomach, containing various types of cells,
therefore differences observed in the present study cannot be
repeated in a single cell line. This indicates the merit of further
investigation of the differences in one type of cell in the
stomach. GO and KEGG pathway analyses were also performed to
further elucidated the interactions of the DEGs. Based on the GO
term analysis, the upregulated DEGs were predominantly associated
with muscle contraction, cell adhesion, locomotion and response to
wounding, whereas the downregulated DEGs were associated with
regulation of nitrogen compound metabolic process, regulation of
RNA metabolic process, and response to peptide hormone. These
results are consistent with the knowledge that multiple processes,
including increased nitrite/nitrate concentrations, the breakdown
products of nitric oxide by inducible nitric oxide synthase in the
gastric mucosa (28), gene
expression, response to peptide hormone (3), microcirculation (29,30)
and the vasodilator effect (31)
are involved in acute gastric lesions. The KEGG pathways enriched
in upregulated DEGs included focal adhesion, ECM-receptor
interaction, PI3K-Akt signaling pathway, cGMP-PKG signaling pathway
and gastric acid secretion (32),
The KEGG pathways enriched in the downregulated DEGs included the
endocrine, renin-angiotensin system, other factor-regulated calcium
reabsorption, glycerolipid metabolism, PPAR signaling pathway and
neuroactive ligand-receptor interaction. The gastric lesion is the
result of the disturbance between defensive and aggressive factors
in the gastric mucosa (30),
including mucus secretion, mucosal blood flow and repair processes.
Previous studies have shown that the renin-angiotensin system is
important in gastric mucosal protection (33). Evidence also indicates that the
ECM-receptor interaction is involved during wound repair (34,35).
Activation in the PI3K-Akt signaling pathway has also been reported
to be involved in protecting the gastric mucosal epithelium from
damage (36). Therefore,
investigation of these signaling pathways may assist in predictions
of gastric lesions and wound repair.
In the present study, a PPI network was also
constructed with the DEGs, and the top degree hub genes were
identified, which were involved in phenotype: Per3, Ptgs2, Per2,
Cry1, Per1, Actg2, Actc1, Nos2, Map3k1 and Gas7. Ptgs2, also known
as cyclooxygenase 2 (Cox-2), serves as the key enzyme in the
process of prostaglandin biosynthesis, and is a peroxidase and
dioxygenase. Ptgs2 is involved in the production of inflammatory
prostaglandins, and the upregulation of Ptgs2 is involved in
phenotypic changes, increased cell adhesion, resistance to
apoptosis and tumor angiogenesis. Previous studies have reported
that the expression of Cox-2 is induced in inflammatory cells at
sites of inflammation (37), and
the presence of Cox-2 in the intact gastric mucosa is crucial for
protection against injury caused by non-steroidal anti-inflammatory
agents (38). The second hub gene,
Cry1, is a core component of the circadian clock, which regulates
various physiological processes through gene expression according
to circadian rhythms of ~24 h. It is an important regulator of a
broad set of physiological functions, including immune and
endocrine functions, which are involved in gastric lesions
(39–41). The third hub gene, Per1, is a
member of the period family of genes and functions in the
repression of glucocorticoid receptor Nr3c1/Gr-induced
transcriptional activity. It is important in gastric mucosal
defense (42,43) by reducing the association between
Nr3c1/Gr and glucocorticoid response elements. In addition, Per1 is
involved in modulating the inflammatory state via regulating the
release of inflammatory mediators, including Ccl2 and IL6. Per2 is
also a member of the period family, and is involved in maintaining
cardiovascular functions through the regulation of NO and
vasodilatatory prostaglandin production. Cry1 and Cry2 are
transported into the nucleus by Per1 and Per2 proteins, with
appropriate circadian timing. Cry1 and cry2 exhibit repressing
activity, which has a direct effect on clock-controlled target
genes by interacting with groups of RNA-binding proteins, helicases
and other transcriptional repressors (44). There is increasing evidence
indicating that the functional disturbance of Nos2 can affect the
response to hypoxia (45) and
innate immune response in the mucosa (46). It can release NO, serving as a
messenger molecule with distinct biological functions in the body.
Map3k1 encodes a serine/threonine kinase and is known to be
involved in certain signal-transduction cascades encompassing the
c-Jun N-terminal kinase and extracellular signal-regulated kinase
kinase pathways, and the nuclear factor-kB pathway. Reactive oxygen
species are signaling molecules, which function in stimulating the
protein synthesis of hypoxia-inducible factor 1 α (Hif-1α) through
activating the mitogen-activated protein kinase (MAPK) pathways
(47). To date, the biological
functions of MAPK in acute gastric lesion remains to be
elucidated.
Based on module analysis of the PPI networks, the
process of gastric lesions in WT mice were associated with
regulation of the glucocorticoid receptor signaling pathway,
regulation of the cellular stress response to stress, and
regulation of hormone secretion. It has been established that
acutely increased corticosterone has a protective effect on the
stomach against injury induced by stress (48). It has also been demonstrated that
the gastroprotective activity of glucocorticoids results from the
maintenance of mucus secretion, repair processes and gastric
mucosal blood flow, and the attenuation of harmful factors,
including increasing microvascular permeability and gastric
motility (47,49). In addition, glucocorticoids have a
compensatory gastroprotective role if the gastro-protective
mechanisms rendered by NO, capsaicin-sensitive sensory neurons and
prostaglandins are impaired (48).
The present study focused on the differences caused
by GDDR under stress-induced conditions. The WT and KOmice groups
were used to compare and analyze the differences. The correlation
between the expression of DEGs and the degree of pathologic damage
was not examined in the present study and requires further
investigation. The present study focused on examining the
differences between WT mice and GDDR-/- mice associated with
phenotype. The DEGs analyzed in the present study were also based
on phenotype. As, in the absence of stress, no significant
differences are found between the WT mice and KO mice, the gene
expression profiles in WT mice with and without stress were not
examined in the present study.
In conclusion, comprehensive bioinformatics analysis
of the DEGs was performed in the present study, which may be
associated with acute gastric lesions and regulated by GDDR. The
results provided an array of potent targets for future
investigations of the molecular mechanisms. The functions of the
genes identified in gastric lesions require confirmation in further
molecular biological experiments.
Acknowledgements
This study was supported by the National Natural
Science Foundation of China (grant no. 81270440).
References
|
1
|
Brodie DA and Hooke KF: The effect of
vasoactive agents on stress-induced gastric hemorrhage in the rat.
Digestion. 4:193–204. 1971. View Article : Google Scholar : PubMed/NCBI
|
|
2
|
Ernst H, Konturek PC, Brzozowski T, Lochs
H, Hahn EG and Konturek SJ: Adaptation of gastric mucosa to stress.
Effect of ranitidine. J Physiol Pharmacol. 49:405–419.
1998.PubMed/NCBI
|
|
3
|
Guo S, Gao Q, Jiao Q, Hao W, Gao X and Cao
JM: Gastric mucosal damage in water immersion stress: Mechanism and
prevention with GHRP-6. World J Gastroenterol. 18:3145–3155. 2012.
View Article : Google Scholar : PubMed/NCBI
|
|
4
|
Robles TF and Carroll JE: Restorative
biological processes and health. Soc Personal Psychol Compass.
5:518–537. 2011. View Article : Google Scholar : PubMed/NCBI
|
|
5
|
Lin HP, Lin HY, Lin WL and Huang AC:
Effects of stress, depression, and their interaction on heart rate,
skin conductance, finger temperature, and respiratory rate:
Sympathetic-parasympathetic hypothesis of stress and depression. J
Clin Psychol. 67:1080–1091. 2011. View Article : Google Scholar : PubMed/NCBI
|
|
6
|
Du JJ, Dou KF, Peng SY, Wang WZ, Wang ZH,
Xiao HS, Guan WX, Liu YB and Gao ZQ: Down-regulated full-length
novel gene GDDR and its effect on gastric cancer. Zhonghua Yi Xue
Za Zhi. 83:1166–1168. 2003.(In Chinese). PubMed/NCBI
|
|
7
|
Du JJ, Dou KF, Peng SY, Li JT, Wang WZ,
Guan WX and Gao ZQ: Study on novel gene GDDR related to gastric
cancer. Zhonghua Wai Ke Za Zhi. 43:10–13. 2005.(In Chinese).
PubMed/NCBI
|
|
8
|
May FE, Griffin SM and Westley BR: The
trefoil factor interacting protein TFIZ1 binds the trefoil protein
TFF1 preferentially in normal gastric mucosal cells but the
co-expression of these proteins is deregulated in gastric cancer.
Int J Biochem Cell Biol. 41:632–640. 2009. View Article : Google Scholar : PubMed/NCBI
|
|
9
|
Baus-Loncar M, Lubka M, Pusch CM, Otto WR,
Poulsom R and Blin N: Cytokine regulation of the trefoil factor
family binding protein GKN2 (GDDR/TFIZ1/blottin) in human
gastrointestinal epithelial cells. Cell Physiol Biochem.
20:193–204. 2007. View Article : Google Scholar : PubMed/NCBI
|
|
10
|
Menheniott TR, O'Connor L, Chionh YT,
Däbritz J, Scurr M, Rollo BN, Ng GZ, Jacobs S, Catubig A, Kurklu B,
et al: Loss of gastrokine-2 drives premalignant gastric
inflammation and tumor progression. J Clin Invest. 126:1383–1400.
2016. View
Article : Google Scholar : PubMed/NCBI
|
|
11
|
Moss SF, Lee JW, Sabo E, Rubin AK, Rommel
J, Westley BR, May FE, Gao J, Meitner PA, Tavares R and Resnick MB:
Decreased expression of gastrokine 1 and the trefoil factor
interacting protein TFIZ1/GKN2 in gastric cancer: Influence of
tumor histology and relationship to prognosis. Clin Cancer Res.
14:4161–4167. 2008. View Article : Google Scholar : PubMed/NCBI
|
|
12
|
Chu G, Qi S, Yang G, Dou K, Du J and Lu Z:
Gastrointestinal tract specific gene GDDR inhibits the progression
of gastric cancer in a TFF1 dependent manner. Mol Cell Biochem.
359:369–374. 2012. View Article : Google Scholar : PubMed/NCBI
|
|
13
|
Shi LS, Wang H, Wang F, Feng M, Wang M and
Guan WX: Effects of gastrokine2 expression on gastric cancer cell
apoptosis by activation of extrinsic apoptotic pathways. Mol Med
Rep. 10:2898–2904. 2014. View Article : Google Scholar : PubMed/NCBI
|
|
14
|
Kim O, Yoon JH, Choi WS, Ashktorab H,
Smoot DT, Nam SW, Lee JY and Park WS: GKN2 contributes to the
homeostasis of gastric mucosa by inhibiting GKN1 activity. J Cell
Physiol. 229:762–771. 2014. View Article : Google Scholar : PubMed/NCBI
|
|
15
|
Menheniott TR, Kurklu B and Giraud AS:
Gastrokines: Stomach-specific proteins with putative homeostatic
and tumor suppressor roles. Am J Physiol Gastrointest Liver
Physiol. 304:G109–G121. 2013. View Article : Google Scholar : PubMed/NCBI
|
|
16
|
Gang W, Chen F, Xiangui L, et al: The role
of new gene GDDR in the acute and chronic gastric mucosal injury in
mice. Progress in Modern Biomedicine. 10:1836–1839. 2015.
|
|
17
|
Shimozawa N, Okajima K, Harada N, Arai M,
Ishida Y, Shimada S, Kurihara H and Nakagata N: Contribution of
sensory neurons to sex difference in the development of
stress-induced gastric mucosal injury in mice. Gastroenterology.
131:1826–1834. 2006. View Article : Google Scholar : PubMed/NCBI
|
|
18
|
Menheniott TR, Peterson AJ, O'Connor L,
Lee KS, Kalantzis A, Kondova I, Bontrop RE, Bell KM and Giraud AS:
A novel gastrokine, Gkn3, marks gastric atrophy and shows evidence
of adaptive gene loss in humans. Gastroenterology. 138:1823–1835.
2010. View Article : Google Scholar : PubMed/NCBI
|
|
19
|
Santucci L, Fiorucci S, Giansanti M,
Brunori PM, Di Matteo FM and Morelli A: Pentoxifylline prevents
indomethacin induced acute gastric mucosal damage in rats: Role of
tumour necrosis factor alpha. Gut. 35:909–915. 1994. View Article : Google Scholar : PubMed/NCBI
|
|
20
|
Trapnell C, Pachter L and Salzberg SL:
TopHat: Discovering splice junctions with RNA-Seq. Bioinformatics.
25:1105–1111. 2009. View Article : Google Scholar : PubMed/NCBI
|
|
21
|
Gene Ontology C: The Gene Ontology (GO)
project in 2006. Nucleic Acids Research. 34:D322–326. 2006.
View Article : Google Scholar : PubMed/NCBI
|
|
22
|
Kanehisa M and Goto S: KEGG: Kyoto
encyclopedia of genes and genomes. Nucleic Acids Res. 28:27–30.
2000. View Article : Google Scholar : PubMed/NCBI
|
|
23
|
Dennis G Jr, Sherman BT, Hosack DA, Yang
J, Gao W, Lane HC and Lempicki RA: DAVID: Database for annotation,
visualization, and integrated discovery. Genome Biol. 4:P32003.
View Article : Google Scholar : PubMed/NCBI
|
|
24
|
Barabási AL and Oltvai ZN: Network
biology: Understanding the cell's functional organization. Nat Rev
Genet. 5:101–113. 2004. View
Article : Google Scholar : PubMed/NCBI
|
|
25
|
Prieto C, Risueño A, Fontanillo C and De
las Rivas J: Human gene coexpression landscape: Confident network
derived from tissue transcriptomic profiles. PLoS One. 3:e39112008.
View Article : Google Scholar : PubMed/NCBI
|
|
26
|
Livak KJ and Schmittgen TD: Analysis of
relative gene expression data using real-time quantitative PCR and
the 2(-Delta Delta C(T)) method. Methods. 25:402–408. 2001.
View Article : Google Scholar : PubMed/NCBI
|
|
27
|
Wang L, Wang S and Li W: RSeQC: Quality
control of RNA-seq experiments. Bioinformatics. 28:2184–2185. 2012.
View Article : Google Scholar : PubMed/NCBI
|
|
28
|
Nishida K, Ohta Y and Ishiguro I: Changes
in nitric oxide production with lesion development in the gastric
mucosa of rats with water immersion restraint stress. Res Commun
Mol Pathol Pharmacol. 100:201–212. 1998.PubMed/NCBI
|
|
29
|
S Kwiecien S, Pawlik MW, Brzozowski T,
Konturek PC, Sliwowski Z, Pawlik WW and Konturek SJ: Nitric oxide
(NO)-releasing aspirin and (NO) donors in protection of gastric
mucosa against stress. J Physiol Pharmacol. 59 Suppl 2:S103–S115.
2008.
|
|
30
|
Brzozowska I, Ptak-Belowska A, Pawlik M,
Pajdo R, Drozdowicz D, Konturek SJ, Pawlik WW and Brzozowski T:
Mucosal strengthening activity of central and peripheral melatonin
in the mechanism of gastric defense. J Physiol Pharmacol. 60 Suppl
7:47–56. 2009.PubMed/NCBI
|
|
31
|
Nur Azlina MF, Kamisah Y, Chua KH and
Qodriyah HM: Tocotrienol attenuates stress-induced gastric lesions
via activation of prostaglandin and upregulation of COX-1 mRNA.
Evid Based Complement Alternat Med. 2013:8047962013. View Article : Google Scholar : PubMed/NCBI
|
|
32
|
Li YM, Lu GM, Zou XP, Li ZS, Peng GY and
Fang DC: Dynamic functional and ultrastructural changes of gastric
parietal cells induced by water immersion-restraint stress in rats.
World J Gastroenterol. 12:3368–3372. 2006. View Article : Google Scholar : PubMed/NCBI
|
|
33
|
Brzozowski T: Role of renin-angiotensin
system and metabolites of angiotensin in the mechanism of gastric
mucosal protection. Curr Opin Pharmacol. 19:90–98. 2014. View Article : Google Scholar : PubMed/NCBI
|
|
34
|
Rohani MG and Parks WC: Matrix remodeling
by MMPs during wound repair. Matrix Biol 44–46. 1–121. 2015.
|
|
35
|
Wilgus TA: Growth factor-extracellular
matrix interactions regulate wound repair. Adv Wound Care (New
Rochelle). 1:249–254. 2012. View Article : Google Scholar : PubMed/NCBI
|
|
36
|
Sun Z, Liu H, Yang Z, Shao D, Zhang W, Ren
Y, Sun B, Lin J, Xu M and Nie S: Intestinal trefoil factor
activates the PI3K/Akt signaling pathway to protect gastric mucosal
epithelium from damage. Int J Oncol. 45:1123–1132. 2014. View Article : Google Scholar : PubMed/NCBI
|
|
37
|
Seibert K, Zhang Y, Leahy K, Hauser S,
Masferrer J, Perkins W, Lee L and Isakson P: Pharmacological and
biochemical demonstration of the role of cyclooxygenase 2 in
inflammation and pain. Proc Natl Acad Sci USA. 91:pp. 12013–12017.
1994; View Article : Google Scholar : PubMed/NCBI
|
|
38
|
Wallace JL, McKnight W, Reuter BK and
Vergnolle N: NSAID-induced gastric damage in rats: Requirement for
inhibition of both cyclooxygenase 1 and 2. Gastroenterology.
119:706–714. 2000. View Article : Google Scholar : PubMed/NCBI
|
|
39
|
Baek YH, Lee KN, Jun DW, Yoon BC, Kim JM,
Oh TY and Lee OY: Augmenting effect of DA-9601 on ghrelin in an
acute gastric injury model. Gut Liver. 5:52–56. 2011. View Article : Google Scholar : PubMed/NCBI
|
|
40
|
Adami M, Pozzoli C, Leurs R, Stark H and
Coruzzi G: Histamine H(3) receptors are involved in the protective
effect of ghrelin against HCl-induced gastric damage in rats.
Pharmacology. 86:259–266. 2010. View Article : Google Scholar : PubMed/NCBI
|
|
41
|
Okajima K, Murakami K, Liu W and Uchiba M:
Inhibition of neutrophil activation by ranitidine contributes to
prevent stress-induced gastric mucosal injury in rats. Crit Care
Med. 28:2858–2865. 2000. View Article : Google Scholar : PubMed/NCBI
|
|
42
|
Mifsud KR and Reul JM: Acute stress
enhances heterodimerization and binding of corticosteroid receptors
at glucocorticoid target genes in the hippocampus. Proc Natl Acad
Sci USA. 113:pp. 11336–11341. 2016; View Article : Google Scholar : PubMed/NCBI
|
|
43
|
Filaretova LP, Filaretov AA and Makara GB:
Corticosterone increase inhibits stress-induced gastric erosions in
rats. Am J Physiol. 274:G1024–G1030. 1998.PubMed/NCBI
|
|
44
|
Lee Y, Jang AR, Francey LJ, Sehgal A and
Hogenesch JB: KPNB1 mediates PER/CRY nuclear translocation and
circadian clock function. ELife. 4:2015. View Article : Google Scholar
|
|
45
|
Zhang F, Wu W, Deng Z, Zheng X, Zhang J,
Deng S, Chen J, Ma Q, Wang Y, Yu X, et al: High altitude increases
the expression of hypoxia-inducible factor 1alpha and inducible
nitric oxide synthase with intest-inal mucosal barrier failure in
rats. Int J Clin Exp Pathol. 8:5189–5195. 2015.PubMed/NCBI
|
|
46
|
Bogdan C: Nitric oxide synthase in innate
and adaptive immunity: An update. Trends Immunol. 36:161–178. 2015.
View Article : Google Scholar : PubMed/NCBI
|
|
47
|
Wang T, Leng YF and Zhang Y, Xue X, Kang
YQ and Zhang Y: Oxidative stress and hypoxia-induced factor 1α
expression in gastric ischemia. World J Gastroenterol.
17:1915–1922. 2011. View Article : Google Scholar : PubMed/NCBI
|
|
48
|
Filaretova L: Glucocorticoids are
gastroprotective under physiologic conditions. Ther Adv Chronic
Dis. 2:333–342. 2011. View Article : Google Scholar : PubMed/NCBI
|
|
49
|
Filaretova LP, Podvigina TT, Bagaeva TR,
Tanaka A and Takeuchi K: Mechanisms underlying the gastroprotective
action of glucocorticoids released in response to ulcerogenic
stress factors. Ann N Y Acad Sci. 1018:288–292. 2004. View Article : Google Scholar : PubMed/NCBI
|