Introduction
As the second most common cause of blindness
(1), glaucoma is characterized by
a visual field defect induced by progressive loss of retinal
ganglion cells (RGCs) and damage to the optic nerve head (ONH)
(1,2). Glaucoma may be classified into
primary open angle glaucoma (POAG) and closed angle glaucoma
according to the angle at the junction between the cornea and iris.
POAG is the most common form of glaucoma (3). Glaucoma is a multifactorial disease.
Elevated intraocular pressure (IOP) is a major risk factor for
glaucoma (4). In addition, old
age, family history, racial differences, severe myopia and low
diastolic perfusion were also associated with glaucoma (5–8).
Various genetic factors, such as vascular endothelial growth factor
(VEGF), forkhead box C1 (FOXC1), glutathione S-transferase mu 1
(GSTM1) and cross-linked actin networks (CLANs) has been identified
to be associated with glaucoma.
Previous research has shown that lowering IOP is the
only clinical treatment demonstrated to slow down the progression
of glaucoma (9). Identification of
differentially expressed genes (DEGs) in a disease compared with
normal control is an approach to find the key genes and pathways
associated with the process of diseases and may provide clues for
the pathogenesis and identify novel diagnostic and therapeutic
strategies. The advance of next generation sequencing technologies
allowed for improved identification of DEGs in glaucoma based on
previous microarray studies (10–14).
Due to the differences in sample size, microarray platforms and
analytical techniques among the multiple microarray studies, more
accurate profiles of DEGs with larger sample size than an
individual microarray can be obtained by integrated analysis of
multiple microarrays studies (15).
In order to elucidate the cellular and molecular
events associated with glaucoma, the present study identified DEGs
associated with glaucoma by integrated microarray analysis of
glaucoma. Functional annotation and protein-protein interaction
(PPI) network construction were performed to identify
glaucoma-associated DEGs and pathways to interpret the biological
functions of DEGs. Dysregulation of transcription factors (TFs) has
been indicated to be involved with the pathogenesis of various
diseases such as glaucoma, the glaucoma-specific transcriptional
regulatory network of TFs and DEGs was constructed. In addition,
the expression of DEGs was confirmed in the acute IOP elevation rat
model. The findings of the current study may provide novel insight
in the pathogenesis of glaucoma.
Materials and methods
Eligible gene expression profile of
glaucoma
Based on the Gene Expression Omnibus database (GEO;
www.ncbi.nlm.nih.gov/geo), the
microarray datasets of optic nerve head/optic nerve head astrocytes
in glaucoma and normal control (NC) groups were selected. In
addition, the selected datasets were the expression profile of
whole-genome sequencing and were normalized or original.
Statistical analysis
The present study used the metaMA package in R
version 3.2.3 to combine data from multiple microarray datasets and
obtained the individual P-values (16). DEGs in glaucoma compared with NC
were identified with False discovery rate (FDR) <0.05. The
heat-map of DEGs in glaucoma was obtained by using the heatmap.2
function in the Rgplots package (17).
Functional annotation
Functional annotation of DEGs in glaucoma was
performed using the Kyoto Encyclopedia of Genes and Genomes (KEGG)
pathway and Gene Ontology (GO) enrichment analyses with the online
software GeneCodis3 (genecodis.cnb.csic.es/analysis). FDR <0.05
was considered to be statistically significant.
PPI network constriction
PPI network was used to visualize protein-protein
interactions. Using Biological General Repository for Interaction
Datasets (BioGRID) (thebiogrid.org/) and Cytoscape version 3.3.0
(www.cytoscape.org/), the PPI network of
the top 20 upregulated DEGs and downregulated DEGs in glaucoma were
constructed. Nodes were used to represent the proteins and edges
were used to represent the interaction between two proteins.
Construction of glaucoma-specific
transcriptional regulatory network
The promoter regions of top 20 up and downregulated
DEGs in glaucoma were obtained using the University of California
Santa Cruz (UCSC) Genome Browser (genome.ucsc.edu). The online tool TRANFAC (18) was used to obtain TFs and motif
sequences of binding sites and position weight matrix (PWM). The
present study used PWM-scan to obtained the TFs which regulate
proteins encoded by DEGs and constructed glaucoma-specific
transcriptional regulatory network of top 20 upregulated and
downregulated DEGs using Cytoscape version 3.3.0.
Acute elevation of IOP
A total of 9 male Sprague-Dawley rats (age, 8–10
weeks; weight, ~300 g) were housed under normal atmosphere with
controlled-temperature (25°C), illumination (12-h light/dark cycle)
and with free access to food and water. The 9 rats were divided
randomly into control group, model 1 day group and model 5 day
group. Except control group, the acute IOP elevation rat model was
established by saline perfusion into anterior chamber as previously
described (19). IOP was raised by
elevating the reservoir of saline 120 cm above the animal's eye for
1 h. IOP was measured using an Icare TonoLab tonometer (ICare
Finland Oy, Vantaa, Finland).
RT-qPCR validation of DEGs
After the acute IOP elevation rat model
establishment, the rat eyeball tissues in control group (n=3),
model 1 day group (n=3) and model 5 day group (n=3) were obtained
prior to acute IOP elevation rats model establishment and on the
first and fifth day after acute IOP elevation rats model
establishment. The total RNA was extracted with TRIzol reagent
(Invitrogen; Thermo Fisher Scientific, Inc., Waltham, MA, USA).
cDNA was generated from extracted RNA with SuperScript III Reverse
Transcriptase (Invitrogen; Thermo Fisher Scientific, Inc.)
incubated at 42°C for 1 h and 72°C for 10 min. In an ABI 7500
real-time PCR system (Applied Biosystems; Thermo Fisher Scientific,
Inc.), qPCR was performed with Power SYBR-Green PCR Master mix
(Thermo Fisher Scientific, Inc.). Cycling conditions were 95°C for
15 min followed by 40 cycles of 95°C for 10 sec, 55°C for 30 sec
and 72°C 32 sec. The relative gene expression of selected DEGs was
analyzed using 2−ΔΔCq method (20). The forward and reverse primers
(Majorbio Co., Shanghai, China) are presented in Table I. The human 18srRNA was used as
endogenous control for mRNA expression in analysis. Quantification
of mRNA expression was performed using GraphPad Prism version 5
(GraphPad Inc., La Jolla, CA).
 | Table I.Primers used in reverse transcription
quantitative polymerase chain reaction. |
Table I.
Primers used in reverse transcription
quantitative polymerase chain reaction.
| Gene | Primers
(5′-3′) |
|---|
| RFTN1 | Forward:
agaaggcagagcttcccaat |
|
| Reverse:
aggtgttcttcccatccctg |
| BCKDHB | Forward:
atactttaccgggcagcagt |
|
| Reverse:
ttttcttgggccatggaagc |
| CASP1 | Forward:
acaaagaaggtggcgcattt |
|
| Reverse:
aacatcagctccgactctcc |
| NMI | Forward:
atatcgatggggacgcatgt |
|
| Reverse:
cctcagacagttcatcggga |
| PLPP3 | Forward:
ccttatgtggccgctctcta |
|
| Reverse:
tggcccgagaagaaggattt |
| DCLK1 | Forward:
ccatcgtgacatcaagccag |
|
| Reverse:
aggccatatccagtctctgc |
| KCTD12 | Forward:
atggaggagagggagcagta |
|
| Reverse:
caaaacgacacccaggacag |
| HEPH | Forward:
accttagctggcaccttgat |
|
| Reverse:
tctgtccgtggaagaaagct |
| ID1 | Forward:
aacagcaggtgaacgttctg |
|
| Reverse:
tcgcgacttcagactcagag |
| ABCA8 | Forward:
aaacagcccaccaactccta |
|
| Reverse:
ttcatcctgggttgtctgct |
| MID1 | Forward:
ttgtgtaaactggttgggcg |
|
| Reverse:
cttggcttcttgacgggatg |
| PBX1 | Forward:
agccgaattgcaggtctttc |
|
| Reverse:
tctcctcttccagccctttg |
| SEPP1 | Forward:
ggtttgccctactccttcct |
|
| Reverse:
ttgtcatggtgcttgtggtg |
| FUT8 | Forward:
gaaaattcacttcggggcgt |
|
| Reverse:
tctggttgtgggcattttgg |
| NBN | Forward:
cagagctggcagttcaagtg |
|
| Reverse:
tcctcactgctgtcctgaag |
| SELENBP1 | Forward:
atacatgtgtgggactggca |
|
| Reverse:
gtagaagcgctggatgttgg |
| HDAC1 | Forward:
tacgacggggatgttggaaa |
|
| Reverse:
ttggtcatctcctcagcgtt |
| AMIGO2 | Forward:
tgccatgttccaggagctaa |
|
| Reverse:
agatcagccagcttgaacct |
| GEM | Forward:
tctgcggtggaagagttgat |
|
| Reverse:
tctttgggtcaatctgggct |
| CYFIP2 | Forward:
acttcctccccaactactgc |
|
| Reverse:
gcggtaggagctgtagatgt |
Results
Identification of DEGs in
glaucoma
Three datasets, including GSE45570, GSE9944 and
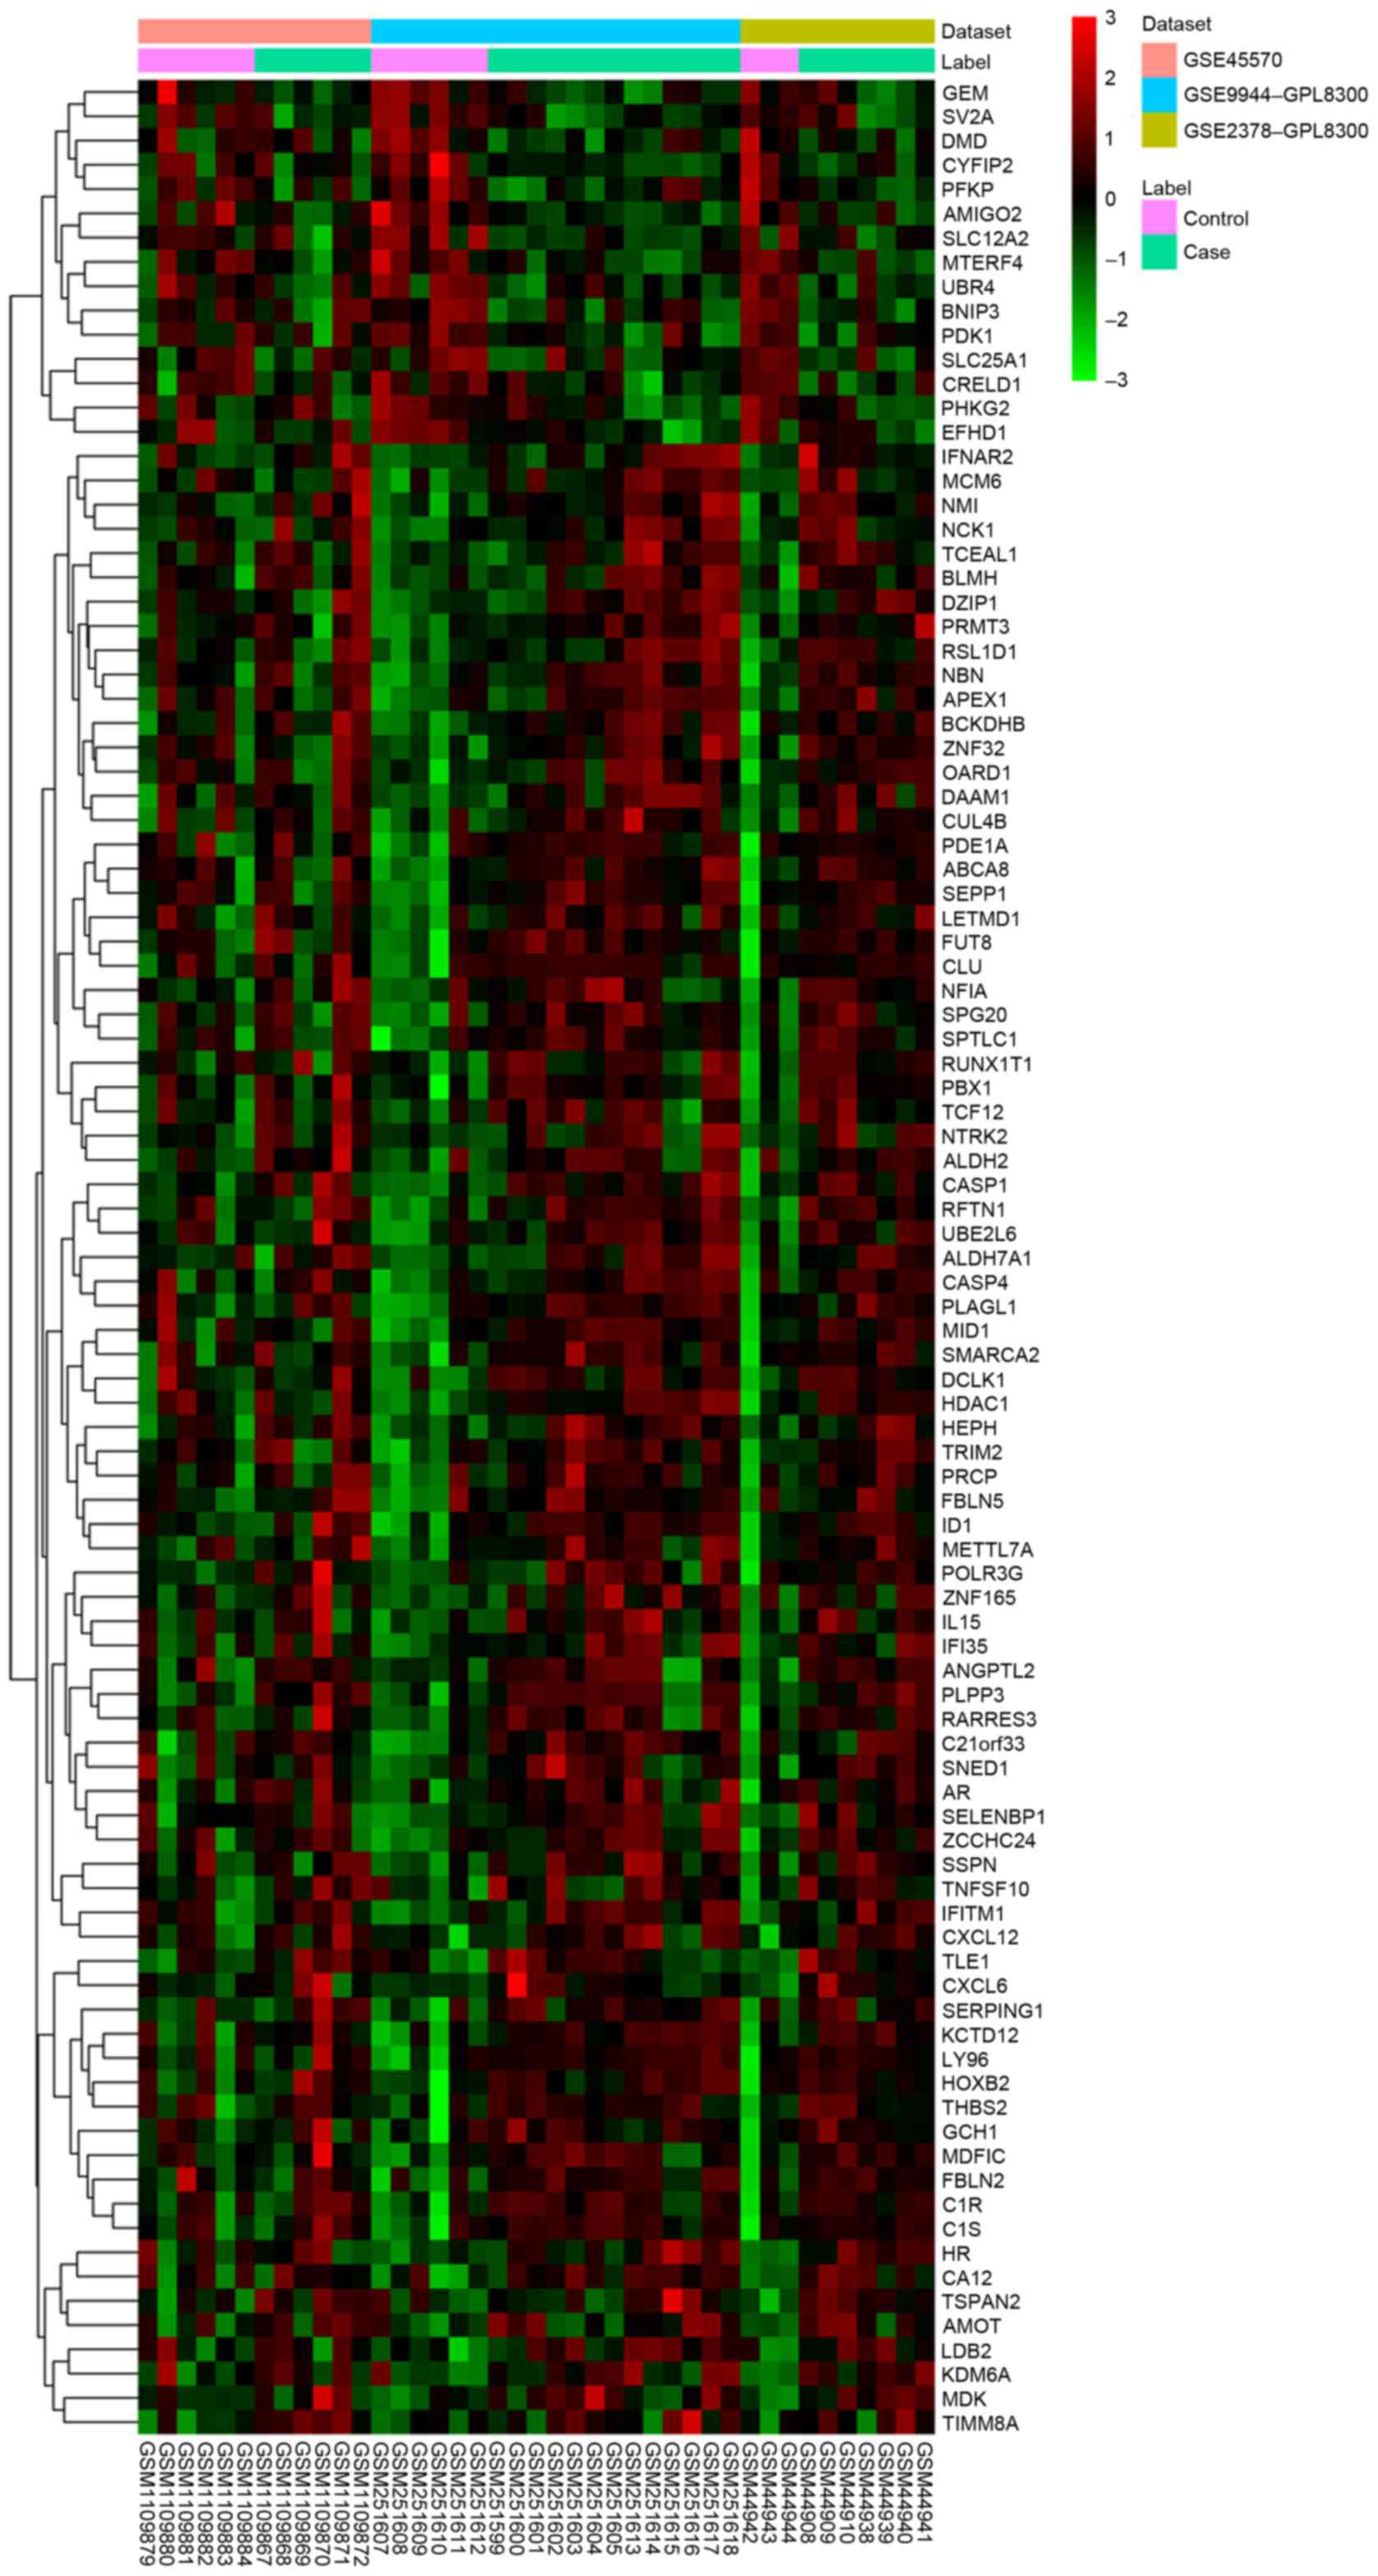
GSE2378 were used in the current study (Table II). A total of 97 DEGs (82
upregulated and 15 downregulated were identified in glaucoma
samples compared with the NC group with FDR <0.05. The heatmap
of DEGs in glaucoma was illustrated in Fig. 1 and the top 20 DEGs in glaucoma
were displayed in Table III.
| Table II.mRNA expression datasets used in this
study. |
Table II.
mRNA expression datasets used in this
study.
| GEO accession
no. | Platform | Normal:Case | Year | Tissue |
|---|
| GSE45570 | GPL5175 | 6:6 | 2013 | Optic nerve
head |
| GSE9944 | GPL8300 | 6:13 | 2008 | Optic nerve head
astrocytes |
| GSE2378 | GPL8300 | 3:7 | 2005 | Optic nerve head
astrocytes |
| Table III.Top 20 differentially expressed genes
in glaucoma compared with normal control. |
Table III.
Top 20 differentially expressed genes
in glaucoma compared with normal control.
| ID | Gene name | Combined ES | P-value | FDR | Regulation |
|---|
| 23180 | RFTN1 | 1.97057 |
1.18×10⁻⁶ | 0.001965 | Up |
| 594 | BCKDHB | 1.863234 |
1.38×10⁻⁶ | 0.001965 | Up |
| 834 | CASP1 | 1.901172 |
4.48×10⁻⁷ | 0.001965 | Up |
| 9111 | NMI | 1.813946 |
1.10×10⁻⁶ | 0.001965 | Up |
| 347902 | AMIGO2 | −1.86914 |
2.38×10⁻⁶ | 0.002707 | Down |
| 8613 | PLPP3 | 1.69169 |
3.85×10⁻⁶ | 0.002979 | Up |
| 9201 | DCLK1 | 1.84913 |
4.72×10⁻⁶ | 0.002979 | Up |
| 115207 | KCTD12 | 1.796888 |
5.38×10⁻⁶ | 0.003057 | Up |
| 2669 | GEM | −1.66006 |
6.53×10⁻⁶ | 0.003149 | Down |
| 9843 | HEPH | 1.663202 |
7.21×10⁻⁶ | 0.003149 | Up |
| 3397 | ID1 | 1.677848 |
8.45×10⁻⁶ | 0.003428 | Up |
| 10351 | ABCA8 | 1.753583 |
1.68×10⁻⁵ | 0.006363 | Up |
| 4281 | MID1 | 1.770553 |
1.81×10⁻⁵ | 0.006411 | Up |
| 5087 | PBX1 | 1.616593 |
2.08×10⁻⁵ | 0.006948 | Up |
| 6414 | SEPP1 | 1.711474 |
2.27×10⁻⁵ | 0.007171 | Up |
| 2530 | FUT8 | 1.5493 |
2.47×10⁻⁵ | 0.007393 | Up |
| 3065 | HDAC1 | 1.642544 |
3.09×10⁻⁵ | 0.008781 | Up |
| 26999 | CYFIP2 | −1.5543 |
4.16×10⁻⁵ | 0.010273 | Down |
| 4683 | NBN | 1.51878 |
3.96×10⁻⁵ | 0.010273 | Up |
| 8991 | SELENBP1 | 1.577832 |
3.99×10⁻⁵ | 0.010273 | Up |
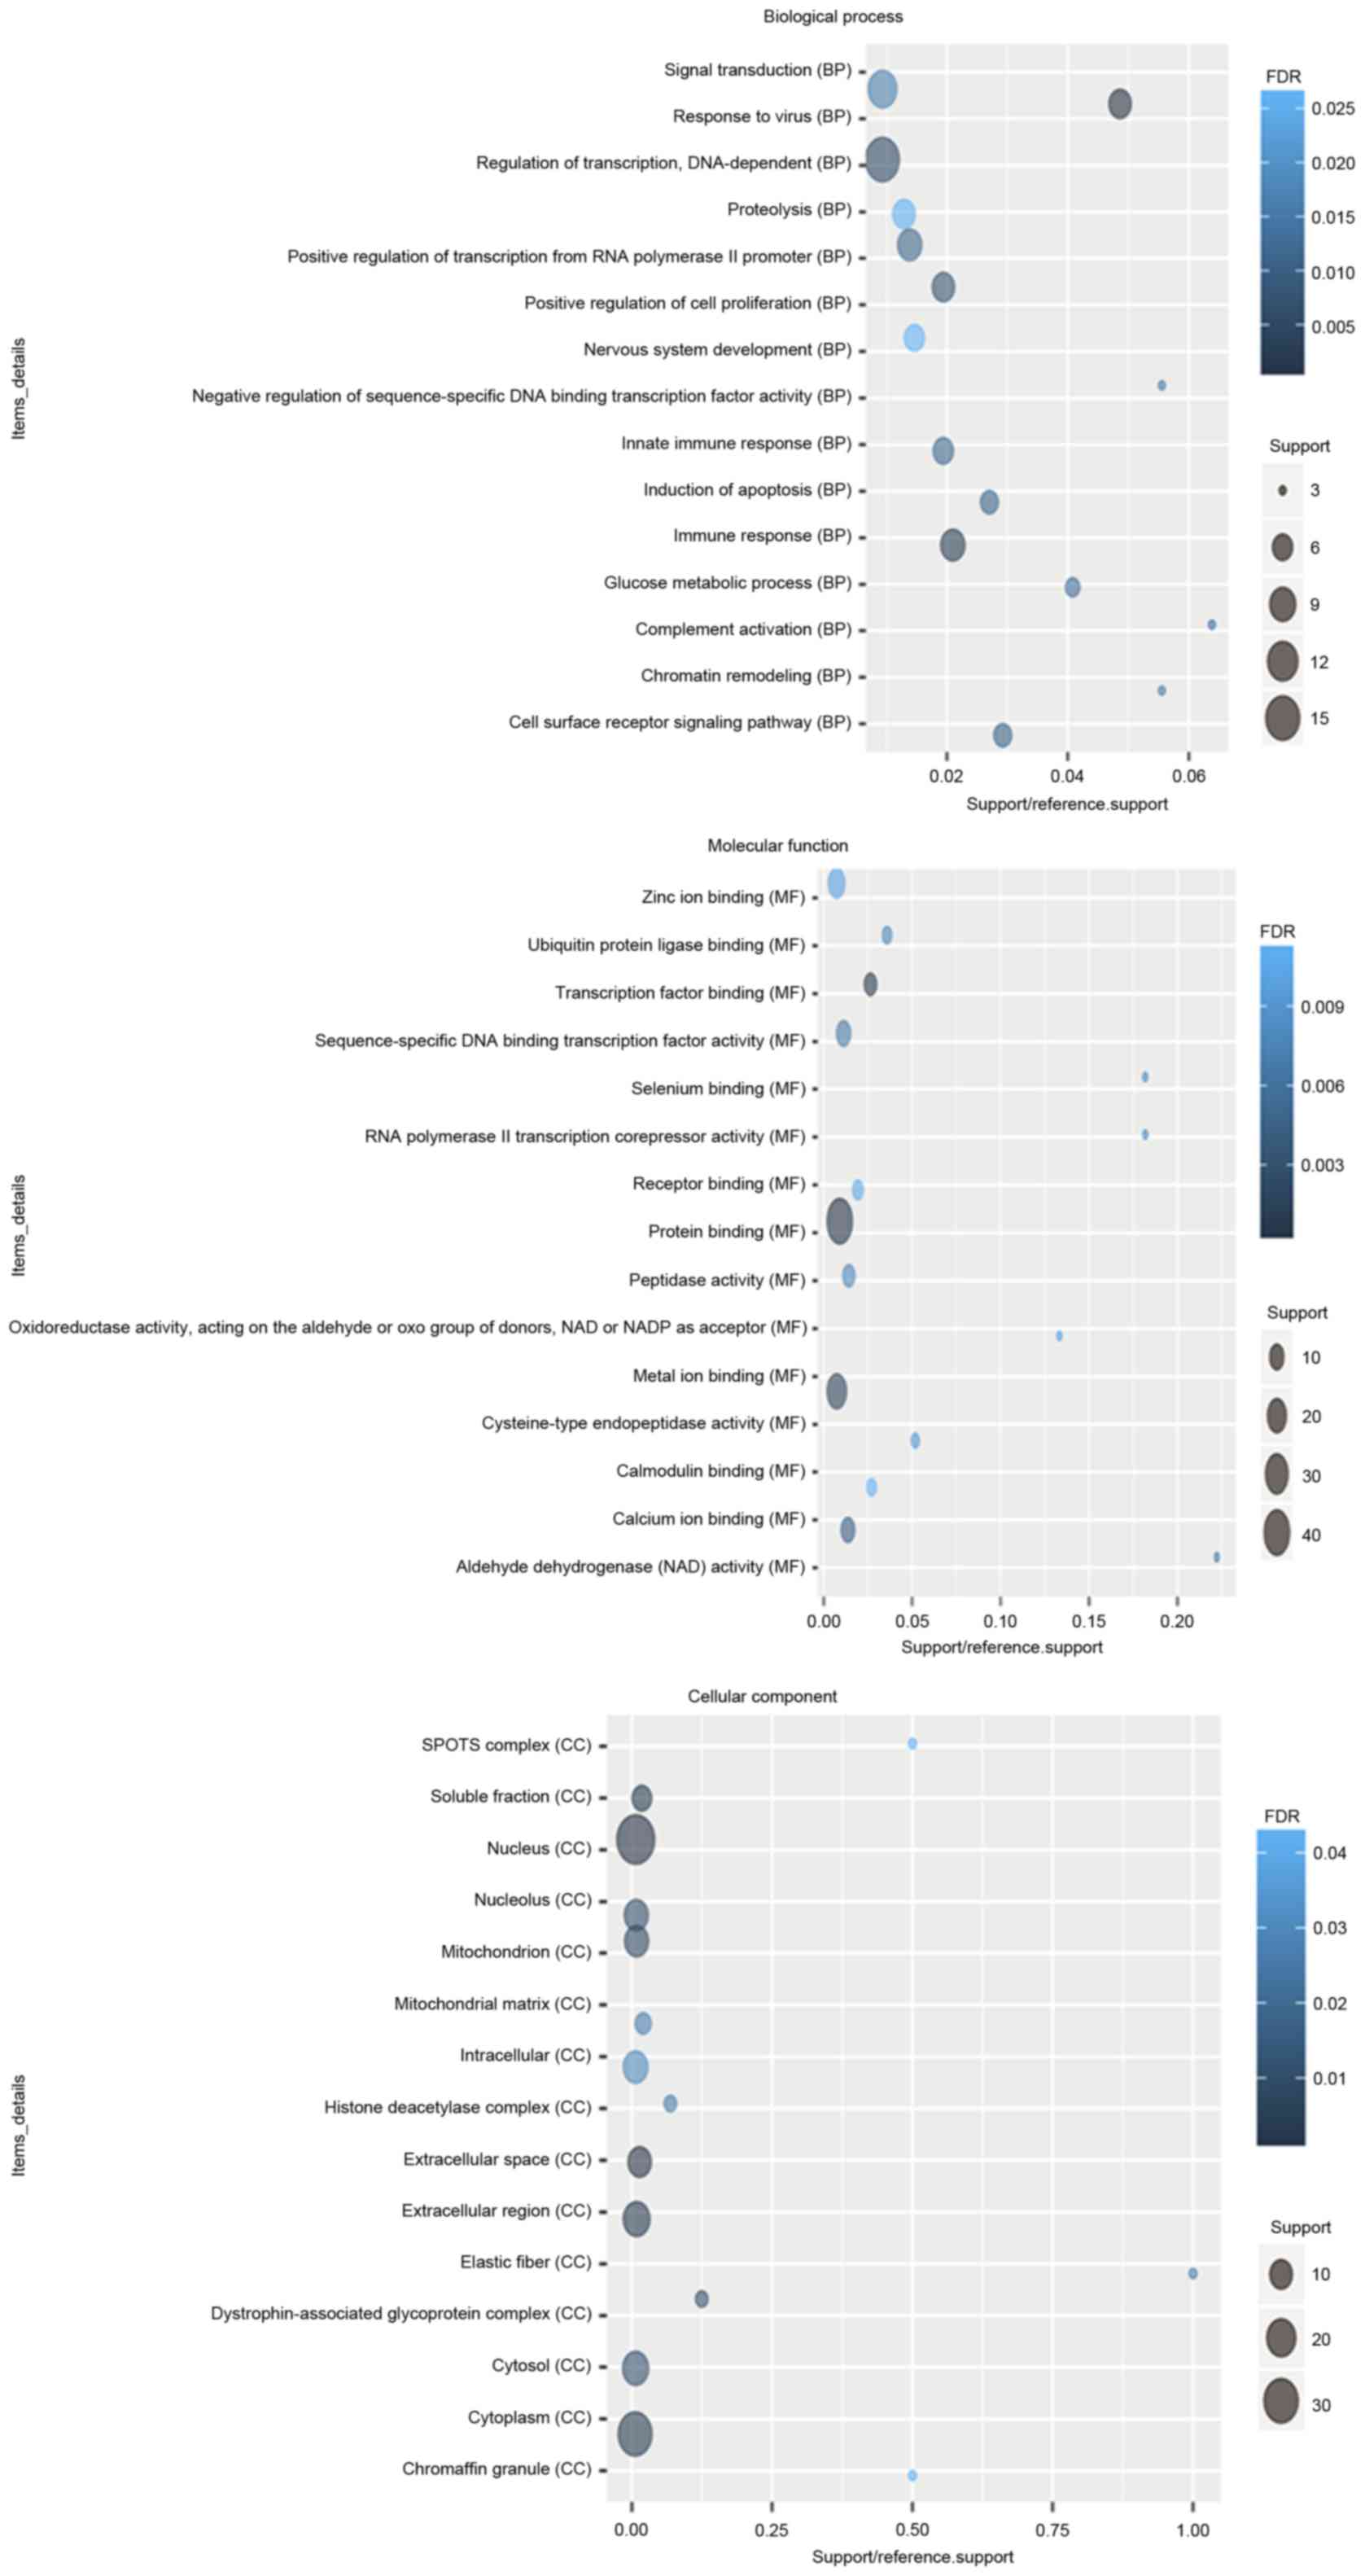
Functional annotation
According to the GO enrichment analysis, response to
virus (FDR=7.11×10⁻⁵), immune response (FDR=0.00252621),
protein binding (FDR=2.59×10⁻¹⁰), transcription factor
binding (FDR=0.000806942), nucleus (FDR=1.24×10⁻⁶),
extracellular space (FDR=0.000618804) were significantly enriched
GO terms of DEGs in glaucoma. The top 20 significantly enriched GO
terms including biological process, cellular component and
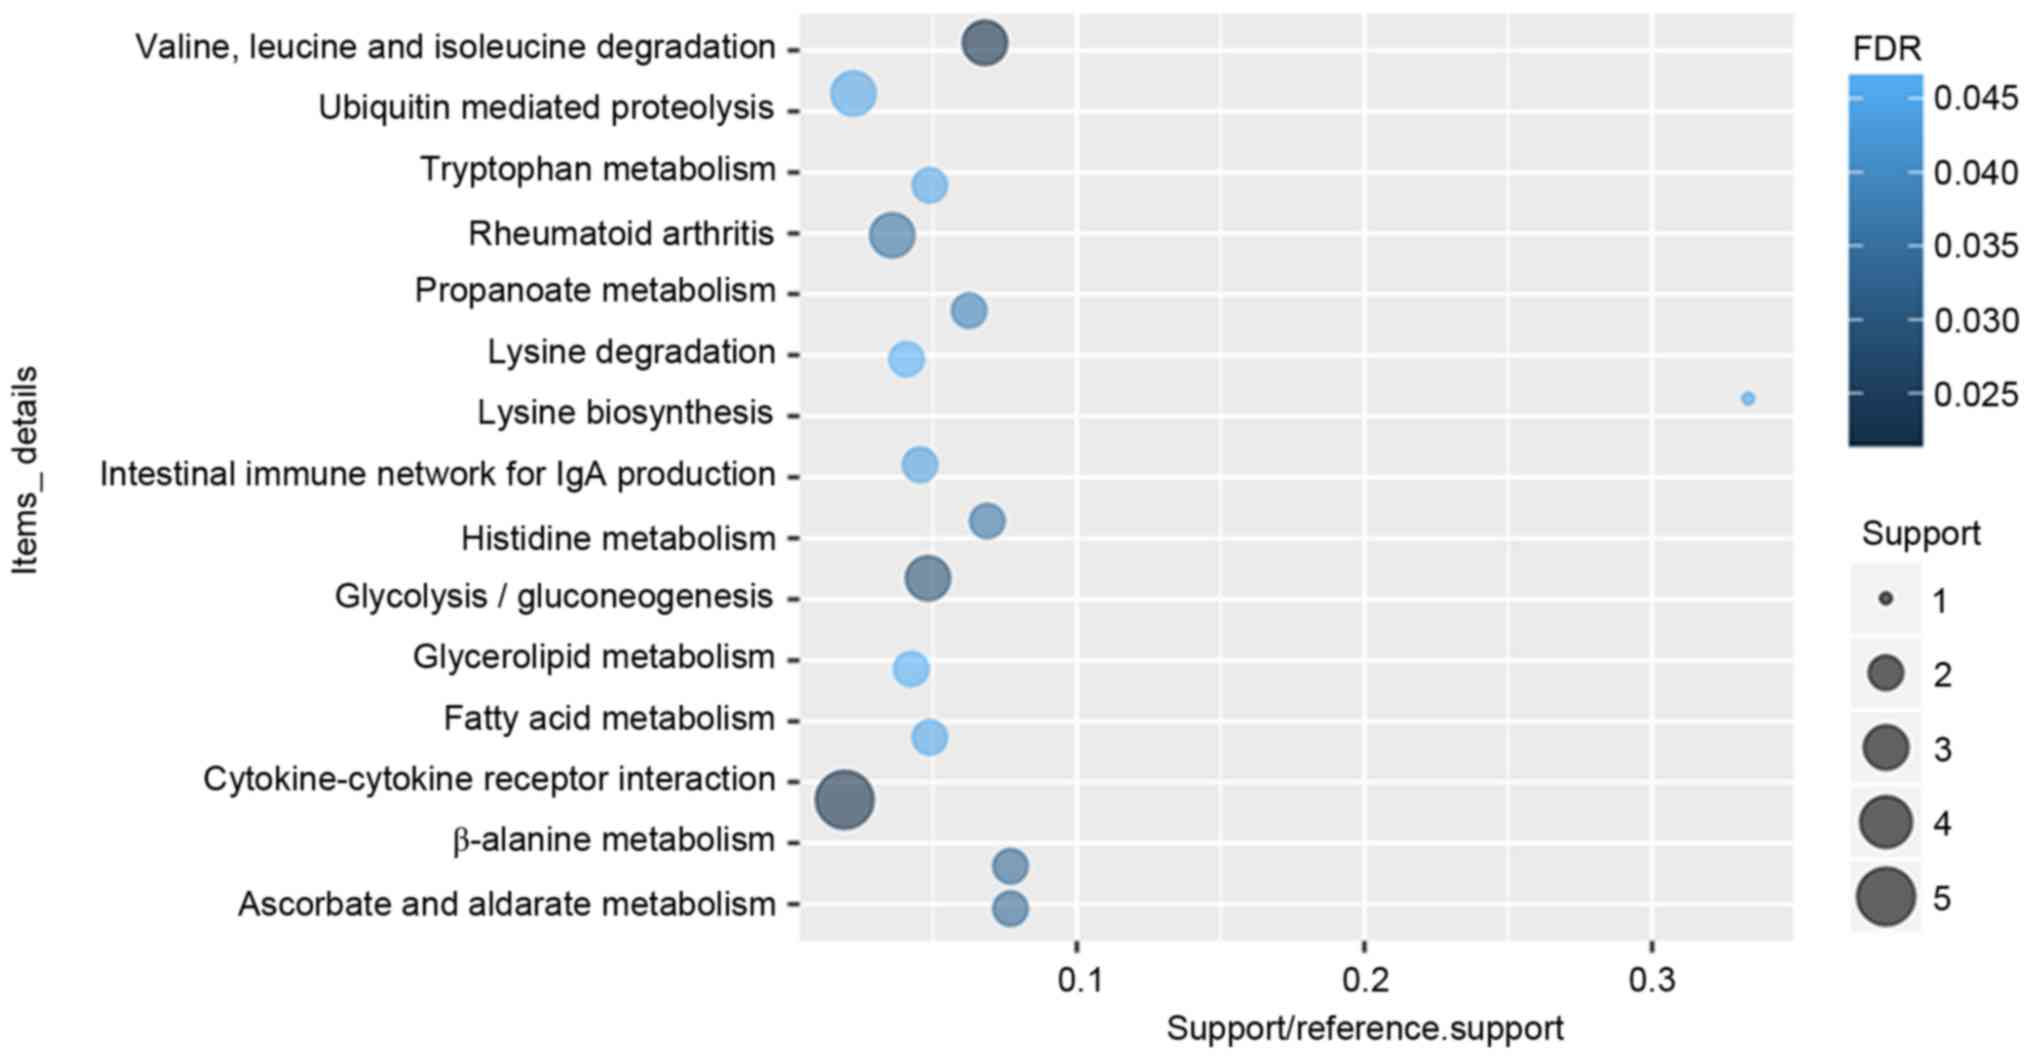
molecular function of DEGs in glaucoma were displayed in Fig. 2. After the KEGG enrichment
analysis, Valine, leucine and isoleucine degradation
(FDR=0.0213357), Cytokine-cytokine receptor interaction
(FDR=0.0220177), Glycolysis/gluconeogenesis (FDR=0.0293935) were
most significantly enriched pathways of DEGs in glaucoma. The
significantly enriched KEGG pathways of DEGs in glaucoma were
displayed in Fig. 3 and Table IV.
| Table IV.Significantly enriched Kyoto
Encyclopedia of Genes and Genomes pathways of differentially
expressed genes in glaucoma compared with normal control. |
Table IV.
Significantly enriched Kyoto
Encyclopedia of Genes and Genomes pathways of differentially
expressed genes in glaucoma compared with normal control.
| ID | Function | Count | P-value | FDR | Genes |
|---|
| 00280 | Valine, leucine and
isoleucine degradation | 3 | 0.0002452 | 0.0213357 | ALDH7A1, BCKDHB,
ALDH2 |
| 04060 | Cytokine-cytokine
receptor interaction | 5 | 0.0007592 | 0.0220177 | CXCL6, IL15,
IFNAR2, CXCL12, TNFSF10 |
| 00010 |
Glycolysis/gluconeogenesis | 3 | 0.0006757 | 0.0293935 | ALDH7A1, PFKP,
ALDH2 |
| 00410 | β-alanine
metabolism | 2 | 0.0023259 | 0.0337254 | ALDH7A1, ALDH2 |
| 00053 | Ascorbate and
aldarate metabolism | 2 | 0.0023259 | 0.0337254 | ALDH7A1, ALDH2 |
| 05323 | Rheumatoid
arthritis | 3 | 0.0016298 | 0.0354476 | CXCL6, IL15,
CXCL12 |
| 00340 | Histidine
metabolism | 2 | 0.0028901 | 0.0359192 | ALDH7A1, ALDH2 |
| 00640 | Propanoate
metabolism | 2 | 0.0035119 | 0.0381914 | ALDH7A1, ALDH2 |
| 04672 | Intestinal immune
network for IgA production | 2 | 0.0065563 | 0.043877 | IL15, CXCL12 |
| 00300 | Lysine
biosynthesis | 1 | 0.0082213 | 0.0447033 | ALDH7A1 |
| 04120 | Ubiquitin mediated
proteolysis | 3 | 0.0062022 | 0.0449656 | CUL4B, UBE2L6,
MID1 |
| 00071 | Fatty acid
metabolism | 2 | 0.0057135 | 0.0451886 | ALDH7A1, ALDH2 |
| 00380 | Tryptophan
metabolism | 2 | 0.0057135 | 0.0451886 | ALDH7A1, ALDH2 |
| 00561 | Glycerolipid
metabolism | 2 | 0.0074521 | 0.0463094 | ALDH7A1, ALDH2 |
| 00310 | Lysine
degradation | 2 | 0.0080782 | 0.0468536 | ALDH7A1, ALDH2 |
| 00330 | Arginine and
proline metabolism | 2 | 0.0097429 | 0.0470908 | ALDH7A1, ALDH2 |
| 05130 | Pathogenic
Escherichia coli infection | 2 | 0.0097429 | 0.0470908 | NCK1, LY96 |
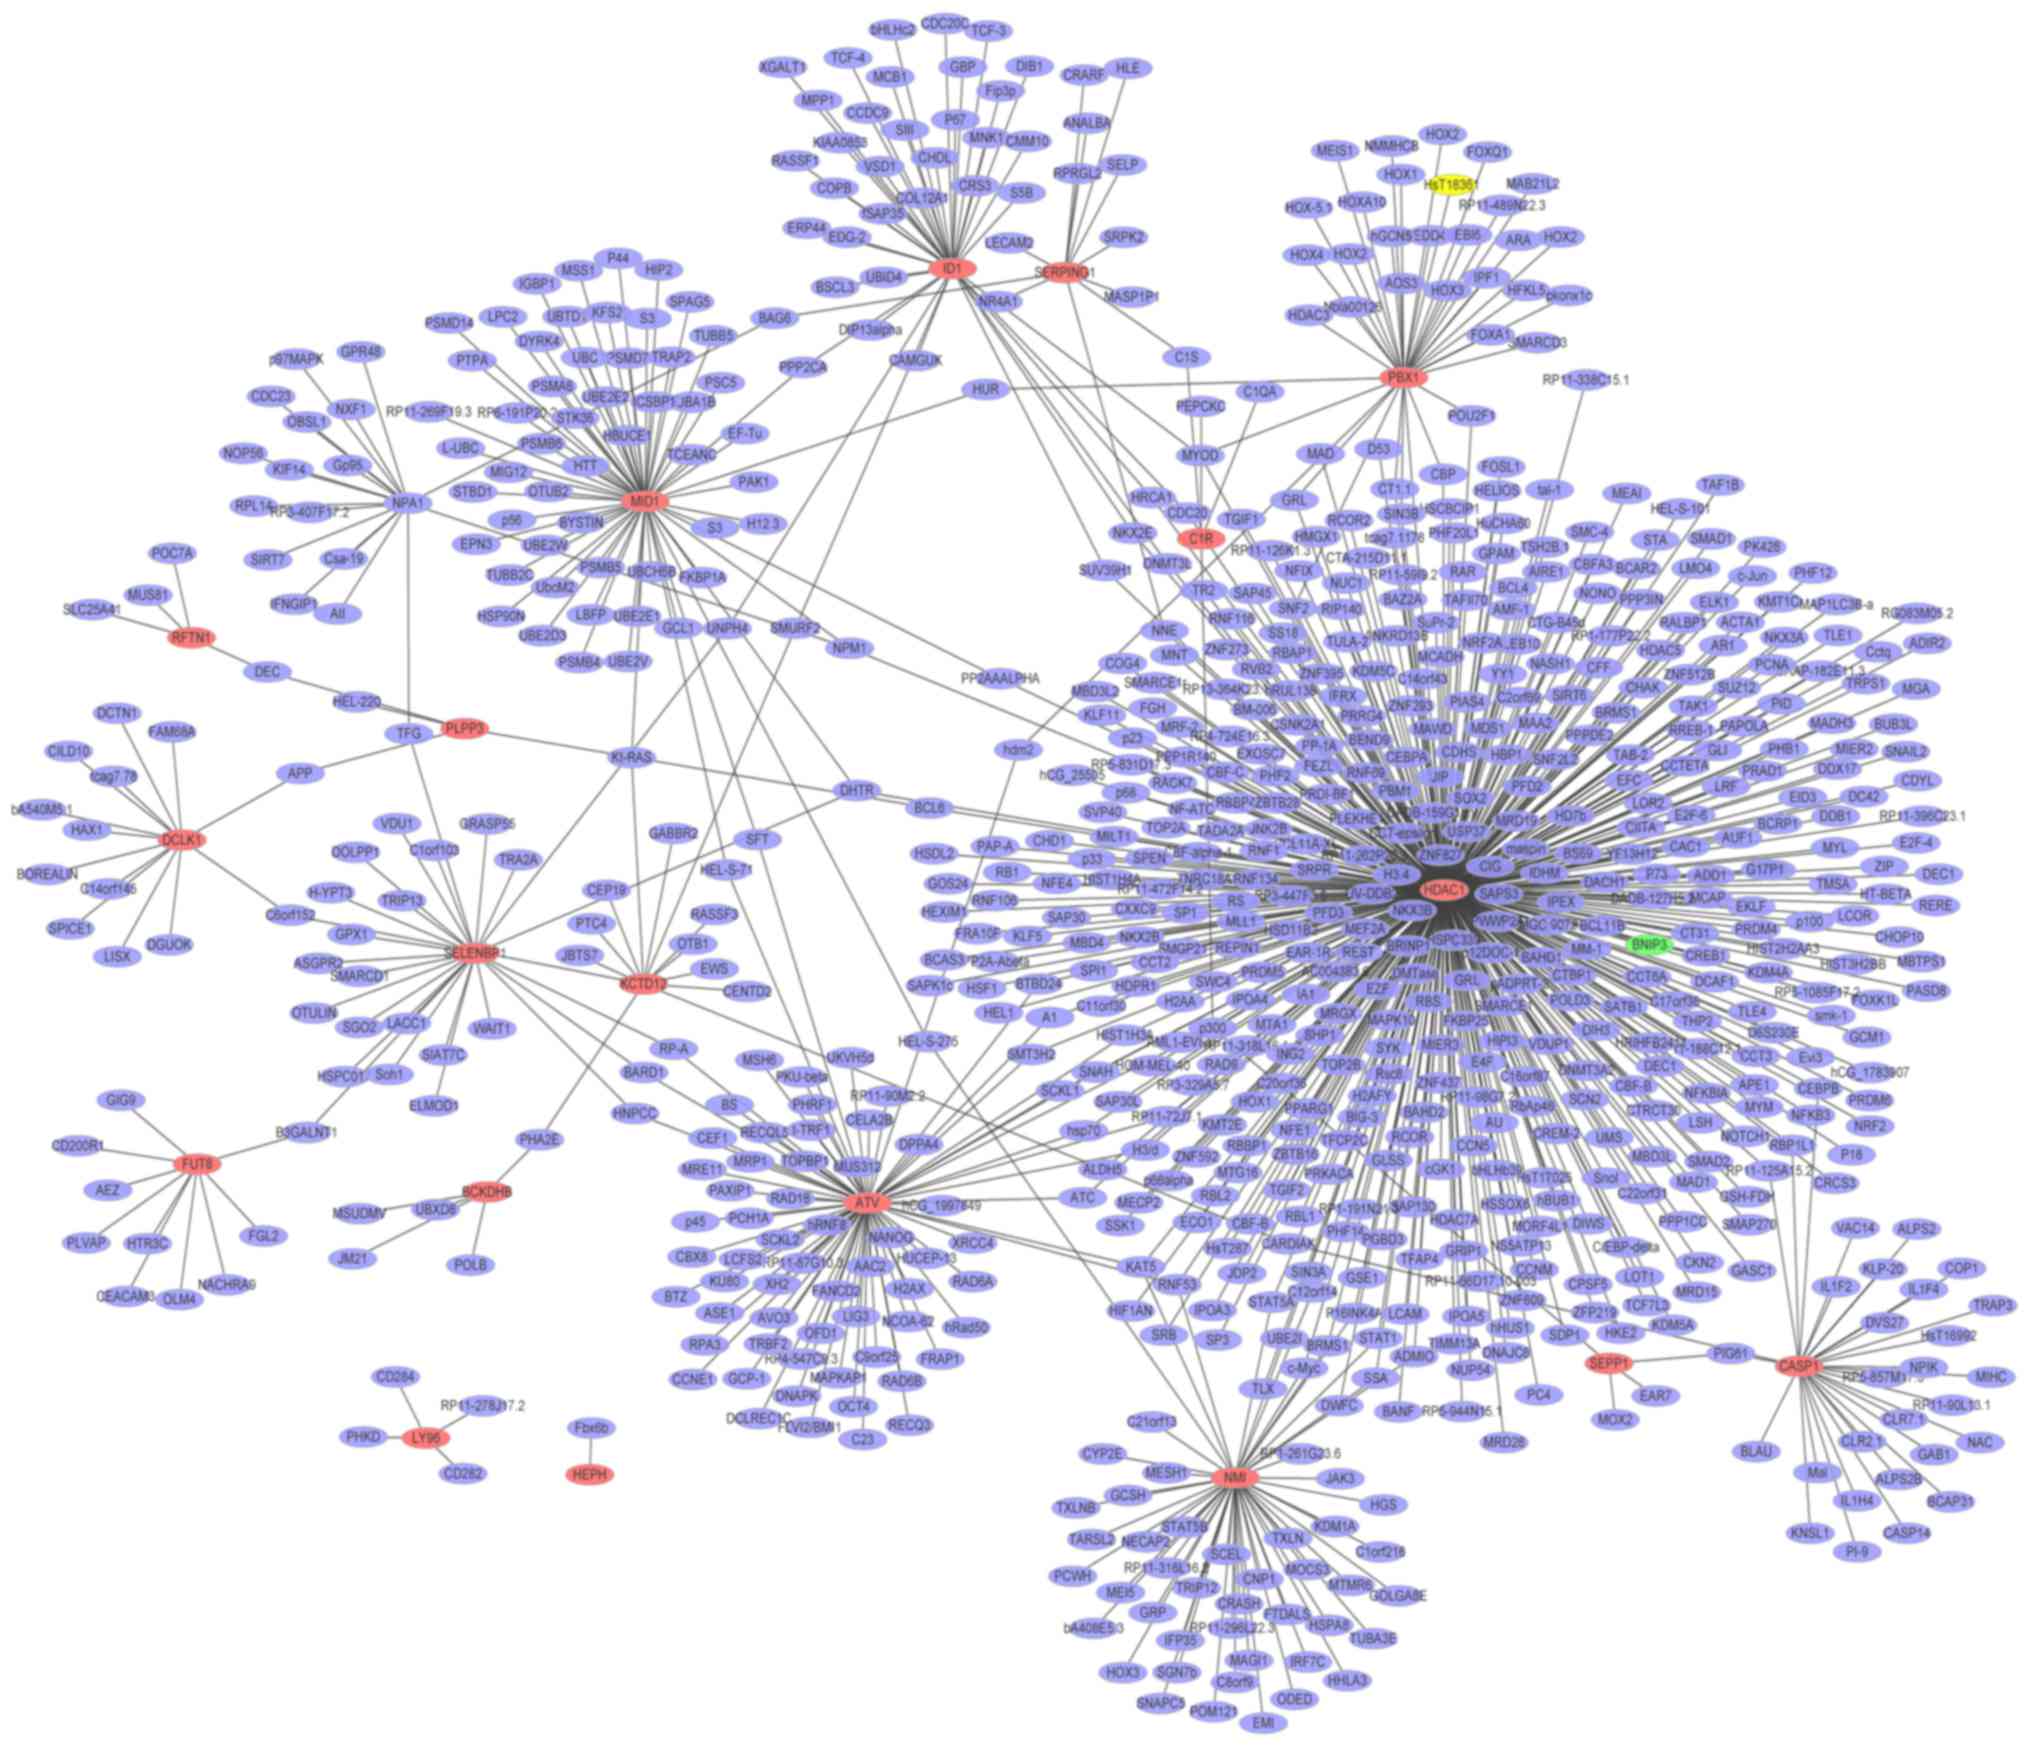
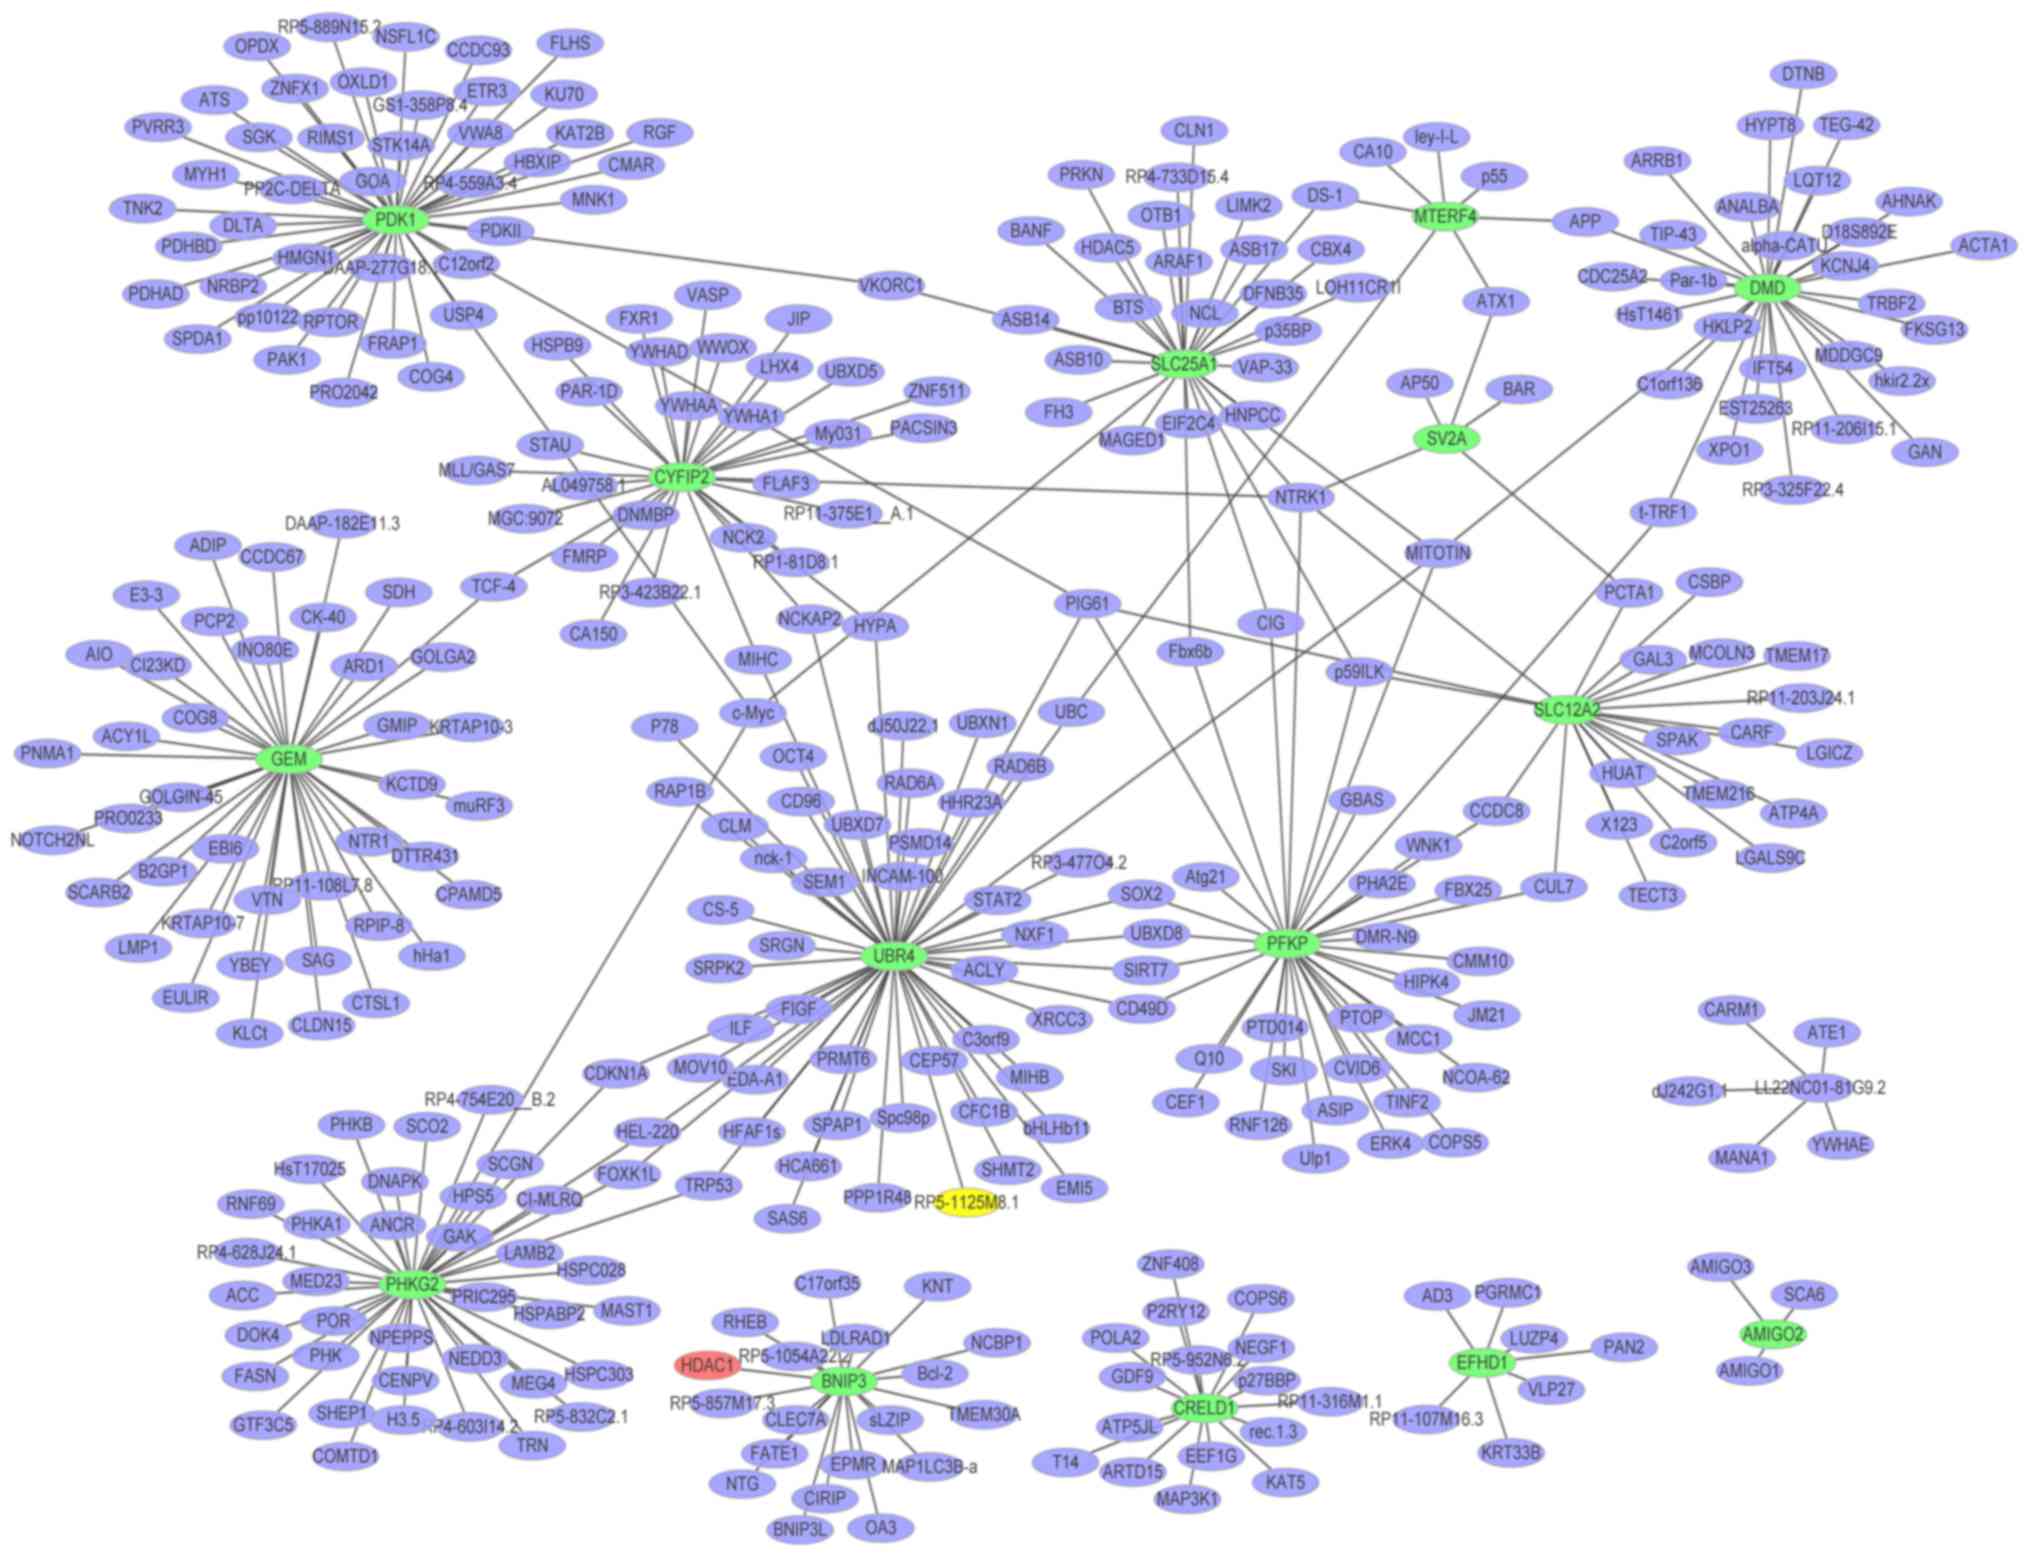
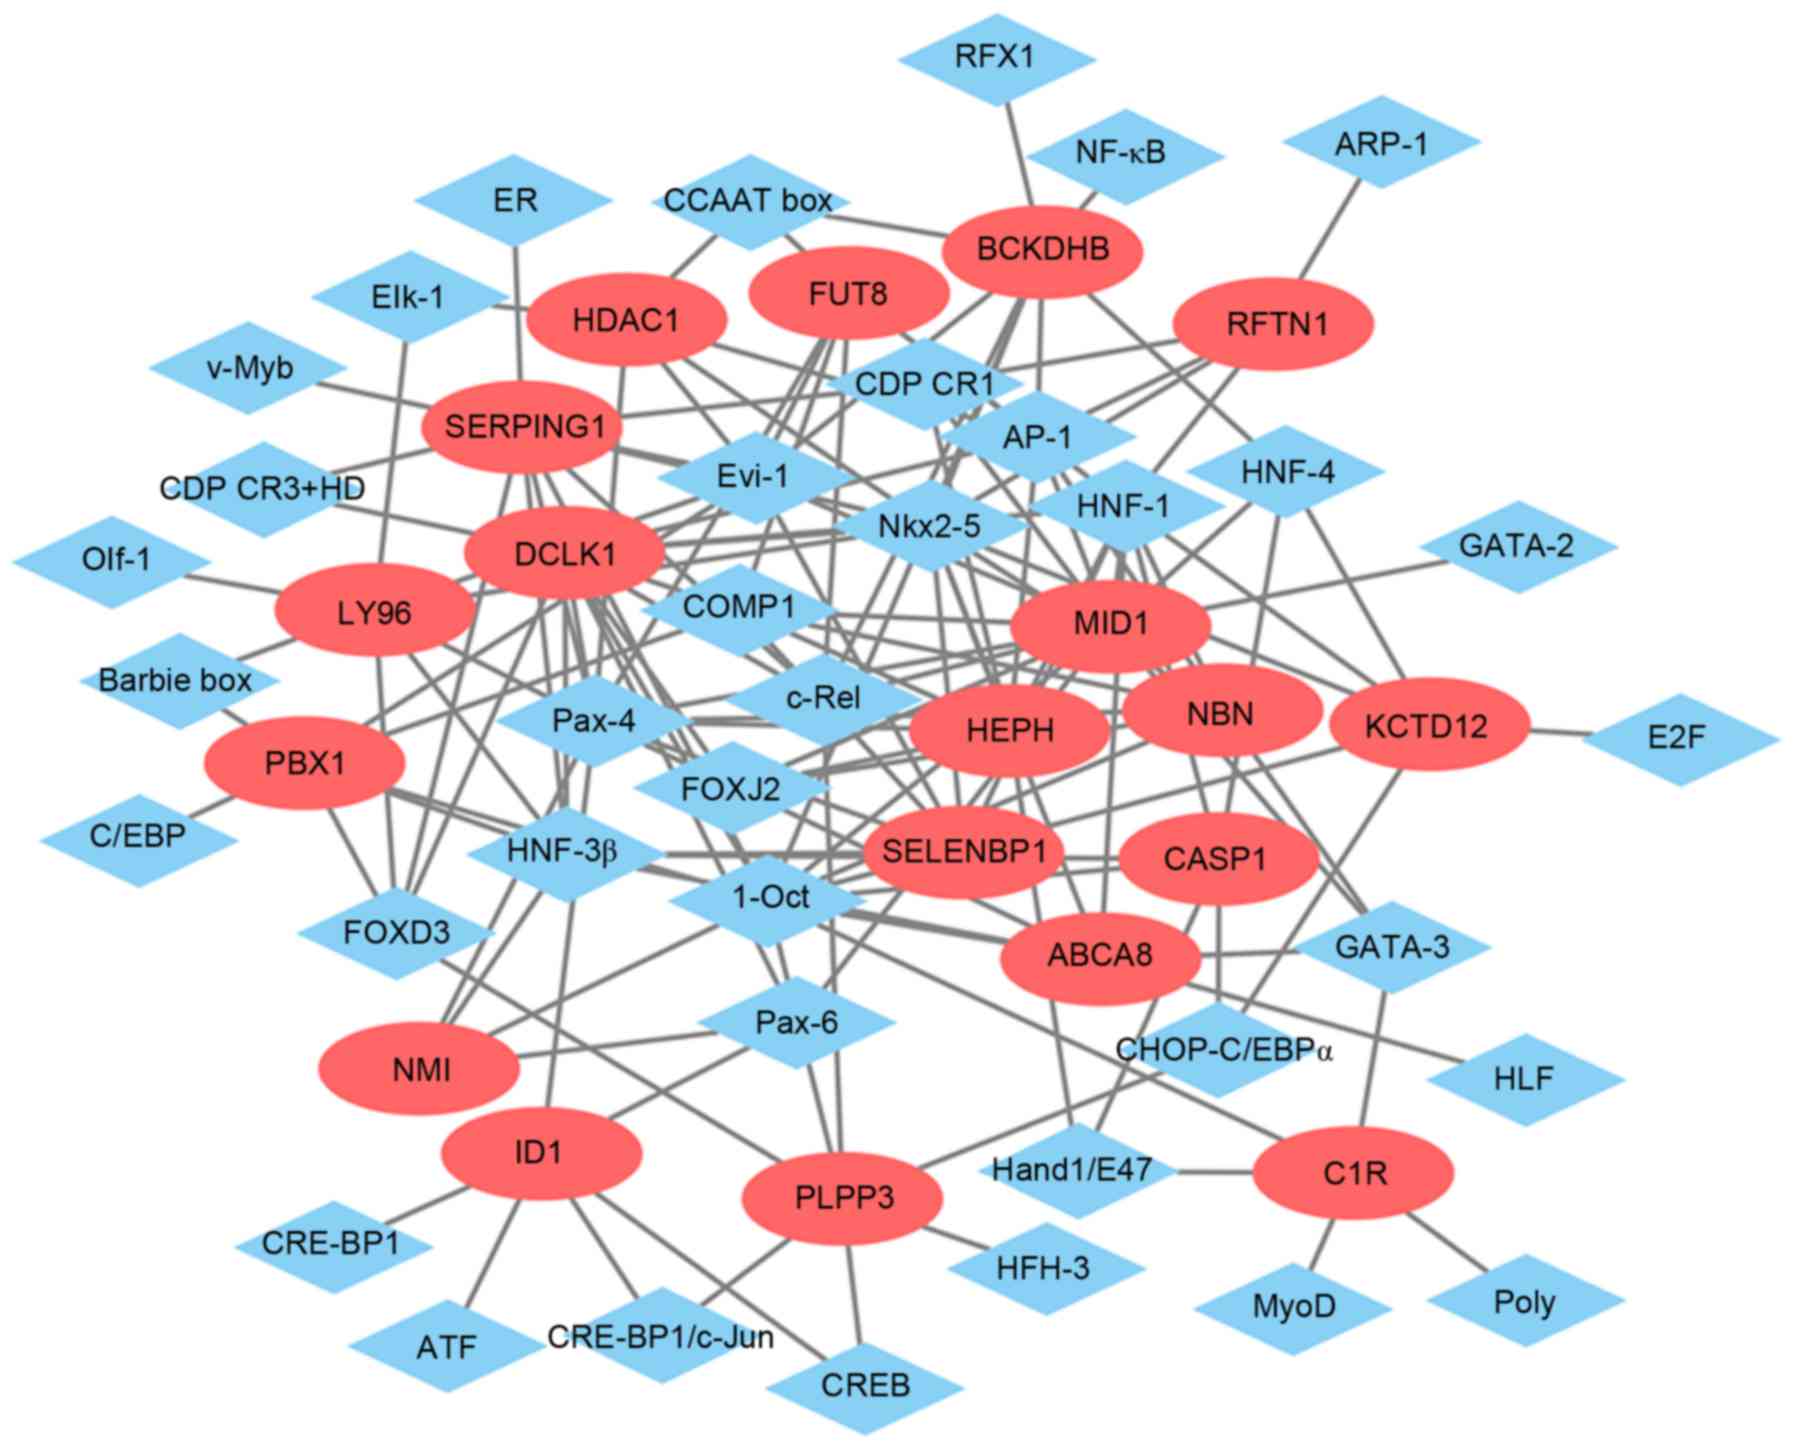
Glaucoma-specific PPI network
A PPI network (Fig.
4) of the top 20 upregulated DEGs in glaucoma was constructed,
which consisted of 813 nodes and 865 edges. The hub proteins were
HDAC1 (degree=456), HBN (degree=75) and MID1 (degree=61). The PPI
network (Fig. 5) of the
downregulated DEGs in glaucoma was constructed, which consisted of
372 nodes and 393 edges. The hub proteins were UBR4 (degree=56),
PDK1 (degree=45) and PHKG2 (degree=41).
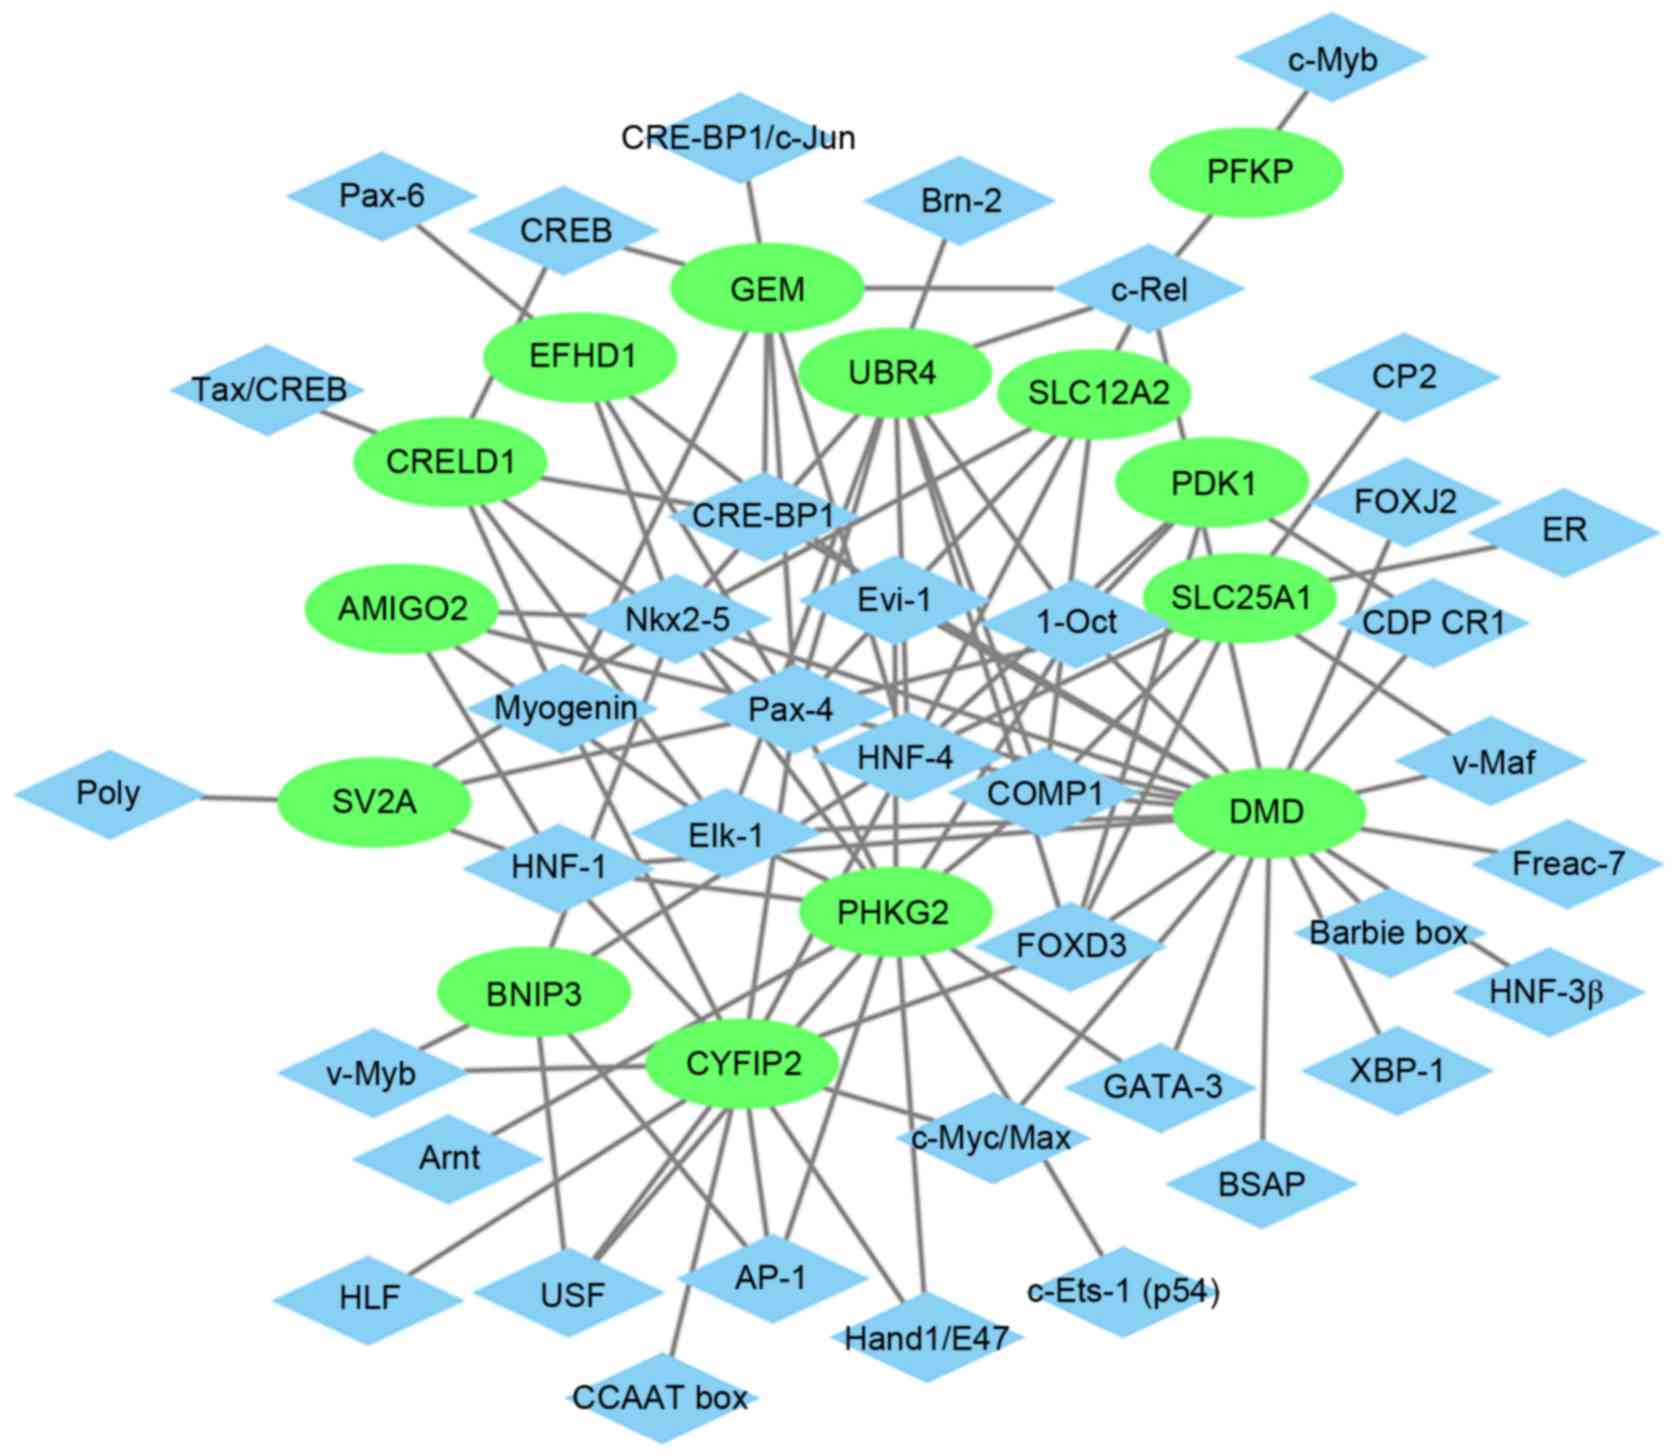
Glaucoma-specific transcriptional
regulatory network
The glaucoma-specific transcriptional regulatory
network of top 20 upregulated DEGs (Fig. 6) was consisted of 57 nodes and 141
edges. The glaucoma-specific transcriptional regulatory network of
downregulated DEGs (Fig. 7)
consisted of 53 nodes and 103 edges. The top 10 TFs covering the
majority of downstream DEGs in glaucoma were presented in Table V.
| Table V.Top 10 TFs covering the majority of
downstream DEGs in glaucoma. |
Table V.
Top 10 TFs covering the majority of
downstream DEGs in glaucoma.
| TF | Count | DEGs |
|---|
| Pax-4 | 50 | SERPING1, SV2A,
EFHD1, NMI, DCLK1, CRELD1, CRELD1, AMIGO2, NBN, SERPING1, NBN, NBN,
SLC12A2, NBN, FUT8, SELENBP1, SERPING1, SLC25A1, EFHD1, FUT8, LY96,
EFHD1, HEPH, ID1, SERPING1, CYFIP2, UBR4, ABCA8, HDAC1, GEM, ID1,
SELENBP1, PHKG2, SERPING1, EFHD1, CRELD1, CRELD1, ID1, LY96,
SERPING1, ID1, LY96, HDAC1, EFHD1, SELENBP1, LY96, DMD, MID1,
HDAC1 |
| 1-Oct | 44 | DMD, DMD, MID1,
DMD, NBN, DMD, MID1, PDK1, BCKDHB, BCKDHB, NBN, DMD, BCKDHB, DMD,
MID1, DMD, KCTD12, PLPP3, NMI, C1R, DMD, PBX1, SERPING1, DMD, UBR4,
SERPING1, MID1, DCLK1, KCTD12, ABCA8, PDK1, SERPING1, DCLK1, PBX1,
KCTD12, DMD, PHKG2, PBX1, NBN, BCKDHB, MID1, CASP1, NBN, DMD |
| Nkx2-5 | 38 | HEPH, NBN, SV2A,
NBN, NBN, SERPING1, NBN, SERPING1, ABCA8, EFHD1, DMD, HEPH,
SELENBP1, LY96, DCLK1, SELENBP1, PHKG2, SV2A, HDAC1, SLC12A2,
BCKDHB, EFHD1, DMD, BNIP3, EFHD1, SERPING1, AMIGO2, RFTN1,
SERPING1, ABCA8, ABCA8, SELENBP1, UBR4, EFHD1, LY96, KCTD12, ABCA8,
KCTD12 |
| COMP1 | 26 | SLC12A2, MID1,
MID1, SLC25A1, MID1, UBR4, DMD, PBX1, HEPH, FUT8, DMD, MID1, NBN,
DMD, NBN, MID1, NBN, DCLK1, NBN, PHKG2, DMD, MID1, PBX1, SELENBP1,
SLC25A1, DCLK1 |
| FOXD3 | 23 | DMD, DMD, SLC25A1,
PBX1, PLPP3, SERPING1, PLPP3, DMD, DCLK1, DCLK1, SERPING1, PLPP3,
DMD, PDK1, DMD, DMD, SERPING1, LY96, SLC25A1, CYFIP2, UBR4, DMD,
PDK1 |
| HNF-1 | 23 | ABCA8, DMD, DMD,
DMD, RFTN1, PHKG2, HEPH, DMD, SV2A, DMD, CYFIP2, DMD, AMIGO2, MID1,
SELENBP1, FUT8, CASP1, NBN, NBN, KCTD12, DCLK1, DCLK1, DMD |
| HNF-4 | 20 | MID1, GEM, PDK1,
BNIP3, BCKDHB, CYFIP2, SLC25A1, UBR4, MID1, SLC25A1, BNIP3, DMD,
MID1, SLC25A1, KCTD12, CYFIP2, SLC12A2, PDK1, SLC25A1, CASP1 |
| Evi-1 | 18 | HDAC1, DMD, MID1,
BCKDHB, FUT8, EFHD1, LY96, DMD, DMD, BCKDHB, DMD, MID1, PBX1, PBX1,
SERPING1, SELENBP1, PHKG2, FUT8 |
| AP-1 | 15 | NBN, HEPH, HEPH,
PHKG2, MID1, HDAC1, RFTN1, PHKG2, BCKDHB, DCLK1, CYFIP2, DCLK1,
FUT8, PHKG2, BNIP3 |
| HNF-3β | 12 | PBX1, SERPING1,
LY96, NMI, SELENBP1, DMD, SERPING1, DCLK1, ABCA8, DMD, CASP1,
DMD |
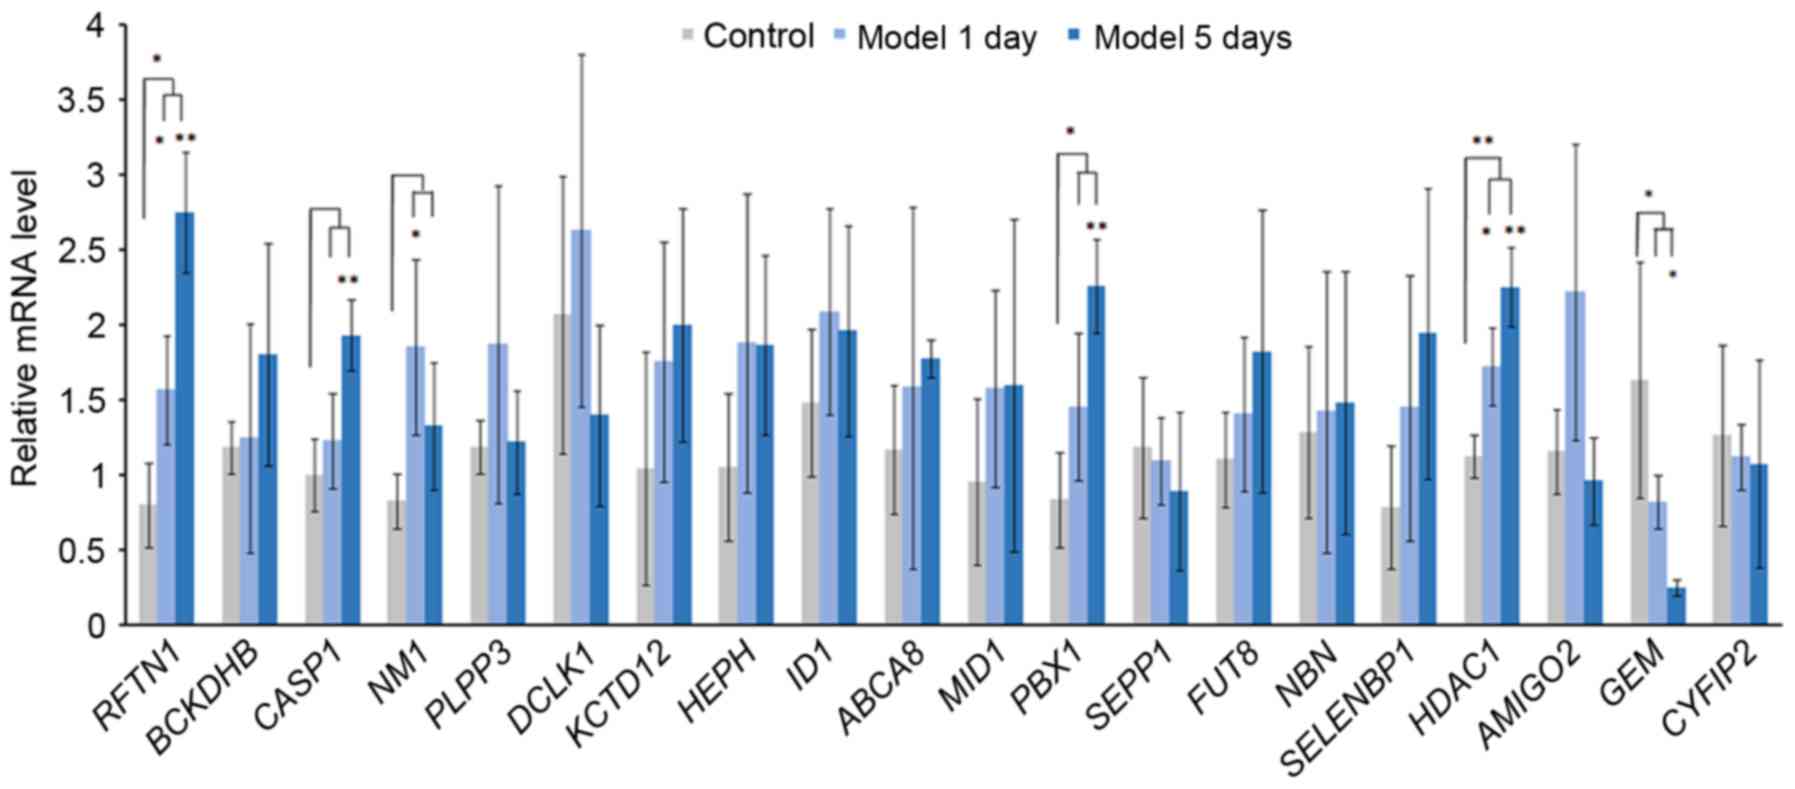
Acute elevation of IOP and RT-qPCR
validation of DEGs
IOP was significantly increased in model 1 day group
and model 5 day group after the acute IOP elevation rats model
establishment. In order to verify the expression of integrated
analysis, the top 20 DEGs in glaucoma were investigated. Based on
the RT-qPCR (Fig. 8), the
expression of 3 DEGs [raftlin, lipid raft linkerm 1 (RFTN1), PBX
homeobox 1 (PBX1), HDAC1] were significantly upregulated and the
expression of GEM was significantly downregulated in the acute IOP
elevation rat model on the first and fifth day. These four DEGs
presented the same pattern in the integrated analysis in the
present study.
Discussion
In order to reveal the cellular and molecular events
associated the pathogenesis of glaucoma, the present study
identified several genes and TFs that were involved with glaucoma
based on the DEGs in glaucoma compared with the NC group by using
an integrated microarray analysis.
The acute IOP elevation rat model was established to
validate the expression of DEGs in glaucoma using RT-qPCR. The
acute IOP elevation model has been previously used to simulate
acute angle-closure glaucoma (21,22);
however, the association between acute IOP elevation and chronic
glaucoma remains to be fully elucidated. Acute ischemic insult and
non-ischemic injuries may be induced by the acute IOP elevation
model and lead to significant loss of RGCs after 3 days of acute
IOP elevation (23). Alterations
in the morphology of astrocytes and influence on axons and cellular
responses within the ONH may also be induced by acute IOP elevation
(24,25). Additionally, Morrison et al
previously reported that gene expression profiles within the ONH
induced by acute IOP elevation were similar to those observed
following chronic IOP elevation (26,27).
Due to the similarity between the acute IOP elevation model and
glaucoma, the gene expression profiles in acute IOP model may
identify the key genes in glaucoma.
A previous study has indicated that the ONH is
repeatedly exposed to cycles of relatively minor injuries in the
early stage of glaucoma (28) and
these minor injuries may be reversed by treatment with healthy RGCs
(28). However, repeated insults
or an intrinsic impairment may overwhelm the capacity of RGCs to
recover, and the cell death program may be induced (29). Although 1 day of acute IOP
elevation is insufficient to induce evident damage on the ONH, the
present study determined that the process of RGC recovery is
activated after 1 day of acute IOP elevation which may be
associated with early-stage glaucoma. Therefore, the expression of
selected DEGs after 1 day and 5 days was validated.
As the major risk factor of glaucoma, elevated IOP
may induce the optic nerve axonal compression at the lamina
cribrosa, block the axoplasmic flow, cause interference in
retrograde neurotrophin transport to RGCs, and drive apoptosis.
This may lead to disruption of the balance between aqueous humor
production and outflow from the anterior chamber (30). Elements regulating IOP and aqueous
humor may be involved with the pathogenesis of glaucoma.
As a transporter expressed by ciliary body
epithelia, RFTN1 was believed to contribute to the pathogenesis of
POAG by changing the composition of aqueous humor (31). In addition, previous studies have
reported that raftlin, RFTN1 rs690037 was associated with three
glaucoma-associated optic disc parameters including optic cup area,
vertical cup-to-disc ratio and central corneal thickness (32,33).
Combination of RFTN1 and other optic disc parameter-associated
genes, such as ATOH7 single nucleotide polymorphisms conferred risk
for POAG (32). In the integrated
analysis of the present study, RFTN1 was the top upregulated DEG in
glaucoma compared with NC and it was also upregulated in the acute
IOP elevation rat model, which provided evidence for the potential
role of RFTN1 in glaucoma. In order to determine the specific role
of RFTN1 in glaucoma, further research is required.
Hephaestin (HEPH) and selenium binding protein 1
(SELENBP1) were previously reported to be associated with elevated
intraocular pressure (34) and
upregulated HEPH has been previously detected in glaucoma (35). In the current study, HEPH and
SELENBP1 were also upregulated DEGs in glaucoma and the acute IOP
elevation rat model. Therefore, it is possible that HEPH and
SELENBP1 may be involved with glaucoma by regulating IOP.
However, lowering IOP is not always an effective
treatment for patients with glaucoma, which suggested that other
mechanisms of glaucoma require further research.
Glaucoma is the most common optic neuropathy and
RGCs apoptosis is a major hallmark of glaucoma (36). The present study identified several
DEGs in glaucoma which were associated with RGCs damage and
apoptosis.
Retinal injury, including light damage and
N-Methyl-D-aspartic acid (NMDA) treatment have been reported to
induce an increase in bone morphogenetic protein (BMP) expression
and BMP-Smad1/5/8 signaling in inner retinal cells, which suggested
that BMP-Smad1/5/8 signaling had a neuroprotective effect on RGCs
after damage (37). As a target of
BMP-Smad1/5/8, inhibitor of differentiation 1 (ID1) was upregulated
in response to retinal injury (37). According to the present study, ID1
was also upregulated in the acute IOP elevation rat model and
glaucoma which is a RGCs disease. The current study concluded that
ID1 was involved with RGC damage, which may be a potential target
for neuroprotective therapies in glaucoma and other RGC
diseases.
Nuclear atrophy is one of the early events of RGCs
death and previous studies have reported that Class I histone
deacetylases (HDACs) 1, 2 and 3 have key roles in nuclear atrophy
and apoptosis of RGCs (36). In
addition, inhibition of HDACs activity in the RGCs nucleus may
prevent RGCs death. Treatment of purified rat RGCs with inhibitors
including valproic acid (VPA) and sodium butyrate (SB), prevented
histone deacetylation and protected RGCs from death in vitro
(38). MS-275, an inhibitor of
HDAC1/HDAC3 was identified to have a protective effect on the loss
of RGCs and promoted RGC survival following optic nerve injury
(39). According to the PPI
network of the top 20 upregulated DEGs in glaucoma, HDAC1 is a hub
protein which was upregulated in the acute IOP elevation rat model
as well. The study concluded that inhibitors of HDACs, particularly
the HDAC1 inhibitor may have a protective role of RGCs in glaucoma
(39). Further investigation is
required to identify the specific roles of each individual HDAC in
injured RGCs and determine which HDAC may be the appropriate target
for therapeutic inhibition in optic neuropathies such as
glaucoma.
According to the GO and KEGG enrichment analysis,
various changes occurred in glaucoma compared with NC and the
majority of enriched pathways in glaucoma were metabolic-associated
pathways. Glycolysis/gluconeogenesis and valine, leucine and
isoleucine degradation were two significantly enriched pathways in
glaucoma which were consistent with previous studies (40–42)
and may have important roles in glaucoma. These
metabolic-associated pathways may involve with the process of
glaucoma and these abnormal metabolites may make a contribution in
early diagnosis and treatment of glaucoma.
The present study used the glaucoma-specific
transcriptional regulatory network, and identified three TFs which
may be involved with the process of glaucoma. Ocular malformation
is another risk factor of glaucoma, which may be induced by
dysplasia of the anterior eye (43). The structures of anterior eye are
closely associated with the migratory neural crest cells. The FOXD3
encodes a forkhead TF, which has a crucial role in neural crest
specification in vertebrates; therefore, FOXD3 may be involved in
multiple types of eye diseases, such as glaucoma (44). Previous studies have indicated that
FOXC1 has a role in various glaucoma phenotypes (45,46).
Additionally, another upregulated DEG in glaucoma and the acute IOP
elevation rat model, PBX1 may impair the activity of FOXC1 in a
filamin A-mediated manner. Considering the present findings and
previous studies, it is possible that PBX1 may be involved with the
process of glaucoma by interacting with FOXC1. HNF-4 and AP-1 were
two TFs identified from top 10 TFs covering the majority of
downstream DEGs which have a role in cellular regulation of the
reactive ONH astrocytes (11).
Therefore, the present study concluded that HNF-4 and AP-1 may be
closely associated with glaucoma.
Additionally, to the best of our knowledge this is
the first study to report the association between glaucoma and
other 6 DEGs, including NMI, KCTD12, ABCA8, MID1, FUTB, and GEM,
which were also confirmed by RT-qPCR in the acute IOP elevation rat
model; however, their potential roles in glaucoma require further
investigation.
In conclusion, HEPH, SELENBP1 and RFTN1 may be
involved with the pathogenesis of glaucoma by regulating IOP or
glaucoma-associated optic disc parameters. ID1 and HADC1 may be
associated with glaucoma by the influence on RGCs. Interaction
between PBX1 and FOXC1 may have a role in glaucoma. Three TFs,
including FOXD3, HNF-4 and AP-1 may also act as regulators of
glaucoma. The findings of the present study may contribute to
developing novel and more effective approaches of diagnosis and
drug design for glaucoma. Future investigations of
glaucoma-associated genes, require the chronic IOP elevation model
and the specific role of these glaucoma-associated DEGs and TFs in
glaucoma necessary in further research.
Acknowledgements
The present study was funded by Talent introduction
subsidy program of Harbin (grant no. 2014SYYRCYJ06-2).
Glossary
Abbreviations
Abbreviations:
|
BMP
|
bone morphogenetic protein
|
|
DEGs
|
differentially expressed genes
|
|
FOXC1
|
forkhead box C1
|
|
GEO
|
Gene Expression Omnibus
|
|
HEPH
|
hephaestin
|
|
IOP
|
intraocular pressure
|
|
NC
|
normal control
|
|
NMDA
|
N-Methyl-D-aspartic acid
|
|
ONH
|
optic nerve head
|
|
PBX1
|
PBX homeobox 1
|
|
POAG
|
primary open angle glaucoma
|
|
PPI
|
protein-protein interaction
|
|
PWM
|
Position Weight Matrix
|
|
RFTN1
|
raftlin, lipid raft linker 1
|
|
RGCs
|
retinal ganglion cells
|
|
SB
|
sodium butyrate
|
|
SELENBP1
|
selenium binding protein 1
|
|
VPA
|
valproic acid
|
References
|
1
|
Yu-Wai-Man P, Stewart JD, Hudson G,
Andrews RM, Griffiths PG, Birch MK and Chinnery PF: OPA1 increases
the risk of normal but not high tension glaucoma. J Med Genet.
47:120–125. 2010. View Article : Google Scholar : PubMed/NCBI
|
|
2
|
Moreno MC, Sande P, Marcos HA, de Zavalía
N, Sarmiento MI Keller and Rosenstein RE: Effect of glaucoma on the
retinal glutamate/glutamine cycle activity. FASEB J. 19:1161–1162.
2005.PubMed/NCBI
|
|
3
|
Liu T, Xie L, Ye J and He X: Family-based
analysis identified CD2 as a susceptibility gene for primary open
angle glaucoma in Chinese Han population. J Cell Mol Med.
18:600–609. 2014. View Article : Google Scholar : PubMed/NCBI
|
|
4
|
Guo MS, Wu YY and Liang ZB: Hyaluronic
acid increases MMP-2 and MMP-9 expressions in cultured trabecular
meshwork cells from patients with primary open-angle glaucoma. Mol
Vis. 18:1175–1181. 2012.PubMed/NCBI
|
|
5
|
Gazzard G, Foster PJ, Devereux JG, Oen F,
Chew P, Khaw PT and Seah S: Intraocular pressure and visual field
loss in primary angle closure and primary open angle glaucomas. Br
J Ophthalmol. 87:720–725. 2003. View Article : Google Scholar : PubMed/NCBI
|
|
6
|
Rosenberg LF: Glaucoma: Early detection
and therapy for prevention of vision loss. Am Fam Physician.
52:2289–2298. 1995.PubMed/NCBI
|
|
7
|
Bikbova G, Oshitari T and Yamamoto S:
Diabetes mellitus and retinal vein occlusion as risk factors for
open angle glaucoma and neuroprotective therapies for retinal
ganglion cell neuropathy. J Clin Exper Ophthalmol. S3:2012.
|
|
8
|
McMenemy MG: Primary Open Angle Glaucoma.
Springer; New York, NY: pp. 1721. 2014
|
|
9
|
Girard MJA, Zimmo L, White ET, Mari JM,
Ethier CR and Strouthidis NG: Towards a biomechanically-based
diagnosis for glaucoma: In vivo deformation mapping of the human
optic nerve head. In: ASME 2012 Summer Bioengineering Conference.
Puerto Rico. pp. 423–424. 2012;
|
|
10
|
Wu Y, Zang WD and Jiang W: Functional
analysis of differentially expressed genes associated with glaucoma
from DNA microarray data. Genet Mol Res. 13:9421–9428. 2014.
View Article : Google Scholar : PubMed/NCBI
|
|
11
|
Lukas TJ, Miao H, Chen L, Riordan SM, Li
W, Crabb AM, Wise A, Du P, Lin SM and Hernandez MR: Susceptibility
to glaucoma: Differential comparison of the astrocyte transcriptome
from glaucomatous African American and Caucasian American donors.
Genome Biol. 9:R1112008. View Article : Google Scholar : PubMed/NCBI
|
|
12
|
Hernandez MR, Agapova OA, Yang P,
Salvador-Silva M, Ricard CS and Aoi S: Differential gene expression
in astrocytes from human normal and glaucomatous optic nerve head
analyzed by cDNA microarray. Glia. 38:45–64. 2002. View Article : Google Scholar : PubMed/NCBI
|
|
13
|
Yan X, Yuan F, Chen X and Dong C:
Bioinformatics analysis to identify the differentially expressed
genes of glaucoma. Mol Med Rep. 12:4829–4836. 2015. View Article : Google Scholar : PubMed/NCBI
|
|
14
|
Rozsa FW, Scott KM, Pawar H, Samples JR,
Wirtz MK and Richards JE: Differential expression profile
prioritization of positional candidate glaucoma genes: The GLC1C
locus. Arch Ophthalmol. 125:117–127. 2007. View Article : Google Scholar : PubMed/NCBI
|
|
15
|
Fei Q, Lin J, Meng H, Wang B, Yang Y, Wang
Q, Su N, Li J and Li D: Identification of upstream regulators for
synovial expression signature genes in osteoarthritis. Joint Bone
Spine. 83:545–551. 2016. View Article : Google Scholar : PubMed/NCBI
|
|
16
|
Marot G, Foulley JL, Mayer CD and
Jaffrézic F: Moderated effect size and P-value combinations for
microarray meta-analyses. Bioinformatics. 25:2692–2696. 2009.
View Article : Google Scholar : PubMed/NCBI
|
|
17
|
Wei K, Pan S and Li Y: Functional
characterization of maize C2H2, zinc-finger
gene family. Plant Mol Biol Rep. 34:761–776. 2016. View Article : Google Scholar
|
|
18
|
Matys V, Fricke E, Geffers R, Gössling E,
Haubrock M, Hehl R, Hornischer K, Karas D, Kel AE, Kel-Margoulis
OV, et al: TRANSFAC: Transcriptional regulation, from patterns to
profiles. Nucleic Acids Res. 31:374–378. 2003. View Article : Google Scholar : PubMed/NCBI
|
|
19
|
Adachi M, Takahashi K, Nishikawa M, Miki H
and Uyama M: High intraocular pressure-induced ischemia and
reperfusion injury in the optic nerve and retina in rats. Graefes
Arch Clin Exp Ophthalmol. 234:445–451. 1996. View Article : Google Scholar : PubMed/NCBI
|
|
20
|
Livak KJ and Schmittgen TD: Analysis of
relative gene expression data using real-time quantitative PCR and
the 2(-Delta Delta C(T)) method. Methods. 25:402–408. 2001.
View Article : Google Scholar : PubMed/NCBI
|
|
21
|
Adachi M, Takahashi K, Nishikawa M, Miki H
and Uyama M: High intraocular pressure-induced ischemia and
reperfusion injury in the optic nerve and retina in rats. Graefes
Arch Clin Exp Ophthalmol. 234:445–451. 1996. View Article : Google Scholar : PubMed/NCBI
|
|
22
|
Huang Y, Li Z, Wang N, van Rooijen N and
Cui Q: Roles of PI3K and JAK pathways in viability of retinal
ganglion cells after acute elevation of intraocular pressure in
rats with different autoimmune backgrounds. BMC Neurosci. 9:782008.
View Article : Google Scholar : PubMed/NCBI
|
|
23
|
Zhang S, Wang H, Lu Q, Qing G, Wang N,
Wang Y, Li S, Yang D and Yan F: Detection of early neuron
degeneration and accompanying glial responses in the visual pathway
in a rat model of acute intraocular hypertension. Brain Res.
1303:131–143. 2009. View Article : Google Scholar : PubMed/NCBI
|
|
24
|
Sun D, Qu J and Jakobs TC: Reversible
reactivity by optic nerve astrocytes. Glia. 61:1218–1235. 2013.
View Article : Google Scholar : PubMed/NCBI
|
|
25
|
Lye-Barthel M, Sun D and Jakobs TC:
Morphology of astrocytes in a glaucomatous optic nerve. Invest
Ophthalmol Vis Sci. 54:909–917. 2013. View Article : Google Scholar : PubMed/NCBI
|
|
26
|
Morrison JC, Cepurna WO, Doser TA, Dyck JA
and Johnson EC: A short interval of controlled elevation of iop
(CEI) reproduces early chronic glaucoma model optic nerve head
(ONH) gene expression responses. Invest Ophthalmol Vis Sci.
51:52162010.
|
|
27
|
Morrison JC, Cepurna WO, Tehrani S, Choe
TE, Jayaram H, Lozano DC, Fortune B and Johnson EC: A period of
controlled elevation of IOP (CEI) produces the specific gene
expression responses and focal injury pattern of experimental rat
glaucoma. Invest Ophthalmol Vis Sci. 57:6700–6711. 2016. View Article : Google Scholar : PubMed/NCBI
|
|
28
|
Downs JC, Burgoyne CF, Seigfreid WP,
Reynaud JF, Strouthidis NG and Sallee V: 24-hour IOP telemetry in
the nonhuman primate: Implant system performance and initial
characterization of IOP at multiple timescales. Invest Ophthalmol
Vis Sci. 52:7365–7375. 2011. View Article : Google Scholar : PubMed/NCBI
|
|
29
|
Crowston JG, Kong YX, Trounce IA, Dang TM,
Fahy ET, Bui BV, Morrison JC and Chrysostomou V: An acute
intraocular pressure challenge to assess retinal ganglion cell
injury and recovery in the mouse. Exp Eye Res. 141:3–8. 2015.
View Article : Google Scholar : PubMed/NCBI
|
|
30
|
Briggs EL Ashworth, Toh T, Eri R, Hewitt
AW and Cook AL: TIMP1, TIMP2 and TIMP4 are increased in aqueous
humor from primary open angle glaucoma patients. Mol Vis.
21:1162–1172. 2015.PubMed/NCBI
|
|
31
|
Janssen SF, Gorgels TG, Van der Spek PJ,
Jansonius NM and Bergen AA: In silico analysis of the molecular
machinery underlying aqueous humor production: Potential
implications for glaucoma. J Clin Bioinforma. 3:212013. View Article : Google Scholar : PubMed/NCBI
|
|
32
|
Chen JH, Wang D, Huang C, Zheng Y, Chen H,
Pang CP and Zhang M: Interactive effects of ATOH7 and RFTN1 in
association with adult-onset primary open-angle glaucoma. Invest
Ophthalmol Vis Sci. 53:779–785. 2012. View Article : Google Scholar : PubMed/NCBI
|
|
33
|
Macgregor S, Hewitt AW, Hysi PG, Ruddle
JB, Medland SE, Henders AK, Gordon SD, Andrew T, McEvoy B,
Sanfilippo PG, et al: Genome-wide association identifies ATOH7 as a
major gene determining human optic disc size. Hum Mol Genet.
19:2716–2724. 2010. View Article : Google Scholar : PubMed/NCBI
|
|
34
|
Xue W, Du P, Lin S, Dudley VJ, Hernandez
MR and Sarthy VP: Gene expression changes in retinal Müller (glial)
cells exposed to elevated pressure. Curr Eye Res. 36:754–767. 2011.
View Article : Google Scholar : PubMed/NCBI
|
|
35
|
Futterweit W, Ritch R, Teekhasaenee C and
Nelson ES: Coexistence of Prader-Willi syndrome, congenital
ectropion uveae with glaucoma, and factor XI deficiency. JAMA.
255:3280–3282. 1986. View Article : Google Scholar : PubMed/NCBI
|
|
36
|
Schmitt HM, Schlamp CL and Nickells RW:
Role of HDACs in optic nerve damage-induced nuclear atrophy of
retinal ganglion cells. Neurosci Lett. 625:11–15. 2016. View Article : Google Scholar : PubMed/NCBI
|
|
37
|
Ueki Y and Reh TA: Activation of
BMP-Smad1/5/8 signaling promotes survival of retinal ganglion cells
after damage in vivo. PLoS One. 7:e386902012. View Article : Google Scholar : PubMed/NCBI
|
|
38
|
Biermann J, Boyle J, Pielen A and Lagrèze
WA: Histone deacetylase inhibitors sodium butyrate and valproic
acid delay spontaneous cell death in purified rat retinal ganglion
cells. Mol Vis. 17:395–403. 2011.PubMed/NCBI
|
|
39
|
Chindasub P, Lindsey JD, Duong-Polk K,
Leung CK and Weinreb RN: Inhibition of histone deacetylases 1 and 3
protects injured retinal ganglion cells. Invest Ophthalmol Vis Sci.
54:96–102. 2013. View Article : Google Scholar : PubMed/NCBI
|
|
40
|
Messina-Baas OM, González-Huerta LM,
Chima-Galán C, Kofman-Alfaro SH, Rivera-Vega MR, Babayán-Mena I and
Cuevas-Covarrubias SA: Molecular analysis of the CYP1B1 gene:
Identification of novel truncating mutations in patients with
primary congenital glaucoma. Ophthalmic Res. 39:17–23. 2007.
View Article : Google Scholar : PubMed/NCBI
|
|
41
|
Mansergh FC, Kenna PF, Ayuso C, Kiang AS,
Humphries P and Farrar GJ: Novel mutations in the TIGR gene in
early and late onset open angle glaucoma. Hum Mutat. 11:244–251.
1998. View Article : Google Scholar : PubMed/NCBI
|
|
42
|
Nakamura M: New insights into the
pathogenesis of glaucomatous optic neuropathy and refinement of the
objective assessment of its functional damage. Nippon Ganka Gakkai
Zasshi. 116:298–344. 2012.PubMed/NCBI
|
|
43
|
Sowden JC: Molecular and developmental
mechanisms of anterior segment dysgenesis. Eye. 21:1310–1318. 2007.
View Article : Google Scholar : PubMed/NCBI
|
|
44
|
Kloss BA, Reis LM, Brémond-Gignac D,
Glaser T and Semina EV: Analysis of FOXD3 sequence variation in
human ocular disease. Mol Vis. 18:1740–1749. 2012.PubMed/NCBI
|
|
45
|
Lehmann OJ, Ebenezer ND, Jordan T, Fox M,
Ocaka L, Payne A, Leroy BP, Clark BJ, Hitchings RA, Povey S, et al:
Chromosomal duplication involving the forkhead transcription factor
gene FOXC1 causes iris hypoplasia and glaucoma. Am J Hum Genet.
67:1129–1135. 2000. View Article : Google Scholar : PubMed/NCBI
|
|
46
|
Chakrabarti S, Kaur K, Rao KN, Mandal AK,
Kaur I, Parikh RS and Thomas R: The transcription factor gene FOXC1
exhibits a limited role in primary congenital glaucoma. Invest
Ophthalmol Vis Sci. 50:75–83. 2009. View Article : Google Scholar : PubMed/NCBI
|