Introduction
Gastric cancer (GC) is a high-incidence disease
worldwide, particularly in Eastern Asia, although there has been a
recent downward trend in morbidity (1); GC is the third major cause of
cancer-related mortality in the world (2). Patients with early GC (EGC) may be
cured completely though effective treatment. At present, although
surgery, chemotherapy and radiotherapy are used in treatments, the
prognosis of patients with GC is still very poor owing to
metastasis (3–6). Therefore, early diagnosis serves an
important role in reducing GC-related mortality. However, as there
are no effective diagnostic signs or sensitive biomarkers for early
diagnosis, most GC patients develop terminal cancer (7). Therefore, identifying specific
biomarkers and effective molecular targets for GC are extremely
important.
Long noncoding RNAs (lncRNAs) are a type of
noncoding RNA that are >200 nucleotides, which regulate gene
expression through transcription regulation, post-transcription
regulation, chromatin modification and genomic imprinting (8,9). An
increasing number of studies have indicated that lncRNAs
participated in various biological processes, such as cell cycle
and cell differentiation (10),
apoptosis (11,12), epithelial-mesenchymal transition
(EMT), cell migration and metastasis (13). Several previous studies have
reported that lncRNAs may be closely associated with tumor genesis,
including liver cancer (14), lung
cancer (15), ovarian cancer
(16), colorectal cancer (17) and breast cancer (18–20).
Therefore, lncRNAs may be potential diagnostic biomarkers for
certain diseases. A previous report using a human lncRNA microarray
identified 33 differentially expressed lncRNAs associated with EGC,
including 13 that were upregulated and 20 downregulated (21). The present study further validated
that X inactive-specific transcript (XIST), brain cytoplasmic RNA 1
(BCYRN1), ribosomal RNA processing 1B (RRP1B) and testes
development related 1 (TDRG1) were aberrantly expressed both in EGC
tissues and plasma.
The present study examined the expression levels of
XIST, Yiya, BCYRN1, RRP1B, KCNQ1 opposite transcript 1 (KCNQ1OT1)
and TDRG1 in EGC tissues and normal adjacent tissues (NATs) by
reverse transcription-quantitative polymerase chain reaction
(RT-qPCR). XIST, BCYRN1, RRP1B and TDRG1 were identified as
differentially expressed in EGC tissues compared with NATs, and
exhibited potential diagnostic values for the detection of EGC. The
expression level of RRP1B was significantly correlated with distal
metastasis and tumor-node-metastasis (TNM) staging, and the
expression of TDRG1 was significantly correlated with lymph node
metastasis. Furthermore, significant positive correlations for
XIST, BCYRN1, RRP1B and TDRG1 expression levels were made between
the EGC tissues and plasma. Therefore, XIST, BCYRN1, RRP1B and
TDRG1 may serve as potential diagnostic biomarkers for EGC.
Materials and methods
Clinical specimens
The present study was approved by the Ethics
committee of Zhongda Hospital, School of Medicine, Southeast
University (Nanjing, China), and informed consent was received from
each patient. A total of 76 pairs of EGC tissues and paired NATs
were collected from Zhongda Hospital between May 2014 and November
2016. Among them, 10 pairs of EGC tissues and paired NATs were used
to preliminarily detect the XIST, Yiya, BCYRN1, RRP1B, KCNQ1OT1 and
TDRG1 expression levels. The 10 patients included 5 males and 5
female patients, and the average age was 63.4 and 64.2 years old.
None of the patients in the study received radiotherapy or
chemotherapy prior to surgical resection. All collected tissue
samples were frozen at −80°C for total RNA extraction. Peripheral
blood (5 ml) was collected from the 76 fasting patients prior to
endoscopy, and controls (76 healthy patients, including 32 males
and 44 female patients, and the average age was 65.4 and 61.2 years
old) were done at the same time; serum was separated by
centrifugation (3,500 × g; 10 min; 10°C) and the serum supernatant
was frozen at −80°C until further analysis.
RT-qPCR
Total RNA was extracted from EGC tissues (100 mg for
every organization) and paired NATs using the RNeasy Plus Mini kit
(Qiagen, Inc., Valencia, CA, USA) according to the manufacturer's
protocol. Total RNA was extracted from serum (800 µl) using the
QIAamp Circulating Nucleic Acid kit (QiagenKK, Tokyo, Japan). RNA
purity was measured using the NanoDrop (Peqlab Biotechnologie GmbH,
Erlangen, Germany). The OD260/280 ratio was used as
indicator for RNA purity. A ratio higher than 1.8 was regarded as
suitable for gene expression measurements. The RevertAid First
Strand cDNA Synthesis kit (Thermo Fisher Scientific, Inc., Waltham,
MA, USA) was used to synthesize cDNA according to the
manufacturer's protocol. XIST, Yiya, BCYRN1, RRP1B, KCNQ1OT1 and
TDRG1 expression were examined in EGC tissues (paired NATs were
used as control) and EGC plasma (healthy patient serum were used as
control) by RT-qPCR using the SYBRGreen Master Mix kit (Takara Bio,
Inc., Otsu Japan) and PRISM 7900HT sequence detection system
(Applied Biosystems; Thermo Fisher Scientific, Inc.) as described
previously (22). The quantitative
PCRs were carried out in 20-µl reaction volume containing 2 µl cDNA
products. Reaction steps were as follows: 95°C for 30 sec
(predegeneration) as the first step in a loop; 95°C for 5 sec
(degeneration), 60°C for 34 sec (extension) as the second step, a
total of 40 cycles. The data was analyzed using SDS 2.3 software
(Applied Biosystems; Thermo Fisher Scientific, Inc.). The
specificity of primer sequences was measured according to the
dissociation curve, and the relative gene expression levels were
analyzed using the 2−ΔΔCq (quantitation threshold)
method (23). All data are
presented as the mean ± standard deviation of three independent
experiments. The following qPCR primers were used: XIST, forward
5′-AACCACCTACACTTGAGCCA-3′, reverse 5′-AGGACAATGACGAAGCCACT-3′;
Yiya, forward 5′-TTGAGTCGGATCCTCTCAGC-3′, reverse
5′-CTCTCTGAGTTGCCCTTGGA-3′; BCYRN1, forward
5′-TCATGAAGCTTGCCTCTGGA-3′, reverse 5′-AACATGGAGAGGGAAGGTGG-3′;
RRP1B, forward 5′-CACAGCACAAACACGAGTCA-3′, reverse
5′-TGCCTTCTACTTGGTGAGGG-3′; KCNQ1OT1, forward
5′-TGGTAAGTTACAGGGCAGGG-3′, reverse 5′-TGAACATCCATCCCCAAGCT-3′;
TDRG1, forward 5′-GGTGCAGTCTTCAGGGATCT-3′, reverse
5′-GCCTCCCTCCTCTTCATTGT-3′; GAPDH, forward
5′-TGTTCGTCATGGGTGTGAAC-3′, reverse 5′-ATGGCATGGACTGTGGTCAT-3′.
Samples were normalized to GAPDH.
Statistical analysis
All data and calculations were analyzed using Prism6
(GraphPad Software Inc., La Jolla, CA, USA) and SPSS 17.0 (SPSS,
Inc., Chicago, IL, USA). The area under the receiver operating
characteristic (ROC) curve (AUC) was used to assess the predictive
power and to determine the cut-off scores for XIST, BCYRN1, RRP1B
and TDRG1 expression levels between patients with EGC and controls.
The differences in lncRNA expressions (XIST, BCYRN1, RRP1B and
TDRG1) in tissues among the patients were analyzed using the
χ2 test concerning clinical parameters such as age
(>60 vs. <60 years), sex (male vs. female), pathological node
(pN status; N0 vs. N1-N2), pathological metastasis (pM status; M0
vs. M1), and clinical stage (I and II vs. III and IV). For
paracarcinoma-carcinoma paired tissues, the difference in lncRNA
expression was evaluated using paired Student's t-test. The
relationship of lncRNA expression in EGC tissue and plasma was
analyzed using Mantel-Haenszel statistics. All results are
presented as the mean ± standard deviation (SD). P<0.05 was
considered to indicate a statistically significant difference.
Results
XIST, Yiya, BCYRN1, RRP1B, KCNQ1OT1
and TDRG1 expression levels in EGC tissues and NATs
A previous study analyzed lncRNA expression profiles
including XIST, Yiya, BCYRN1, RRP1B, KCNQ1OT1 and TDRG1 in GC
tissues and paired NATs by a human lncRNA microarray (21). This previous study identified 68
lncRNAs that were associated with diseases, of which the top 33
were demonstrated to be differentially expressed, including 13
upregulated and 20 downregulated lncRNAs. As hypoxia inducible
factor 1α-antisense RNA 1 (HIF1α-AS1), plasmacytoma variant
translocation 1 (PVT1), carbonyl reductase 3-antisense RNA 1
(CBR3-AS1) and urothelial cancer associated 1 (UCA1) have been
identified previously, the present study further examined the
expression levels of XIST, Yiya, BCYRN1, RRP1B, KCNQ1OT1 and TDRG1
by RT-qPCR in EGC tissues and NATs (21). Initially, we identified six
abnormally expressed lncRNAs in 10 tissues as a preliminary
screening. The results demonstrate that the expression levels of
XIST (Fig. 1A) and BCYRN1
(Fig. 1B) were significantly
increased in EGC tissues compared with NATs (n=10; **P<0.01);
Yiya (Fig. 1C) and KCNQ1OT1
(Fig. 1D) exhibited no significant
changes in expression levels in EGC tissues compared with NATs
(n=10); and the expression levels of RRP1B (Fig. 1E) and TDRG1 (Fig. 1F) were significantly decreased in
EGC tissues compared with NATs (n=10; *P<0.05 and **P<0.01,
respectively).
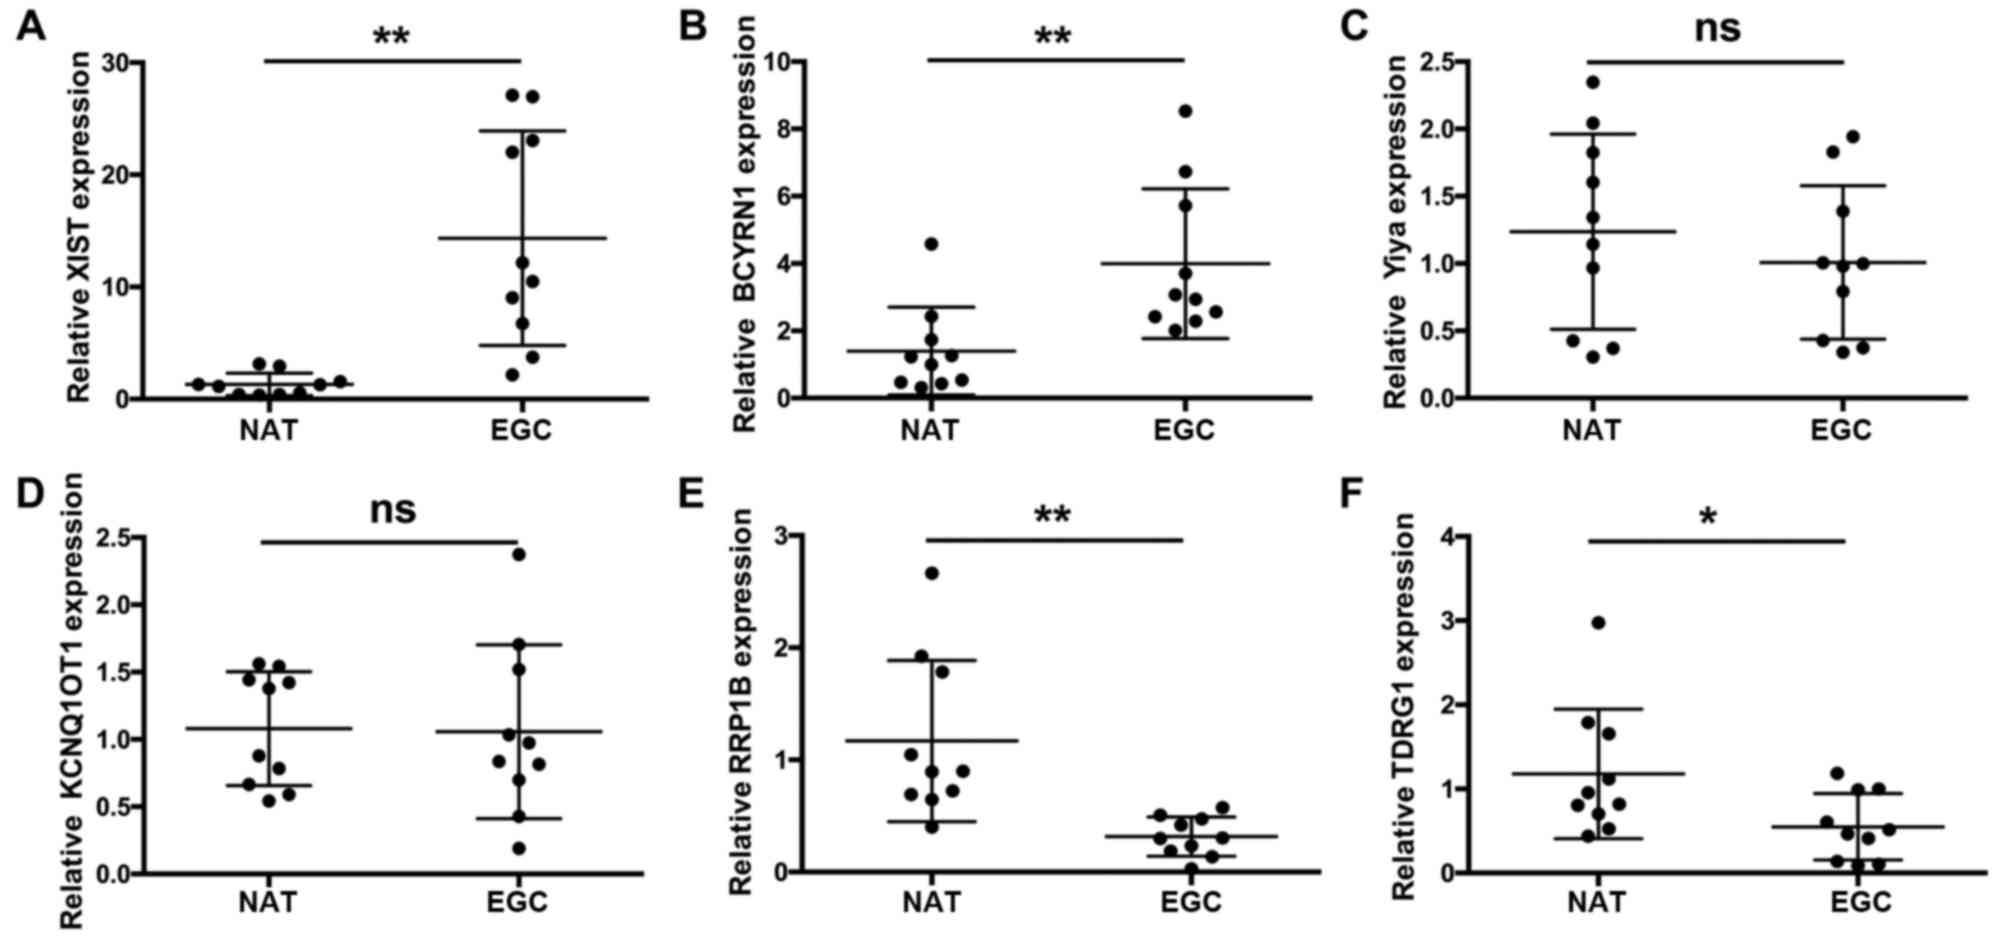 | Figure 1.XIST, Yiya, BCYRN1, RRP1B, KCNQ1OT1
and TDRG1 expression levels in EGC tissues and NATs. Reverse
transcription-quantitative polymerase chain reaction was used to
detect the expression levels of (A) XIST, (B) BCYRN1, (C) Yiya, (D)
KCNQ1OT1, (E) RRP1Band (F) TDRG1 in EGC tissues and paired NATs.
Relative expression levels were normalized to GAPDH using the
2−ΔΔCq method. n=10; *P<0.05; **P<0.01. BCYRN1,
brain cytoplasmic RNA 1; EGC, early gastric cancer; KCNQ1OT1, KCNQ1
opposite transcript 1; NAT, normal adjacent tissue; ns, no
statistically significant difference; RRP1B, ribosomal RNA
processing 1B; TDRG1, testes development related 1; XIST, X
inactive-specific transcript. |
XIST, BCYRN1, RRP1B and TDRG1
expression levels were validated in EGC tissues and NATs
In the preliminary study described above, XIST,
BCYRN1, RRP1B and TDRG1 were differentially expressed in EGC
tissues (n=10) compared with NATs (n=10), while Yiya and KCNQ1OT1
expressions exhibited no significant alterations in EGC tissues
compared with NATs. Therefore, we further collected the EGC tissues
and paired NATs from 76 patients. The expression levels of XIST,
BCYRN1, RRP1B and TDRG1 were measured by RT-qPCR. The results
demonstrated that the expression levels of XIST (Fig. 2A) and BCYRN1 (Fig. 2B) were significantly increased in
EGC tissues compared with NATs (n=76; ***P<0.001). In addition,
the expression levels of RRP1B (Fig.
2C) and TDRG1 (Fig. 2D) were
significantly decreased in EGC tissues compared with NATs (n=76;
***P<0.001). Therefore, XIST, BCYRN1, RRP1B and TDRG1may serve
as potential candidates as biomarkers for EGC.
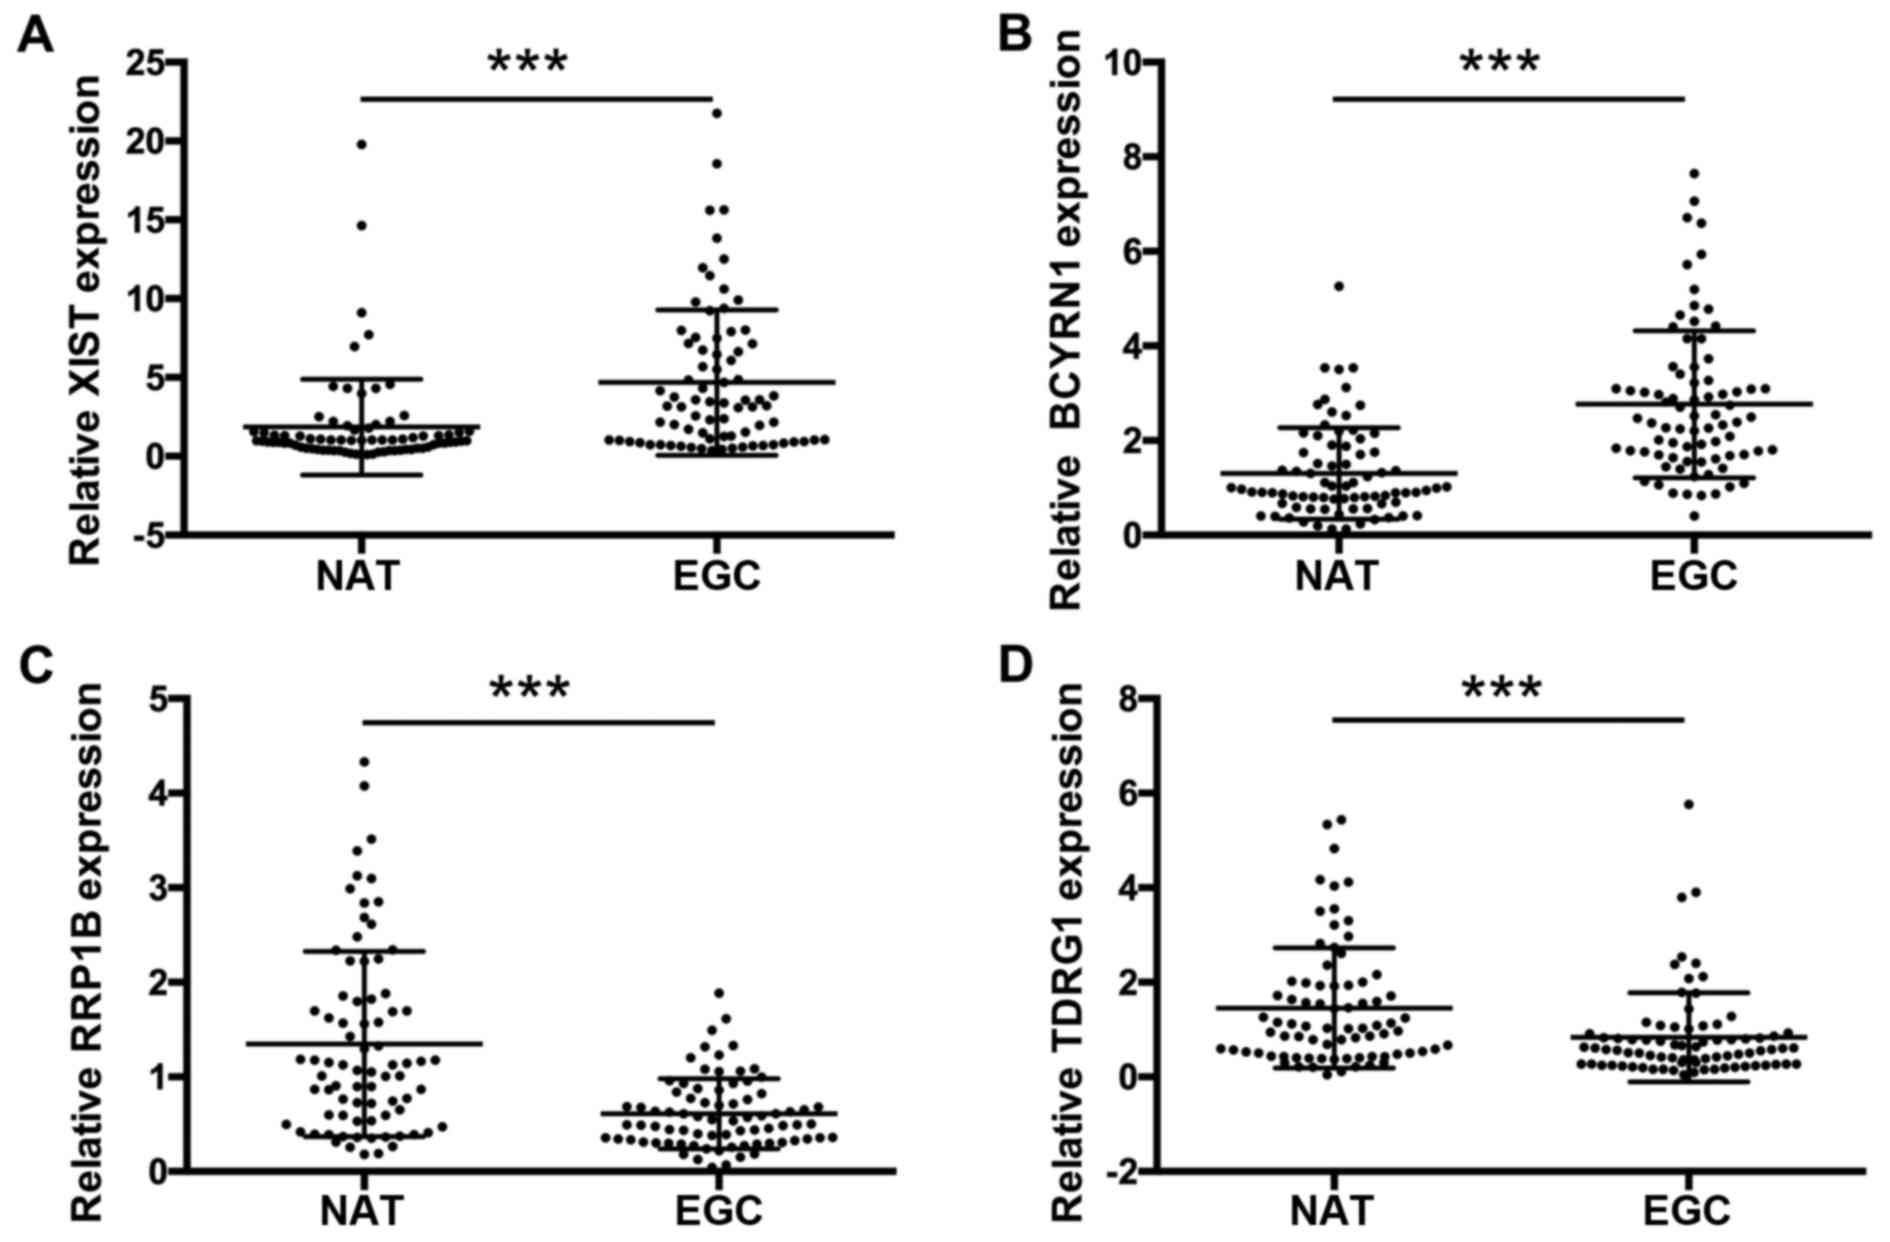 | Figure 2.XIST, BCYRN1, RRP1B and TDRG1
expression levels in EGC tissues and NATs. Reverse
transcription-quantitative polymerase chain reaction was used to
detect the expression levels of (A) XIST, (B) BCYRN1, (C) RRP1B and
(D) TDRG1 in EGC tissues compared with paired NATs from 78
patients. Relative expression levels were normalized to GAPDH using
the 2−ΔΔCq method. ***P<0.001. BCYRN1, brain
cytoplasmic RNA 1; EGC, early gastric cancer; NAT, normal adjacent
tissue; RRP1B, ribosomal RNA processing 1B; TDRG1, testes
development related 1; XIST, X inactive-specific transcript. |
In addition, no significant correlations were
identified between the expression levels of XIST or BCYRN1 and
clinicopathological characteristics (Tables I and II, respectively). Conversely, the
expression level of RRP1B was significantly correlated with
pathological metastasis (pM) and clinical stage (Table III), and the expression level of
TDRG1 was significantly correlated with pathological node (pN)
(Table IV).
 | Table I.Associations between XIST expression
level and clinicopathological characteristics in 76 patients. |
Table I.
Associations between XIST expression
level and clinicopathological characteristics in 76 patients.
|
|
| XIST |
|---|
|
|
|
|
|---|
| Clinicopathological
characteristic | n | High expression
(%) | Low expression
(%) | P-value |
|---|
| Age (year) |
|
|
|
|
|
>60 | 47 | 42 (51.1) | 23 (48.9) | 0.097 |
|
≤60 | 29 | 20 (69.0) | 9 (31.0) |
|
| Sex |
|
|
|
|
|
Male | 50 | 29 (58.0) | 21 (42.0) | 0.585 |
|
Female | 26 | 15 (57.7) | 11 (42.3) |
|
| pN status |
|
|
|
|
| N0 | 44 | 29 (65.9) | 15 (34.1) | 0.077 |
|
N1-N2 | 32 | 15 (46.9) | 17 (53.1) |
|
| pM status |
|
|
|
|
| M0 | 71 | 41 (57.7) | 30 (42.3) | 0.649 |
| M1 | 5 | 3
(60.0) | 2
(40.0) |
|
| Clinical stage |
|
|
|
|
| I and
II | 46 | 28 (60.9) | 18 (39.1) | 0.339 |
| III and
IV | 30 | 16 (53.3) | 14 (46.7) |
|
| Table II.Associations between BCYRN expression
level and clinicopathological characteristics in 76 patients. |
Table II.
Associations between BCYRN expression
level and clinicopathological characteristics in 76 patients.
|
|
| BCYRN1 |
|---|
|
|
|
|
|---|
| Clinicopathological
characteristic | n | High expression
(%) | Low expression
(%) | P-value |
|---|
| Age (year) |
|
|
|
|
|
>60 | 47 | 41 (87.2) | 6 (12.8) | 0.413 |
|
≤60 | 29 | 24 (82.8) | 5 (17.2) |
|
| Sex |
|
|
|
|
|
Male | 50 | 44 (88.0) | 6 (12.0) | 0.300 |
|
Female | 26 | 21 (80.8) | 5 (19.2) |
|
| pN status |
|
|
|
|
| N0 | 44 | 37 (84.1) | 7 (15.9) | 0.471 |
|
N1-N2 | 32 | 28 (87.5) | 4 (12.5) |
|
| pM status |
|
|
|
|
| M0 | 71 | 60 (84.5) | 11 (15.5) | 0.447 |
| M1 | 5 | 5 (100.0) | 0 (0.0) |
|
| Clinical stage |
|
|
|
|
| I and
II | 46 | 40 (87.0) | 6 (13.0) | 0.452 |
| III and
IV | 30 | 25 (83.3) | 5 (16.7) |
|
| Table III.Associations between RRP1B expression
level and clinicopathological characteristics in 76 patients. |
Table III.
Associations between RRP1B expression
level and clinicopathological characteristics in 76 patients.
|
|
| RRP1B |
|---|
|
|
|
|
|---|
| Clinicopathological
characteristic | n | High expression
(%) | Low expression
(%) | P-value |
|---|
| Age (year) |
|
|
|
|
|
>60 | 47 | 7 (14.9) | 40 (85.1) | 0.587 |
|
≤60 | 29 | 4 (13.8) | 25 (86.2) |
|
| Sex |
|
|
|
|
|
Male | 50 | 7 (14.0) | 43 (86.0) | 0.561 |
|
Female | 26 | 4 (15.4) | 22 (84.6) |
|
| pN status |
|
|
|
|
| N0 | 44 | 7 (15.9) | 37 (84.1) | 0.471 |
|
N1-N2 | 32 | 4 (12.5) | 28 (87.5) |
|
| pM status |
|
|
|
|
| M0 | 71 | 8 (11.3) | 63 (88.7) | 0.020a |
| M1 | 5 | 3 (60.0) | 2 (40.0) |
|
| Clinical stage |
|
|
|
|
| I and
II | 46 | 8 (6.5) | 43 (93.5) | 0.018a |
| III and
IV | 30 | 3 (26.7) | 22 (73.3) |
|
| Table IV.Associations between TDRG1 expression
level and clinicopathological characteristics in 76 patients. |
Table IV.
Associations between TDRG1 expression
level and clinicopathological characteristics in 76 patients.
|
|
| TDRG1 |
|---|
|
|
|
|
|---|
| Clinicopathological
characteristic | n | High expression
(%) | Low expression
(%) | P-value |
|---|
| Age (year) |
|
|
|
|
|
>60 | 47 | 16 (34.0) | 31 (66.0) | 0.162 |
|
≤60 | 29 | 6 (20.7) | 23 (79.3) |
|
| Sex |
|
|
|
|
|
Male | 50 | 17 (34.0) | 33 (66.0) | 0.140 |
|
Female | 26 | 5 (19.2) | 21 (80.8) |
|
| pN status |
|
|
|
|
| N0 | 44 | 19 (43.2) | 25 (26.8) | 0.001a |
|
N1-N2 | 32 | 3 (9.4) | 29 (90.6) |
|
| pM status |
|
|
|
|
| M0 | 71 | 21 (29.6) | 50 (70.4) | 0.548 |
| M1 | 5 | 1 (20.0) | 4
(80.0) |
|
| Clinical stage |
|
|
|
|
| I and
II | 46 | 11 (23.9) | 35 (76.1) | 0.174 |
| III and
IV | 30 | 11 (36.7) | 19 (63.3) |
|
XIST, BCYRN1, RRP1B and TDRG1 may be
used as noninvasive biomarkers for EGC
The ROC curve is a comprehensive index that reflects
the sensitivity and specificity of continuous variables. In the
present study, the occurrence of EGC was predicted by ROC curve
analysis using XIST, BCYRN1, RRP1B and TDRG1 expressions in 76 EGC
samples and paired NATs (controls). The AUC for XIST was 0.733
(sensitivity=0.846; specificity=0.590; ***P<0.001; Fig. 3A). The AUC for BCYRN1 was 0.821
(sensitivity=0.679; specificity=0.859; ***P<0.001; Fig. 3B). The AUC for RRP1B was 0.753
(sensitivity=0.859; specificity=0.564; ***P<0.001; Fig. 3C). The AUC for TDRG1 was 0.681
(sensitivity=0.731; specificity=0.603; ***P<0.001; Fig. 3D). These data suggested that XIST,
BCYRN1, RRP1B and TDRG1 may be able to serve as biomarkers of
EGC.
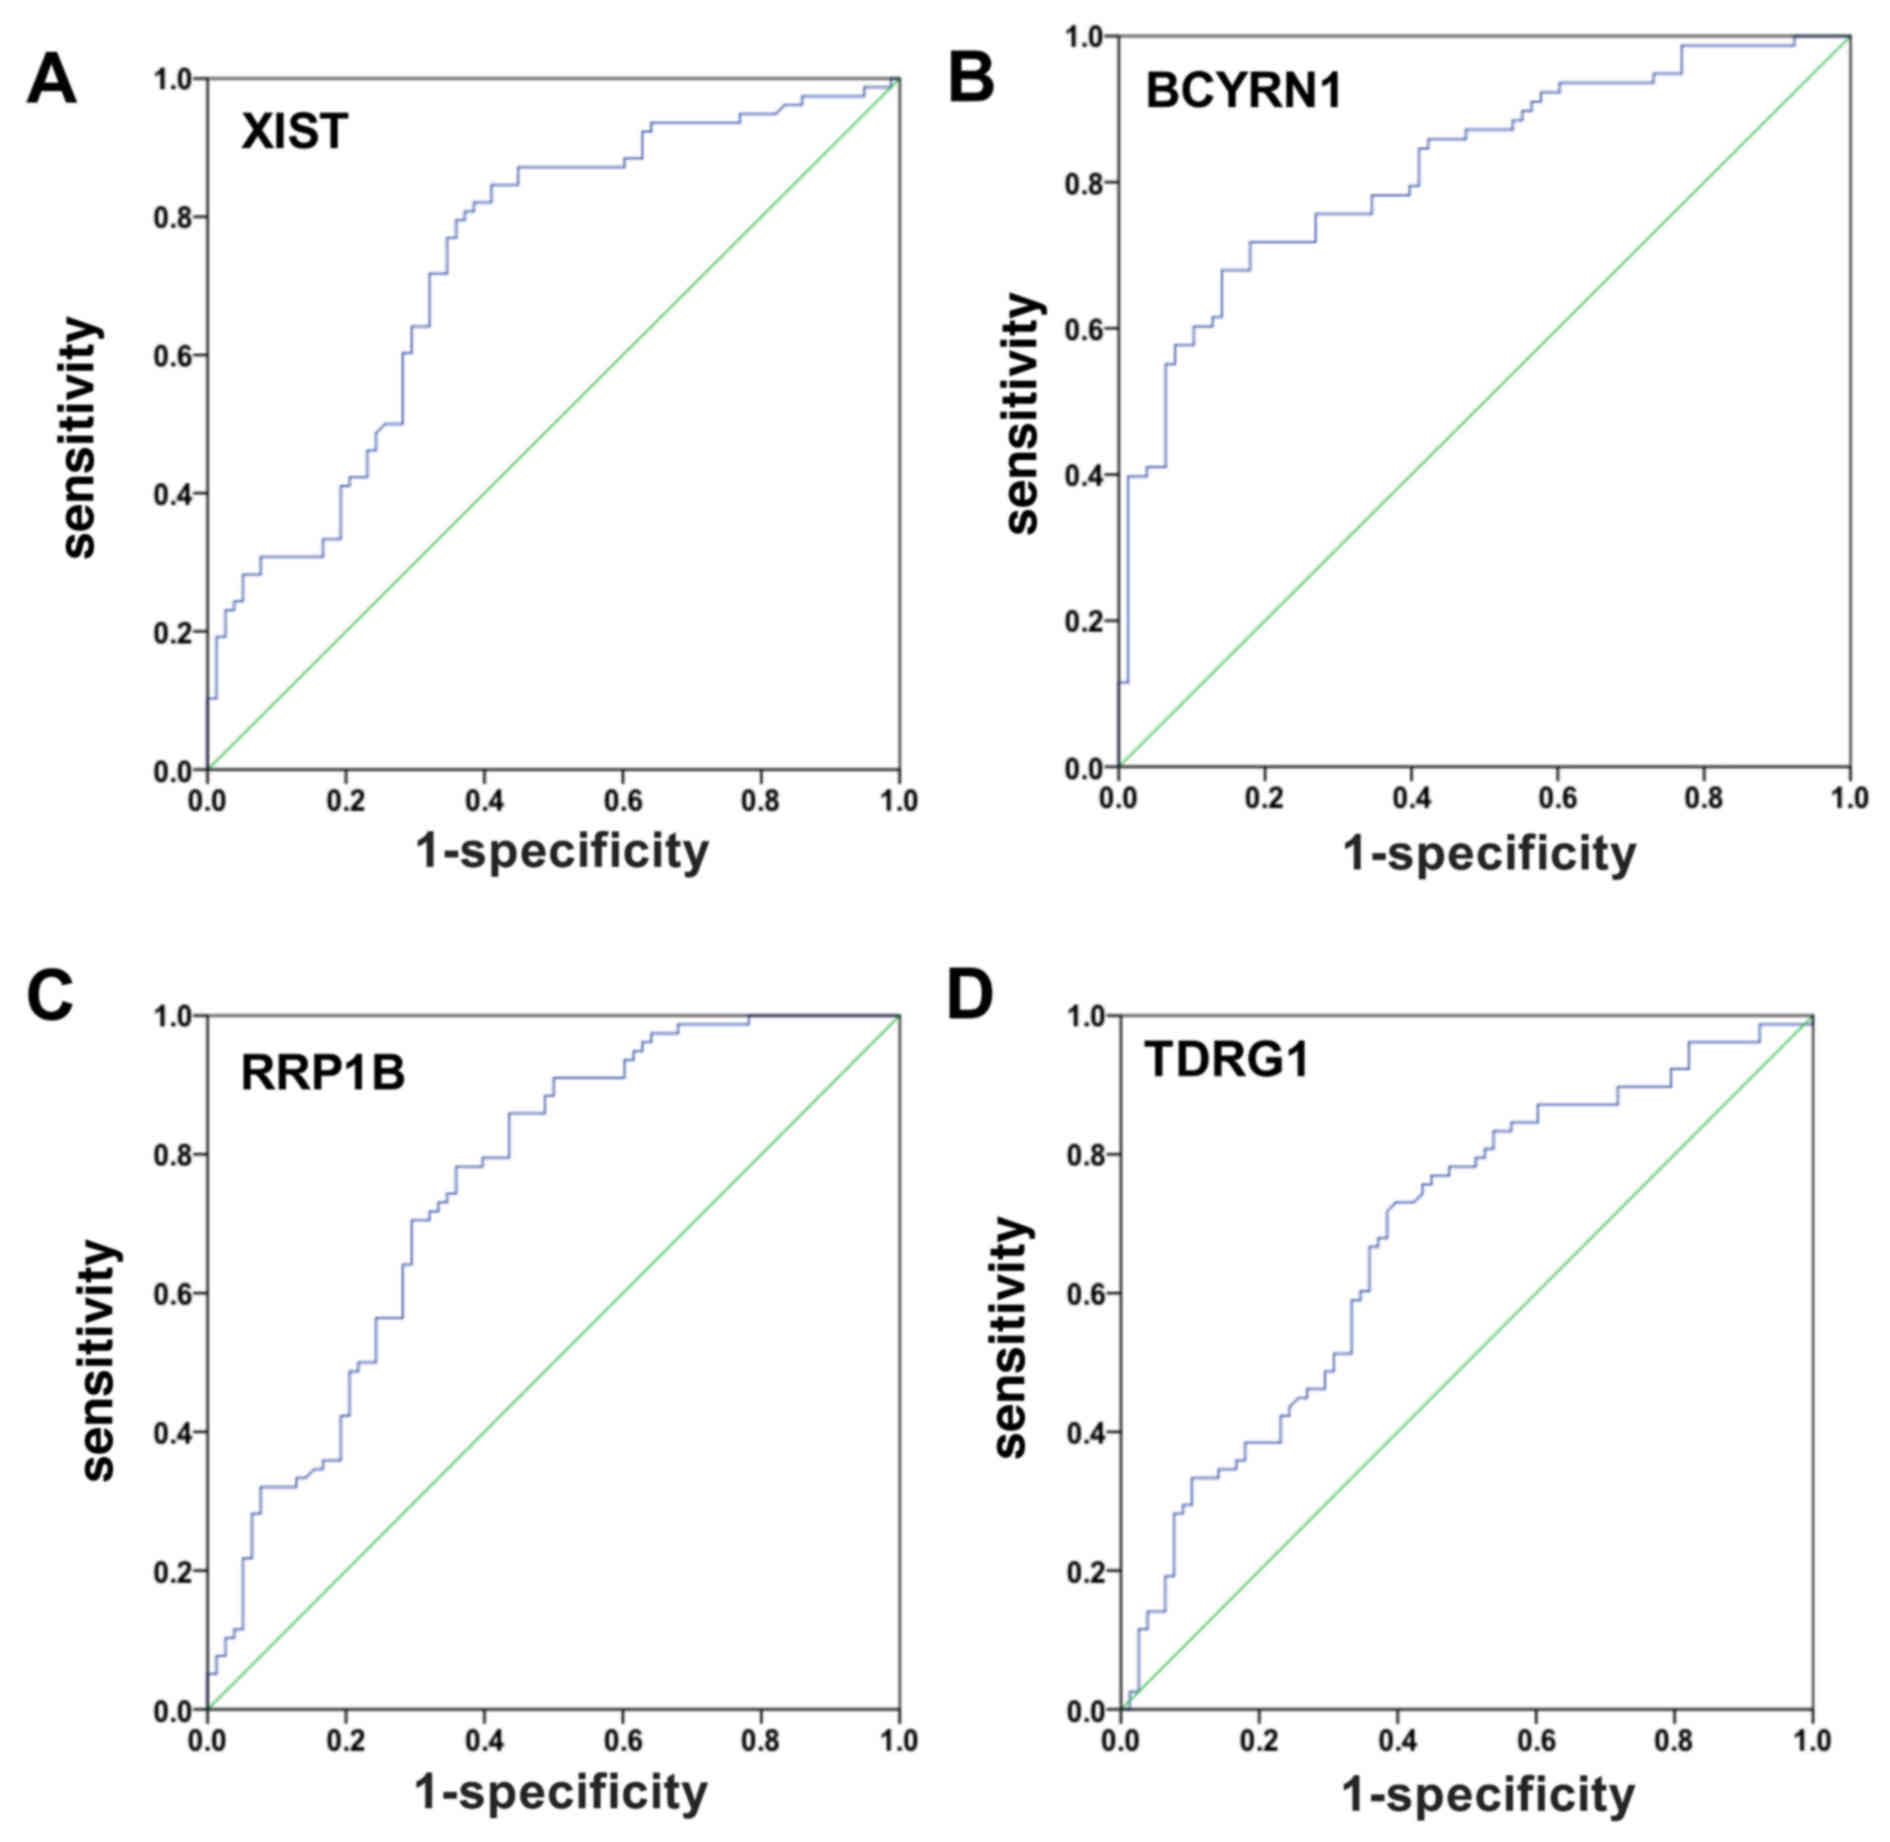 | Figure 3.EGC was predicted by ROC curve
analysis using XIST, BCYRN1, RRP1B and TDRG1 expression levels
between EGC patients and controls. (A) ROC curve analysis using
XIST.AUC=0.733; sensitivity=0.846; specificity=0.590. (B) ROC curve
analysis using BCYRN1. AUC=0.821; sensitivity=0.679;
specificity=0.859. (C) ROC curve analysis using RRP1B. AUC=0.753;
sensitivity=0.859; specificity=0.564. (D) ROC curve analysis using
TDRG1. AUC=0.681; sensitivity=0.731; specificity=0.603. An ROC
curve plots the sensitivity on the y-axis against one minus the
1-specificity on the x-axis. A diagonal line at 45, known as the
line of chance, would result from a test which allocated subjects
randomly. AUC, area under the ROC curve; BCYRN1, brain cytoplasmic
RNA 1; EGC, early gastric cancer; NAT, normal adjacent tissue; ROC,
receiver-operator characteristic; RRP1B, ribosomal RNA processing
1B; TDRG1, testes development related 1; XIST, X inactive-specific
transcript. |
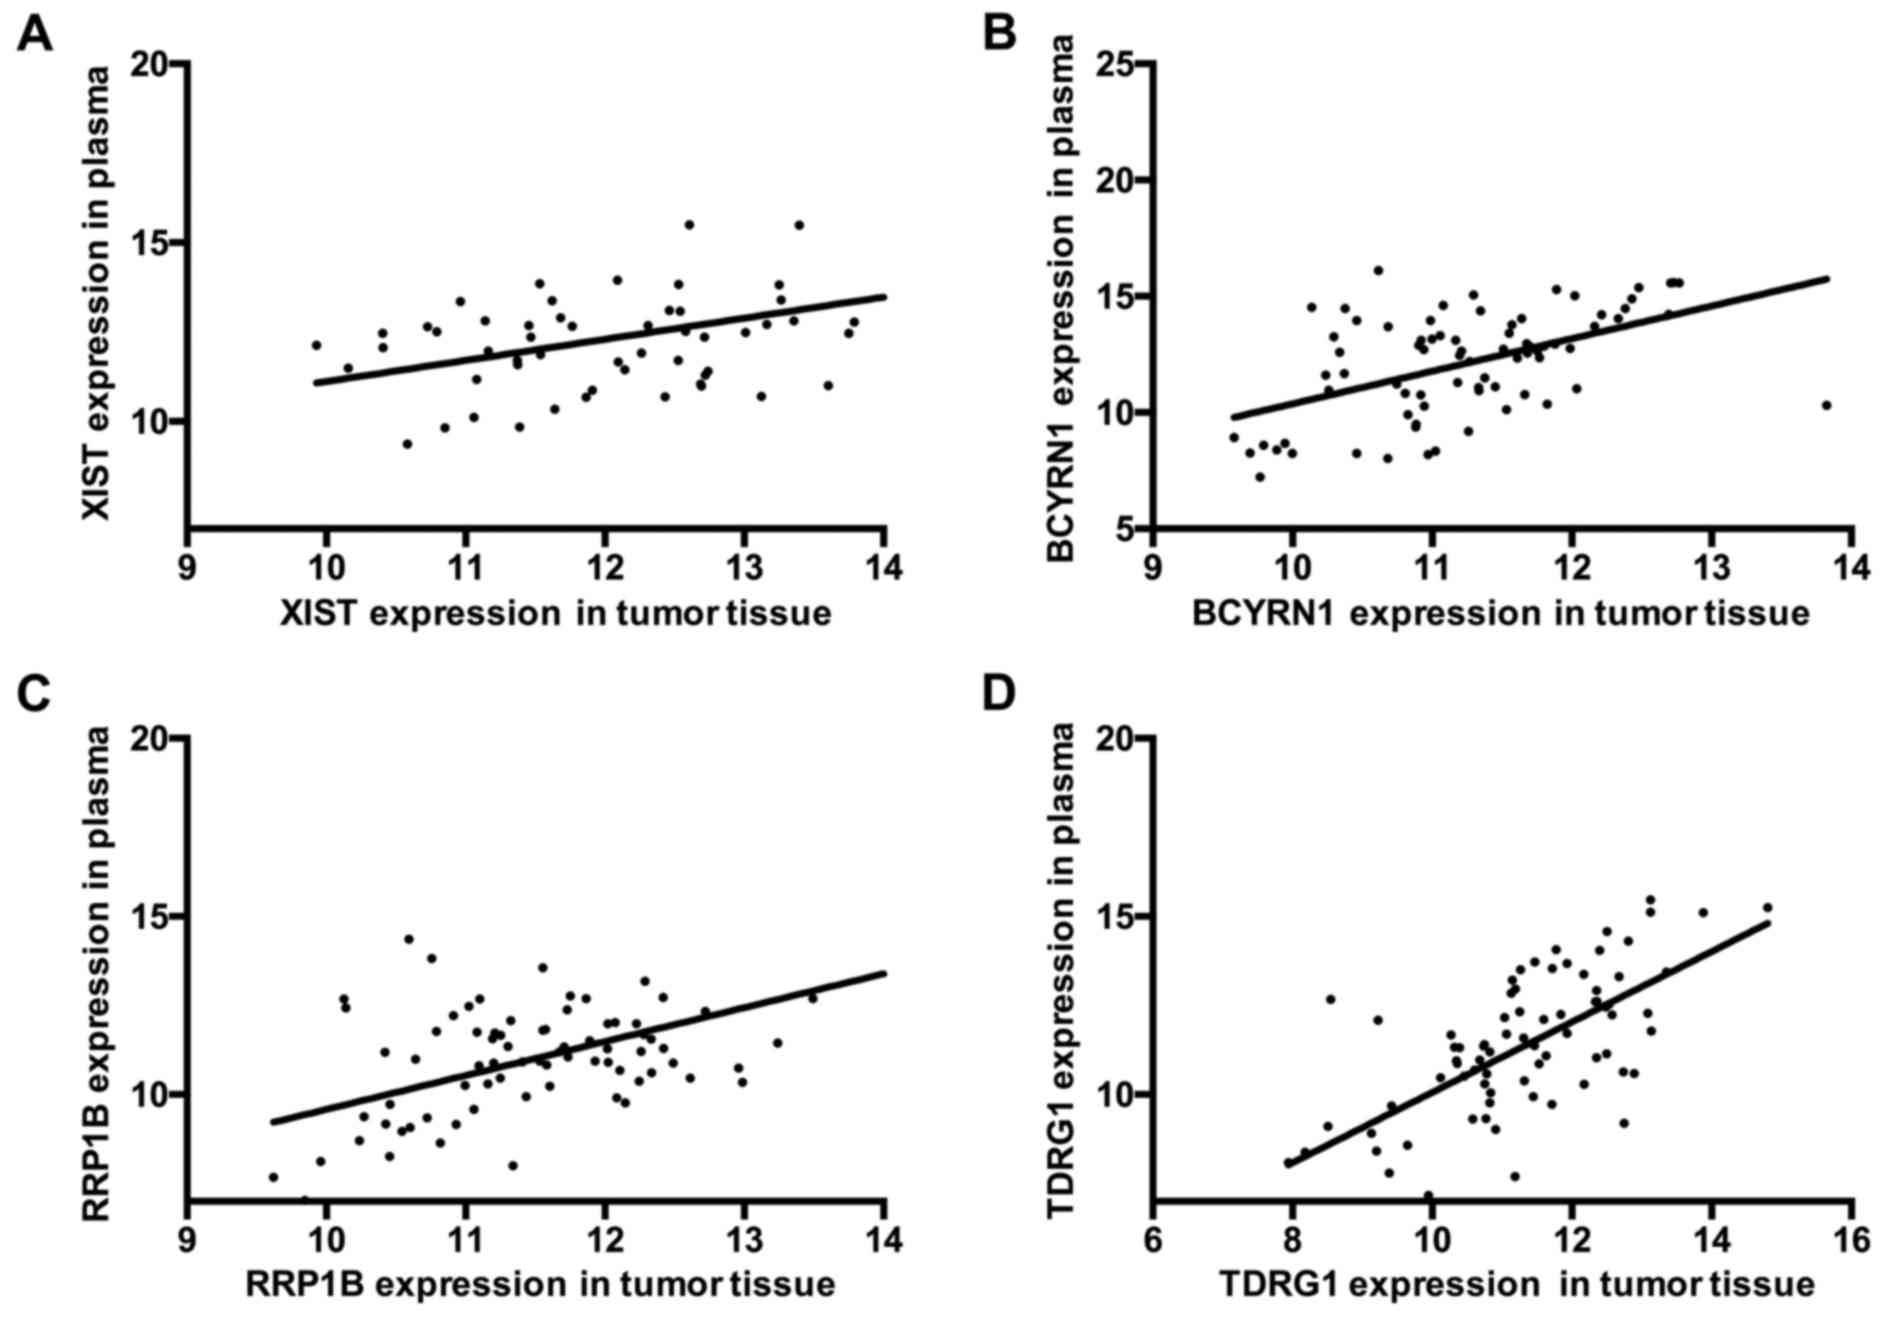
Positive correlation of XIST, BCYRN1,
RRP1B and TDRG1 expression between EGC tissue and plasma
Similar to EGC tissues, the expression levels of
XIST and BCYRN1 were increased and the expression levels of RRP1B
and TDRG1 were decreased in the plasma from patients with EGC. The
correlations for XIST, BCYRN1, RRP1B and TDRG1 expression levels
between EGC tissue and plasma were further analyzed and the results
indicated that there was a positive correlation for XIST expression
between EGC tissues and plasma (R2=0.2650;
***P<0.001; Fig. 4A). A
positive correlation was also made between EGC tissues and plasma
for BCYRN1 expression (R2=0.2686; ***P<0.001;
Fig. 4B), RRP1B expression
(R2=0.2920; ***P<0.001; Fig. 4C), and TDRG1 expression
(R2=0.4120; ***P<0.001; Fig. 4D). These results demonstrated that
XIST, BCYRN1, RRP1B and TDRG1 were aberrantly expressed both in EGC
tissues and plasma, which may be related to EGC disease
progression.
Discussion
Currently, the study of biomarkers study has focused
on noncoding RNAs, particularly lncRNAs, most of which are
transcribed by RNA polymerase (Pol) II and Pol I, but some are
transcribed by RNA Pol III (24).
A number of previous studies have indicated that lncRNAs serve
important roles in regulating gene expression (20,25–27)
and participate in cell cycle and differentiation (10), apoptosis (11,12)
and chromatin remodeling (28–30).
Other studies have demonstrated that lncRNAs were involved in the
development of various cancers (31). For example, long intergenic
noncoding RNA for kinase activation (LINK-A) was reported to
activate normoxic HIF1α signaling in certain breast cancers
(32); antisense noncoding RNA in
the INK4 locus (ANRIL) may be a potential prognostic biomarker in
GC and has been demonstrated to regulate microRNA
(miR)-99a/miR-449a (33); and
lncRNA-n336928 has been correlated with bladder cancer tumor stage
and overall survival (34).
Therefore, lncRNAs may be important regulatory factors for gene
expressions, yet their functions in cancer remain unclear and
requires a deeper understanding of the regulatory networks that may
be involved.
A previous study identified 33 differentially
expressed lncRNAs using a human lncRNA microarray to screen GC
tissues and paired NATs (21).
Other studies have reported that H19 promotes proliferation of GC
cells and high expression of H19 indicates a poor prognosis in
patients with GC (35,36); prostate cancer associated 3 (PCA3)
is highly expressed in prostate cancer (37); HOX transcript antisense RNA
(HOTAIR) promotes tumor invasion and reverses EMT in GC (38,39).
In addition, a decrease in the expression of growth arrest specific
5 (GAS5) was revealed to induce a poor prognosis and accelerate
cell proliferation in GC (40),
and metastasis associate lung adenocarcinoma transcript 1 (MALAT1)
was reported to enhance GC cell proliferation through
pre-mRNA-splicing factor SF2/alternative splicing factor (ASF)
(41). HIF1A-AS1, PVT1, CBR3-AS1
and UCA1 have also been identified in GC (21), and the present study examined the
expression levels of XIST, Yiya, BCYRN1, RRP1B, KCNQ1OT1 and TDRG1
in EGC.
In the present study, it was demonstrated that XIST
and BCYRN1 were significantly upregulated, and RRP1B and TDRG1 were
significantly downregulated, in EGC tissues compared with NATs.
RRP1B was correlated with pM and clinical stage, and TDRG1 was
correlated with pN. In addition, there were positive correlations
for XIST, BCYRN1, RRP1B and TDRG1 expressions between EGC tissue
and plasma. Therefore, it was suggested that XIST, BCYRN1, RRP1B
and TDRG1 may be promising candidates for the diagnosis of EGC.
In conclusion, RT-qPCR analysis demonstrated that
XIST, BCYRN1, RRP1B and TDRG1 were differentially expressed in EGC
tissues compared with NATs, and ROC curve analysis indicated that
these lncRNAs have potential diagnostic values for the detection of
EGC. Furthermore, the results indicated that there were significant
positive correlations of XIST, BCYRN1, RRP1B and TDRG1 expression
levels between the EGC tissues and plasmas. Therefore, the present
study suggested that XIST, BCYRN1, RRP1B and TDRG1 may potentially
serve as diagnostic biomarkers for EGC.
Acknowledgements
The present study was supported by the Jiangsu
Provincial Traditional Chinese Medicine Bureau of Science and
Technology Project (grant no. YB2015181).
References
|
1
|
Torre LA, Bray F, Siegel RL, Ferlay J,
Lortet-Tieulent J and Jemal A: Global cancer statistics, 2012. CA
Cancer J Clin. 65:87–108. 2015. View Article : Google Scholar : PubMed/NCBI
|
|
2
|
Lin M, Shi C, Lin X, Pan J, Shen S, Xu Z
and Chen Q: sMicroRNA-1290 inhibits cells proliferation and
migration by targeting FOXA1 in gastric cancer cells. Gene.
582:137–142. 2016. View Article : Google Scholar : PubMed/NCBI
|
|
3
|
Baĭramov RB and Abdullaeva RT: The impact
of early gastric cancer diagnosis on indices of survival in
patients after radical surgical intervention. Klin Khir. 1–21.
2013.
|
|
4
|
Bang CS, Baik GH, Shin IS, Kim JB, Suk KT,
Yoon JH, Kim YS and Kim DJ: Helicobacter pylori Eradication for
prevention of metachronous recurrence after endoscopic resection of
early gastric cancer. J Korean Med Sci. 30:749–756. 2015.
View Article : Google Scholar : PubMed/NCBI
|
|
5
|
Pasechnikov V, Chukov S, Fedorov E,
Kikuste I and Leja M: Gastric cancer: Prevention, screening and
early diagnosis. World J Gastroenterol. 20:13842–13862. 2014.
View Article : Google Scholar : PubMed/NCBI
|
|
6
|
Waddell T, Verheij M, Allum W, Cunningham
D, Cervantes A and Arnold D; European Society for Medical Oncology
(ESMO), ; European Society of Surgical Oncology (ESSO), ; European
Society of Radiotherapy and Oncology (ESTRO), : Gastric cancer:
ESMO-ESSO-ESTRO clinical practice guidelines for diagnosis,
treatment and follow-up. Eur J Surg Oncol. 40:584–591. 2014.
View Article : Google Scholar : PubMed/NCBI
|
|
7
|
Cai H, Yuan Y, Hao YF, Guo TK, Wei X and
Zhang YM: Plasma microRNAs serve as novel potential biomarkers for
early detection of gastric cancer. Med Oncol. 30:4522013.
View Article : Google Scholar : PubMed/NCBI
|
|
8
|
Guttman M and Rinn JL: Modular regulatory
principles of large non-coding RNAs. Nature. 482:339–346. 2012.
View Article : Google Scholar : PubMed/NCBI
|
|
9
|
Khalil AM, Guttman M, Huarte M, Garber M,
Raj A, Morales D Rivea, Thomas K, Presser A, Bernstein BE, van
Oudenaarden A, et al: Many human large intergenic noncoding RNAs
associate with chromatin-modifying complexes and affect gene
expression. Proc Natl Acad Sci USA. 106:pp. 11667–11672. 2009;
View Article : Google Scholar : PubMed/NCBI
|
|
10
|
Liu X, Li D, Zhang W, Guo M and Zhan Q:
Long non-coding RNA gadd7 interacts with TDP-43 and regulates Cdk6
mRNA decay. EMBO J. 31:4415–4427. 2012. View Article : Google Scholar : PubMed/NCBI
|
|
11
|
Lakhotia SC: Long non-coding RNAs
coordinate cellular responses to stress. Wiley Interdiscip Rev RNA.
3:779–796. 2012. View Article : Google Scholar : PubMed/NCBI
|
|
12
|
Paralkar VR and Weiss MJ: A new ‘Linc’
between noncoding RNAs and blood development. Genes Dev.
25:2555–2558. 2011. View Article : Google Scholar : PubMed/NCBI
|
|
13
|
Dhamija S and Diederichs S: From junk to
master regulators of invasion: lncRNA functions in migration, EMT
and metastasis. Int J Cancer. 139:269–280. 2016. View Article : Google Scholar : PubMed/NCBI
|
|
14
|
Yang F, Zhang L, Huo XS, Yuan JH, Xu D,
Yuan SX, Zhu N, Zhou WP, Yang GS, Wang YZ, et al: Long noncoding
RNA high expression in hepatocellular carcinoma facilitates tumor
growth through enhancer of zeste homolog 2 in humans. Hepatology.
54:1679–1689. 2011. View Article : Google Scholar : PubMed/NCBI
|
|
15
|
Enfield KS, Pikor LA, Martinez VD and Lam
WL: Mechanistic roles of noncoding RNAs in lung cancer biology and
their clinical implications. Genet Res Int.
2012:7374162012.PubMed/NCBI
|
|
16
|
Chai Y, Liu J, Zhang Z and Liu L:
HuR-regulated lncRNA NEAT1 stability in tumorigenesis and
progression of ovarian cancer. Cancer Med. 5:1588–1598. 2016.
View Article : Google Scholar : PubMed/NCBI
|
|
17
|
Qi P, Dong L, Lin W, Zhou X and Du X:
Abstract B42: A two-lncRNA signature in serous exosomes serves as a
new biomarker for colorectal cancer diagnosis. Cancer Res.
76:B422016. View Article : Google Scholar
|
|
18
|
Piao HL and Ma L: Non-coding RNAs as
regulators of mammary development and breast cancer. J Mammary
Gland Biol Neoplasia. 17:33–42. 2012. View Article : Google Scholar : PubMed/NCBI
|
|
19
|
Zhao W, An Y, Liang Y and Xie XW: Role of
HOTAIR long noncoding RNA in metastatic progression of lung cancer.
Eur Rev Med Pharmacol Sci. 18:1930–1936. 2014.PubMed/NCBI
|
|
20
|
Mercer TR, Dinger ME and Mattick JS: Long
non-coding RNAs: Insights into functions. Nat Rev Genet.
10:155–159. 2009. View
Article : Google Scholar : PubMed/NCBI
|
|
21
|
Gao J, Cao R and Mu H: Long non-coding RNA
UCA1 may be a novel diagnostic and predictive biomarker in plasma
for early gastric cancer. Int J Clin Exp Pathol. 8:12936–12942.
2015.PubMed/NCBI
|
|
22
|
Jiang L, Lai YK, Zhang J, Wang H, Lin MC,
He ML and Kung HF: Targeting S100P inhibits colon cancer growth and
metastasis by Lentivirus-mediated RNA interference and proteomic
analysis. Mol Med. 17:709–716. 2011. View Article : Google Scholar : PubMed/NCBI
|
|
23
|
Livak KJ and Schmittgen TD: Analysis of
relative gene expression data using real-time quantitative PCR and
the 2(-Delta Delta C(T)) method. Methods. 25:402–408. 2001.
View Article : Google Scholar : PubMed/NCBI
|
|
24
|
Bierhoff H, Schmitz K, Maass F, Ye J and
Grummt I: Noncoding transcripts in sense and antisense orientation
regulate the epigenetic state of ribosomal RNA genes. Cold Spring
Harb Symp Quant Biol. 75:357–364. 2010. View Article : Google Scholar : PubMed/NCBI
|
|
25
|
Wang KC and Chang HY: Molecular mechanisms
of long noncoding RNAs. Mol Cell. 43:904–914. 2011. View Article : Google Scholar : PubMed/NCBI
|
|
26
|
Nagano T and Fraser P: No-nonsense
functions for long noncoding RNAs. Cell. 145:178–181. 2011.
View Article : Google Scholar : PubMed/NCBI
|
|
27
|
Loewer S, Cabili MN, Guttman M, Loh YH,
Thomas K, Park IH, Garber M, Curran M, Onder T, Agarwal S, et al:
Large intergenic non-coding RNA-RoR modulates reprogramming of
human induced pluripotent stem cells. Nat Genet. 42:1113–1117.
2010. View
Article : Google Scholar : PubMed/NCBI
|
|
28
|
Saxena A and Carninci P: Long non-coding
RNA modifies chromatin: Epigenetic silencing by long non-coding
RNAs. Bioessays. 33:830–839. 2011. View Article : Google Scholar : PubMed/NCBI
|
|
29
|
Kotake Y, Nakagawa T, Kitagawa K, Suzuki
S, Liu N, Kitagawa M and Xiong Y: Long non-coding RNA ANRIL is
required for the PRC2 recruitment to and silencing of p15(INK4B)
tumor suppressor gene. Oncogene. 30:1956–1962. 2011. View Article : Google Scholar : PubMed/NCBI
|
|
30
|
Tsai MC, Manor O, Wan Y, Mosammaparast N,
Wang JK, Lan F, Shi Y, Segal E and Chang HY: Long noncoding RNA as
modular scaffold of histone modification complexes. Science.
329:689–693. 2010. View Article : Google Scholar : PubMed/NCBI
|
|
31
|
Noori-Daloii MR and Eshaghkhani Y: lncRNAs
roles in cancer occurrence. Med Sci J Islamic Azad Univesity-Tehran
Medical Branch. 25:163–182. 2015.
|
|
32
|
Lin A, Li C, Xing Z, Hu Q, Liang K, Han L,
Wang C, Hawke DH, Wang S, Zhang Y, et al: The LINK-A lncRNA
activates normoxic HIF1 α signalling in triple-negative breast
cancer. Nat Cell Biol. 18:213–224. 2016. View Article : Google Scholar : PubMed/NCBI
|
|
33
|
Xu Z, Chen J, Luk JM and De W: Abstract
157: LncRNA ANRIL indicates a potential prognostic biomarker in
gastric cancer and promotes tumor growth by silencing of
miR-99a/miR-449a. Cancer Res. 75:1572015. View Article : Google Scholar
|
|
34
|
Chen T, Xie W, Xie L, Sun Y, Zhang Y, Shen
Z, Sha N, Xu H, Wu Z, Hu H and Wu C: Expression of long noncoding
RNA lncRNA-n336928 is correlated with tumor stage and grade and
overall survival in bladder cancer. Biochem Biophys Res Commun.
468:666–670. 2015. View Article : Google Scholar : PubMed/NCBI
|
|
35
|
Zhang G, Hou X, Li Y and Zhao M: MiR-205
inhibits cell apoptosis by targeting phosphatase and tensin homolog
deleted on chromosome ten in endometrial cancer Ishikawa cells. BMC
cancer. 14:4402014. View Article : Google Scholar : PubMed/NCBI
|
|
36
|
Yang F, Bi J, Xue X, Zheng L, Zhi K, Hua J
and Fang G: Up-regulated long non-coding RNA H19 contributes to
proliferation of gastric cancer cells. FEBS J. 279:3159–3165. 2012.
View Article : Google Scholar : PubMed/NCBI
|
|
37
|
Yarmishyn AA and Kurochkin IV: Long
noncoding RNAs: A potential novel class of cancer biomarkers. Front
Genet. 6:1452015. View Article : Google Scholar : PubMed/NCBI
|
|
38
|
Endo H, Shiroki T, Nakagawa T, Yokoyama M,
Tamai K, Yamanami H, Fujiya T, Sato I, Yamaguchi K, Tanaka N, et
al: Enhanced expression of long non-coding RNA HOTAIR is associated
with the development of gastric cancer. PLoS One. 8:e770702013.
View Article : Google Scholar : PubMed/NCBI
|
|
39
|
Xu ZY, Yu QM, Du YA, Yang LT, Dong RZ,
Huang L, Yu PF and Cheng XD: Knockdown of long non-coding RNA
HOTAIR suppresses tumor invasion and reverses
epithelial-mesenchymal transition in gastric cancer. Int J Biol
Sci. 9:587–597. 2013. View Article : Google Scholar : PubMed/NCBI
|
|
40
|
Sun M, Jin FY, Xia R, Kong R, Li JH, Xu
TP, Liu YW, Zhang EB, Liu XH and De W: Decreased expression of long
noncoding RNA GAS5 indicates a poor prognosis and promotes cell
proliferation in gastric cancer. BMC Cancer. 14:3192014. View Article : Google Scholar : PubMed/NCBI
|
|
41
|
Wang J, Su L, Chen X, Li P, Cai Q, Yu B,
Liu B, Wu W and Zhu Z: MALAT1 promotes cell proliferation in
gastric cancer by recruiting SF2/ASF. Biomed Pharmacother.
68:557–564. 2014. View Article : Google Scholar : PubMed/NCBI
|