Introduction
Malignant glioma is the most common central nervous
system tumour in adults and is associated with significant
morbidity and mortality (1).
Gliomas are highly invasive and poorly respond to conventional
treatments; therefore, further studies to support the development
of therapy for them are warranted (2).
Alterations in methylation serve a critical role in
the pathogenesis of numerous human malignancies, including gliomas
(3). CpG island methylator
phenotype (CIMP) has emerged as a distinct molecular subclass of
tumours (4). It features
extensive, coordinated hypermethylation at specific loci (5,6).
Several key genes regulated by methylation have been previously
identified. O6-methylguanine-DNA methyltransferase
(MGMT), which is responsible for DNA repair, is associated with
chemotherapy resistance (7).
Previous studies indicated that epigenetic silencing of MGMT via
promoter methylation serves an important role in the regulation of
MGMT expression in gliomas (8).
Bruna et al (9)
demonstrated that the methylation of platelet-derived growth factor
(PDGF)-B can dictate transforming growth factor-β as an oncogenic
factor to promote cell proliferation in human glioma. In addition,
Wiencke et al (10)
reported that methylation of the phosphatase and tensin homolog
promoter defines low-grade gliomas and secondary glioblastoma.
Mueller et al (11) also
suggested that epigenetic dysregulation of runt-related
transcription factor 3 and testin is involved in glioblastoma
tumorigenesis. Abnormal DNA methylation of CD133 (12) and tumor protein 53 (13) is also observed in glioma.
Additionally, Turcan et al (14) indicated that isocitrate
dehydrogenase 1 mutation is sufficient to establish the glioma
hypermethylator phenotype. However, the identification of
glioma-CIMP (G-CIMP) tumours based on gene expression data has
rarely been reported (15). In the
present study, gene expression profiles of CIMP-positive
(CIMP+) samples were compared with those of
CIMP-negative (CIMP−) samples to identify differentially
expressed genes (DEGs), which were further subjected to functional
enrichment analysis and network analyses. The findings of the
present study may extend the understanding of the molecular
mechanisms of CIMP+ glioma.
Materials and methods
Gene expression data
A gene expression data set (accession no. GSE30336)
was downloaded from Gene Expression Omnibus (14), including 36 CIMP+ glioma
and 16 CIMP− samples. Gene expression levels were
measured using the GPL571 (HG-U133A_2) Affymetrix Human Genome
U133A 2.0 Array (Affymetrix; Thermo Fisher Scientific Inc.,
Waltham, MA, USA). Probe annotations were also acquired.
Pretreatment and differential
analysis
Raw data were pre-treated with the Robust Multichip
Average method using the Affy package of R (www.bioconductor.org/packages/release/bioc/html/affy.html).
Differential analysis was performed for CIMP+ vs.
CIMP− using the limma package (16) of R. |Log (fold change)| >1.0 and
P<0.05 were set as cut-offs for significant differential
expression.
Functional enrichment analysis
The Gene Ontology (GO; www.geneontology.org/) database is a bioinformatics
resource that can provide functional categorization and annotations
for gene products via the use of structured, controlled
vocabularies (17). The Kyoto
Encyclopaedia of Genes and Genome (KEGG; www.genome.jp/kegg) is a database for systematic
analysis of the functions of genes or proteins in several specific
metabolic and regulatory pathways (18). Functional enrichment analyses of
the GO and KEGG databases were conducted using the Database for
Annotation, Visualization and Integration Discovery (david.abcc.ncifcrf.gov/) (19). The statistical method for this was
based on hypergeometric distribution. P<0.05 was considered to
indicate significant functions and pathways.
Construction of protein-protein
interaction (PPI) network
Proteins work together to complete certain
biological functions. Therefore, revealing PPI is useful in
elucidating underlying molecular mechanisms. In the present study,
PPI networks were constructed for upregulated and downregulated
genes using information from STRING (20). Interactions with the required level
of confidence (i.e., score >0.4) were retained in the network.
The two networks were visualised using Cytoscape (21).
Proteins in the network were presented as ‘nodes’,
and each pairwise protein interaction was represented by an
undirected link and the ‘degree’ of a node corresponded to the
number of interactions by the protein. ‘Degree’ was calculated for
each node.
Prediction of miRNAs and construction
of the whole regulatory network
Web-based Gene Set Enrichment Analysis Toolkit
(WebGestalt; www.webgestalt.org/option.php) is a comprehensive and
powerful analysis toolkit, which can be used for enrichment
analysis and microRNA (miRNA)-target prediction by identifying
miRNA-binding site motifs. In the present study, miRNAs regulating
DEGs were predicted using WebGestalt (22). Count ≥2 was set as the cut-off for
predicted miRNAs and the top 10 miRNAs were selected. Following
miRNA-target gene network pairs using WebGestalt, PPI networks and
miRNA-target gene interactions were integrated. Subsequently, the
whole regulatory network was visualised using Cytoscape (21).
Results
DEGs
A total of 41,335 genes were detected and 439 DEGs
between CIMP+ and CIMP− samples were
identified, including 241 upregulated and 198 downregulated genes
in CIMP+ samples.
Functional enrichment analysis
The GO biological pathway terms enriched for the 241
upregulated genes in CIMP+ samples could be divided into
13 clusters. They were associated with extracellular matrix
organisation, defence response, immune response, collagen fibril
organisation, and regulation of cell motion. The top 10 terms are
listed in Table I.
 | Table I.GO biological process terms enriched
in the differentially expressed genes. |
Table I.
GO biological process terms enriched
in the differentially expressed genes.
| A, Upregulated
genes |
|---|
|
|---|
| GO term | Count | (%) | P-value |
|---|
| GO:0030198
extracellular matrix organization | 13 | 5.676855895 |
2.62×10⁻⁸ |
| GO:0030199 collagen
fibril organization | 8 | 3.493449782 |
1.25×10⁻⁷ |
| GO:0002504 antigen
processing and presentation of peptide or polysaccharide antigen
via major histocompatibility complex class II | 8 | 3.493449782 |
3.25×10⁻⁷ |
| GO:0009611 response
to wounding | 25 | 10.91703057 |
4.95×10⁻⁷ |
| GO:0006955 immune
response | 28 | 12.22707424 |
1.58×10⁻⁶ |
| GO:0043062
extracellular structure organization | 13 | 5.676855895 |
3.55×10⁻⁶ |
| GO:0006952 defense
response | 25 | 10.91703057 |
6.64×10⁻⁶ |
| GO:0016064
immunoglobulin mediated immune response | 8 | 3.493449782 |
1.05×10⁻⁵ |
| GO:0019724 B cell
mediated immunity | 8 | 3.493449782 |
1.34×10⁻⁵ |
| GO:0006954
inflammatory response | 17 | 7.423580786 |
1.59×10⁻⁵ |
|
| B, Downregulated
genes |
|
| GO term | Count | (%) | P-value |
|
| GO:0007423 sensory
organ development | 11 | 5.882352941 |
2.00×10⁻⁴ |
| GO:0007155 cell
adhesion | 20 | 10.69518717 |
2.07×10⁻⁴ |
| GO:0022610
biological adhesion | 20 | 10.69518717 |
2.10×10⁻⁴ |
| GO:0030182 neuron
differentiation | 15 | 8.021390374 |
2.97×10⁻⁴ |
| GO:0048666 neuron
development | 13 | 6.951871658 |
3.27×10⁻⁴ |
| GO:0044057
regulation of system process | 12 | 6.417112299 |
5.55×10⁻⁴ |
| GO:0048592 eye
morphogenesis | 6 | 3.20855615 |
9.10×10⁻⁴ |
| GO:0051966
regulation of synaptic transmission, glutamatergic | 4 | 2.139037433 |
1.07×10⁻³ |
| GO:0031175 neuron
projection development | 10 | 5.347593583 |
1.93×10⁻³ |
| GO:0015672
monovalent inorganic cation transport | 11 | 5.882352941 |
2.48×10⁻³ |
The GO biological pathway terms enriched for the 198
downregulated genes were divided into 12 clusters. They were
associated with cell adhesion, sensory organ development, system
process regulation, neuron differentiation and membrane
organisation. The top 10 terms are listed in Table I.
KEGG pathway enrichment analysis revealed 16
significant pathways associated with upregulated genes (Table II), including focal adhesion
(hsa04510), asthma (hsa05310), ECM-receptor interaction (hsa04512),
intestinal immune network for immunoglobulin A production
(hsa04672) and allograft rejection (hsa05330). No significant
pathway was identified for the downregulated genes.
| Table II.Kyoto Encyclopaedia of Genes and
Genome pathways enriched in the upregulated genes. |
Table II.
Kyoto Encyclopaedia of Genes and
Genome pathways enriched in the upregulated genes.
| Term | Count | P-value |
|---|
| hsa04510:Focal
adhesion | 15 |
2.96×10⁻⁶ |
|
hsa05310:Asthma | 7 |
5.16×10⁻⁶ |
|
hsa04512:Extracellular matrix-receptor
interaction | 10 |
6.52×10⁻⁶ |
| hsa04672:Intestinal
immune network for immunoglobulin A production | 8 |
1.09×10⁻⁵ |
| hsa05330:Allograft
rejection | 7 |
1.94×10⁻⁵ |
| hsa05322:Systemic
lupus erythematosus | 10 |
2.52×10⁻⁵ |
|
hsa05332:Graft-vs.-host disease | 7 |
3.12×10⁻⁵ |
| hsa04514:Cell
adhesion molecules | 11 |
4.31×10⁻⁵ |
| hsa04940:Type I
diabetes mellitus | 7 |
4.83×10⁻⁵ |
| hsa05416:Viral
myocarditis | 8 |
1.27×10⁻⁴ |
| hsa05320:Autoimmune
thyroid disease | 7 |
1.48×10⁻⁴ |
PPI networks of the DEGs
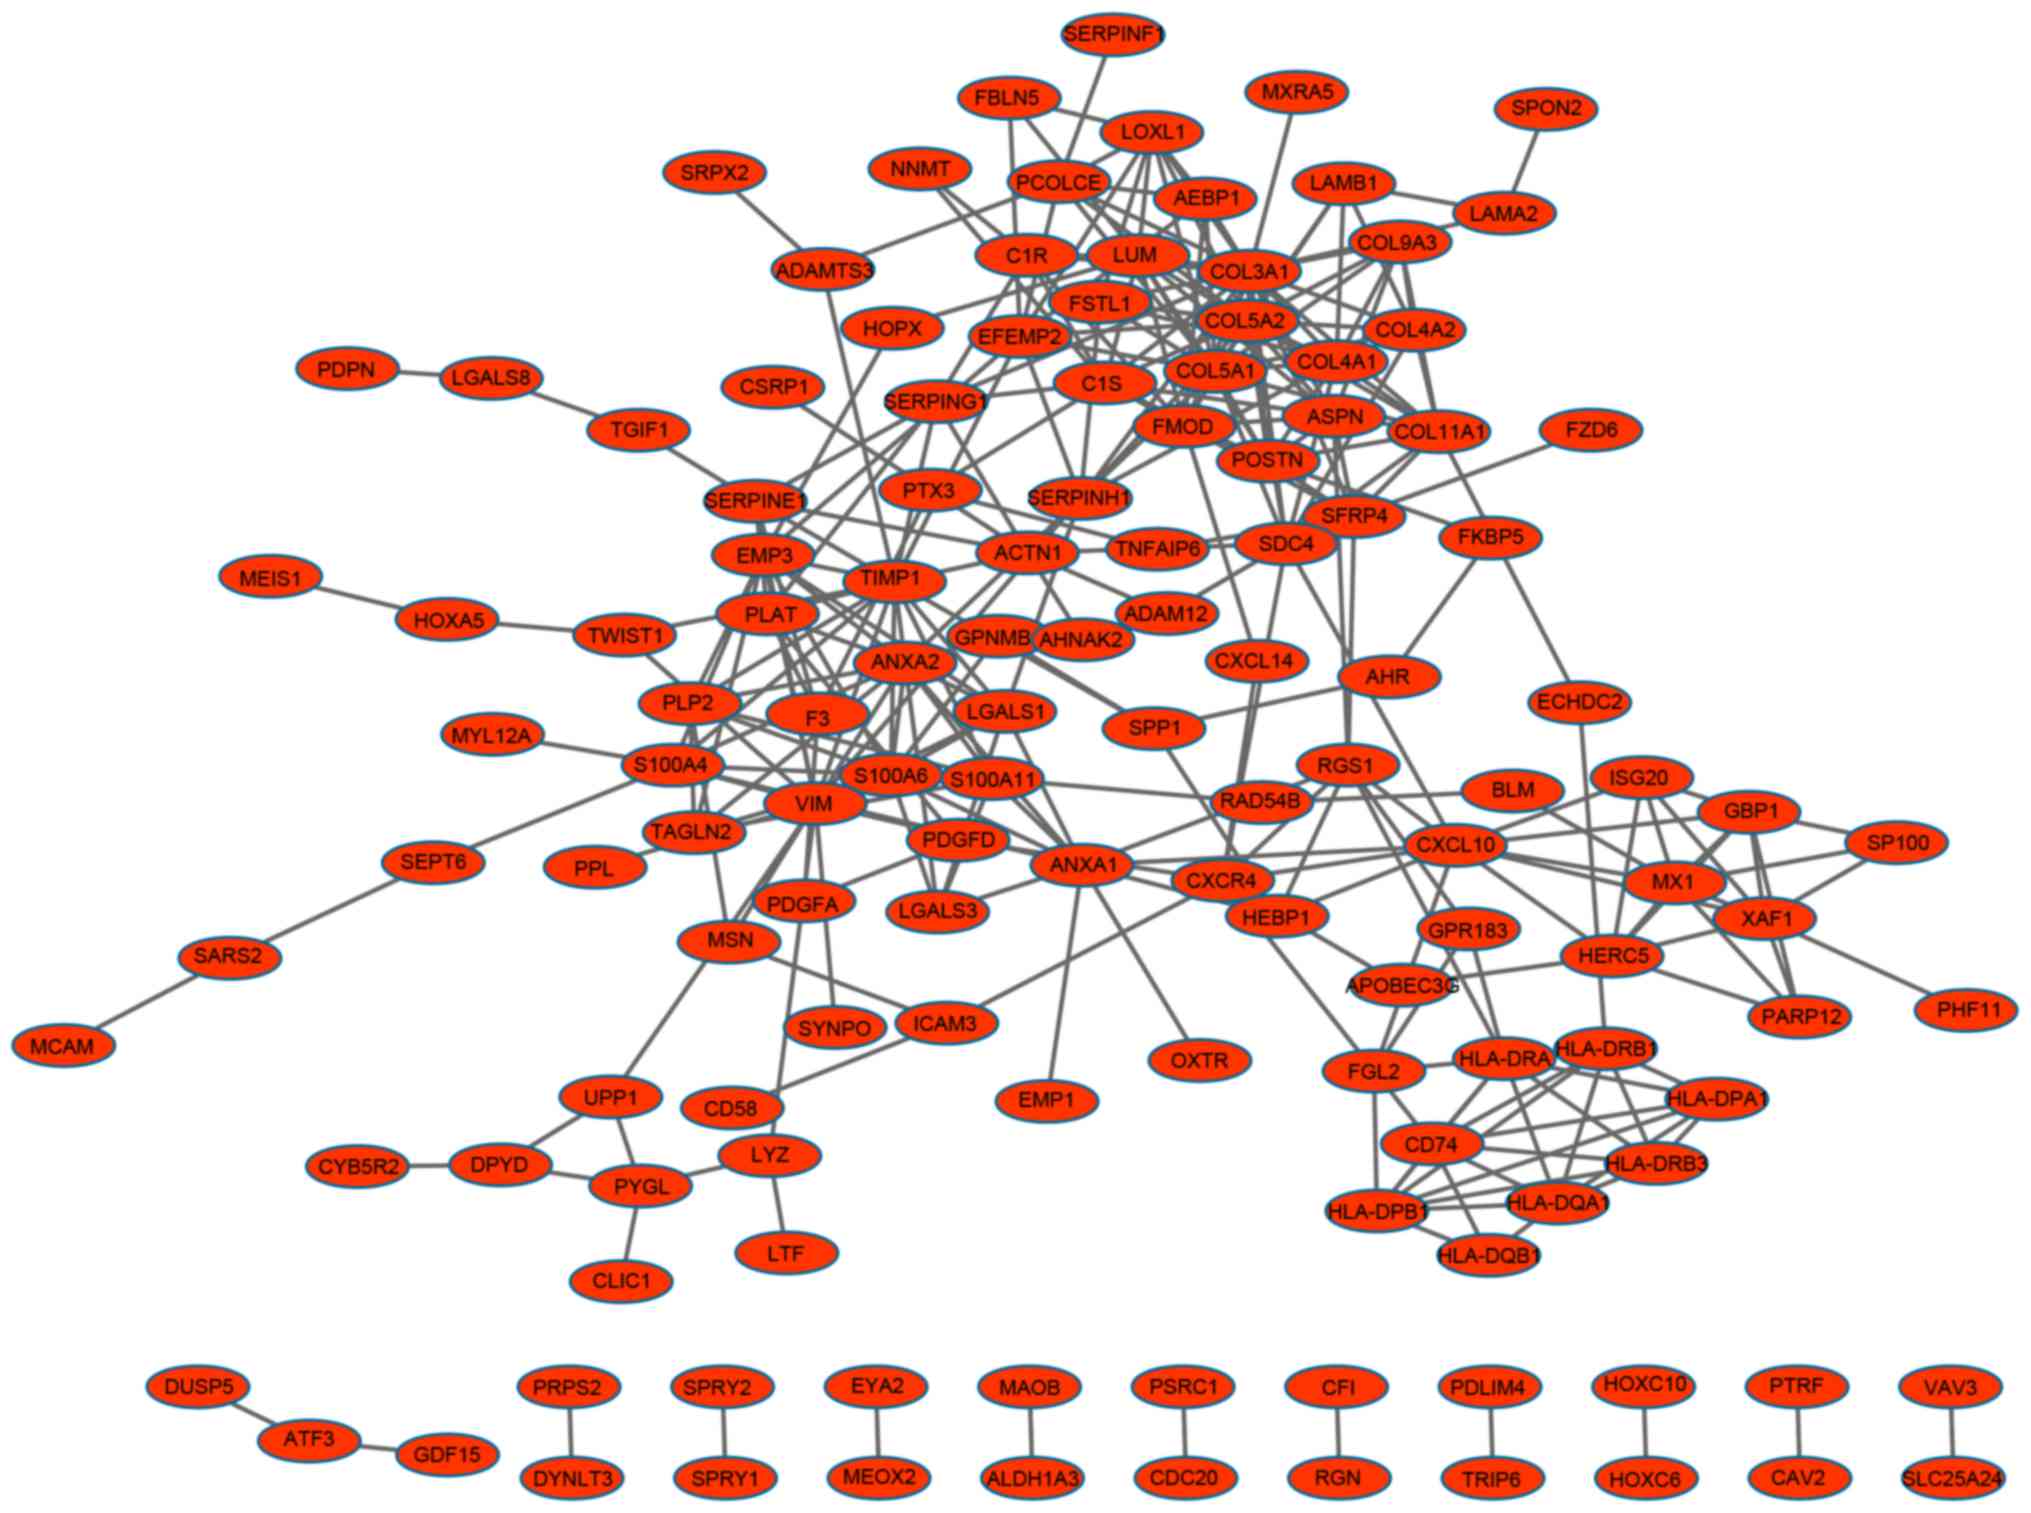
A PPI network containing 134 nodes and 314 edges was
constructed for the upregulated genes (Fig. 1), whereas a PPI network consisting
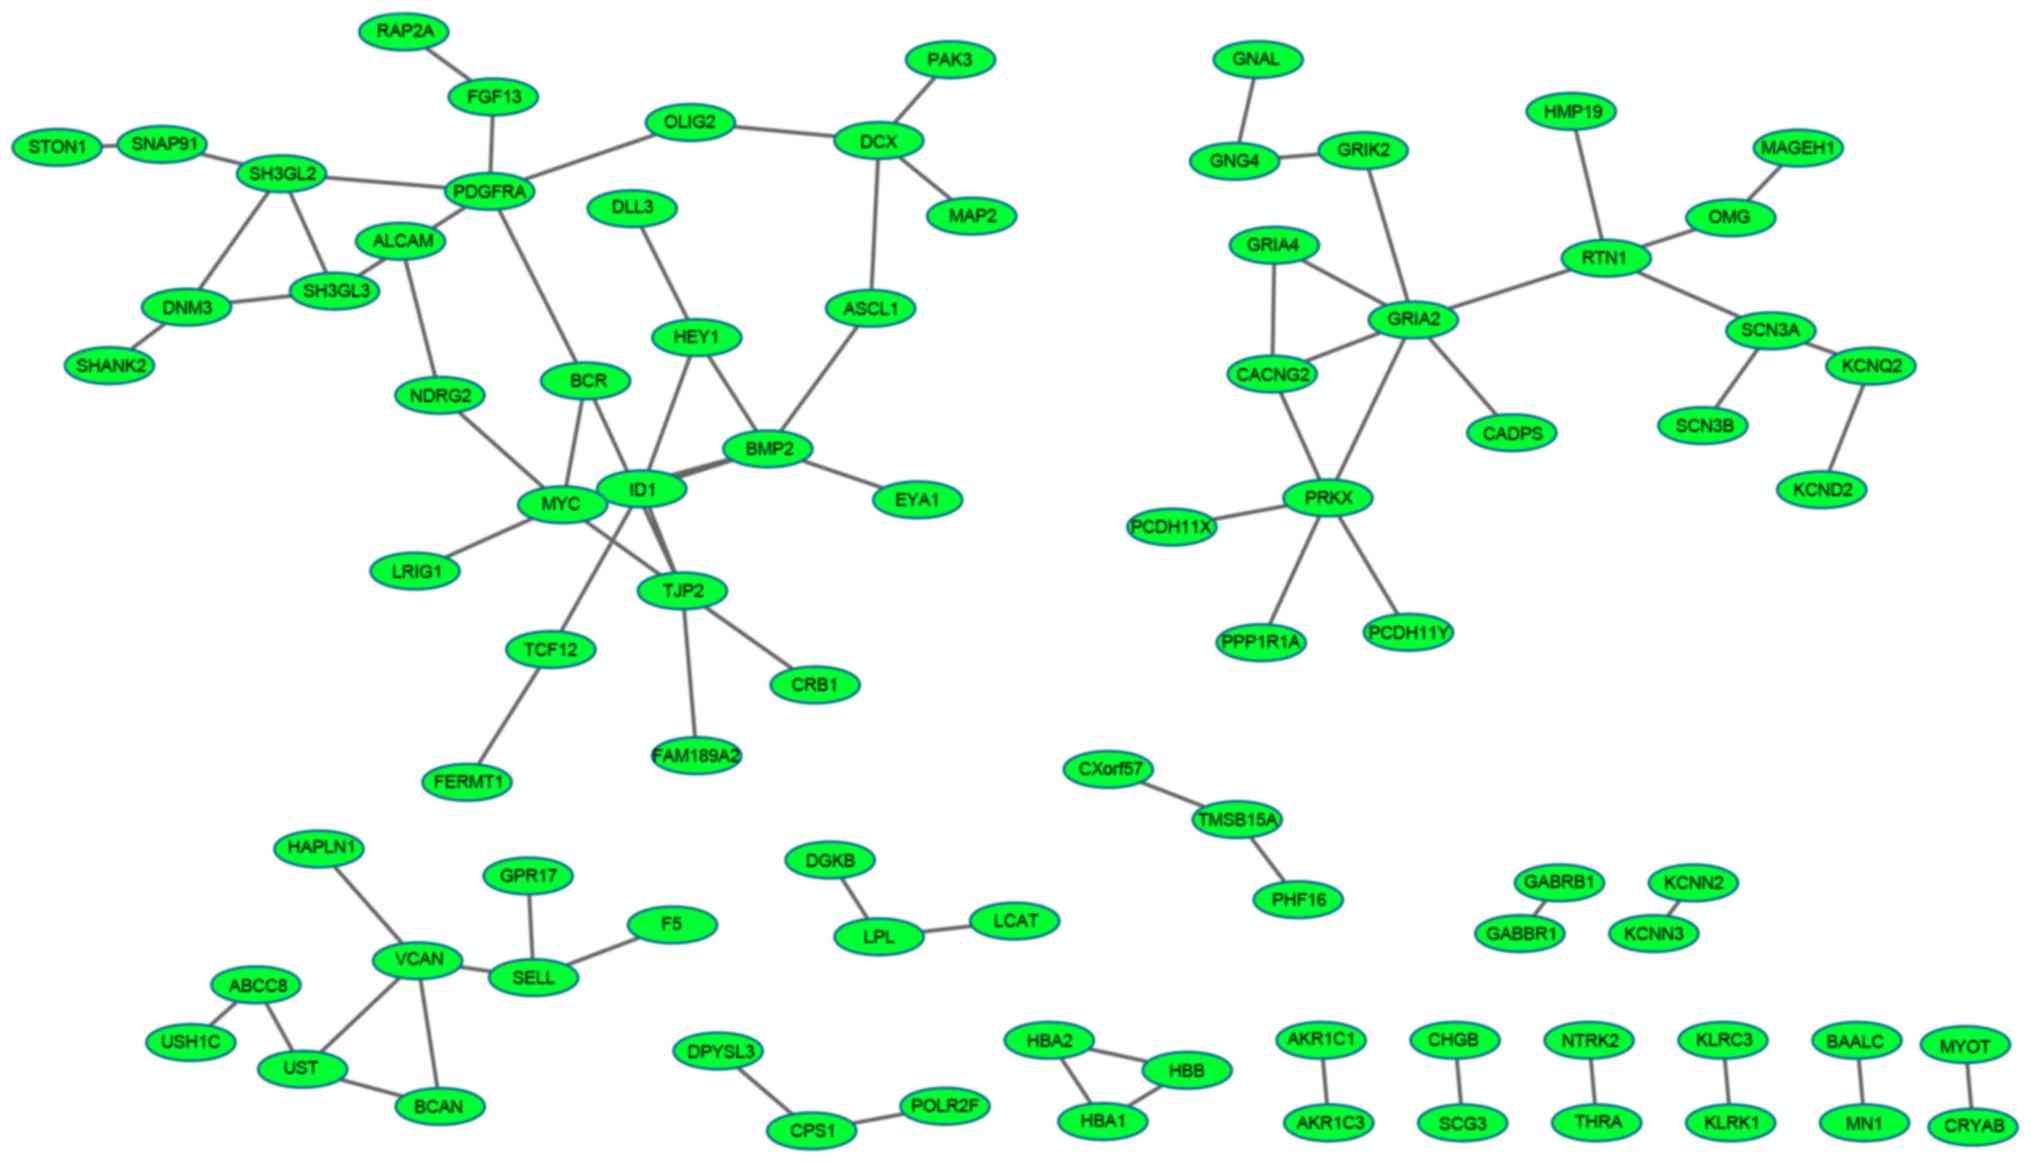
of 85 nodes and 80 edges was obtained for the downregulated genes
(Fig. 2).
The top ten nodes with a high degree in the up and
downregulated PPI networks are listed in Table III. The top five nodes in the
network of upregulated genes were collagen type III α1 (COL3A1),
collagen type V α2 (COL5A2), TIMP metallopeptidase inhibitor 1
(TIMP1), collagen type V α1 (COL5A1) and vimentin (VIM). In the
network of downregulated genes, the top six nodes were glutamate
receptor ionotropic AMPA2 (GRIA2), bone morphogenetic protein 2
(BMP2), protein kinase X-linked (PRKX), v-myc avian
myelocytomatosis viral oncogene homolog (MYC), tight junction
protein 2 (TJP2) and platelet-derived growth factor receptor α
polypeptide (PDGFRA).
| Table III.Top 10 nodes with a high degree in
the up and downregulated protein-protein interaction network. |
Table III.
Top 10 nodes with a high degree in
the up and downregulated protein-protein interaction network.
| Gene | Degree |
|---|
| Upregulated |
|
|
COL3A1 | 22 |
|
COL5A2 | 18 |
|
TIMP1 | 16 |
|
COL5A1 | 16 |
|
VIM | 15 |
|
ANXA2 | 13 |
|
S100A6 | 12 |
|
ANXA1 | 12 |
|
COL4A1 | 11 |
|
CXCL10 | 11 |
| Downregulated |
|
|
GRIA2 | 6 |
|
BMP2 | 5 |
|
PRKX | 5 |
|
MYC | 5 |
|
TJP2 | 5 |
|
PDGFRA | 5 |
|
DCX | 4 |
|
SH3GL2 | 4 |
|
RTN1 | 4 |
|
ID1 | 4 |
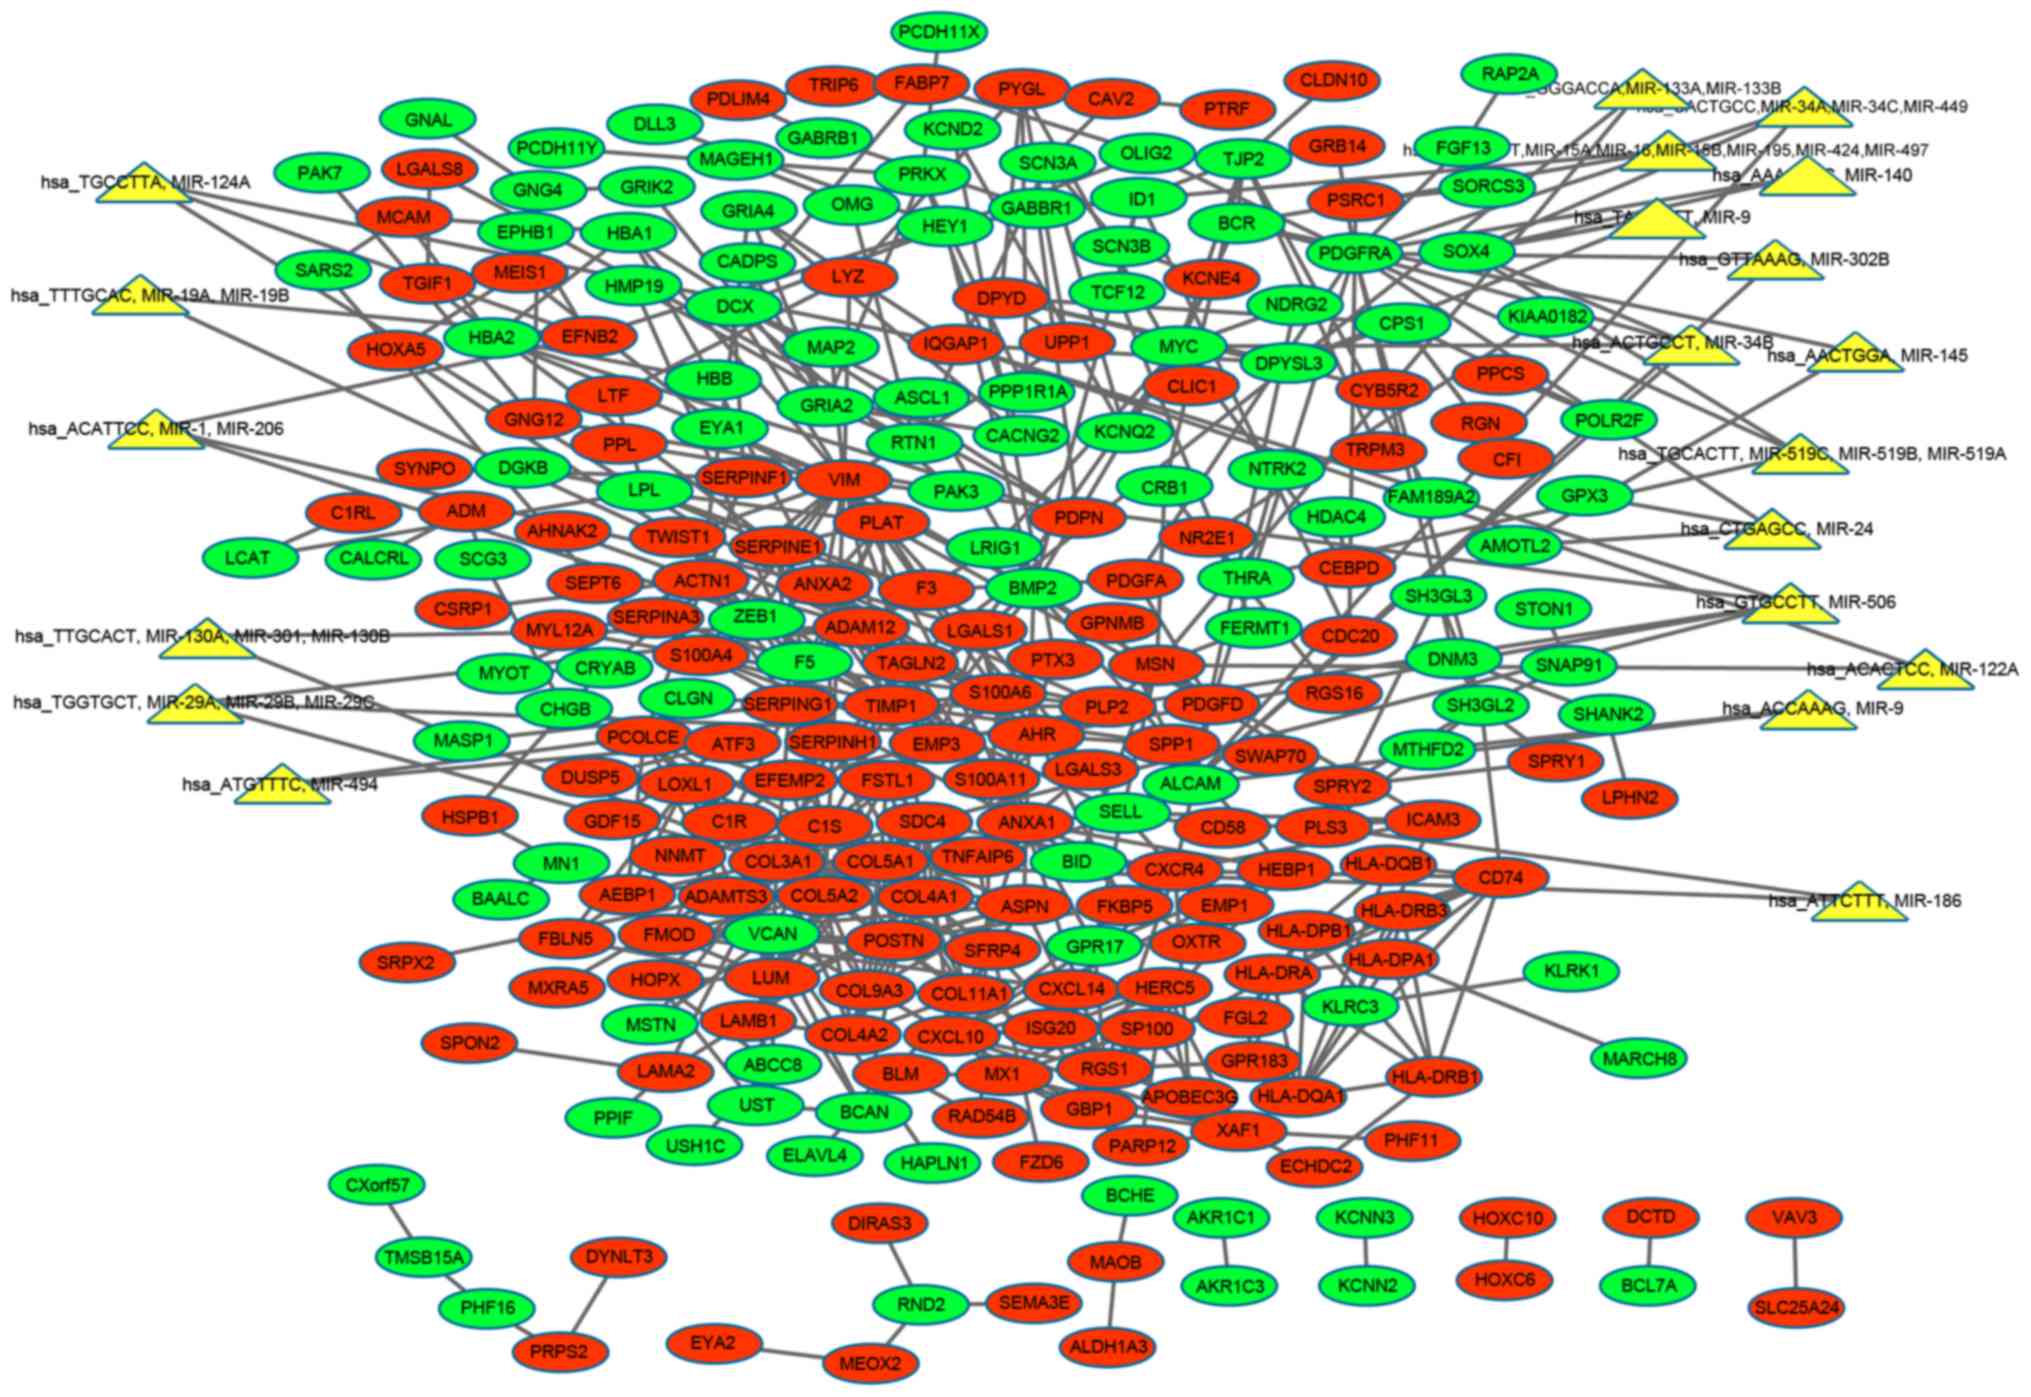
miRNA prediction and regulatory
network analysis
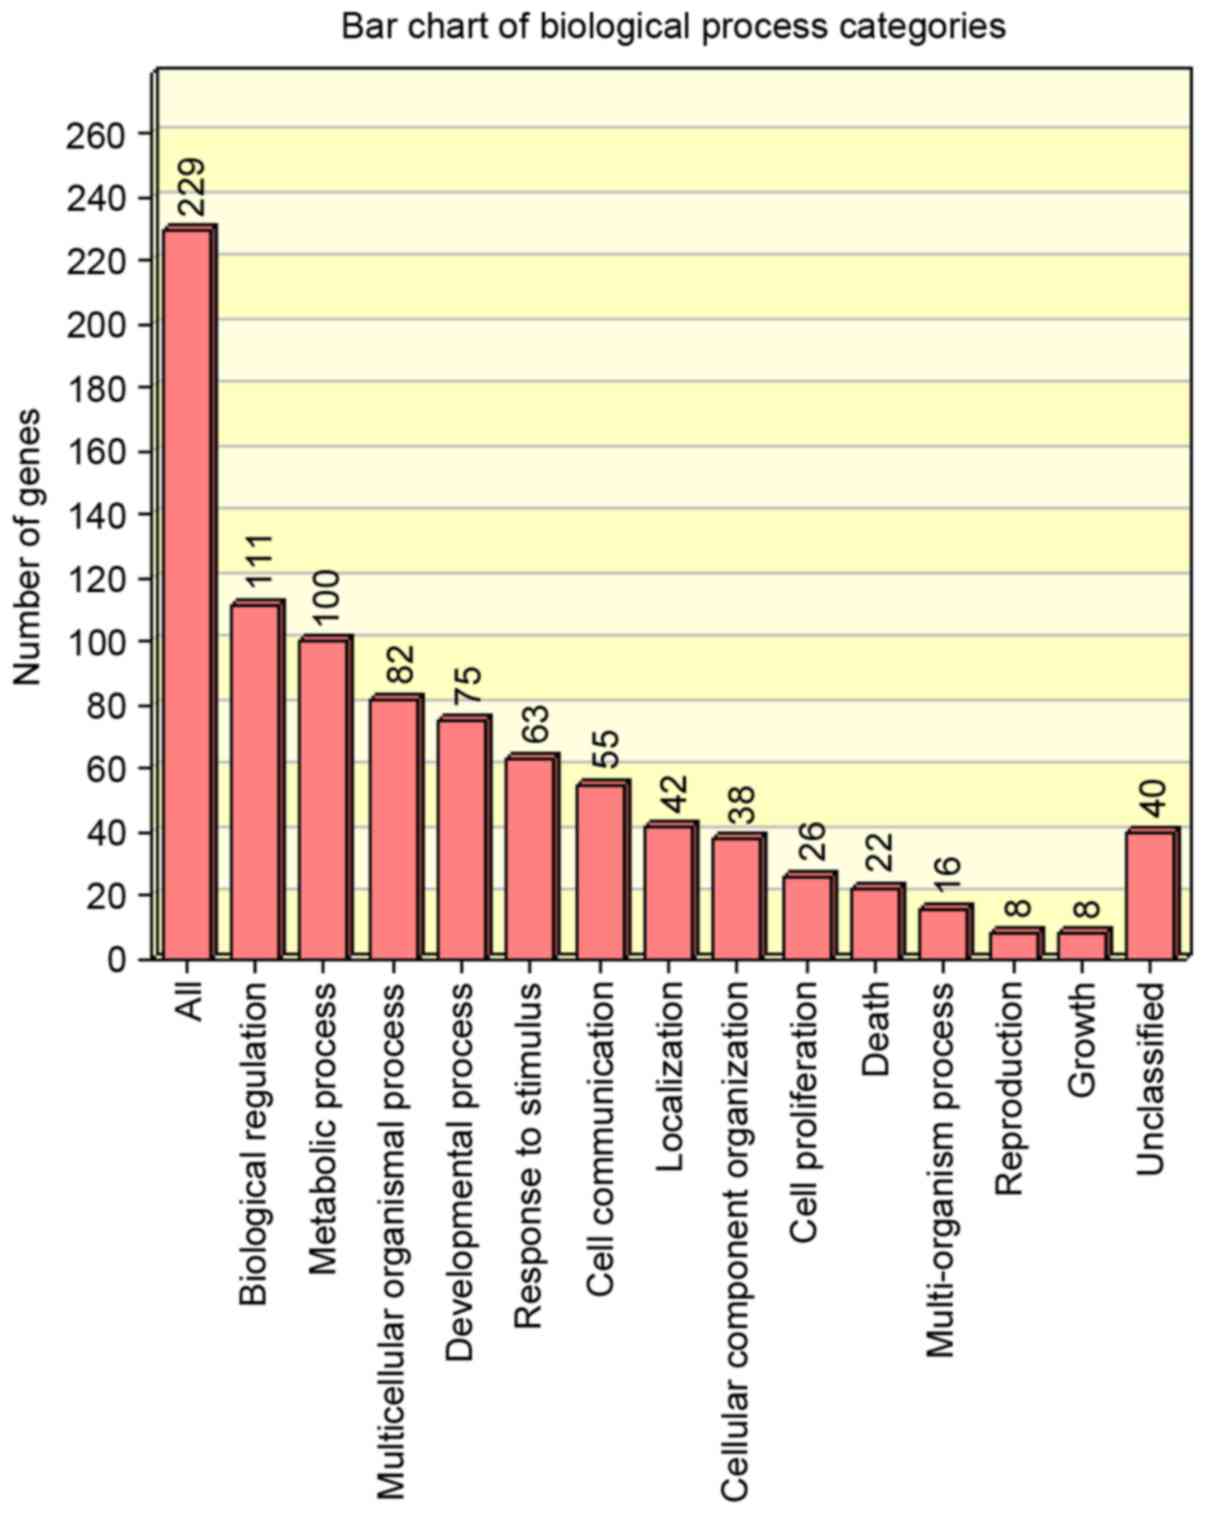
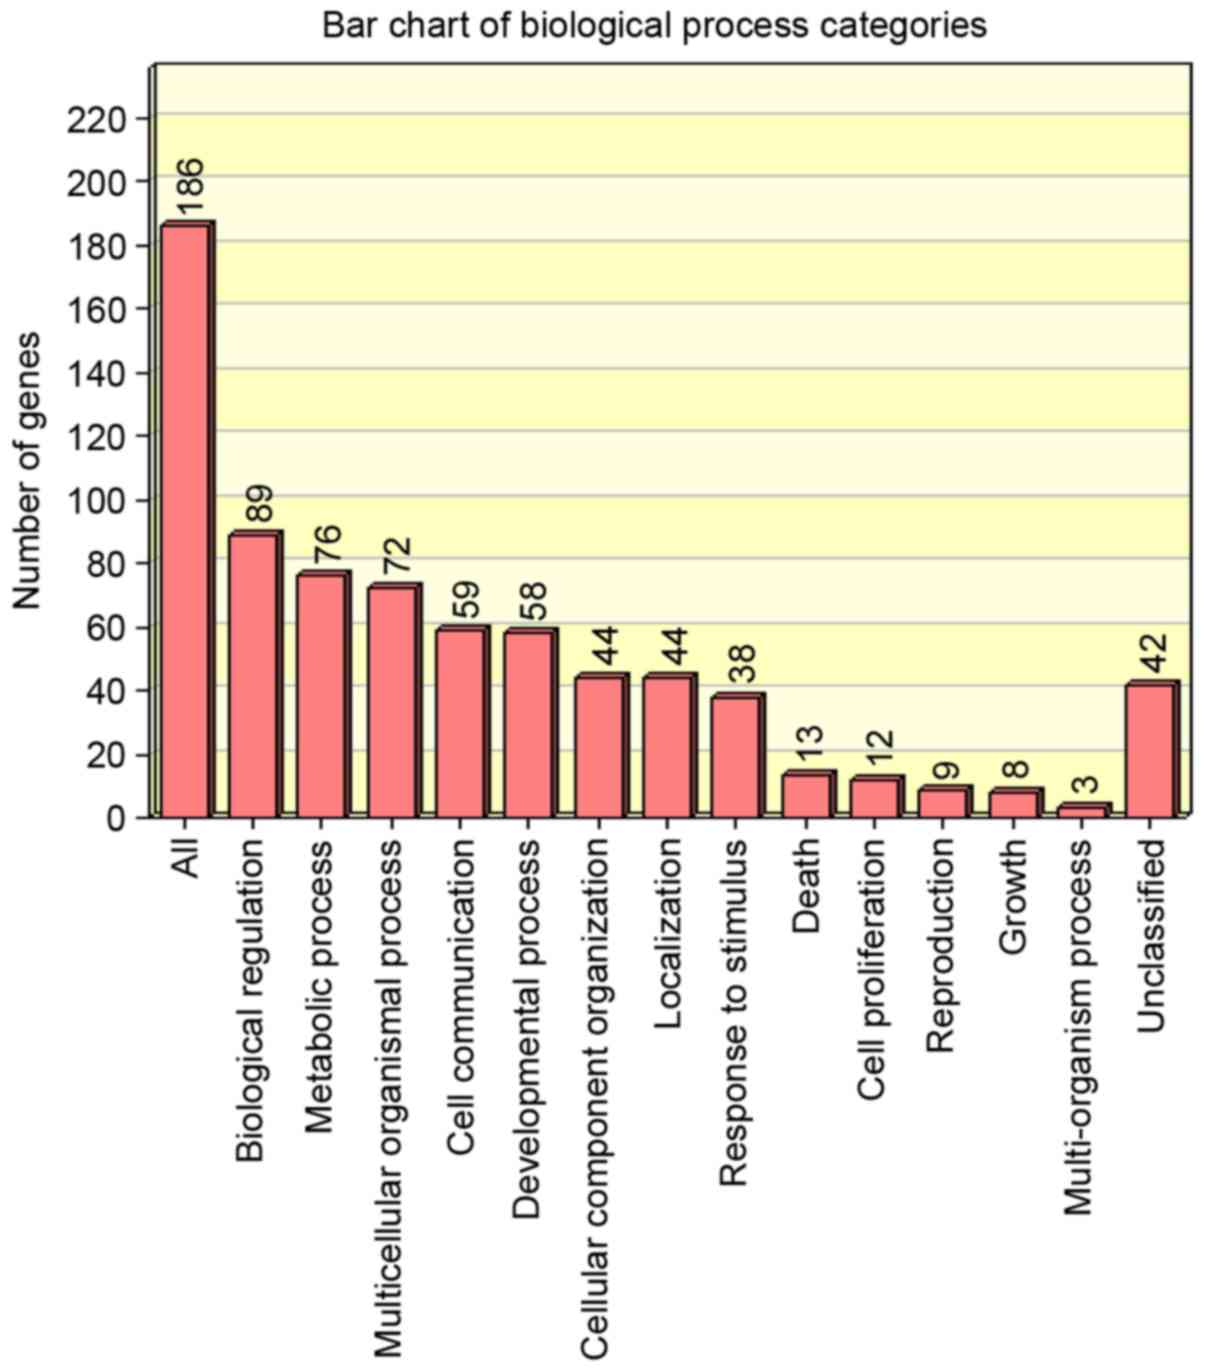
The distribution of upregulated and downregulated
genes in biological processes was analysed using WebGestalt
(Figs. 3 and 4, respectively). The regulatory miRNAs of
DEGs were also predicted (Table
IV). Among these predicted miRNAs, miRNA-506 and miR-34b
targeted the most DEGs in the up- and downregulated regulatory
networks. In the upregulated regulatory network, miRNA-506
(miR-506) regulated five upregulated genes: VIM, aryl hydrocarbon
receptor, proteolipid protein 2, IQ motif-containing GTPase
activating protein 1 (IQGAP1) and syndecan 4. In the downregulated
regulatory network, miR-34b regulated four downregulated genes: Sex
determining region Y-box 4, PDGFRA, activated leukocyte cell
adhesion molecule (ALCAM) and MYC. All predicted miRNAs with their
target DEG pairs are presented in the regulatory network (Fig. 5).
| Table IV.Predicted miRs targeting the
differentially expressed genes. |
Table IV.
Predicted miRs targeting the
differentially expressed genes.
| A, Upregulated
genes |
|---|
|
|---|
| miR | Gene | Statistics |
|---|
| hsa_TTGCACT,
miR-130a, miR-301, miR-130b | 2 | C=52; O=2; E=6.41;
R=0.31; raw P=1.0000; adj P=1.0000 |
| hsa_TTTGCAC,
miR-19a, miR-19b | 2 | C=71; O=2; E=8.76;
R=0.23; raw P=1.0000; adj P=1.0000 |
| hsa_TGGTGCT,
miR-29a, miR-29b, miR-29c | 3 | C=59; O=3; E=7.28;
R=0.41; raw P=1.0000; adj P=1.0000 |
| hsa_TGCCTTA,
miR-124a | 3 | C=84; O=3; E=10.36;
R=0.29; raw P=1.0000; adj P=1.0000 |
| hsa_GTGCCTT,
miR-506 | 5 | C=105; O=5;
E=12.95; R=0.39; raw P=1.0000; adj P=1.0000 |
| hsa_ACATTCC, miR-1,
miR-206 | 3 | C=61; O=3; E=7.52;
R=0.40; raw P=1.0000; adj P=1.0000 |
| hsa_ACACTCC,
miR-122a | 2 | C=13; O=2; E=1.60;
R=1.25; raw P=0.4895; adj P=1.0000 |
| hsa_ATGTTTC,
miR-494 | 2 | C=28; O=2; E=3.45;
R=0.58; raw P=1.0000; adj P=1.0000 |
| hsa_GGGACCA,
miR-133a, miR-133b | 2 | C=37; O=2; E=4.56;
R=0.44; raw P=1.0000; adj P=1.0000 |
| hsa_ATTCTTT,
miR-186 | 2 | C=45; O=2; E=5.55;
R=0.36; raw P=1.0000; adj P=1.0000 |
|
| B, Downregulated
genes |
|
| miR | Gene | Statistics |
|
| hsa_ACTGCCT,
miR-34b | 4 | C=41; O=4; E=4.11;
R=0.97; raw P=1.0000; adj P=1.0000 |
| hsa_CACTGCC,
miR-34a, miR-34c, miR-449 | 3 | C=47; O=3; E=4.71;
R=0.64; raw P=1.0000; adj P=1.0000 |
| hsa_AAACCAC,
miR-140 | 2 | C=25; O=2; E=2.50;
R=0.80; raw P=1.0000; adj P=1.0000 |
| hsa_TAGCTTT,
miR-9 | 2 | C=31; O=2; E=3.11;
R=0.64; raw P=1.0000; adj P=1.0000 |
| hsa_TGCACTT,
miR-519c, miR-519b, miR-519A | 3 | C=54; O=3; E=5.41;
R=0.55; raw P=1.0000; adj P=1.0000 |
| hsa_GTTAAAG,
miR-302b | 2 | C=9; O=2; E=0.90;
R=2.22; raw P=0.2255; adj P=1.0000 |
| hsa_AACTGGA,
miR-145 | 2 | C=33; O=2; E=3.31;
R=0.61; raw P=1.0000; adj P=1.0000 |
| hsa_ACCAAAG,
miR-9 | 2 | C=67; O=2; E=6.71;
R=0.30; raw P=1.0000; adj P=1.0000 |
| hsa_TGCTGCT,
miR-15a, miR-16, miR-15b, miR-195, miR-424, miR-497 | 2 | C=86; O=2; E=8.61;
R=0.23; raw P=1.0000; adj P=1.0000 |
| hsa_CTGAGCC,
miR-24 | 3 | C=35; O=3; E=3.51;
R=0.86; raw P=1.0000; adj P=1.0000 |
Discussion
In the present study, a total of 439 DEGs were
identified, including 241 upregulated and 198 downregulated genes.
Functional enrichment analysis predicted that upregulated genes
were associated with extracellular matrix organisation, defence
response, immune response, collagen fibril organisation and
regulation of cell motion, whereas downregulated genes were
associated with cell adhesion, sensory organ development,
regulation of system process, neuron differentiation and membrane
organisation. These findings are consistent with previous reports
(23–26). Ulrich et al (27) pointed out that the mechanical
rigidity of the extracellular matrix regulates the structure,
motility and proliferation of glioma cells. Cell motion and cell
adhesion were closely associated with the invasion of glioma
cells.
In the present study, a PPI network containing 134
nodes and 314 edges was constructed for upregulated genes, whereas
a PPI network consisting of 85 nodes and 80 edges was also obtained
for downregulated genes. The top five nodes in the network of
upregulated genes were COL3A1, COL5A2, TIMP1, COL5A1 and VIM.
TIMP1, as an inhibitor of matrix metalloproteinases, can promote
cell proliferation and may have anti-apoptotic function (28). Groft et al (29) reported the differential expression
and localisation of TIMP-1 and TIMP-4 in human gliomas and
suggested that they may contribute to the pathophysiology of human
malignant gliomas. In addition, Aaberg-Jessen et al
(30) demonstrated that low
expression of tissue inhibitor of TIMP-1 in glioblastoma predicts
longer patient survival. Serum TIMP-1 level is also regarded as an
independent predictor of survival (31). VIM is a member of the intermediate
filament family and functions as an organiser of numerous critical
proteins involved in cell adhesion, migration and cell signalling
(32). Overexpression of VIM has
been reported in central nervous system tumours and it strongly
correlates with accelerated tumour growth, invasion and poor
prognosis (33). The top six nodes
in the network of downregulated genes in the present study were
GRIA2, BMP2, PRKX, MYC, TJP2 and PDGFRA. BMP2 is involved in cell
differentiation. Deregulation of the BMP developmental pathway in
glioblastoma-initiating cells contributes to their tumorigenicity
both by desensitising cells to normal differentiation cues and
converting otherwise cytostatic signals to pro-proliferative ones
(34). Liu et al (35) indicated that BMP2 expression levels
may be a potent tool for assessing the clinical prognosis of glioma
patients. In addition, Wang et al (36) reported that c-MYC is required for
the maintenance of glioma cancer stem cells. Furthermore, Jensen
et al (37) demonstrated
that astroglial c-MYC overexpression predisposes mice to primary
malignant gliomas. Overexpression of PDGFRA has also been reported
in gliomas (38,39). Taken these findings together,
TIMP-1, VIM, BMP2, MYC and PDGFRA may be associated with the
development of glioma.
miRNAs regulating upregulated and downregulated
genes identified in the present study were predicted using
WebGestalt, including miR-124a and miR-34a. miR-124a can inhibit
the proliferation of glioblastoma multiforme cells and induce the
differentiation of brain tumour stem cells (40). It is frequently downregulated in
glioblastoma and is involved in migration and invasion (41). IQGAP1 is one of its target genes,
which has been implicated in the regulation of E-cadherin-mediated
cell-cell adhesion (42,43). In addition, miR-34a can inhibit
glioblastoma growth by targeting multiple oncogenes (44). In the present study, we predicted
that miR-34a regulates PDGFRA and ALCAM, which were downregulated
in CIMP+ samples. This is noteworthy because PDGFRA is
involved in tumour progression (45) and its suppression by targeting
miR-34a could contribute to tumorigenesis in pro-neural malignant
gliomas (46), whereas ALCAM is
associated with cell adhesion and cell migration (47). Therefore, it is speculated that
these miRNAs may be useful for treating gliomas but further
confirmation is needed.
Although we identified several DEGs that were
important to define a distinct subgroup of glioma and understand
the progression of glioma CIMP, there are certain limitations in
the present study. The association between DEGs and methylation
level in the different CIMPs was not investigated due to the lack
of information on DEGs methylation levels in the dataset used.
Additionally, experimental or data verification for the DEGs
identified in glioma CIMP was not conducted, and in future, samples
should be divided into different CIMPs based on methylation
analysis to conduct the experimental validation.
In conclusion, several key genes were identified in
glioma CIMP, some of which (TIMP1, VIM, BMP2, c-MYC and PDGFRA) may
be viewed as potential markers or therapeutic targets for gliomas.
In addition, relevant miRNAs, such as miR-124a and miR-34a that
regulate genes involved in gliomas were also detected. These
findings may provide helpful guidance to reveal molecular
mechanisms underlying glioma CIMP.
Glossary
Abbreviations
Abbreviations:
|
CIMP
|
CpG island methylator phenotype
|
|
DEGs
|
differentially expressed genes
|
|
PPI
|
protein-protein interaction
|
|
MGMT
|
O6-methylguanine-DNA
methyltransferase
|
|
PDGF
|
platelet-derived growth factor
|
|
GO
|
Gene Ontology
|
|
COL3A1
|
collagen type III α1
|
|
COL5A2
|
collagen type V α2
|
|
TIMP1
|
TIMP metallopeptidase inhibitor 1
|
|
COL5A1
|
collagen type V α1
|
|
VIM
|
vimentin
|
|
GRIA2
|
glutamate receptor ionotropic
AMPA2
|
|
BMP2
|
bone morphogenetic protein 2
|
|
PRKX
|
protein kinase X-linked
|
|
MYC
|
v-myc avian myelocytomatosis viral
oncogene homolog
|
|
TJP2
|
tight junction protein 2
|
|
PDGFRA
|
platelet-derived growth factor
receptor α polypeptide
|
|
IQGAP1
|
IQ motif-containing GTPase activating
protein 1
|
|
ALCAM
|
activated leukocyte cell adhesion
molecule
|
References
|
1
|
Kim TY, Zhong S, Fields CR, Kim JH and
Robertson KD: Epigenomic profiling reveals novel and frequent
targets of aberrant DNA methylation-mediated silencing in malignant
glioma. Cancer Res. 66:7490–7501. 2006. View Article : Google Scholar : PubMed/NCBI
|
|
2
|
Pan D, Wei X, Liu M, Feng S, Tian X, Feng
X and Zhang X: Adenovirus mediated transfer of p53, GM-CSF and B7-1
suppresses growth and enhances immunogenicity of glioma cells.
Neurol Res. 32:502–509. 2010. View Article : Google Scholar : PubMed/NCBI
|
|
3
|
Christensen BC, Smith AA, Zheng S,
Koestler DC, Houseman EA, Marsit CJ, Wiemels JL, Nelson HH, Karagas
MR, Wrensch MR, et al: DNA methylation, isocitrate dehydrogenase
mutation, and survival in glioma. J Natl Cancer Inst. 103:143–153.
2011. View Article : Google Scholar : PubMed/NCBI
|
|
4
|
Noushmehr H, Weisenberger DJ, Diefes K,
Phillips HS, Pujara K, Berman BP, Pan F, Pelloski CE, Sulman EP,
Bhat KP, et al: Identification of a CpG island methylator phenotype
that defines a distinct subgroup of glioma. Cancer Cell.
17:510–522. 2010. View Article : Google Scholar : PubMed/NCBI
|
|
5
|
Fang F, Turcan S, Rimner A, Kaufman A,
Giri D, Morris LG, Shen R, Seshan V, Mo Q, Heguy A, et al: Breast
cancer methylomes establish an epigenomic foundation for
metastasis. Sci Transl Med. 3:75ra252011. View Article : Google Scholar : PubMed/NCBI
|
|
6
|
Cheng YW, Pincas H, Bacolod MD, Schemmann
G, Giardina SF, Huang J, Barral S, Idrees K, Khan SA, Zeng Z, et
al: CpG island methylator phenotype associates with low-degree
chromosomal abnormalities in colorectal cancer. Clin Cancer Res.
14:6005–6013. 2008. View Article : Google Scholar : PubMed/NCBI
|
|
7
|
Weller M, Stupp R, Reifenberger G, Brandes
AA, van den Bent MJ, Wick W and Hegi ME: MGMT promoter methylation
in malignant gliomas: Ready for personalized medicine? Nat Rev
Neurol. 6:39–51. 2010. View Article : Google Scholar : PubMed/NCBI
|
|
8
|
Hegi ME, Liu L, Herman JG, Stupp R, Wick
W, Weller M, Mehta MP and Gilbert MR: Correlation of
O6-methylguanine methyltransferase (MGMT) promoter
methylation with clinical outcomes in glioblastoma and clinical
strategies to modulate MGMT activity. J Clin Oncol. 26:4189–4199.
2008. View Article : Google Scholar : PubMed/NCBI
|
|
9
|
Bruna A, Darken RS, Rojo F, Ocaña A,
Peñuelas S, Arias A, Paris R, Tortosa A, Mora J, Baselga J and
Seoane J: High TGFbeta-Smad activity confers poor prognosis in
glioma patients and promotes cell proliferation depending on the
methylation of the PDGF-B gene. Cancer Cell. 11:147–160. 2007.
View Article : Google Scholar : PubMed/NCBI
|
|
10
|
Wiencke JK, Zheng S, Jelluma N, Tihan T,
Vandenberg S, Tamgüney T, Baumber R, Parsons R, Lamborn KR, Berger
MS, et al: Methylation of the PTEN promoter defines low-grade
gliomas and secondary glioblastoma. Neuro Oncol. 9:271–279. 2007.
View Article : Google Scholar : PubMed/NCBI
|
|
11
|
Mueller W, Nutt CL, Ehrich M,
Riemenschneider MJ, Von Deimling A, Van Den Boom D and Louis DN:
Downregulation of RUNX3 and TES by hypermethylation in
glioblastoma. Oncogene. 26:583–593. 2007. View Article : Google Scholar : PubMed/NCBI
|
|
12
|
Yi JM, Tsai HC, Glöckner SC, Lin S, Ohm
JE, Easwaran H, James CD, Costello JF, Riggins G, Eberhart CG, et
al: Abnormal DNA methylation of CD133 in colorectal and
glioblastoma tumors. Cancer Res. 68:8094–8103. 2008. View Article : Google Scholar : PubMed/NCBI
|
|
13
|
Amatya VJ, Naumann U, Weller M and Ohgaki
H: TP53 promoter methylation in human gliomas. Acta Neuropathol.
110:178–184. 2005. View Article : Google Scholar : PubMed/NCBI
|
|
14
|
Turcan S, Rohle D, Goenka A, Walsh LA,
Fang F, Yilmaz E, Campos C, Fabius AW, Lu C, Ward PS, et al: IDH1
mutation is sufficient to establish the glioma hypermethylator
phenotype. Nature. 483:479–483. 2012. View Article : Google Scholar : PubMed/NCBI
|
|
15
|
Baysan M, Bozdag S, Cam MC, Kotliarova S,
Ahn S, Walling J, Killian JK, Stevenson H, Meltzer P and Fine HA:
G-cimp status prediction of glioblastoma samples using mRNA
expression data. PLoS One. 7:e478392012. View Article : Google Scholar : PubMed/NCBI
|
|
16
|
Diboun I, Wernisch L, Orengo CA and
Koltzenburg M: Microarray analysis after RNA amplification can
detect pronounced differences in gene expression using limma. BMC
Genomics. 7:2522006. View Article : Google Scholar : PubMed/NCBI
|
|
17
|
Gene Ontology Consortium, ; Blake JA,
Dolan M, Drabkin H, Hill DP, Li N, Sitnikov D, Bridges S, Burgess
S, Buza T, et al: Gene Ontology annotations and resources. Nucleic
Acids Res. 41(Database issue): D530–D535. 2013.PubMed/NCBI
|
|
18
|
Kanehisa M and Goto S: KEGG: Kyoto
Encyclopedia of Genes and Genomes. Nucleic Acids Res. 28:27–30.
2000. View Article : Google Scholar : PubMed/NCBI
|
|
19
|
Huang DW, Sherman BT, Tan Q, Collins JR,
Alvord WG, Roayaei J, Stephens R, Baseler MW, Lane HC and Lempicki
RA: The DAVID gene functional classification tool: A novel
biological module-centric algorithm to functionally analyze large
gene lists. Genome Biol. 8:R1832007. View Article : Google Scholar : PubMed/NCBI
|
|
20
|
Szklarczyk D, Franceschini A, Kuhn M,
Simonovic M, Roth A, Minguez P, Doerks T, Stark M, Muller J, Bork
P, et al: The STRING database in 2011: Functional interaction
networks of proteins, globally integrated and scored. Nucleic Acids
Res. 39(Database issue): D561–D568. 2011. View Article : Google Scholar : PubMed/NCBI
|
|
21
|
Smoot ME, Ono K, Ruscheinski J, Wang PL
and Ideker T: Cytoscape 2.8: New features for data integration and
network visualization. Bioinformatics. 27:431–432. 2011. View Article : Google Scholar : PubMed/NCBI
|
|
22
|
Zhang B, Kirov S and Snoddy J: WebGestalt:
An integrated system for exploring gene sets in various biological
contexts. Nucleic Acids Res. 33(Web server issue): W741–W748. 2005.
View Article : Google Scholar : PubMed/NCBI
|
|
23
|
Yao ZQ and Lu YC: Research on molecular
mechanism of human glioma and its clinical application. Chin J
Cancer Biother. 15:90–94. 2008.
|
|
24
|
Huse JT and Holland EC: Targeting brain
cancer: Advances in the molecular pathology of malignant glioma and
medulloblastoma. Nat Rev Cancer. 10:319–331. 2010. View Article : Google Scholar : PubMed/NCBI
|
|
25
|
Clubb BH and Shivers RR: Extracellular
matrix regulates microfilament and vinculin organization in
C6-glioma cells. Acta Neuropathol. 91:31–40. 1996. View Article : Google Scholar : PubMed/NCBI
|
|
26
|
Bauke AC, Sasse S, Matzat T and Klämbt C:
A transcriptional network controlling glial development in the
Drosophila visual system. Development. 142:2184–2193. 2015.
View Article : Google Scholar : PubMed/NCBI
|
|
27
|
Ulrich TA, de Juan Pardo EM and Kumar S:
The mechanical rigidity of the extracellular matrix regulates the
structure, motility, and proliferation of glioma cells. Cancer Res.
69:4167–4174. 2009. View Article : Google Scholar : PubMed/NCBI
|
|
28
|
Lee SJ, Yoo HJ, Bae YS, Kim HJ and Lee ST:
TIMP-1 inhibits apoptosis in breast carcinoma cells via a pathway
involving pertussis toxin-sensitive G protein and c-Src. Biochem
Biophys Res Commun. 312:1196–1201. 2003. View Article : Google Scholar : PubMed/NCBI
|
|
29
|
Groft LL, Muzik H, Rewcastle NB, Johnston
RN, Knäuper V, Lafleur MA, Forsyth PA and Edwards DR: Differential
expression and localization of TIMP-1 and TIMP-4 in human gliomas.
Br J Cancer. 85:55–63. 2001. View Article : Google Scholar : PubMed/NCBI
|
|
30
|
Aaberg-Jessen C, Christensen K, Offenberg
H, Bartels A, Dreehsen T, Hansen S, Schrøder HD, Brünner N and
Kristensen BW: Low expression of tissue inhibitor of
metalloproteinases-1 (TIMP-1) in glioblastoma predicts longer
patient survival. J Neurooncol. 95:117–128. 2009. View Article : Google Scholar : PubMed/NCBI
|
|
31
|
Crocker M, Ashley S, Giddings I, Petrik V,
Hardcastle A, Aherne W, Pearson A, Bell BA, Zacharoulis S and
Papadopoulos MC: Serum angiogenic profile of patients with
glioblastoma identifies distinct tumor subtypes and shows that
TIMP-1 is a prognostic factor. Neuro Oncol. 13:99–108. 2011.
View Article : Google Scholar : PubMed/NCBI
|
|
32
|
Yamasaki T, Seki N, Yamada Y, Yoshino H,
Hidaka H, Chiyomaru T, Nohata N, Kinoshita T, Nakagawa M and
Enokida H: Tumor suppressive microRNA-138 contributes to cell
migration and invasion through its targeting of vimentin in renal
cell carcinoma. Int J Oncol. 41:805–817. 2012. View Article : Google Scholar : PubMed/NCBI
|
|
33
|
Satelli A and Li S: Vimentin in cancer and
its potential as a molecular target for cancer therapy. Cell Mol
Life Sci. 68:3033–3046. 2011. View Article : Google Scholar : PubMed/NCBI
|
|
34
|
Lee J, Son MJ, Woolard K, Donin NM, Li A,
Cheng CH, Kotliarova S, Kotliarov Y, Walling J, Ahn S, et al:
Epigenetic-mediated dysfunction of the bone morphogenetic protein
pathway inhibits differentiation of glioblastoma-initiating cells.
Cancer Cell. 13:69–80. 2008. View Article : Google Scholar : PubMed/NCBI
|
|
35
|
Liu C, Tian G, Tu Y, Fu J, Lan C and Wu N:
Expression pattern and clinical prognostic relevance of bone
morphogenetic protein-2 in human gliomas. Jpn J Clin Oncol.
39:625–631. 2009. View Article : Google Scholar : PubMed/NCBI
|
|
36
|
Wang J, Wang H, Li Z, Wu Q, Lathia JD,
McLendon RE, Hjelmeland AB and Rich JN: c-Myc is required for
maintenance of glioma cancer stem cells. PLoS One. 3:e37692008.
View Article : Google Scholar : PubMed/NCBI
|
|
37
|
Jensen NA, Pedersen KM, Lihme F, Rask L,
Nielsen JV, Rasmussen TE and Mitchelmore C: Astroglial c-Myc
overexpression predisposes mice to primary malignant gliomas. J
Biol Chem. 278:8300–8308. 2003. View Article : Google Scholar : PubMed/NCBI
|
|
38
|
Puputti M, Tynninen O, Sihto H, Blom T,
Mäenpää H, Isola J, Paetau A, Joensuu H and Nupponen NN:
Amplification of KIT PDGFRA, VEGFR2, and EGFR in gliomas. Mol
Cancer Res. 4:927–934. 2006. View Article : Google Scholar : PubMed/NCBI
|
|
39
|
Giannini C, Sarkaria JN, Saito A, Uhm JH,
Galanis E, Carlson BL, Schroeder MA and James CD: Patient tumor
EGFR and PDGFRA gene amplifications retained in an invasive
intracranial xenograft model of glioblastoma multiforme. Neuro
Oncol. 7:164–176. 2005. View Article : Google Scholar : PubMed/NCBI
|
|
40
|
Silber J, Lim DA, Petritsch C, Persson AI,
Maunakea AK, Yu M, Vandenberg SR, Ginzinger DG, James CD, Costello
JF, et al: miR-124 and miR-137 inhibit proliferation of
glioblastoma multiforme cells and induce differentiation of brain
tumor stem cells. BMC Med. 6:142008. View Article : Google Scholar : PubMed/NCBI
|
|
41
|
Fowler A, Thomson D, Giles K, Maleki S,
Mreich E, Wheeler H, Leedman P, Biggs M, Cook R, Little N, et al:
miR-124a is frequently down-regulated in glioblastoma and is
involved in migration and invasion. Eur J Cancer. 47:953–963. 2011.
View Article : Google Scholar : PubMed/NCBI
|
|
42
|
Kuroda S, Fukata M, Nakagawa M, Fujii K,
Nakamura T, Ookubo T, Izawa I, Nagase T, Nomura N, Tani H, et al:
Role of IQGAP1, a target of the small GTPases Cdc42 and Rac1, in
regulation of E-cadherin-mediated cell-cell adhesion. Science.
281:832–835. 1998. View Article : Google Scholar : PubMed/NCBI
|
|
43
|
Noritake J, Watanabe T, Sato K, Wang S and
Kaibuchi K: IQGAP1: A key regulator of adhesion and migration. J
Cell Sci. 118:2085–2092. 2005. View Article : Google Scholar : PubMed/NCBI
|
|
44
|
Li Y, Guessous F, Zhang Y, Dipierro C,
Kefas B, Johnson E, Marcinkiewicz L, Jiang J, Yang Y, Schmittgen
TD, et al: MicroRNA-34a inhibits glioblastoma growth by targeting
multiple oncogenes. Cancer Res. 69:7569–7576. 2009. View Article : Google Scholar : PubMed/NCBI
|
|
45
|
Heinrich MC, Corless CL, Duensing A,
Mcgreevey L, Chen CJ, Joseph N, Singer S, Griffith DJ, Haley A,
Town A, et al: PDGFRA activating mutations in gastrointestinal
stromal tumors. Science. 299:708–710. 2003. View Article : Google Scholar : PubMed/NCBI
|
|
46
|
Silber J, Jacobsen A, Ozawa T, Harinath G,
Holland EC, Sander C and Huse JT: Abstract B15: Repression of
PDGFRA-targeting miR-34a promotes tumorigenesis in proneural
malignant gliomas. Cancer Res. 72 Suppl 2:B152012. View Article : Google Scholar
|
|
47
|
Swart GW: Activated leukocyte cell
adhesion molecule (CD166/ALCAM): Developmental and mechanistic
aspects of cell clustering and cell migration. Eur J Cell Biol.
81:313–321. 2002. View Article : Google Scholar : PubMed/NCBI
|