Introduction
Vitiligo is an acquired autoimmune disease
characterized by primary, localized, or generalized white spots on
the skin and mucosae due to the destruction of epidermal
melanocytes. Approximately 0.5–2% of the global population is
affected by vitiligo (1), and the
incidence of this disease in China is 0.1–2.7% (2). In the progressive stage of vitiligo,
the emergence of new lesions or the enlargement of original lesions
occurs from 6 weeks to 1 year, and the stable stage of the disease
is reached only when lesions have been stable for more than 1 year
or with spontaneous pigment regeneration. Vitiligo has a major
impact on patient's quality of life. Autoimmunity, neural
dysregulation, melanin self-destruction, or oxidative stress has
been speculated to be involved in the pathogenesis of the disease
(3). However, the true causes of
damage to melanocytes are unclear.
Diagnosis of vitiligo primarily depends on clinical
manifestation, and rarely on histopathological changes. So far,
there have been no definite biomarkers for diagnosis, evaluation of
disease progression, treatment response or prediction of prognosis.
Infiltration by CD8+ T cells in the margin of lesions is
suggestive of active vitiligo (4).
Elevation of serum levels of chemokine ligands CXCL9 and CXCL10
were noted in both progressive and stable vitiligo (SV), especially
in the former (5). IFN-γ and TGF-β
were demonstrated to promote T-cell recruitment to the epidermis
where melanocytes destruction may occur (6). Serum levels of IL-17 and oxidative
stress products were claimed to have a possible association with
progressive disease (7). However,
the above findings require validation in further studies.
The two-dimensional gel electrophoresis (2-DE)
followed by proteomic analysis is a useful tool for large-scale
screening of disease-related differentially expressed proteins. By
employing the technique, differentially expressed proteins in skin
malignancy such as melanoma (8)
and autoimmune disease such as systemic lupus erythematosus (SLE)
were identified, which helped to clarify the pathophysiology and
mechanism of the diseases (9). In
this study, we used 2-DE followed by mass spectrometry (MS) to
identify differentially expressed proteins in serum of both stages
of vitiligo and the controls. Some representative differentially
expressed proteins were further validated by western blotting. The
present study provides a plausible basis for identifying the serum
biomarker and studying the pathogenesis of vitiligo.
Materials and methods
General treatment
Sixty patients were recruited from the Department of
Dermatology, The First Hospital of China Medical University
(Shenyang, China) from July 2015 to March 2016. The clinical
diagnoses and classifications of all patients were consistent with
the clinical classification of the curative effects of vitiligo
formulated by the National Association of Integrative Medicine,
Department of Dermatology, Committee of Pigment Disease (10). Among the samples from 30 patients
representing each stage of vitiligo, 10 representatives of each
stage were analyzed by 2-DE-MS, and 20 representatives were
analyzed by western blotting. The average age in the progressive
stage was 35.33±17.24 years, and the average age in the stable
stage was 34.32±16.28 years. The control group consisted of 30
healthy volunteers with an average age of 35.43±15.26 years. There
were 13 man and 17 women in progressive vitiligo (PV), 12 man and
18 women in SV and 15 man and 15 women in the controls.
None of the patients were treated, and the controls
had no other medical conditions, as confirmed by a comprehensive
physical examination. This study was approved by the hospital
ethics committee (no. 201202013-02), and all patients and healthy
volunteers provided written informed consent for participation in
the study.
Reagents
Urea was purchased from Gibco; Thermo Fisher
Scientific, Inc. (Waltham, MA, USA). Propanesulfonic acid (CHAPS),
ethylenediaminetetraacetic acid (EDTA), and dithiothreitol (DTT)
were purchased from Promega Corporation (Madison, WI, USA).
Iodoacetamide (IAM) was purchased from Promega Corporation, and
sodium dodecyl sulfate (SDS), bromophenol blue, and a serum
high-abundance protein depletion kit (ProteoPrep Blue Albumin and
IgG Depletion kit) were purchased from Sigma-Aldrich; Merck KGaA
(Darmstadt, Germany). Ammonium persulfate was purchased from
Amresco, LLC (Solon, OH, USA), and acetonitrile (MS grade) was
purchased from Thermo Fisher Scientific, Inc.
Collection and preparation of
serum
A total of 5 ml of blood was collected from the
elbow vein of patients during the early morning under conditions of
limosis. The samples were incubated at 4°C for 2 h, centrifuged at
4°C and 3,000 × g for 10 min to separate the serum after
self-coagulation, and then stored at −80°C. Depletion of
high-abundance proteins was carried out using a serum
high-abundance protein depletion kit according to the
manufacturer's instructions.
2-DE and silver staining
For the first dimension isoelectric focusing gel,
120 µg of total protein was loaded onto IPG prefabricated strips
(24 cm, pH 4–7; Bio-Rad Laboratories, Hercules, CA, USA). An
isoelectric focusing instrument (GE Ettan IPGPhor3; GE Healthcare,
Chicago, IL, USA) was used with the following protocol: 300 V for
30 min, 700 V for 30 min, 1,500 V for 1.5 h, 9,000 V for 3 h, and
9,000 V for 4 h. This procedure was repeated three times for each
individual sample. For the second dimension, the isoelectric
focusing strip was used for SDS-polyacrylamide gel electrophoresis
(PAGE) as follows. The IPG strips were placed in equilibration
buffers I and II, shaken slowly for 15 min, and then transferred to
30% gels and subjected to SDS-PAGE with the following protocol: 2
W/gel for 45 min and 17 W/gel until the bromophenol blue ran to the
end of the gel (approximately 4.5 h). Silver staining was carried
out according to standard procedures. Samples were stored at 4°C in
1% glacial acetic acid.
Gel image acquisition and
analysis
The gel was scanned using a UMAX Powerlook 1100
scanner and analyzed with ImageMaster 2D platinum 5.0 (GE
Healthcare). Background subtraction, homogenization, and matching
were carried out for three gels from the same sample. Protein
expression was compared between groups using t-tests. Differences
with P-values of less than 0.05 were considered significant, and
protein spots with an expression difference of at least 2-fold were
defined as differentially expressed.
MS
Target protein spots were excised and subjected to
in-gel enzymatic digestion. The peptides extracted from the protein
spots were analyzed using an UltrafleX III TOF/TOF mass
spectrometer (Bruker Corporation, Ettlingen, Germany) with the
following settings: Ultraviolet (UV) wavelength, 355 nm; repetition
rate, 200 Hz; acceleration voltage, 20,000 V; and optimal quality
resolution, 1500 Da. Signals were collected from a scanning quality
range of 700–3,200 kDa. The peak of trypsin self-cleavage was used
as an internal standard calibration in the MS experiments. The
spectra of all experimental samples were obtained using the default
mode. The Cytoscape plugin GlueGO and ReactomeFIViz were used to
record the biological process GO term for the GO term enrichment
analysis of differentially expressed proteins. P-values of <0.05
and FDR <0.01 were accepted as threshold values for GO
enrichment. Identified Proteins were described in the tables by
Accession, Score, PI, Mw, and % coverage. Accession represent
protein accession number in Uniprot database, Score represent MS
score, PI represent Isoelectric point, Mw represent molecular
weight, % Coverage represent the percentage sequence coverage of
the protein by the matched peptides.
Verification of protein expression by
western blotting
The proteins of the serum samples were extracted by
RIPA buffer (150 mM sodium chloride, 1.0% NP-40, 0.5% sodium
deoxycholate 0.1% SDS, 50 mM Tris, pH 8.0) and protein
concentration was estimated by the Bradford protein assay (Bio-Rad
Laboratories). Then the extracted proteins was boiled at 100°C for
5 min. The serum samples of 20 PV patients, 20 SV patients and 20
healthy individuals were analyzed by WB experiment. Fifty
micrograms of protein was separated by SDS-PAGE on 12% gels. The
proteins were then transferred to polyvinylidene difluoride
membranes at 4°C with a constant voltage of 120 V. The membranes
were then incubated with 5% skim milk powder at room temperature
for 1 h, followed by incubation with 5 primary antibodies
(1:500-1:1,000) (Abcam, Cambridge, MA, USA): Anti-PRDX6 (cat. no.
ab133348, 1:1,000 dilution; Abcam), anti-APOL1 (cat. no. ab108315,
1:1,000 dilution; Abcam), anti-APOE (cat. no. ab52607, 1:1,000
dilution; Abcam), anti-MBL2 (cat. no. ab189856, 1:500 dilution;
Abcam) and β-tubulin (cat. no. ab6046, 1:500 dilution; Abcam). The
membranes were incubated with the primary antibodys at 4°C
overnight for 10 h. Next, the membranes were incubated with goat
anti-rabbit IgG (HRP; cat. no. ab6721, 1:2,000 dilution; Abcam)
followed by incubation with corresponding secondary antibodies at
room temperature for 2 h, Specific protein bands were visualized
with the SuperSignal chemiluminescence system (Promega
Corporation,) and imaged by X film.
Statistical analysis
All data were analyzed using Statistical Package for
Science Software (SPSS) version 16.0 (SPSS, Inc., Chicago, IL,
USA). The significant of difference were analysed by one-way
analysis of variance (ANOVA). The gray value ratio of each band
compared between groups (stable stage or progressive stage compared
to control) was used to calculate the significance of differences
by least significant difference (LSD) as a post hoc test. P<0.05
was considered to indicate a statistically significant
difference.
Results
2-DE-MS
A total of 48 proteins were obtained by MS analysis.
Out of those 48, 26 were upregulated, and 22 were downregulated.
There were 28 differentially expressed protein spots in the samples
from patients with progressive stage vitiligo (13 upregulated and
15 downregulated) and 13 differentially expressed protein spots in
the samples from patients with stable stage vitiligo (8 upregulated
and 5 downregulated), compared to those in healthy individuals. The
results of the 2-DE analysis comparing samples from patients with
both stages of vitiligo to healthy individuals are shown in
Tables I and II. The results of the 2-DE analysis
comparing samples from patients with progressive stage vitiligo and
patients with stable stage vitiligo are shown in Table III. A total of seven
differentially expressed proteins were identified by MS analysis (5
upregulated, and 2 downregulated).
 | Table I.Identification of differentially
expressed proteins of PV samples vs. control samples. |
Table I.
Identification of differentially
expressed proteins of PV samples vs. control samples.
| Protein name | Accession | Score | PI | Mw, kDa | Percent coverage,
% | PV/C Ratio |
|---|
| Ceruloplasmin | P00450 | 231 | 5.44 | 122,983 | 18 | −1000000 |
| Vitronectin | P04004 | 201 | 5.55 |
55,069 | 25 | −1000000 |
| Inter-alpha-trypsin
inhibitor heavy | Q14624 | 233 | 6.51 | 103,521 | 21 | −2.33923 |
| Kininogen-1 | P01042 | 360 | 6.34 |
72,996 | 33 | −1000000 |
| Antithrombin-III | P01008 | 307 | 6.32 |
53,025 | 40 | −3.30293 |
| Complement C4-B | P0C0L5 | 142 | 6.73 | 194,212 | 9 | −1000000 |
| Ig mu chain C
region | P01871 | 193 | 6.35 |
49,960 | 24 | −2.03550 |
| Complement C3 | P01024 | 134 | 6.02 | 188,569 | 11 | −1000000 |
| Apolipoprotein
L1 | O14791 | 148 | 5.60 |
44,004 | 24 | −1000000 |
| Inter-alpha-trypsin
inhibitor heavy chain H4 | Q14624 | 199 | 6.51 | 103,521 | 11 | −11.94160 |
| Apolipoprotein
A-IV | P06727 | 110 | 5.28 |
45,371 | 33 | −1000000 |
| Apolipoprotein
A-I | P02647 | 361 | 5.56 |
30,759 | 68 | −1000000 |
| Complement
C4-A | P0C0L4 | 125 | 6.65 | 194,247 | 2 | −1000000 |
| Keratin, type
IIcytoskeletal 1 | P04264 | 198 | 6.11 |
76,359 | 14 | −1000000 |
|
Peroxiredoxin-6 | P30041 | 55 | 6.54 |
25,133 | 25 | −1000000 |
| Ceruloplasmin | P00450 | 413 | 5.44 | 122,983 | 35 | 1.59452 |
| Inter-alpha-trypsin
inhibitor heavy chain H4 | Q14624 | 278 | 6.51 | 103,521 | 23 | 2.24357 |
| Complement
C4-A | P0C0L4 | 185 | 6.65 | 194,247 | 12 | 1.57939 |
|
Alpha-1B-glycoprotein | P04217 | 256 | 5.58 |
54,809 | 34 | 1.59039 |
| Complement C3 | P01024 | 290 | 6.02 | 188,569 | 20 | 3.31003 |
| Kininogen-1 | P01042 | 300 | 6.34 |
72,996 | 21 | 1000000 |
| Ig alpha-2 chain C
region | P01877 | 132 | 5.71 |
37,301 | 18 | 1.50594 |
|
Antithrombin-III | P01008 | 266 | 6.32 |
53,025 | 30 | 1.64382 |
| Beta-2-glycoprotein
1 | P02749 | 107 | 8.34 |
39,584 | 15 | 1.52746 |
| Ig gamma-4 chain C
region | P01861 | 75 | 7.18 |
36,431 | 8 | 1.62011 |
|
Serotransferrin | P02787 | 164 | 6.81 |
79,280 | 21 | 2.02112 |
| Complement factor
I | P05156 | 187 | 7.72 |
68,071 | 19 | 2.20440 |
| Apolipoprotein
L1 | O14791 | 149 | 5.6 |
44,004 | 20 | 2.01092 |
| Table II.Identification of differentially
expressed proteins of SV samples vs. control samples. |
Table II.
Identification of differentially
expressed proteins of SV samples vs. control samples.
| Protein name | Accession | Score | PI | Mw, kDa | Percent Coverage,
% | SV/C ratio |
|---|
| Kininogen-1 | P01042 | 191 | 6.34 |
72,996 | 11 | −1000000 |
| Inter-alpha-trypsin
inhibitor heavy chain H4 | Q14624 | 110 | 6.51 | 103,521 | 10 | −1000000 |
| Apolipoprotein
E | P02649 | 317 | 5.65 |
36,246 | 59 | −2.11918 |
| Haptoglobin | P00738 | 97 | 6.13 |
45,861 | 14 | −1.51291 |
| Complement C1q | P02746 | 92 | 6.12 |
26,933 | 22 | −1000000 |
| Inter-alpha-trypsin
inhibitor heavy chain H4 | Q14624 | 306 | 6.51 | 103,521 | 27 | 2.86546 |
| Complement
C4-A | P0C0L4 | 221 | 6.65 | 194,247 | 12 | 2.26642 |
| Complement C3 | P01024 | 179 | 6.02 | 188,569 | 9 | 4.58277 |
| Serum albumin | P02768 | 136 | 5.92 |
71,317 | 25 | 3.20345 |
|
Serotransferrin | P02787 | 113 | 6.81 |
79,280 | 16 | 1000000 |
| Haptoglobin | P00738 | 195 | 6.13 |
45,861 | 26 | 1000000 |
| Keratin, type II
cytoskeletal | P04264 | 549 | 6.52 |
76,356 | 17 | 1000000 |
|
Antithrombin-III | P01008 | 99 | 5.98 |
53,025 | 19 | 1000000 |
| Table III.Differentially expressed proteins
occurring in both SV and PV. |
Table III.
Differentially expressed proteins
occurring in both SV and PV.
| Protein name | Accession | Score | PI | Mw, kDa | Percent coverage,
% | PV/SV (Ratio) |
|---|
| Mannose-binding
protein C | P11226 | 65 | 5.39 |
26,526 | 26 | −1000000 |
| Haptoglobin | P00738 | 173 | 6.13 |
45,861 | 21 | −2.76835 |
| Complement
C4-A | P0C0L4 | 158 | 6.65 | 194,247 | 8 | 1.85913 |
| Ig mu chain C
region | P01871 | 205 | 6.35 |
49,960 | 16 | 1.70843 |
| Complement
C4-B | P0C0L5 | 244 | 6.73 | 194,212 | 11 | 1.56144 |
| Serum albumin | P02768 | 131 | 5.92 |
71,317 | 22 | 1000000 |
| Immunoglobulin J
chain | P01591 | 144 | 5.12 |
18,543 | 32 | 1.64301 |
Functional categories of identified
proteins
An analysis of the functional categories of the
proteins differentially expressed in patients with vitiligo
compared to the controls was performed. The differentially
expressed proteins in the SV and PV groups were analyzed based on
their GO clustering. The annotated functions based on the GO
analysis were ranked according to statistical significance. The
differentially expressed proteins were categorized based on their
molecular function, biological process, and cell component.
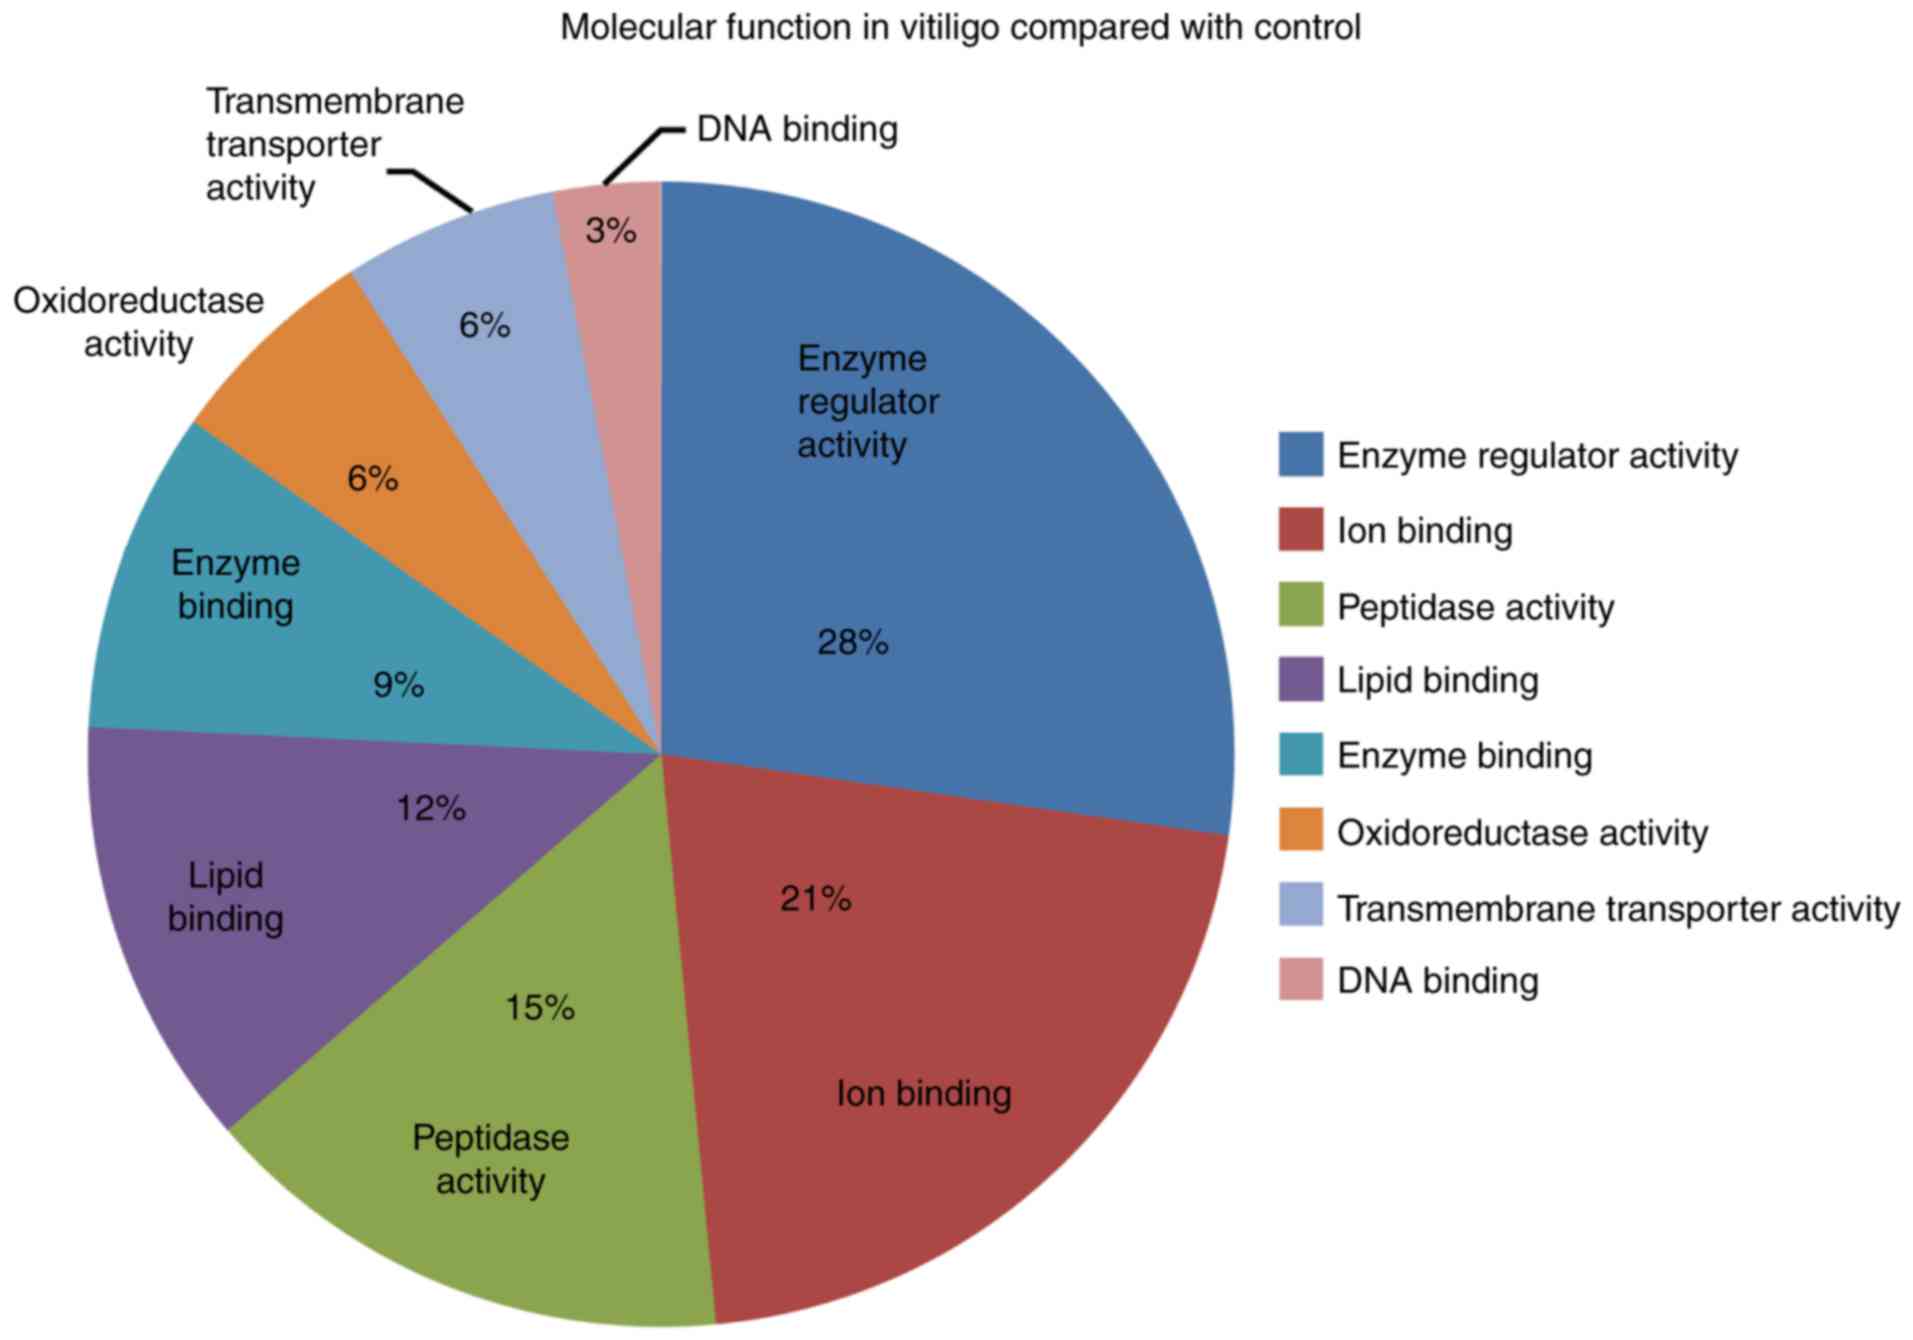
In regard to the molecular function, we noted that
normal enzyme activity, ion binding and lipid binding function most
frequently occurred at both stages of vitiligo compared to
controls. In addition, we noted oxidoreductase activity,
transmembrane transporter activity and DNA binding function
(Fig. 1).
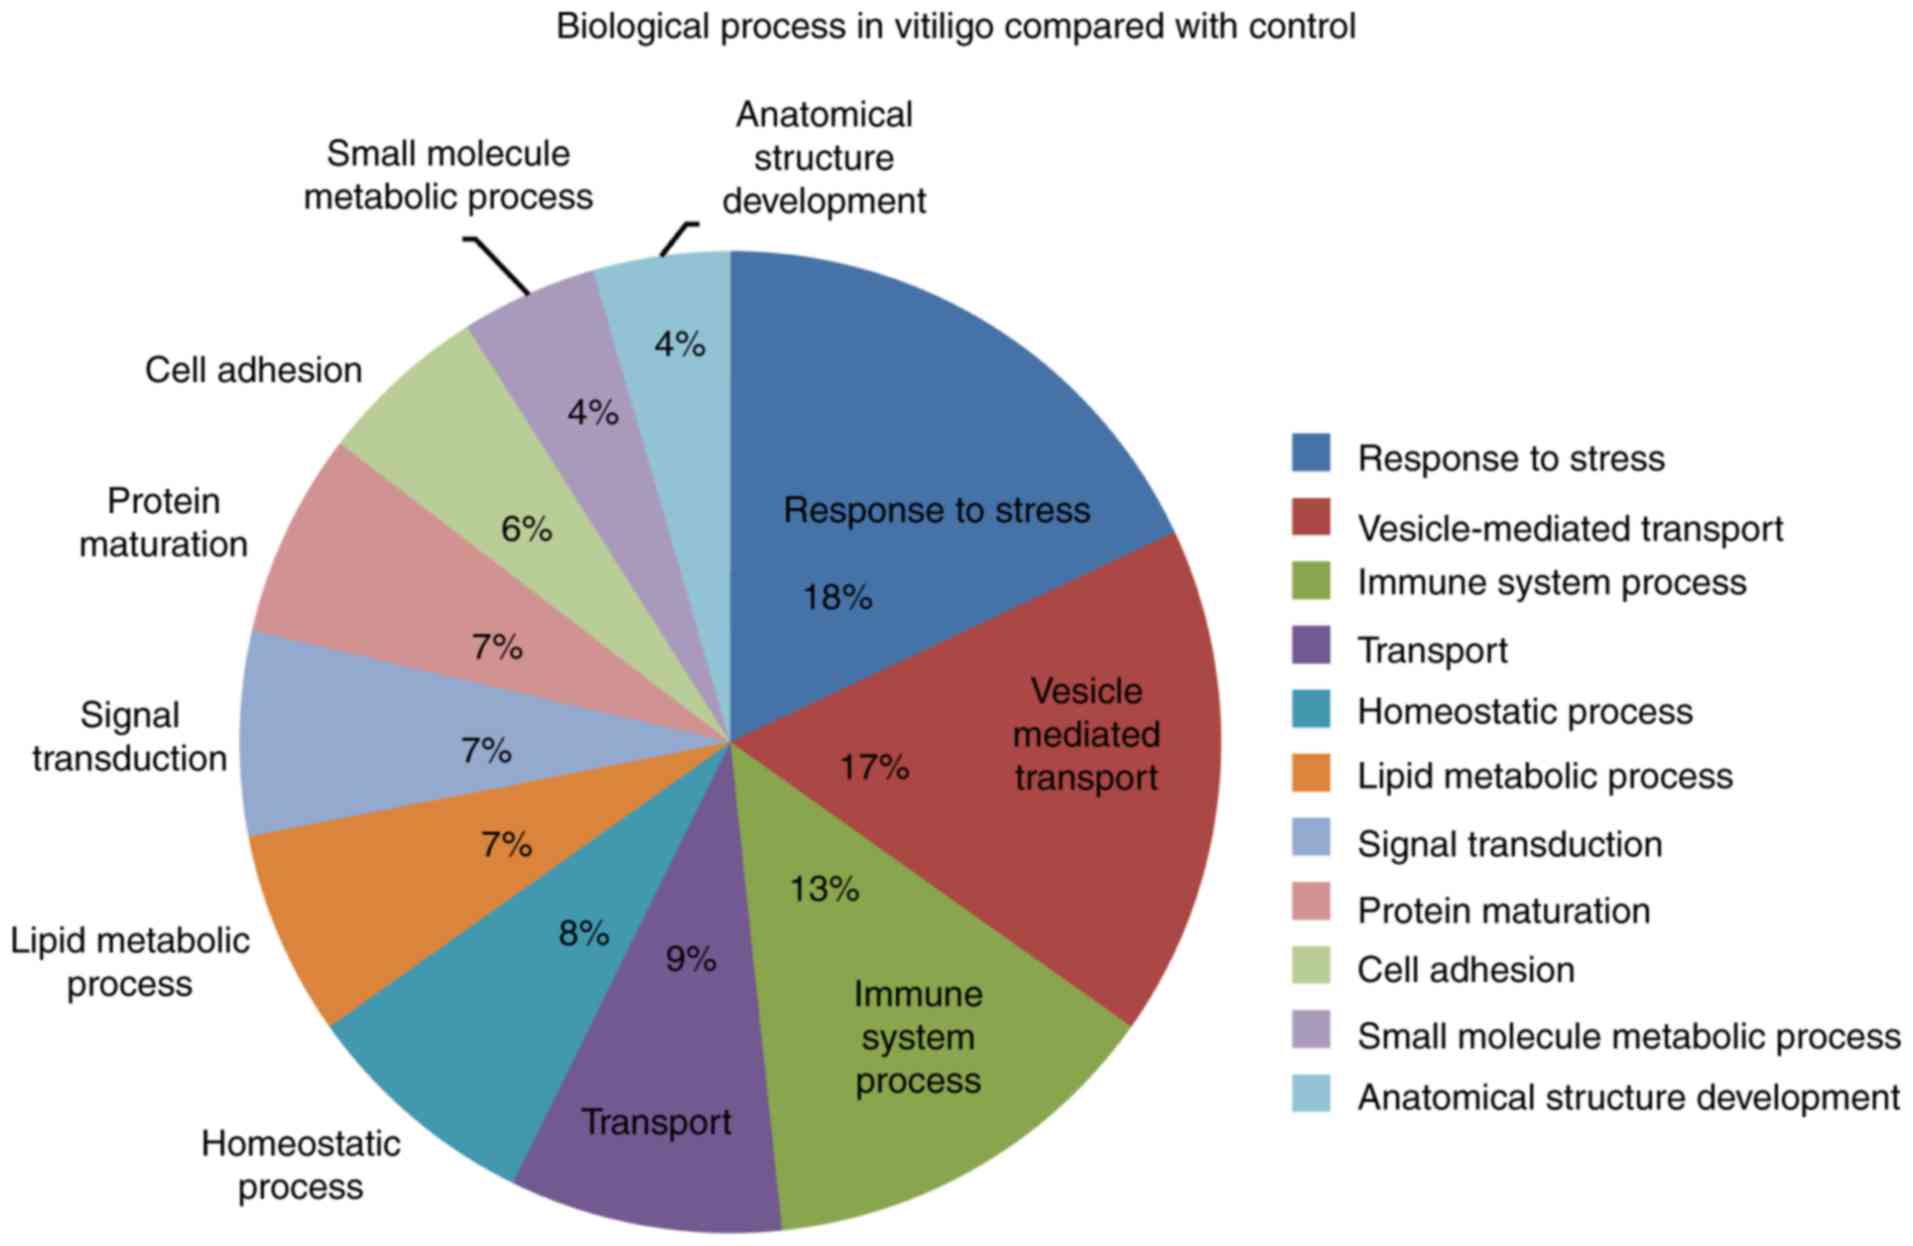
We further analyzed the GO annotated biological
processes in vitiligo patients compared to controls. The top three
biological processes were response to stress, vesicle-mediated
transport and immune system biological process. We also observed
other processes annotated as homeostatic, signal transduction, cell
adhesion and small molecule metabolic processes (Fig. 2).
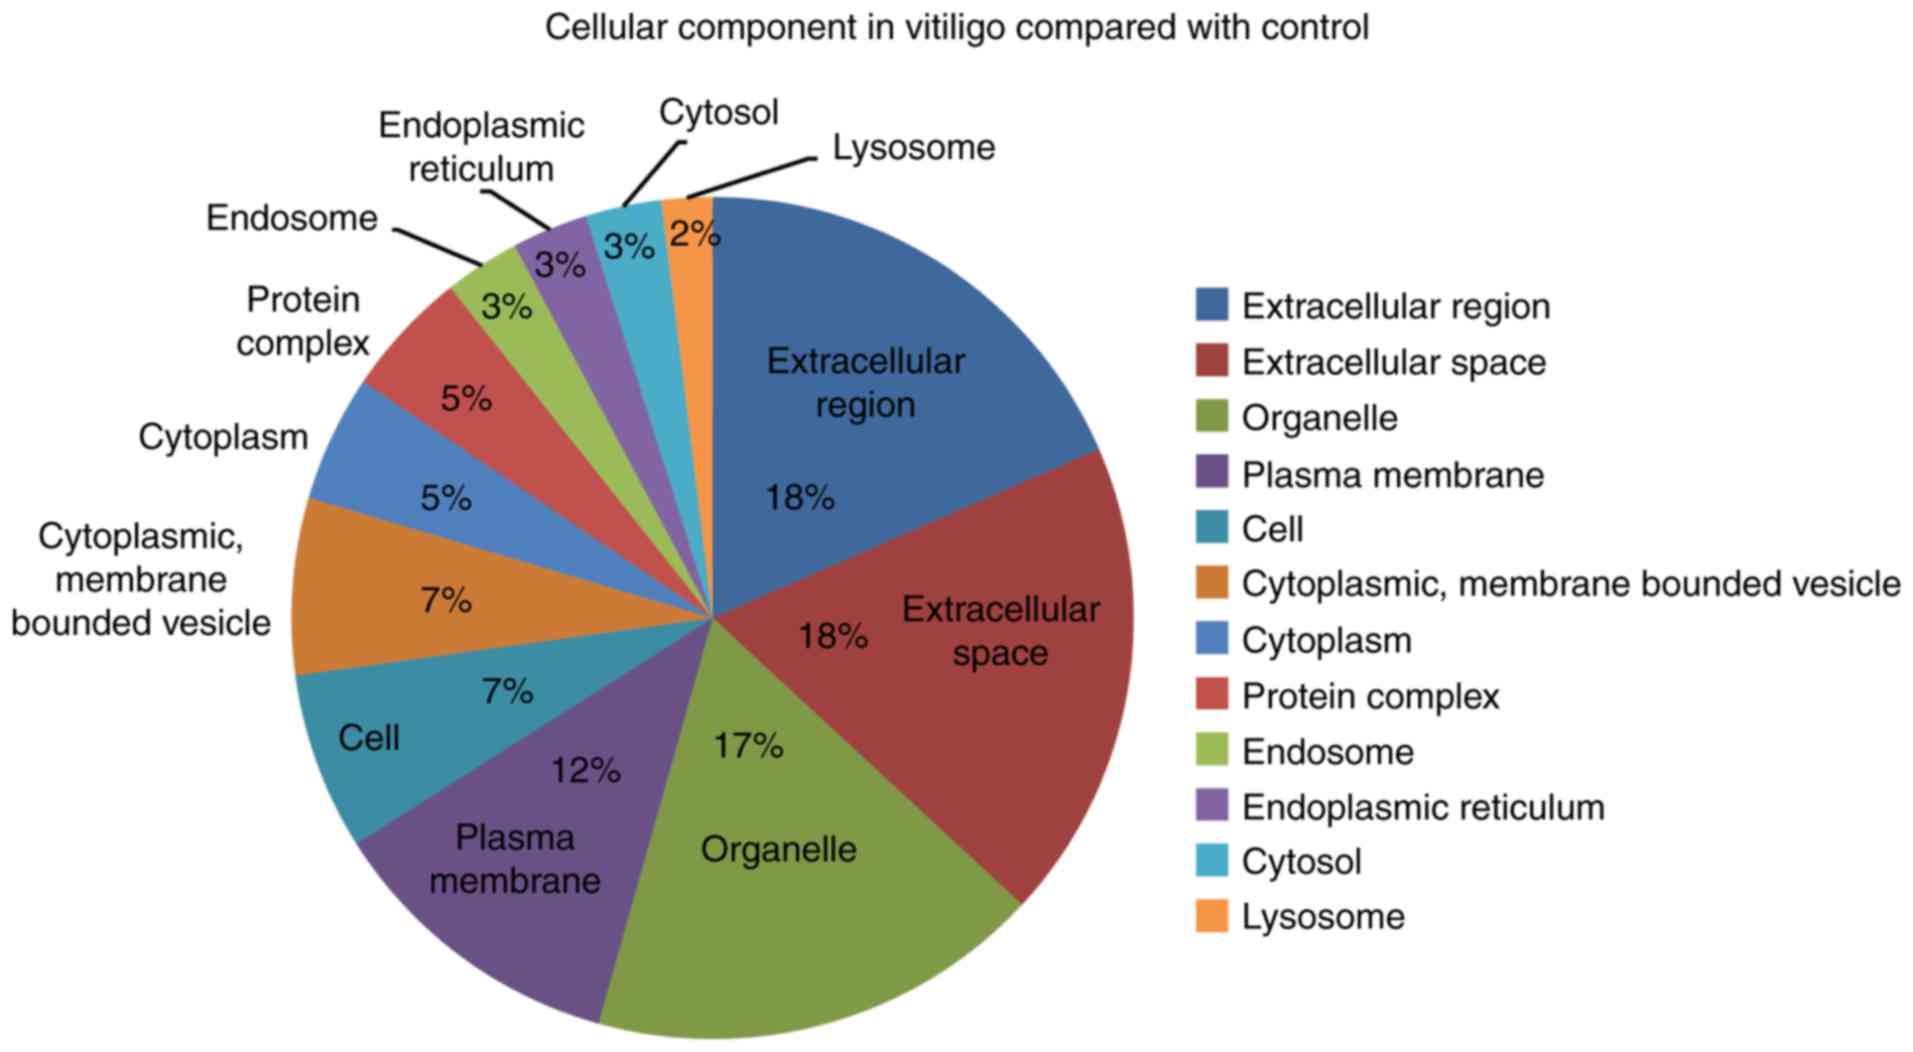
The cellular component GO terms associated with
vitiligo compared to controls included extracellular components,
organelle, plasma membrane, cytoplasm and endosome components
(Fig. 3).
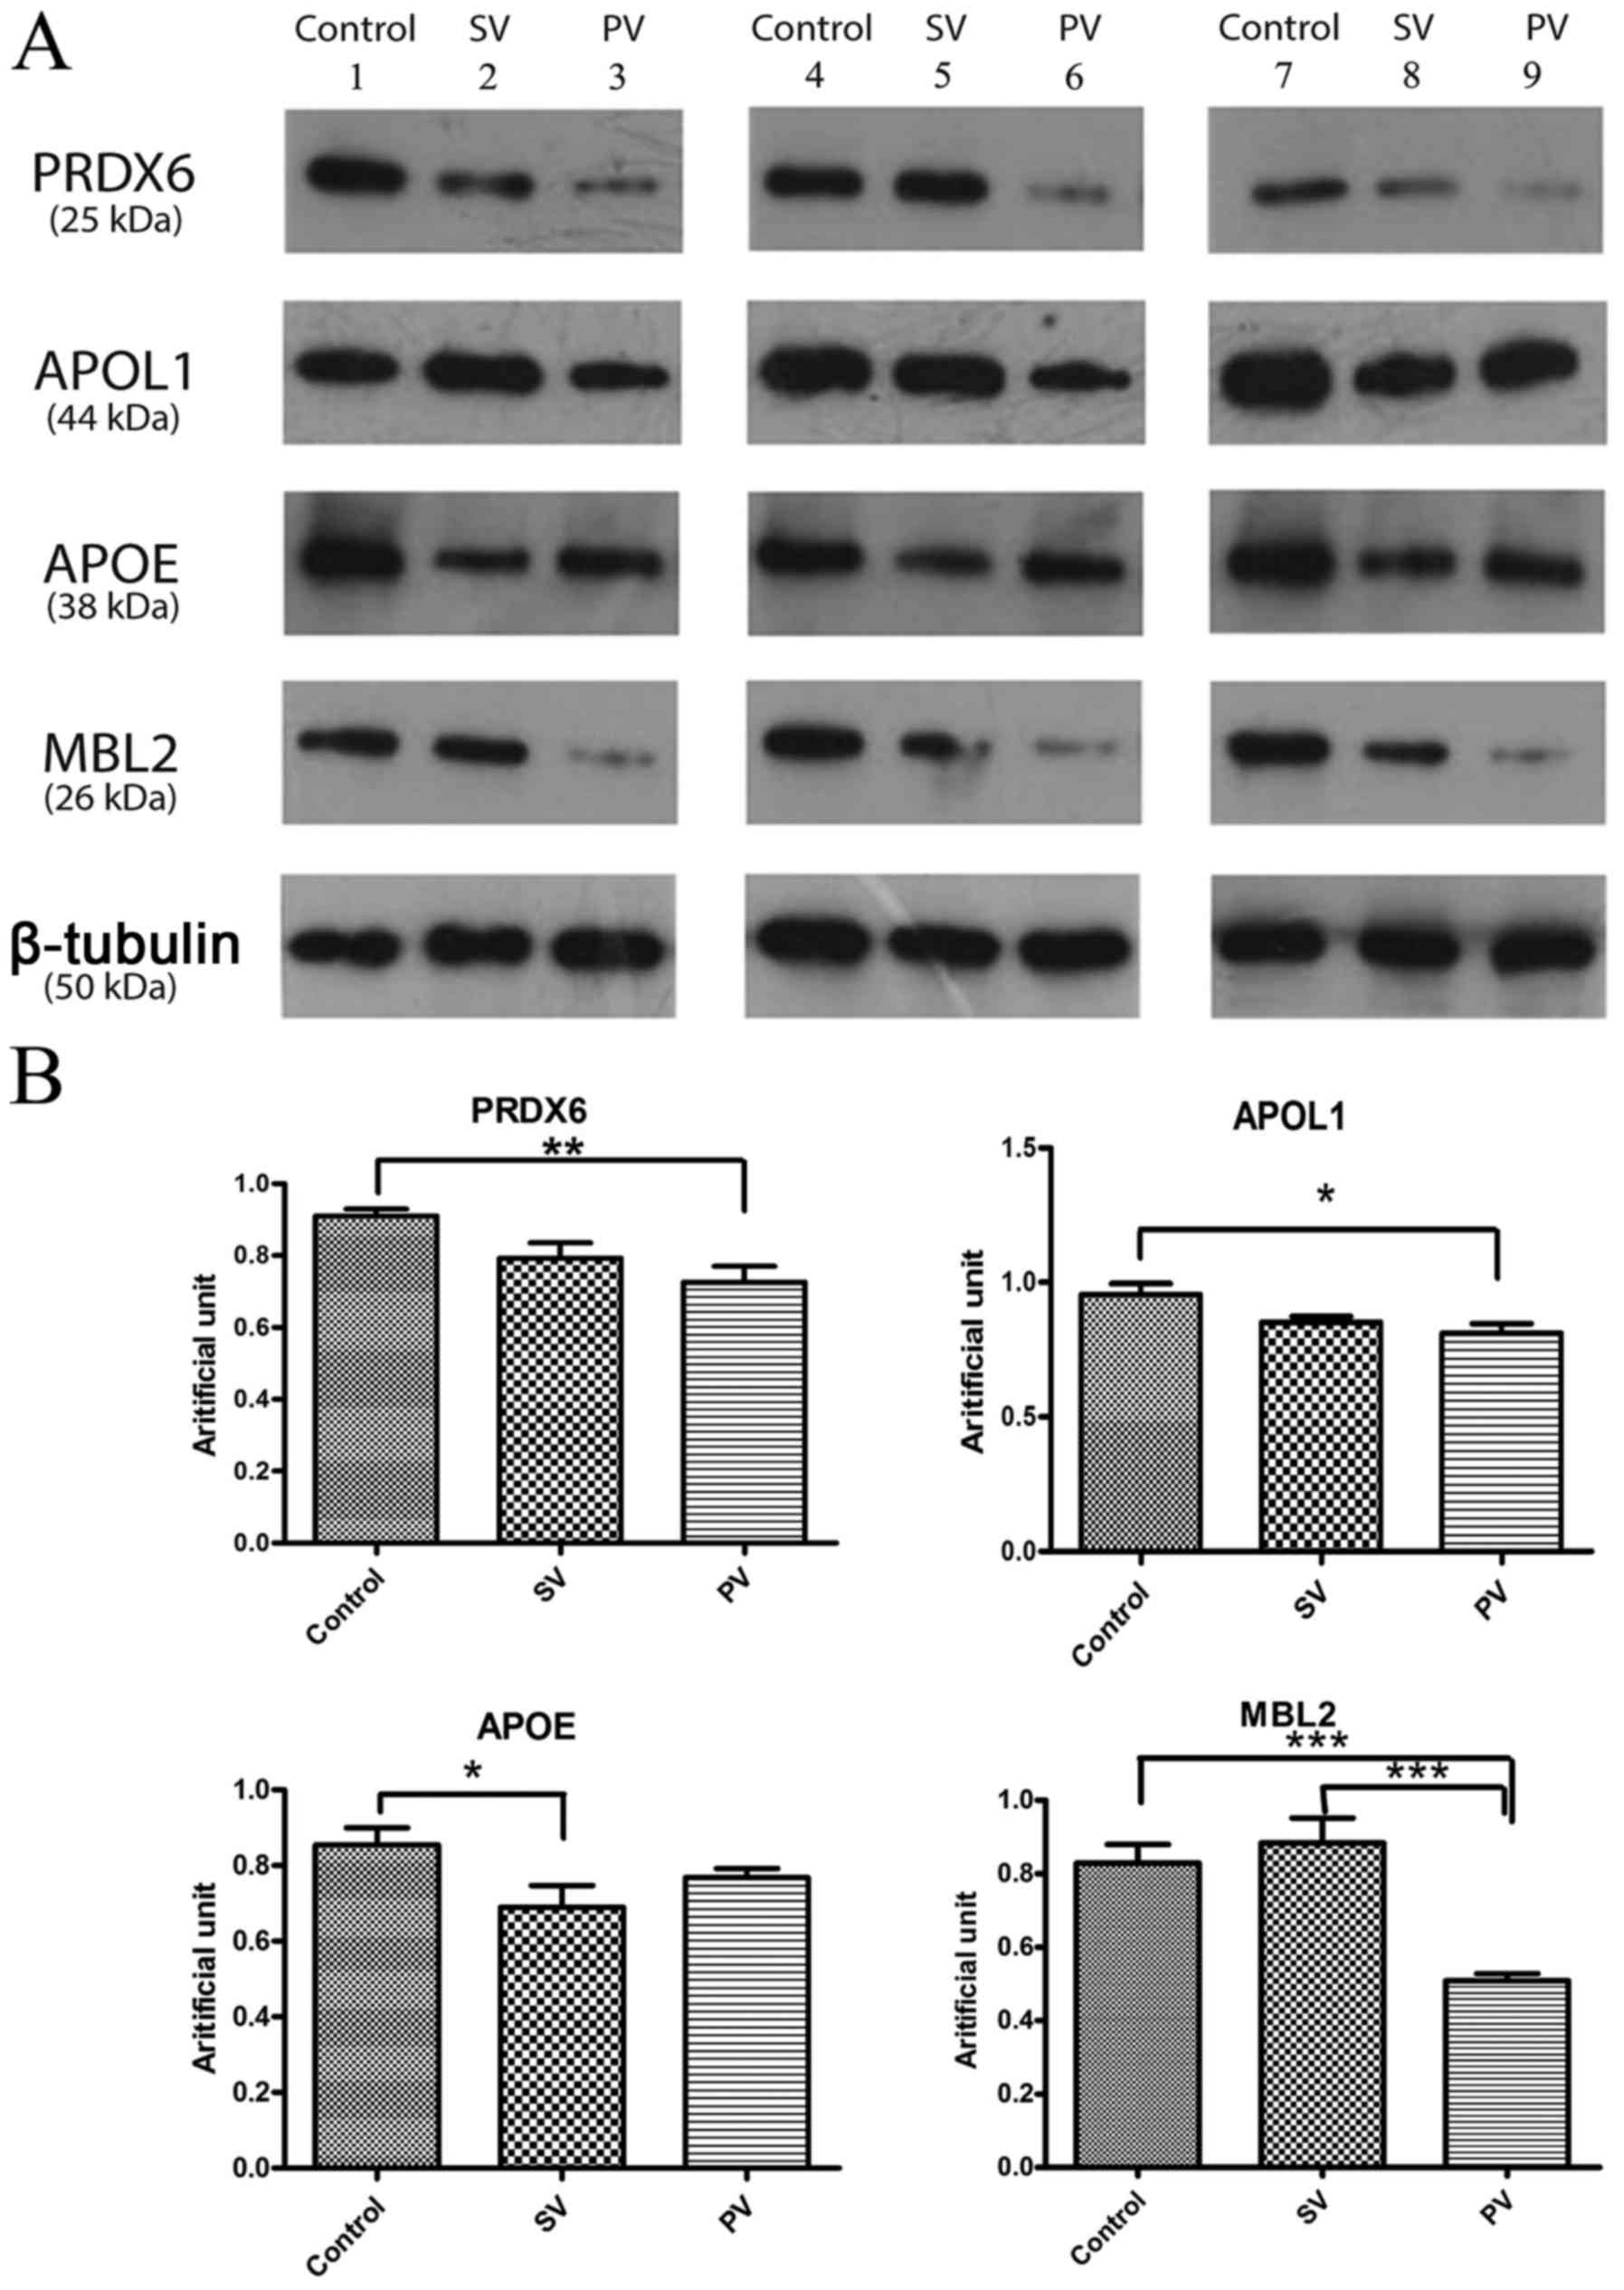
Western blot results
Compared to the samples from the control group, the
samples from patients with vitiligo showed differential expression
patterns of Peroxiredoxin-6 (PRDX6), apolipoprotein L1 (APOL1),
apolipoprotein E (APOE) and mannose-binding protein C (MBL2). PRDX6
expression was downregulated in patients with vitiligo compared to
that in healthy individuals (progressive vs. control was
P<0.01). In addition, APOL1 expression was downregulated in
patients with PV compared to that in controls (P<0.05), and APOE
expression was downregulated in patients with SV compared to that
in controls (P<0.05). MBL2 was downregulated in patients with PV
compared to that in controls, especially compared to that in
patients with SV (P<0.001; Fig.
4).
Discussion
The onset of vitiligo is related to oxidative
stress, autoimmune responses, and neurogenic factors (11). Some studies have shown that
sympathetic nervous system dysfunction can inhibit melanin
production, leading to melanin loss (12). The incidence of nonsegmental
vitiligo and autoimmune responses is closely related, and
inflammatory cell infiltration can be found around the lesions of
patients with segmental vitiligo (13). In addition, patients with vitiligo
show increased hydrogen peroxide levels, and the resulting
oxidative stress damage can cause melanocytes to become more
susceptible to free radical-mediated damage (14). However, the pathogenesis of
vitiligo is still largely unclear.
In this study, we used 2-DE-MS to identify proteins
that are differentially expressed between patients with vitiligo
and healthy individuals. The study identified many differentially
expressed proteins, and it also showed a protein expression
difference among patients with the progressive and stable stages of
the disease. Analysis of the functions of the differentially
expressed proteins using Cytoscape software showed that these
proteins were involved in GO annotated molecular functions,
biological processes, and cellular components. We found common
functions that were to be expected, such as immune system processes
(15) and oxidoreductase
activities (16), but we also
found new functions such as calcium-binding proteins, lipid binding
proteins, peptidase enzyme activities and cell adhesion processes.
There have been reports about serum vitamin D levels relating to
skin diseases including vitiligo (17), and some authors have suggested that
total lipid serum levels change in patients with vitiligo (18). However, no one has elucidated the
mechanism of vitiligo or implicated specific proteins in its
pathogenesis. Our data also suggest that new functions and
biological processes involving these different proteins may be
affected during the two stages of vitiligo. In addition, we found
most of these proteins were expected to be localized to the
extracellular region, the organelles, the plasma membrane and the
cytoplasm.
We noted four proteins that were differentially
expressed between vitiligo patients and controls: PRDX6, APOL1,
APOE and mannose-binding protein C (MBL2). PRDX6 was significantly
downregulated in patients with vitiligo, APOL1 was downregulated in
patients with PV, and APOE was downregulated in patients with SV.
Additionally, mannose-binding protein C (MBL2) was downregulated in
patients with PV compared to that in patients with SV. We verified
that PRDX6 was downregulated in both stages of vitiligo, especially
in PV. Using our bioinformatic analysis, we showed evidence that
PRDX6 might have oxidoreductase activity based on the biological
function according to GO annotation. PRDX6 represents a widely
distributed group of peroxiredoxins that contain a single conserved
cysteine in the protein monomer (19), which protects tissues from
oxidative stress. There have been reports that PRDX6 plays a role
in protecting epithelial cells from exposure to severe oxidative
stress (20). Another study on
PRDX6 examined its expression levels in retinal pigment epithelial
cells and showed that PRDX6 protects cells from
H2O2-induced oxidative stress and apoptosis
through the PI3K/AKT pathway (21). Thus, PRDX6 may impact
antioxygenation. In addition, there have been reports that
downregulation of PRDX6 was verified in DNA vaccine-induced mouse
models of vitiligo by western-blot and mRNA analysis (22). We also have found that PRDX6
expression varied in vitiligo patients compared to that in controls
using 2-DE proteomics. The downregulation of PRDX6 was also
observed. Further study will be needed to confirm whether PRDX6
levels are affected in the vitiligo disease state, especially
during the progressive stage.
We also found variation in the expression of lipid
metabolism-related proteins. APOA1 and APOL1 were significantly
downregulated in patients with PV, and APOE was downregulated in
patients with SV. APOA1 is the main apolipoprotein of high-density
lipoprotein (HDL), which can help reverse cholesterol transport and
has antioxidative and anti-inflammatory effects (23). The level of APOA1 is inversely
correlated with the level of acute inflammation markers, (24) and studies have suggested that APOA1
can antagonize lipid deposition and anti-inflammatory-induced lipid
toxicity (25). The APOL1 family
mainly binds to APOA1 complex lipoproteins. Additionally, APOE,
which was decreased during the stable stage, is involved in the
transport of cholesterol, regulating lipid metabolism, and some
neurobiological processes (26).
APOE is an arginine-rich alkaline protein that is the APO component
of various lipoproteins and acts as an important cholesterol
carrier mainly in chylomicrons with very-low-density lipoprotein
and certain HDLs (27,28). In recent years, APOE has been
reported to be a marker of ovarian cancer and to promote tumor
growth (29). In addition, APOE is
also involved in nerve repair and regeneration after injury. Our
western blot results showed that APOL1 and APOE had significant
differences in progressive and SV. Although it had not been
reported that these proteins are related to lipid function in the
context of vitiligo, there may some effect on lipid function in the
vitiligo disease state. This information further illustrates that
APOL1 and APOE may have an effect in the two stages of vitiligo by
regulating LDL and HDL.
Notably, our results showed that MBL2 is
downregulated in patients with PV compared with control and SV,
suggesting that complement activation was inhibited. MBL2 is an
acute-phase protein in the Ca2+-dependent lectin family
produced by the liver. MBL is a key factor in the innate immune
system that recognizes pathogenic microorganisms through the
carbohydrate recognition domain (30,31).
Furthermore, by combining with associated serine protease-2, the
complement lectin pathway can be activated and result in immune
responses and regulation of inflammation to mediate infections,
immune diseases, and recurrent miscarriage diseases (32). MBL has been shown to affect immune
diseases; for example, MBL is decreased in hypothyroidism during
pregnancy (33) and SLE via
polymorphisms (34). It was
reported that a polymorphism in MBL2 may be one of the genetic
susceptibility factors for vitiligo, but this is still largely an
open question. Our bioinformatic classification of these proteins
may help unravel how the ion-binding function of MBL2 plays a part
in vitiligo (35).
We have found some differential expressed proteins
in vitiligo compared to control using proteomics. The expression
changes of these proteins through the two stages of vitiligo may
yield some insight into how these proteins play important roles in
the occurrence and development of vitiligo. In addition, the
differential protein expression between the two stages may be an
indicator of disease activity, and this information may one day
provide potential clues in the clinical treatment of vitiligo.
Subsequent further research is required to determine the clinical
significance of the findings.
In summary, although our sample size was small, our
results confirmed the differential expression of PRDX6, APOL1, and
APOE. This information might be useful to study pathogenesis or
biomarkers of stable and PV. MBL2 may have applications as a
biological marker used to differentiate between the progressive and
stable stages of the disease. Of course, these are only preliminary
data and further research is required to validate the findings and
verify the identified novel molecular biomarkers in patients with
vitiligo. Based on the findings of this study, we will use other
biological techniques to conduct a more in-depth exploration of
protein interactions, protein modifications, and biological
information networks to further elucidate the pathogenic mechanisms
of vitiligo.
Acknowledgements
This study was supported by the Public Welfare
Programme, Ministry of Health, China (no. 201202013), and the
Innovative research team in universities, Liaoning Bureau of
Education (no. LT2012012).
References
|
1
|
Isenstein AL, Morrell DS and Burkhart CN:
Vitiligo: Treatment approach in children. Pediatr Ann. 38:339–344.
2009. View Article : Google Scholar : PubMed/NCBI
|
|
2
|
Guerra L, Dellambra E, Brescia S and
Raskovic D: Vitiligo: Pathogenetic hypotheses and targets for
current therapies. Curr Drug Metab. 11:451–467. 2010. View Article : Google Scholar : PubMed/NCBI
|
|
3
|
Birlea SA, Fain PR and Spritz RA: A
Romanian population isolate with high frequency of vitiligo and
associated autoimmune diseases. Arch Dermatol. 144:310–316. 2008.
View Article : Google Scholar : PubMed/NCBI
|
|
4
|
Shin J, Kang HY, Kim KH, Park CJ, Oh SH,
Lee SC, Lee S, Choi GS and Hann SK: Involvement of T cells in early
evolving segmental vitiligo. Clin Exp Dermatol. 41:671–674. 2016.
View Article : Google Scholar : PubMed/NCBI
|
|
5
|
Wang XX, Wang QQ, Wu JQ, Jiang M, Chen L,
Zhang CF and Xiang LH: Increased expression of CXCR3 and its
ligands in patients with vitiligo and CXCL10 as a potential
clinical marker for vitiligo. Br J Dermatol. 174:1318–1326. 2016.
View Article : Google Scholar : PubMed/NCBI
|
|
6
|
Richmond JM, Bangari DS, Essien KI,
Currimbhoy SD, Groom JR, Pandya AG, Youd ME, Luster AD and Harris
JE: Keratinocyte-derived chemokines orchestrate T-Cell positioning
in the epidermis during vitiligo and may serve as biomarkers of
disease. J Invest Dermatol. 137:350–358. 2017. View Article : Google Scholar : PubMed/NCBI
|
|
7
|
Speeckaert R, Lambert J, Grine L, Van Gele
M, De Schepper S and van Geel N: The many faces of interleukin-17
in inflammatory skin diseases. Br J Dermatol. 175:892–901. 2016.
View Article : Google Scholar : PubMed/NCBI
|
|
8
|
Guan M, Chen X, Ma Y, Tang L, Guan L, Ren
X, Yu B, Zhang W and Su B: MDA-9 and GRP78 as potential diagnostic
biomarkers for early detection of melanoma metastasis. Tumour Biol.
36:2973–2982. 2015. View Article : Google Scholar : PubMed/NCBI
|
|
9
|
Kazemipour N, Qazizadeh H, Sepehrimanesh M
and Salimi S: Biomarkers identified from serum proteomic analysis
for the differential diagnosis of systemic lupus erythematosus.
Lupus. 24:582–587. 2015. View Article : Google Scholar : PubMed/NCBI
|
|
10
|
Group CAolMoDPCPDS, . Consensus of
Vitiligo Diagnosis and Treatment (2014 Edition). Chin J Dermatol.
47:652014.
|
|
11
|
Jin Y, Birlea SA, Fain PR, Ferrara TM, Ben
S, Riccardi SL, Cole JB, Gowan K, Holland PJ, Bennett DC, et al:
Genome-wide association analyses identify 13 new susceptibility
loci for generalized vitiligo. Nat Genet. 44:676–680. 2012.
View Article : Google Scholar : PubMed/NCBI
|
|
12
|
Alikhan A, Felsten LM, Daly M and
Petronic-Rosic V: Vitiligo: A comprehensive overview part I.
Introduction, epidemiology, quality of life, diagnosis,
differential diagnosis, associations, histopathology, etiology and
work-up. J Am Acad Dermatol. 65:473–491. 2011. View Article : Google Scholar : PubMed/NCBI
|
|
13
|
Vaccaro M, Cannavò SP, Imbesi S, Cristani
M, Barbuzza O, Tigano V and Gangemi S: Increased serum levels of
interleukin-23 circulating in patients with non-segmental
generalizedvitiligo. Int J Dermatol. 54:672–674. 2015. View Article : Google Scholar : PubMed/NCBI
|
|
14
|
Jian Z, Li K, Liu L, Zhang Y, Zhou Z, Li C
and Gao T: Heme oxygenase-1 protects human melanocytes from
H2O2-induced oxidative stress via the Nrf2-ARE pathway. J Invest
Dermatol. 131:1420–1427. 2011. View Article : Google Scholar : PubMed/NCBI
|
|
15
|
Rork JF, Rashighi M and Harris JE:
Understanding autoimmunity of vitiligo and alopecia areata. Curr
Opin Pediatr. 28:463–469. 2016. View Article : Google Scholar : PubMed/NCBI
|
|
16
|
Laddha NC, Dwivedi M, Mansuri MS, Singh M,
Gani AR, Yeola AP, Panchal VN, Khan F, Dave DJ, Patel A, et al:
Role of oxidative stress and autoimmunity in onset and progression
of vitiligo. Exp Dermatol. 23:352–353. 2014. View Article : Google Scholar : PubMed/NCBI
|
|
17
|
Wadhwa B, Relhan V, Goel K, Kochhar AM and
Garg VK: Vitamin D and skin diseases: A review. Indian J Dermatol
Venereol Leprol. 81:344–355. 2015. View Article : Google Scholar : PubMed/NCBI
|
|
18
|
Dammak I, Boudaya S, Ben Abdallah F, Turki
H, Attia H and Hentati B: Antioxidant enzymes and lipid
peroxidation at the tissue level in patients with stable and active
vitiligo. Int J Dermatol. 48:476–480. 2009. View Article : Google Scholar : PubMed/NCBI
|
|
19
|
Fisher AB: Peroxiredoxin 6 in the repair
of peroxidized cell membranes and cell signaling. Arch Biochem
Biophys. 617:68–83. 2017. View Article : Google Scholar : PubMed/NCBI
|
|
20
|
Shibata S, Shibata N, Shibata T, Sasaki H,
Singh DP and Kubo E: The role of Prdx6 in the protection of cells
of the crystalline lens from oxidative stress induced by UV
exposure. Jpn J Ophthalmol. 60:408–418. 2016. View Article : Google Scholar : PubMed/NCBI
|
|
21
|
Zha X, Wu G, Zhao X, Zhou L, Zhang H, Li
J, Ma L and Zhang Y: PRDX6 protects ARPE-19 cells from oxidative
damage via PI3K/AKT signaling. Cell Physiol Biochem. 36:2217–2228.
2015. View Article : Google Scholar : PubMed/NCBI
|
|
22
|
Zhou Q, Wang F, Zhang Y, Yang F, Wang Y
and Sun S: Down-regulation of Prdx6 contributes to DNA vaccine
induced vitiligo in mice. Mol Biosyst. 7:809–816. 2011. View Article : Google Scholar : PubMed/NCBI
|
|
23
|
Filou S, Lhomme M, Karavia EA,
Kalogeropoulou C, Theodoropoulos V, Zvintzou E, Sakellaropoulos GC,
Petropoulou PI, Constantinou C, Kontush A and Kypreos KE: Distinct
roles of apolipoproteins A1 and E in the modulation of high-density
lipoproteincomposition and function. Biochemistry. 55:3752–3762.
2016. View Article : Google Scholar : PubMed/NCBI
|
|
24
|
Fizelova M, Miilunpohja M, Kangas AJ,
Soininen P, Kuusisto J, Ala-Korpela M, Laakso M and Stančáková A:
Associations of multipie lipoprotein and apolipoprotein measures
with worsening of glycemia and incident type 2 diabetes in 6607
non-diabetic Finnish men. Atherosclerosis. 240:272–277. 2015.
View Article : Google Scholar : PubMed/NCBI
|
|
25
|
Simó R, García-Ramírez M, Higuera M and
Hernández C: Apolipoprotein A1 is overexpressed in the retina of
diabetic patients. Am J Ophthalmol. 147:319–325.e1. 2009.
View Article : Google Scholar : PubMed/NCBI
|
|
26
|
Meroufel DN, Mediene-Benchekor S,
Lardjam-Hetraf SA, Ouhaïbi-Djellouli H, Boulenouar H,
Hamani-Medjaoui I, Hermant X, Saïdi-Mehtar N, Amouyel P, Houti L,
et al: Associations of common SNPs in the SORT1, GCKR, LPL, APOA1,
CETP, LDLR, APOE genes with lipid trait levels in an Algerian
population sample. Int J Clin Exp Pathol. 8:7358–7363.
2015.PubMed/NCBI
|
|
27
|
Ikeda T, Shinohata R, Murakami M, Hina K,
Kamikawa S, Hirohata S, Kusachi S, Tamura A and Usui S: A rapid and
precise method for measuring plasma apoE-rich HDL using
polyethylene glycol and cation-exchange chromatography: A pilot
study on the clinical significance of apoE-rich HDL measurements.
Clin Chim Acta. 465:112–118. 2017. View Article : Google Scholar : PubMed/NCBI
|
|
28
|
Dai S, Wang B, Li W, Wang L, Song X, Guo
C, Li Y, Liu F, Zhu F, Wang Q, et al: Systemic application of
3-methyladenine markedly inhibited atherosclerotic lesion in
ApoE-/-mice by modulating autophagy, foam cell formation and
immune-negative molecules. Cell Death Dis. 7:e24982016. View Article : Google Scholar : PubMed/NCBI
|
|
29
|
Urquidi V, Goodison S, Ross S, Chang M,
Dai Y and Rosser CJ: Diagnostic potential of urinary α1-antitrypsin
and apolipoprotein E in the detection of bladder cancer. J Urol.
188:2377–2383. 2012. View Article : Google Scholar : PubMed/NCBI
|
|
30
|
Orsatti CL, Nahas EA, Nahás-Neto J,
Orsatti FL, Linhares IM and Witkin SS: Mannose-binding lectin gene
polymorphism and risk factors for cardiovascular disease in
postmenopausal women. Mol Immunol. 61:23–27. 2014. View Article : Google Scholar : PubMed/NCBI
|
|
31
|
Heitzeneder S, Seidel M, Förster-Waldl E
and Heitger A: Mannan-binding lectin deficiency-Good news, bad
news, doesn't matter? Clin Immunol. 143:22–38. 2012. View Article : Google Scholar : PubMed/NCBI
|
|
32
|
Swierzko AS, Szala A, Sawicki S, Szemraj
J, Sniadecki M, Sokolowska A, Kaluzynski A, Wydra D and Cedzynski
M: Mannose-binding lectin (MBL) and MBL-associated serine
protease-2 (MASP-2) in women with malignant and benign ovarian
tumours. Cancer Immunol Immunother. 63:1129–1140. 2014. View Article : Google Scholar : PubMed/NCBI
|
|
33
|
Çalkavur Ş, Erdemir G, Onay H,
AltunKöroğlu Ö, Yalaz M, Zekioğlu O, Aksu G, Özkınay F, Akercan F
and Kültürsay N: Mannose-binding lectin may affect pregnancy
outcome. Turk J Pediatr. 57:26–33. 2015.PubMed/NCBI
|
|
34
|
Pradhan V, Surve P, Rajadhyaksha A,
Rajendran V, Patwardhan M, Umare V, Ghosh K and Nadkarni A: Mannose
binding lectin (MBL) 2 gene polymorphism & its association with
clinical manifestations in systemic lupus erythematosus (SLE)
patients from western India. Indian J Med Res. 141:199–204. 2015.
View Article : Google Scholar : PubMed/NCBI
|
|
35
|
Onay H, Pehlivan M, Alper S, Ozkinay F and
Pehlivan S: Might there be a link between mannose binding lectin
and vitiligo? Eur J Dermatol. 17:146–148. 2007.PubMed/NCBI
|