Introduction
Uterine leiomyomas, also known as uterine fibroids,
is a benign smooth muscle tumor with symptoms including abdominal
discomfort or bloating, abnormal uterine bleeding, back ache and
urinary frequency, and always found during the middle and later
reproductive years (1). In
addition, it is one of the common reasons for surgical removal of
the uterus (2). As we all know,
fibroids run is closely related to estrogen, progesterone and
reproductive years (3). Specific
mutations of the mediator of RNA polymerase II transcription
subunit 12 (MED12) protein have been found in 70% percent of this
disease (4). However, the exact
cause of uterine leiomyomas has not been stated clearly. Therefore,
explore the exact cause of uterine fibroids and effective diagnosis
methods are urgent.
Recently, several genes were found to participate
into the molecular pathogenesis of uterine fibroids. For example,
fos proto-oncogene, AP-1 transcription factor subunit (c-FOS) was
found downregulated in uterine fibroids samples and also
participated into the pathway of serum response factor-Fos
proto-oncogene, AP-1 transcription factor subunit-JunB
proto-oncogene, AP-1 transcription factor subunit (SRF-FOS-JUNB)
pathway (5). In addition, Shen
et al (6)found that c-FOS
also involved in the pathways of estrogen receptor 1 (ERa) and
transforming growth factor β 1 (TGF-β) signaling, and both of these
pathways could control the uterine fibroids cells proliferation.
Besides, overexpression of high-mobility group I (HMGI) proteins
was verified to be important in the pathogenesis of this disease
(7). Furthermore, a drug trial of
Chuang et al (8) showed
that berberine could decrease the expression of cyclooxygenase 2
(COX2) and pituitary tumor-transforming gene 1 (PTTG1), and further
inhibit the cell proliferation and induce apoptosis of uterine
fibroids cells. These genes proved to play an important role in the
pathogenesis of uterine fibroid by previous studies. However, few
genes and their functions and involved pathways were verified for
diagnosis and treatment of this disease.
In order to find more target genes and reveal their
potential molecular mechanisms, comprehensive bioinformatics
approach was applied to screen differentially-expressed genes
(DEGs) in MED12 mutation leiomyoma samples and MED12 wild-type
leiomyoma samples compared with MED12 wild-type myometrium samples.
Functional and pathway enrichment analysis, pathway relation
network and gene co-expression network analysis were performed. The
aims of this study were to screening potential biomarkers of
uterine leiomyomas disease, especially target genes related to
MED12 mutation leiomyoma samples, and further study the molecular
mechanism of this disease.
Materials and methods
Gene expression data and
preprocessing
One gene expression profiling of GSE30673, including
10 MED12 wild-type myometrium samples, 8 MED12 mutation leiomyoma
samples and 2 MED12 wild-type leiomyoma samples, was downloaded
from Gene Expression Omnibus (GEO) database (http://www.ncbi.nlm.nih.gov/geo/) (4). This profiling was deposited on the
platform of Affymetrix Human Genome U133 Plus 2.0 Array
(HG-U133_Plus_2; Affymetrix, Santa Clara, CA, USA).
The raw data was downloaded and read by Affy package
of R-based software. Robust Multi-chip Average (RMA) method was
used to calculate the expression value of probes, which included
three steps of background correction, normalization and collection
(9).
Identification of DEGs
Compared with MED12 wild-type myometrium samples,
the DEGs in MED12 mutation leiomyoma samples and MED12 wild-type
leiomyoma samples were separately identified by Limma package.
Thereinto, Beniamini-Hochberg (BH) method was used for multiple
testing corrections and T-test in limma package was used to screen
the DEGs (10). Threshold for the
DEGs were set as P<0.05 and log2 fold-change (FC)|≥2. The
obtained two sets of DEGs were intersected to screen the common
DEGs based on the information of gene symbols. The DEGs in MED12
mutation leiomyoma samples, DEGs in MED12 wild-type leiomyoma
samples and the common DEGs were defined as group A, B and C.
Functional enrichment analysis and
pathway enrichment analysis
Gene Ontology (GO, http://geneontology.org/) is a useful model of
biology, which defines classes of gene functions (molecular
function, cellular component and biological process). In addition,
Kyoto Encyclopedia of Genes and Genomes (KEGG, http://www.genome.jp/kegg/) is a database for analysis
of high-level functions and utilities of the biological system. The
GO and KEGG pathway enrichment analysis of DEGs in group A, B and C
were separately performed by Database for Annotation Visualization
and Integrated Discovery (DAVID) online tool (11). P-value <0.05 was chosen as the
threshold.
Construction of pathway relation
network
The interactions in KEGG database are used to
construct the interaction network between pathways. Based on the
information of KEGG database, pathway relation network of three
groups were constructed and visualized by Cytoscape software
(12). The correlation coefficient
score >1 was shown in the network.
Construction of gene co-expression
network
In group C, DEGs which enriched in GO terms and
pathways, were intersected to screen the more important DEGs based
on the information of gene symbols. Then, based on the expression
value of these obtained DEGs, gene co-expression network was
constructed and visualized by Cytoscape software (12). The correlation coefficient score
>1 was shown in the network.
Cells and culture conditions
Uterine smooth muscle cell line PHM1-31 and human
leiomyosarcoma cell line SK-UT-1 was obtained from the cell bank of
our laboratory. Both cell lines were cultured in high-glucose DMEM
(Gibco; Thermo Fisher Scientific, Inc., Waltham, MA, USA) (10%
fetal calf serum and 1 mg/ml geneticin, 100 U/ml penicillin and 50
µg/ml streptomycin) in the atmosphere of 5% CO2 at
37°C.
Total RNA extraction and primer
design
Total RNA extraction from uterine smooth muscle cell
line PHM1-31 and human leiomyosarcoma cell line SK-UT-1 were
processed as described (13).
Based on human CASP1, ALDH1A, PROS1 and GADPH gene and their
transcript variant in gene bank, the primers was designed as
follows: CASP1 upstream, 5′-CGCAGATGCCCACCACT-3′ and downstream
primer, 5′-TGCCCACAGACATTCATACAG-3′; ALDH1A upstream,
5′-GCCAGGTAGAAGAAGGAGATAAGG-3′ and downstream primer,
5′-GTGGAGAGCAGTGAGAGGAGTTT-3′; PROS1 upstream,
5′-CAACATGCTAAAAGTCTTGG-3′ and downstream primer,
5′-GAAACATAAGTATAATTACAC-3′.GAPDH upstream
5′-TGATGACATCAAGAAGGTGGTGAAG-3′ and downstream primer,
5′-TCCTTGGAGGCCATGTGGGCCAT-3′.
Measurement of CASP1, ALDH1A, PROS1
and GADPH by qRT-PCR
All amplifcations were performed on the ABI 7900
real-time PCR instrument. According to the manufacturer'
guidelines, cDNA synthesis were processed using the PrimeScript™ RT
Master Mix (Takara Bio, Inc., Otsu, Japan). Each gene and sample
was repeated for 3 times. The reaction condition was 1 cycle of
95°C for 10 min, 40 cycles of 95°C for 15 sec, and 60°C for 1 min.
SYBR Premix Ex Taq™ (Takara Bio, Inc.) was used the following PCR
procedure.
Results
Screening of DEGs
Based on the threshold of P<0.05 and |log2 FC|
>2, a total of 1,258 DEGs in MED12 mutation leiomyoma samples
compared with MED12 wild-type myometrium samples were screened,
including 646 upregulated and 612 downregulated DEGs. Besides,
compared with MED12 wild-type myometrium samples, total 1,571 DEGs
in MED12 wild-type leiomyoma samples were also identified,
including 726 upregulated and 845 downregulated DEGs. Taking the
intersection of DEGs in group A and B, a total of 391 DEGs were
obtained, such as F11 receptor (F11R), relaxin/insulin-like family
peptide receptor 1 (RXFP1) and ferredoxin reductase (FDXR).
GO functional and KEGG pathway
enrichment analysis
After enrichment analysis, the 1,258 DEGs of group A
were significant enriched into various functions including
extracellular matrix organization, cell adhesion and extracellular
matrix disassembly (P<0.05). These DEGs also enriched into
pathways of extracellular matrix (ECM)-receptor interaction, focal
adhesion and P13K-Akt signaling pathway (P<0.05, Table I). In addition, the 1,571 DEGs of
group B were mainly related to cell adhesion, extracellular matrix
organization and blood coagulation (P<0.05, Table II). Meanwhile, these genes also
enriched into pathways of P13K-Akt signaling pathway, pathways in
cancer and focal adhesion (P<0.05, Table II). As shown in Table III, the common DEGs were
significantly enriched in GO terms of extracellular matrix
organization, collagen catabolic process and positive regulation of
apoptotic process, and pathways of cytokine-cytokine receptor
interaction, ECM-receptor interaction and amoebiasis (P<0.05,
Table III).
 | Table I.The top 5 enriched GO terms and
pathways for DEGs in group A. |
Table I.
The top 5 enriched GO terms and
pathways for DEGs in group A.
| GO ID | GO name | Diff gene counts in
GO | Enrichment score | P-value | Gene symbols |
|---|
| GO:0030198 | Extracellular matrix
organization | 49 | 13.62996005 | 2.04E-40 | COL16A1, COL4A2,
COL23A1, COL4A1, COL21A1, MMP11, COL5A1, FN1, MMP13, CR61, SMOC2,
POSTN, COL6A3, CTSG, HSPG2, MMP16, TPSAB1, RXFP1, B4GALT1, COL4A4,
ADAMTS2, COL9A2, COL1A1, TGFBI, TNFRSF11B, COL3A1, COL4A3, TGFB2,
COL1A2, COL11A1, EFEMP1, EGFL6, COL22A1, COL4A6, ECM2, COL6A6,
ITGA5, LGALS3, MFAP2, COL2A1, FBN2, FBLN1, COL5A2, TGFB3, LEPREL1,
OLFML2B, COL12A1, PXDN, MMP7 |
| GO:0007155 | Cell adhesion | 49 | 6.304607073 | 3.24E-24 | B4GALT1, CCL2, CDH2,
NEGR1, FN1, OMD, FLRT2, CCL4, TGFBI, ADAM23, WISP2, LAMC3, DPT,
PERP, COMP, HAPLN1, SUSD5, POSTN, ITGA9, THBS4, CDH11, DPP4,
NLGN4X, CD36, COL5A1, EFNB2, BCAN, F11R, ITGA5, COL4A6, VCAN,
COL16A1, CD97, COL6A3, GPNMB, ADAM12, NRP2, CLDN10, NCAM1, COL6A6,
SELE, COL12A1, CNTN1, COL4A3, MMRN1, LOXL2, TNC, SRPX, EGFL6 |
| GO:0022617 | Extracellular matrix
disassembly | 24 | 17.74606011 | 2.62E-23 | COL3A1, TPSAB1,
COL16A1, COL4A1, MMP11, COL5A1, COL2A1, COL4A2, MMP16, MMP13,
COL1A2, COL9A2, COL6A6, COL1A1, COL4A3, COL12A1, COL5A2, CTSG,
COL23A1, COL4A6, MMP7, COL11A1, COL6A3, COL4A4 |
| GO:0030574 | Collagen catabolic
process | 23 | 18.66006436 | 5.96E-23 | MMP11, COL4A3,
COL23A1, COL2A1, COL5A1, COL11A1, COL4A1, COL16A1, COL4A4, MMP16,
MMP13, MMP7, COL1A1, ADAMTS2, COL6A3, COL6A6, COL12A1, COL3A1,
COL9A2, COL4A6, COL4A2, COL1A2, COL5A2 |
| GO:0007165 | Signal
transduction | 69 | 3.913178545 | 1.45E-21 | CCL2, PDE2A, MET,
HPGDS, PDE10A, IL15, TENM4, GRIA2, TNFRSF11B, LRP12, ANXA1, TLR3,
CASP1, WISP2, CHRNA1, PDE11A, ERBB3, RORA, BST2, RND2, CRABP2,
IRS1, INPP4B, PRKD1, RGS1, SMC3, CDC42EP3, CCL4, FGF13, RGS5, CD48,
MAPK10, NDP, PPP1R1A, GUCY1A2, NR4A2, C3, TNFSF10, ADORA3, TEK,
DTNA, EDNRA, EPAS1, GABRB3, ARHGAP15, WISP3, NR4A1, FCGR1A, SMOC2,
PDE4D, PSD, FGF9, PRKAA2, UNC5D, IGFBP6, PPARG, IL7R, APOL3,
CXCL14, PRKCH, ECM1, PIK3R1, GNG11, PRKCB, IGFBP5, XCL1, CYTL1,
NR3C2, NDRG2 |
|
| Pathway
ID | Pathway
name | Diff gene counts
in pathway | Enrichment
score | P-value | Gene
symbols |
|
| 4512 | ECM-receptor | 25 | 16.78566509 | 1.48E-23 | COL6A6, COMP, COL6A3,
COL4A4, COL4A6, COL5A1, HSPG2, ITGA5, FN1, THBS4, COL11A1, COL5A2,
COL4A1, TNC, LAMC3, COL1A1, COL4A3, COL1A2, ITGA9, CD36, TNN, SDC1,
COL4A2, COL2A1, COL3A1 |
| 4510 | Focal adhesion
interaction | 34 | 9.641164531 | 4.65E-23 | COL4A3, THBS4,
COL4A6, CCND1, COL4A4, MYLPF, FYN, COL4A2, COL4A1, ITGA5, TNN,
COL1A2, FN1, SHC3, MAPK10, ITGA9, COL11A1, MET, COL5A2, COL2A1,
COL3A1, PRKCB, COL5A1, BIRC3, JUN, TNC, COMP, FIGF, PDGFC, COL1A1,
LAMC3, COL6A3, PIK3R1, COL6A6 |
| 4151 | PI3K-Akt signaling
pathway | 42 | 7.070296281 | 8.27E-23 | MYC, MET, COL3A1,
PRKAA2, COL2A1, COMP, COL4A1, FGF13, COL1A2, F2R, GNG11, COL1A1,
MCL1, FN1, COL11A1, FGF9, COL6A6, TLR4, ITGA9, COL4A6, COL4A2,
PIK3R1, COL4A4, IL7R, TNN, LAMC3, THBS4, COL4A3, FIGF, COL6A3,
CCND1, IRS1, TEK, TNC, ITGA5, SGK1, COL5A2, PDGFC, COL5A1, PRL,
LPAR6, NR4A1 |
| 5146 | Amoebiasis | 23 | 12.32591407 | 1.95E-18 | COL11A1, CTSG,
COL5A2, LAMC3, IL1R1, COL4A6, SERPINB1, TGFB3, COL4A4, COL1A1,
TLR4, COL5A1, COL2A1, TGFB2, FN1, PIK3R1, COL4A1, COL3A1, PRKCB,
COL4A2, PLCB4, COL1A2, COL4A3 |
| 4974 | Protein digestion and
absorption | 20 | 13.27593512 | 7.53E-17 | COL2A1, COL4A2,
COL3A1, COL11A1, COL4A3, COL12A1, COL6A6, COL1A1, COL5A1, COL1A2,
COL5A2, COL4A1, COL4A6, DPP4, COL9A2, COL21A1, CPA3, COL22A1,
COL4A4, COL6A3 |
| Table II.The top 5 enriched GO terms and
pathways for DEGs in group B. |
Table II.
The top 5 enriched GO terms and
pathways for DEGs in group B.
| GO ID | GO name | Diff gene counts in
GO | Enrichment score | P-value | Gene symbols |
|---|
| GO:0007155 | Cell adhesion | 57 | 5.737272852 | 4.76E-26 | CCL4, VCL, F11R,
PRKCA, PERP, CD36, NEGR1, OMD, PECAM1, ADAM23, NCAM1, PCDHA1, CHL1,
ROBO2, CLDN10, CXCR7, CDH3, CD58, COL16A1, COL6A6, CLDN1, COL5A1,
PCDHAC2, MMRN1, EMILIN1, ADAM22, SVEP1, PCDHB15, DPP4, BOC, LSAMP,
TGFBI, DPT, FLRT2, FLRT1, SRPX, CCL2, CNTN3, ITGA6, COL4A3, FLRT3,
CDH2, LOXL2, DSG2, SELE, CDON, CNTN1, GPNMB, COL4A6, MSLN, CTNNA2,
ITGBL1, CD H17, NRP2, WISP2, SPP1, EDIL3 |
| GO:0030198 | Extracellular
matrix organization | 38 | 8.268958333 | 2.18E-23 | COL6A6, CTSK,
CCDC80, SOX9, COL4A3, TGFBI, MMP7, LOXL1, COL1A2, COL4A6, COL16A1,
COL11A1, MFAP5, LEPREL1, EFEMP1, MMP16, LGALS3, FBN2, COL4A5,
TNFRSF11B, COL4A4, COL27A1, ADAMTS2, MMP10, CYR61, SERPINH1, ECM2,
COL11A2, COL4A2, PXDN, RXFP1, EMILIN1, COL5A2, COL5A1, COL1A1,
TGFB2, ITGA6, COL4A1 |
| GO:0007596 | Blood
coagulation | 47 | 4.618823925 | 9.15E-18 | COL1A2, VCL, IGF2,
PROS1, COL1A1, DGKB, CD58, CDK5, PRKCH, LRP8, ITGA4, PECAM1,
RASGRP1, PRKCA, ATP2B2, LRRC16A, SERPINA1, HBB, PDE3B, GUCY1A3,
TGFB2, ZFPM2, ENPP4, F2RL2, CD36, TEK, PDE5A, PRKCB, PLA2G4A, THBD,
TFPI2, KCNMA1, DOCK11, SPARC, F11R, GATA5, SRGN, F2RL1, F3, CFD,
TFPI, MAFF, CXADR, LEFTY2, ITGA6, MMRN1, HGF, |
| GO:0001525 | Angiogenesis | 31 | 7.047776741 | 3.38E-17 | PRKCA, FGFR1,
HTATIP2, CCL2, ANG, TEK, TSPAN12, HOXB3, TGFBI, ARHGAP22, SOX17,
ENPEP, EPHB1, TGFB2, PDE3B, PTGS2, KDR, NRP2, FGF9, THSD7A, SHB,
SCG2, SAT1, COL4A2, KLF5, ID1, CXCR7, MEOX2, CALCRL, ESM1,
COL4A1 |
| GO:0007165 | Signal
transduction | 70 | 3.105612864 | 1.91E-16 | ERBB3, SPARC,
CASP1, BST2, LRP8, PLCB1, CCL4, PRKCA, CD83, EDNRA, SPOCK3, EPS8,
EPO, GNG11, NDP, FGF9, TEK, PDE3B, CRABP2, ADRA1A, ARHGAP15, PRKCH,
ASB2, PECAM1, SKAP2, NR2F2, SOX9, FGF13, RASD1, VLDLR, C3, PPP1R1A,
TSPAN8, CXCL10, TENM4, GPRC5A, PDE5A, ARHGEF7, ARHGAP22, RASGRP1,
SHB, TNFSF10, ANXA1, PRKCB, CHN1, DAPK1, IGFBP6, RASSF9, CXCL14,
AKT3, CCL2, CRHBP, GRIA2, XCL1, CDC42EP3, SIGIRR, ERG, CLIC2,
IL11RA, TNFRSF11B, CHL1, PRKAA2, TENM2, WISP2, SH3GL2, IL15,
RASSF2, RGS1, DTNA, DAPP1 |
|
| Pathway
ID | Pathway
name | Diff gene counts
in pathway | Enrichment
score | P-value | Gene
symbols |
|
| 4151 | PI3K-Akt signaling
pathway | 40 | 5.267651297 | 3.01E-17 | FGF9, EPO, COL4A1,
ITGA6, SPP1, PRKCA, CDKN1A, COL4A5, COL11A1, CCND1, PRLR, ITGA4,
CDK6, AKT3, FGF8, COL4A4, COL1A2, KDR, COL4A3, PRKAA2, COL6A6,
CCNE2, COL5A2, COL1A1, MCL1, HGF, LPAR4, SGK1, PRL, COL4A2, COL4A6,
COL11A2, MDM2, COL27A1, GNG11, TEK, FGF13, FGFR1, CCND2,
COL5A1 |
| 5200 | Pathways in
cancer | 35 | 4.891102829 | 3.04E-14 | TGFB2, FOS, PRKCA,
CDH1, CCND1, PRKCB, CCNE2, MDM2, COL4A5, HGF, WNT2, COL4A4, FGFR1,
CKS2, FZD2, WNT4, ITGA6, FGF9, COL4A3, COL4A2, FGF13, WNT2B,
CDKN2B, COL4A1, BIRC3, MECOM, FGF8, PTCH1, PTGS2, CDK6, DAPK1,
CTNNA2, CDKN1A, AKT3, COL4A6 |
| 4510 | Focal adhesion | 28 | 6.211225728 | 3.33E-14 | COL11A1, COL6A6,
BIRC3, SPP1, KDR, MYLK, COL4A4, ITGA6, COL5A1, CCND1, COL4A2,
PRKCA, ITGA4, COL11A2, PRKCB, COL5A2, COL1A2, COL4A6, COL4A3,
MYL12A, CCND2, COL4A1, COL27A1, COL4A5, COL1A1, AKT3, HGF, VCL |
| 4512 | ECM-receptor
interaction | 19 | 9.979777299 | 8.39E-14 | COL1A1, COL5A1,
COL4A4, COL4A3, COL11A2, COL4A6, CD36, COL4A2, COL11A1, COL4A1,
COL4A5, COL5A2, SPP1, COL27A1, COL6A6, COL1A2, SDC1, ITGA6,
ITGA4 |
| 4514 | Cell adhesion
molecules (CAMs) | 23 | 7.198822774 | 3.02E-13 | SELE, CDH1, CDH3,
CLDN1, CDH2, PTPRC, SDC1, F11R, CLDN10, CLDN11, NCAM1, LRRC4C,
CD58, VTCN1, ITGA4, HLA-E, ITGA6, PECAM1, CD8A, CNTN1, NEGR1,
CLDN3, LRRC4B |
| Table III.The top 5 enriched GO terms and
pathways for DEGs in group C. |
Table III.
The top 5 enriched GO terms and
pathways for DEGs in group C.
| GO ID | GO name | Diff gene counts in
GO | Enrichment
score | P-value | Gene symbols |
|---|
| GO:0030198 | Extracellular
matrix organization | 26 | 14.18120104 | 6.85E-22 | COL4A1, EFEMP1,
COL11A1, COL4A3, LEPREL1, ADAMTS2, MMP16, COL5A1, COL4A4, TGFB2,
COL1A2, TNFRSF11B, COL5A2, CYR61, RXFP1, TGFBI, PXDN, COL4A2, MMP7,
COL1A1, FBN2, ECM2, LGALS3, COL16A1, COL6A6, COL4A6, |
| GO:0030574 | Collagen catabolic
process | 15 | 23.86259791 | 1.46E-16 | COL5A1, COL4A1,
COL1A1, COL11A1, COL4A4, COL4A3, COL4A6, COL6A6, COL4A2, ADAMTS2,
COL5A2, MMP7, COL1A2, MMP16, COL16A1 |
| GO:0043065 | Positive regulation
of apoptotic process | 21 | 12.20989781 | 1.63E-16 | HOXA13, HOXA5,
DUSP1, MAP3K5, TGFB2, TNFSF10, CNR1, KCNMA1, SRPX, ID3, CSRNP3,
PTPRC, PTGS2, ALDH1A2, G0S2, SFRP1, GZMA, GRIN2A, CYR61, SFRP4,
MSX1 |
| GO:0007155 | Cell adhesion | 28 | 7.064169954 | 2.01E-15 | NRP2, CDH2, OMD,
COL16A1, COL4A6, MMRN1, LOXL2, DPP4, SELE, GPNMB, NCAM1, SRPX,
F11R, FLRT2, COL4A3, CCL2, ADAM23, WISP2, CNTN1, DPT, PERP, NEGR1,
CLDN10, CD36, CCL4, TGFBI, COL5A1, COL6A6 |
| GO:0022617 | Extracellular
matrix disassembly | 14 | 20.29831113 | 1.76E-14 | MMP7, COL4A1,
COL1A2, COL16A1, COL5A1, COL1A1, COL4A3, COL11A1, COL4A4, COL6A6,
MMP16, COL4A6, COL5A2, COL4A2 |
|
| Pathway
ID | Pathway
name | Diff gene counts
in pathway | Enrichment
score | P-value | Gene
symbols |
|
| 4060 | Cytokine-cytokine
receptor interaction | 20 | 8.579810485 | 7.63E-13 | IL1R1, CCL5,
IL20RA, LIFR, XCL1, INHBA, CXCL2, TNFRSF11B, LEPR, IL15, PRL, CCL2,
IL6ST, TNFSF10, IL17B, CCL4, CXCL14, CCL14, TGFB2, BMPR1B |
| 4512 | ECM-receptor
interaction | 13 | 17.11524264 | 1.60E-12 | COL4A3, COL4A1,
COL6A6, COL1A2, COL4A2, COL11A1, COL5A1, SDC1, COL4A4, CD36,
COL4A6, COL5A2, COL1A1 |
| 5146 | Amoebiasis | 14 | 14.71162 | 1.79E-12 | COL4A6, PLCB4,
COL4A3, COL11A1, COL1A1, PRKCB, COL4A2, COL5A1, IL1R1, COL4A1,
TGFB2, COL1A2, COL5A2, COL4A4 |
| 4974 | Protein digestion
and absorption | 12 | 15.619155 | 3.74E-11 | COL5A1, COL5A2,
COL4A6, COL11A1, COL4A1, COL4A3, COL4A2, COL6A6, COL4A4, COL1A1,
DPP4, COL1A2 |
| 4151 | PI3K-Akt signaling
pathway | 20 | 6.601756194 | 9.08E-11 | FGF9, FGF13, GNG11,
COL11A1, PRKAA2, COL6A6, SGK1, COL1A1, COL1A2, COL4A6, COL5A1, TEK,
PRL, MCL1, COL4A3, COL5A2, COL4A4, CCND1, COL4A2, COL4A1 |
Construction of pathway relation
network
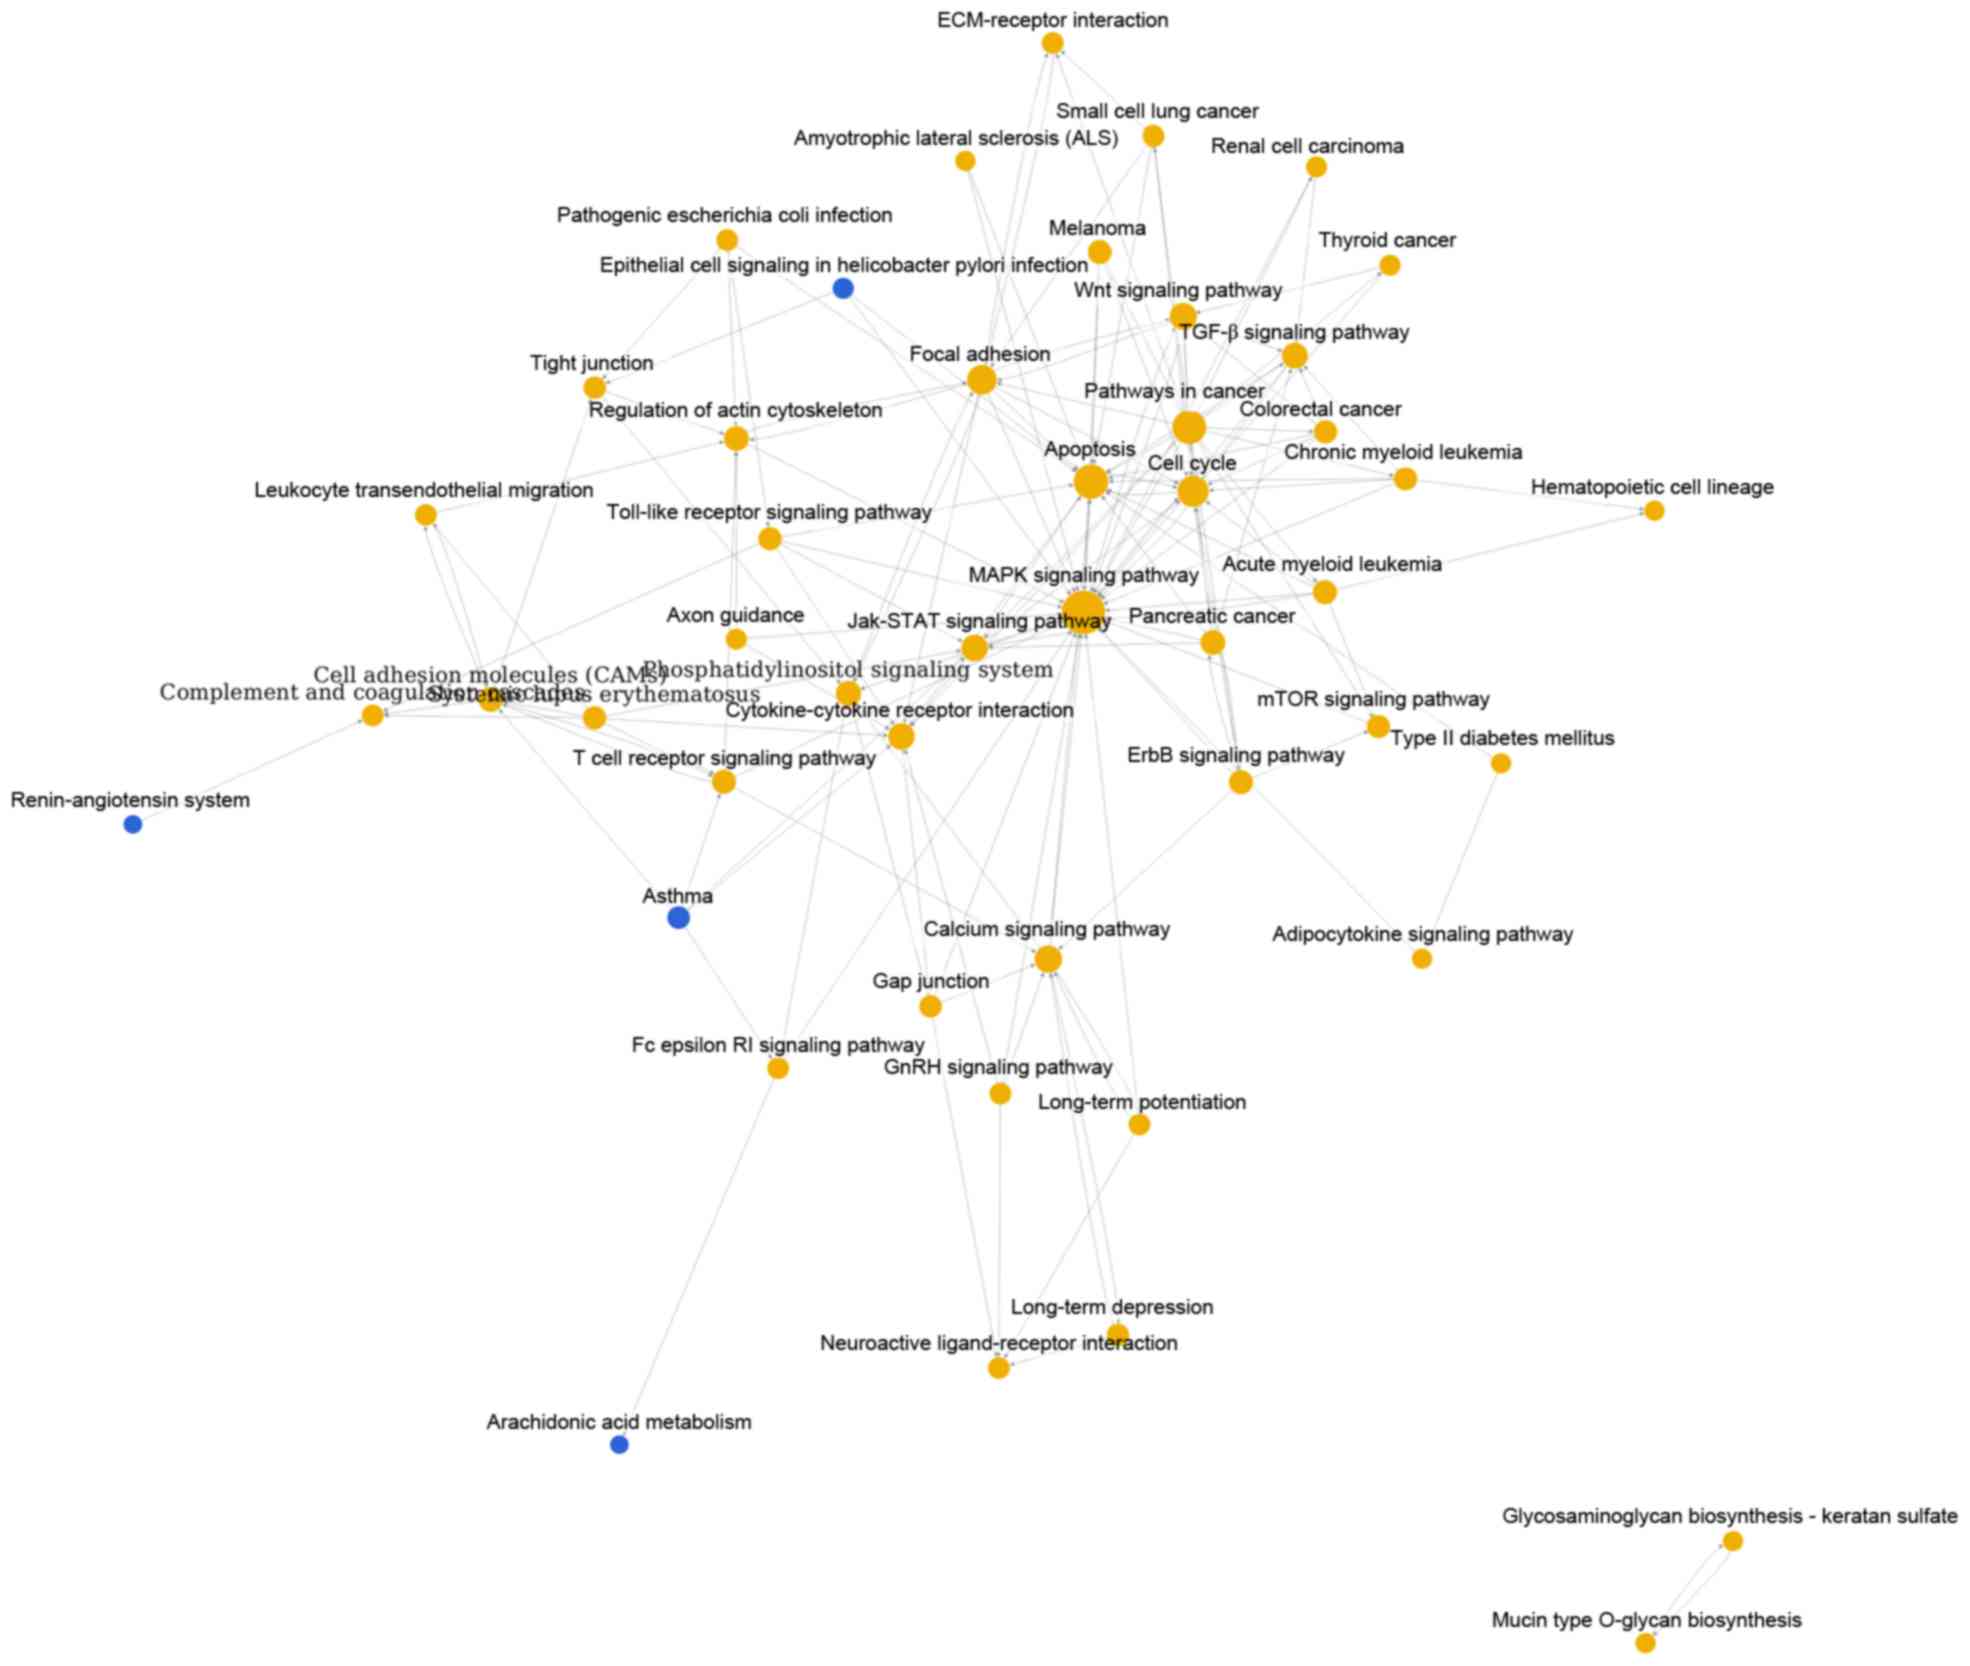
As shown in Fig. 1,
pathway relation network of group A with 48 nodes and 157 edges was
constructed. The top 3 significant pathways with higher degrees
were mitogen-activated protein kinase (MAPK) signaling pathway
(degree = 31), apoptosis (degree = 20) and pathways in cancer
(degree = 19). Interestingly, there were four downregulated
pathways including epithelial cell signaling in helicobacter pylori
infection, asthma, renin-angiotensin system and arachidonic acid
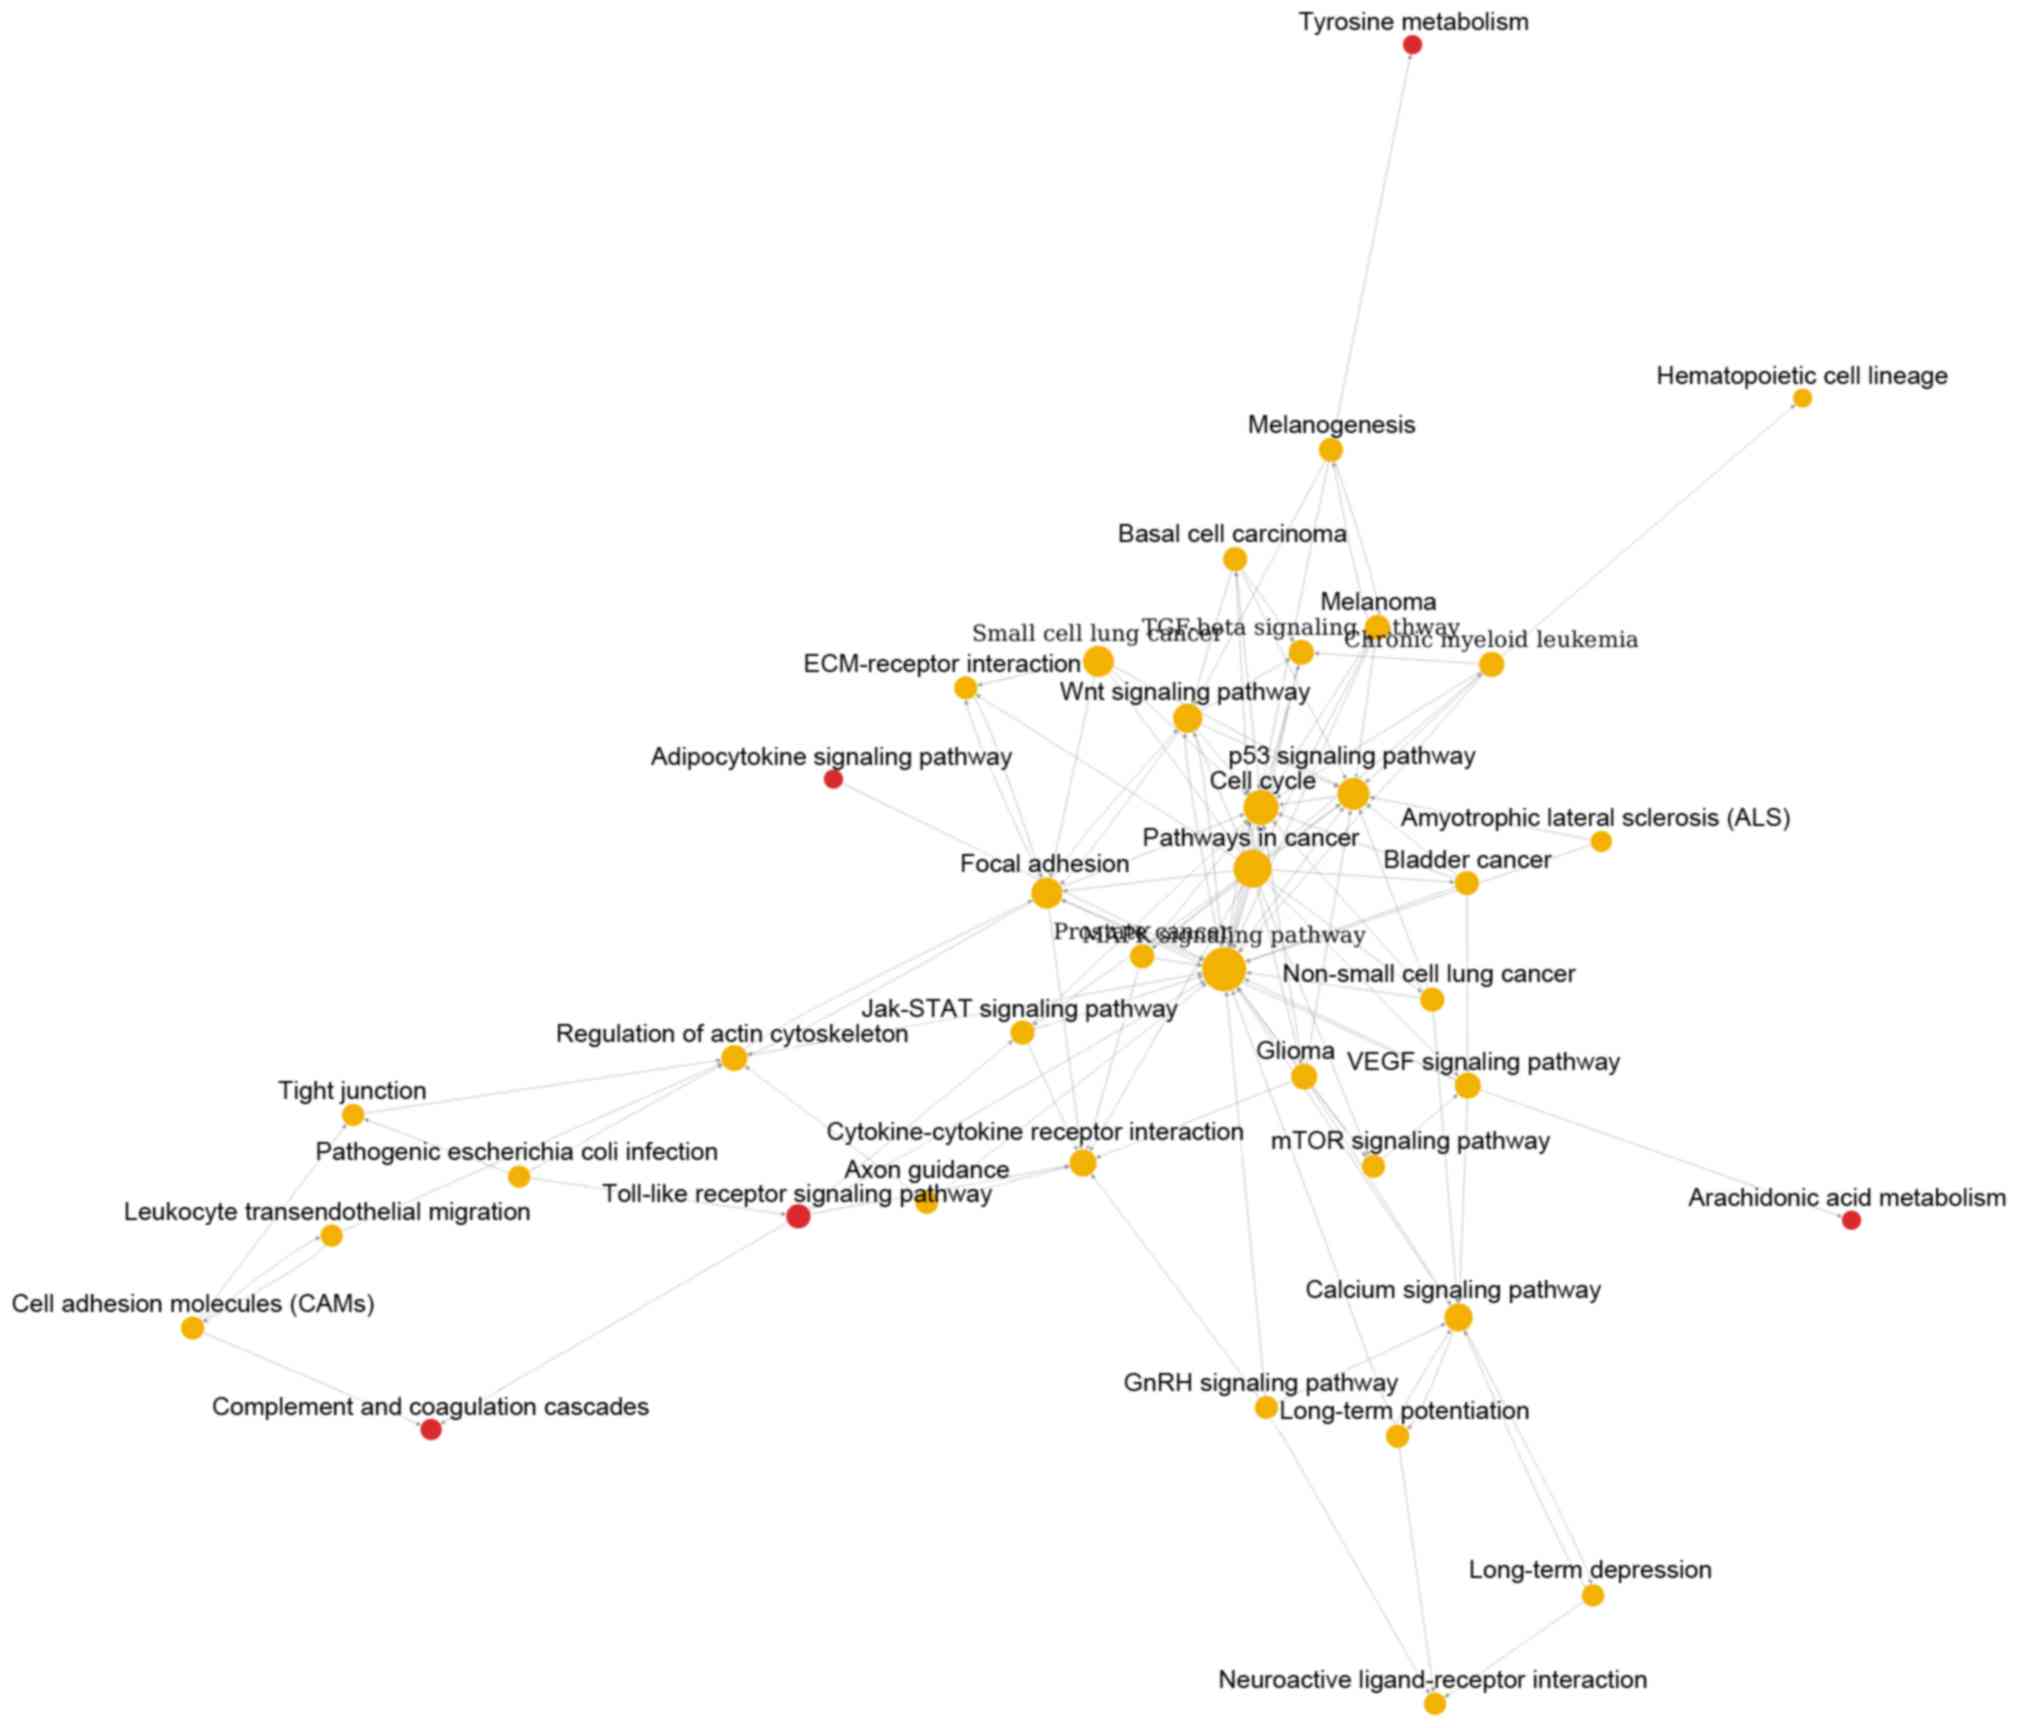
metabolism. Similarly, Fig. 2
showed the pathway relation network of group B (39 nodes and 119
edges). In addition, this network was with 5 upregulated pathways,
such as toll-like receptor signaling pathway and complement and
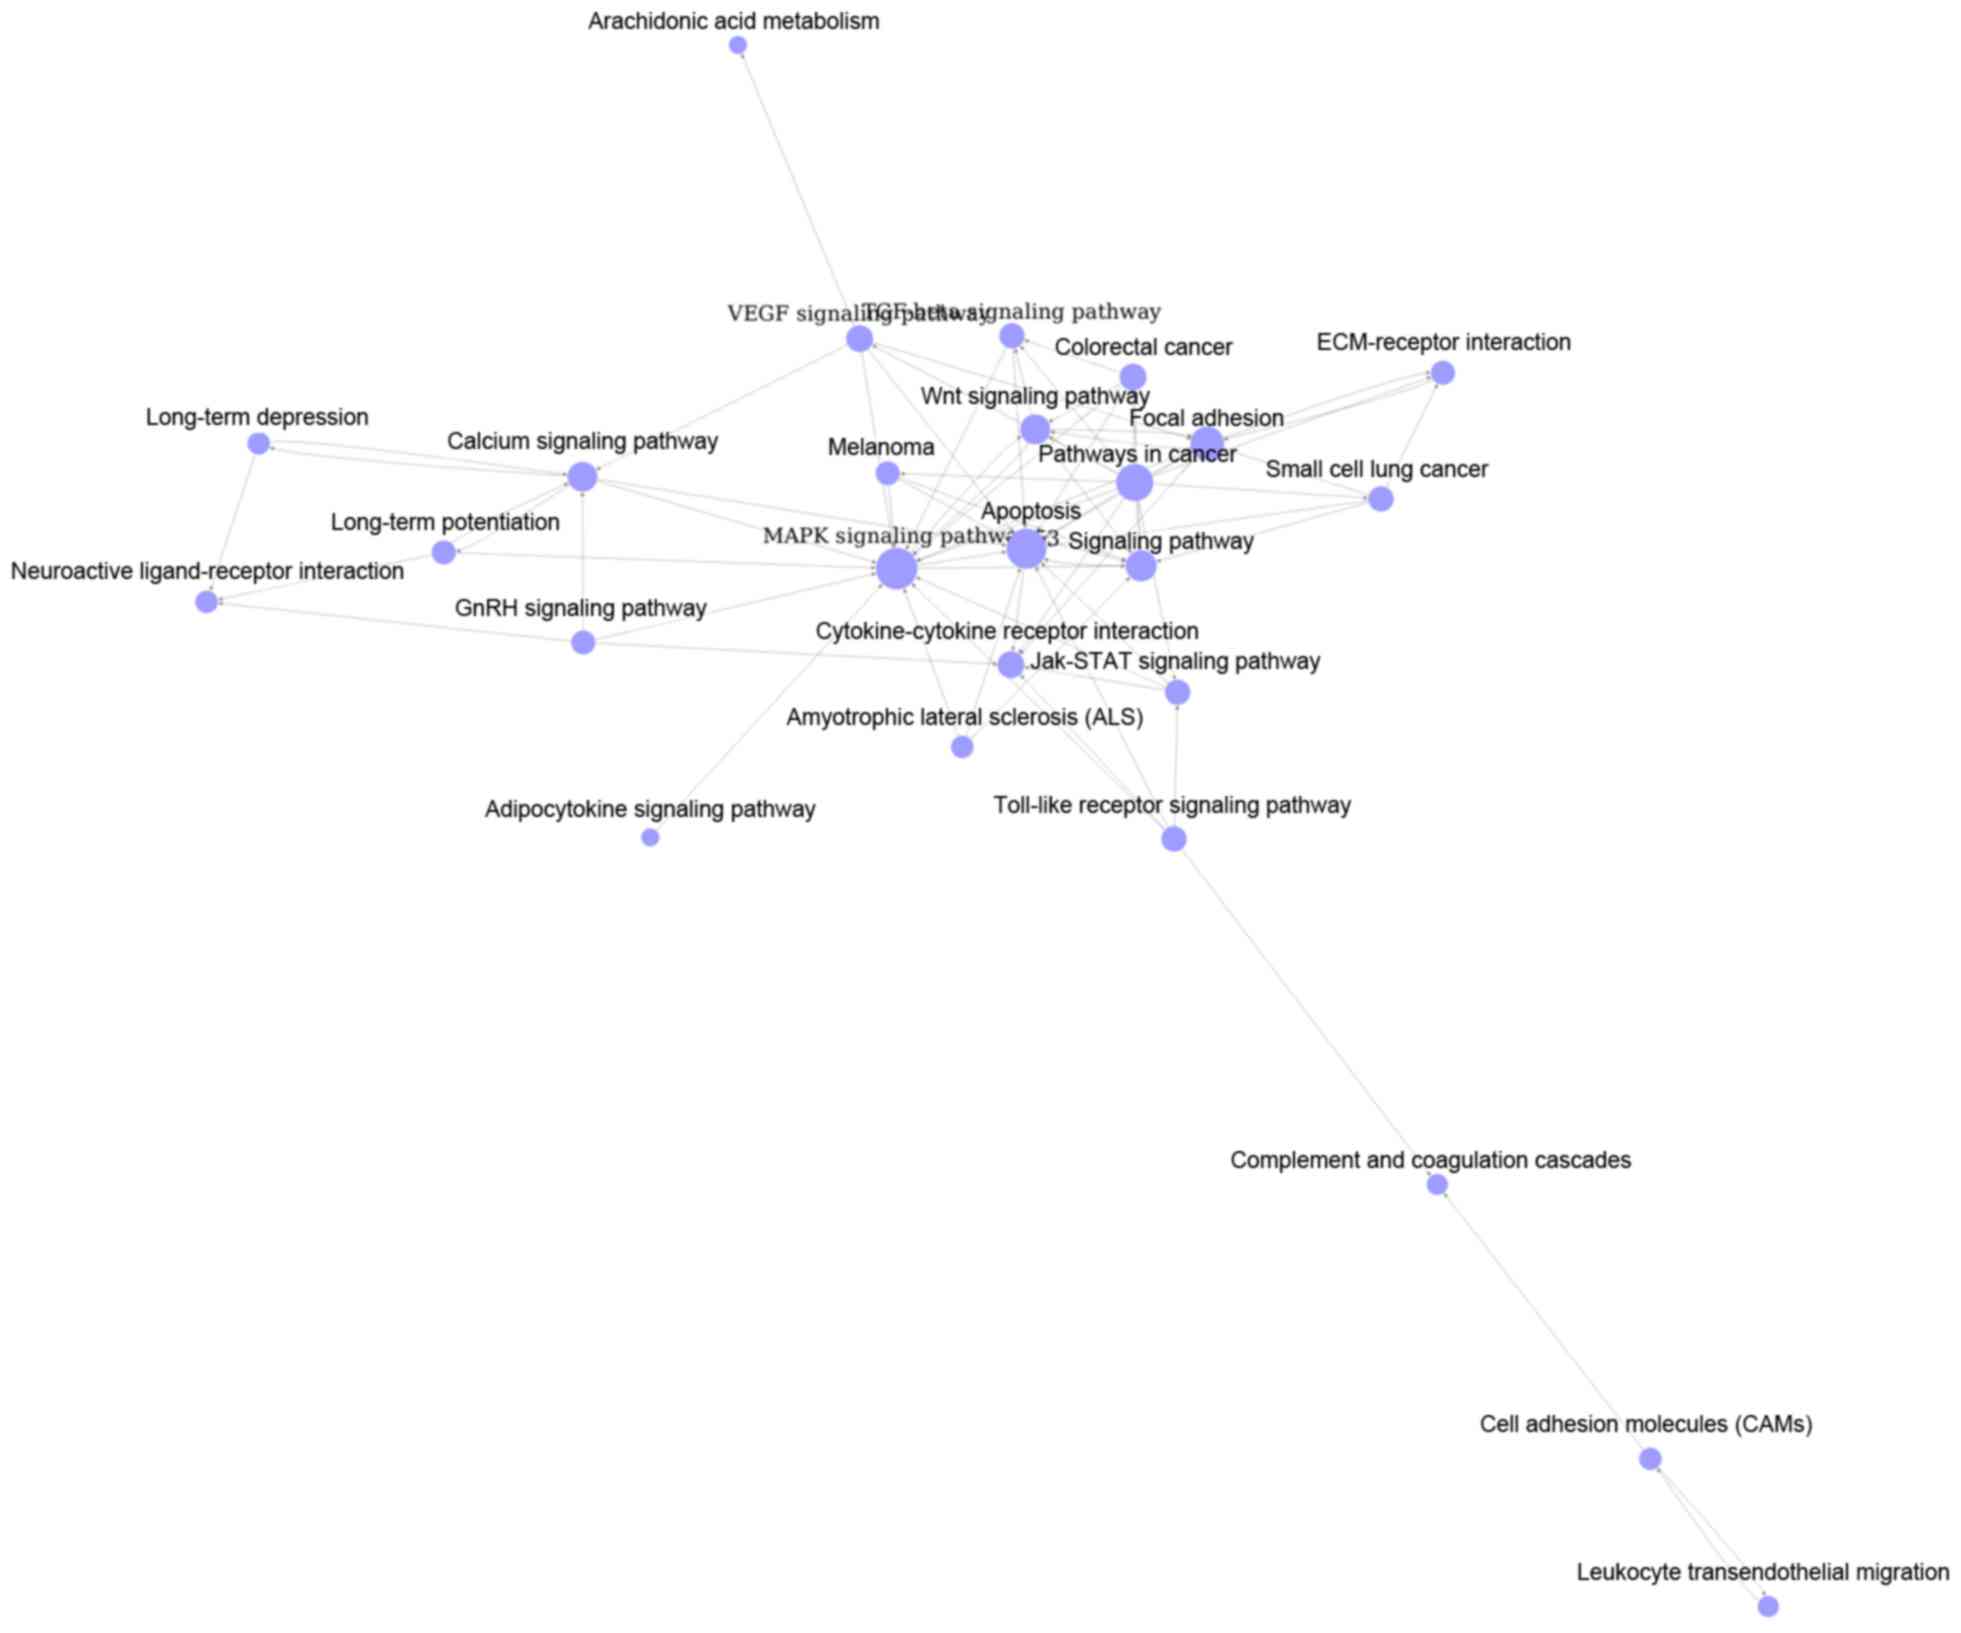
coagulation cascades. Besides, the pathway relation network of
group C with 28 nodes and 76 degrees were shown in Fig. 3. Top 3 significant pathways with
higher degrees were MAPK signaling pathway (degree = 17), apoptosis
(degree = 15) and pathways in cancer (degree = 13).
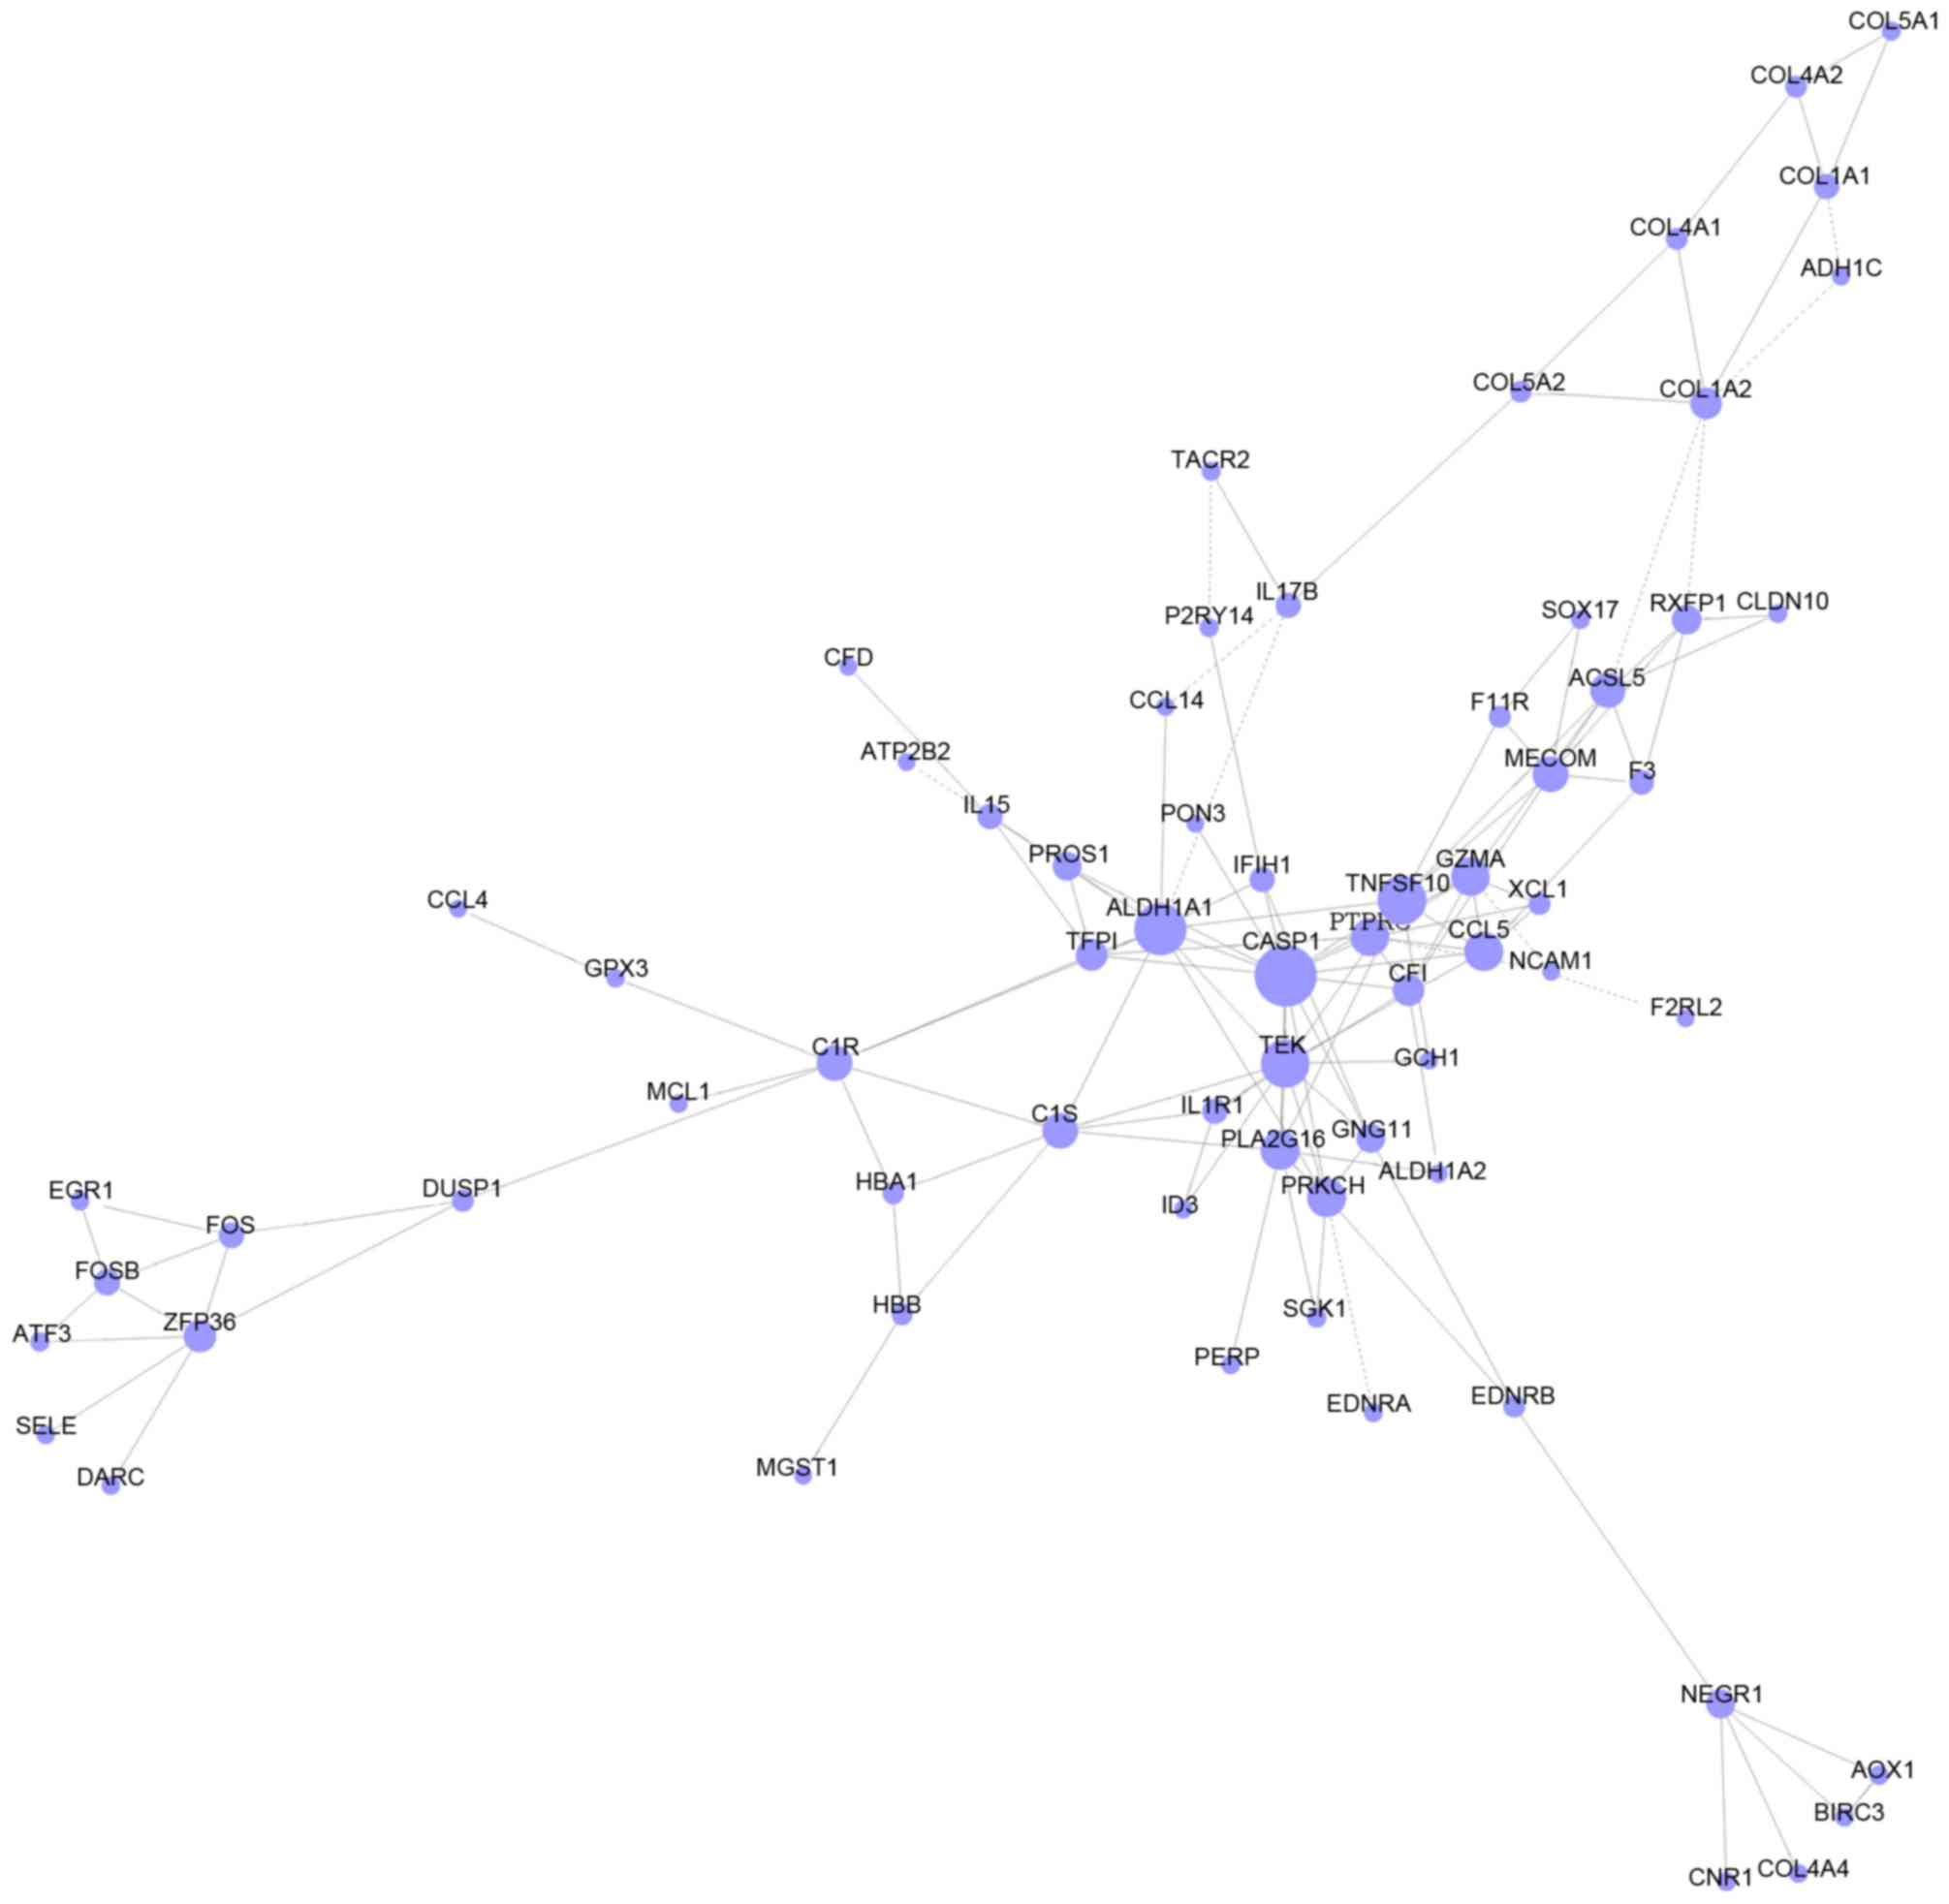
Construction of gene co-expression
network
DEGs, which enriched in GO terms and pathways in
group C were intersected to screen the more important DEGs based on
the information of gene symbols. As a result, a total of 135
important DEGs were obtained, including Acyl-CoA synthetase
medium-chain family member 3 (ACSM3), protein S (α) (PROS1) and F11
receptor (F11R) (Table IV). As
shown in Fig. 4, gene
co-expression network with 68 nodes and 133 edges was constructed.
Thereinto, the hub nodes included caspase 1 (CASP1, degree = 14),
aldehyde dehydrogenase 1 family member A1 (ALDH1A1, degree = 12),
tumor necrosis factor superfamily member 10 (TNFSF10, degree = 11)
and TEK receptor tyrosine kinase (TEK, degree = 11).
| Table IV.The top 10 intersected important DEGs
of GO terms and pathways in group C. |
Table IV.
The top 10 intersected important DEGs
of GO terms and pathways in group C.
| Gene symbol | Accession no. | Gene
description | Biotype | GO ID | Pathway ID |
|---|
| ACSM3 | NM_005622 | Acyl-CoA synthetase
medium-chain family member 3 | Coding | GO:0008217 | 01100 |
| PROS1 | NM_000313 | Protein S (α) | Coding | GO:0007596,
GO:0030168, GO:0006508, GO:0045087, GO:0030449, GO:0002576,
GO:0050900 | 04610 |
| F11R | NM_016946 | F11 receptor | Coding | GO:0007155,
GO:0007596, GO:0006954, GO:0050900, GO:0007179, GO:0019048,
GO:0045216 | 04514, 04670 |
| RXFP1 | NM_001253727 |
Relaxin/insulin-like family peptide
receptor 1 | Coding | GO:0030198,
GO:0030154 | 04080 |
| CXCL14 | NM_004887 | Chemokine (C-X-C
motif) ligand 14 | Coding | GO:0006955,
GO:0007267, GO:0007165, GO:0006935 | 04060, 04062 |
| RIMS2 | NM_001100117 | Regulating synaptic
membrane exocytosis 2 | Coding | GO:0042391,
GO:0030073 | 04911 |
| EDNRA | NM_001166055 | Endothelin receptor
type A | Coding | GO:0008217,
GO:0032496, GO:0007165, GO:0007507, GO:0007568, GO:0043066,
GO:0008283, GO:0019233, GO:0008284, GO:0001934, GO:0007186,
GO:0050678, GO:0007204, GO:0001666, GO:0071260, GO:0051281,
GO:0043278, GO:0060137, GO:0003094 | 04080, 04020,
04270 |
| ZFP36 | NM_003407 | ZFP36 ring finger
protein | Coding | GO:0000122,
GO:0006950 | 05166 |
| EDNRB | NM_000115 | Endothelin receptor
type B | Coding | GO:0008217,
GO:0007166, GO:0007568, GO:0000122, GO:0043066, GO:0019233,
GO:0008284, GO:0001934, GO:0050678, GO:0007204, GO:0007399,
GO:0048246, GO:0048265, GO:0019934 | 04080, 04020 |
| SOXs17 | NM_022454 | SRY (sex
determining region Y)-box 17 | Coding | GO:0001525,
GO:0000122, GO:0045944, GO:0030308, GO:0001706, GO:0060070,
GO:0031648, GO:0090090, GO:0045893, GO:0072001 | 04310 |
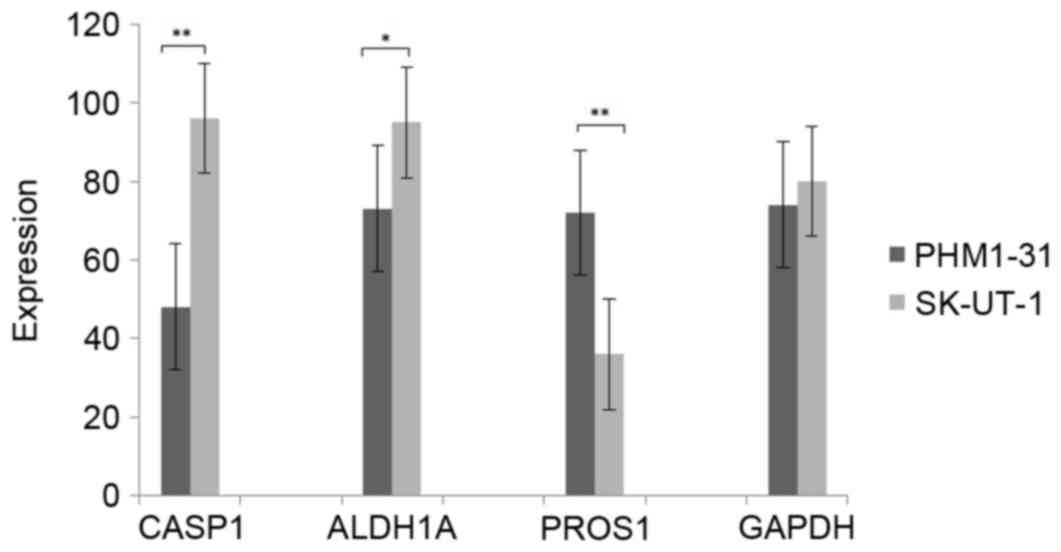
The expression of CASP1, ALDH1A, PROS1
and GADPH in uterine leiomyomas and control samples
The expression of CASP1, ALDH1A, PROS1 and GADPH
were measured by qRT-PCR. As shown in Fig. 5, the expression of CASP1 and ALDH1A
was significant higher in leiomyosarcoma cell line SK-UT-1 than
that in uterine smooth muscle cell line PHM1-31. However, the
expression of PRPS1 was significant lower in leiomyosarcoma cell
line SK-UT-1. These results were consistent with above
bioinformatics analysis.
Discussion
Uterine leiomyomas disease is one of the most common
benign smooth muscle tumors of uterus (14). In order to research more effective
treatment methods, numerous studies have revealed various
particular genes and pathways which are closely related with the
development of uterine leiomyomas (15,16).
Recently, the bioinformatics methods were performed to research the
molecular mechanism of uterine leiomyomas disease. In this study,
CASP1, ALDH1A1, PROS1, hematopoietic prostaglandin D synthase
(HPGDS) and carbonyl reductase 3 (CBR3) were found differentially
expressed in uterine leiomyomas disease samples.
CASP1 is an evolutionarily conserved enzyme, which
plays important role in inflammatory immune response. It is highly
expressed in various immune organs including spleen, kidney, liver
and blood. The expression value of CASP1 is positively related to
the inflammatory response and also with many other functions,
including proteolytic cleavage, pyroptosis response and inducing
necrosis. In addition, an increased inflammatory environment may
cause leiomyomas, and further induce negatively impact (17). In psoriasis patients, Thirupaithi
et al (18) undertook
western blot experiments and found that CASP1 could be suppressed
by Th-1 response for methotrexate and involved in
immunopathogenesis. Gloria-Bottini et al (19) also found that the pathogenesis of
uterine leiomyomas was closely related with the chronically
inflammatory state. Except the pathway of innate immune response,
CASP1 was also found to be enriched in signal transduction and
apoptotic process and with higher expression level in uterine
leiomyomas samples in this study. Likewise, Christman et al
(20) showed that characters of
uterine leiomyomas were decreased apoptosis and alterations in
various signaling pathways, such as Notch signaling pathway.
Therefore, we infer that CASP1 may be an attractive target of
uterine leiomyomas by participating pathways including immune
response, signal transduction and apoptotic process.
ALDH1A1 encoded the protein which a member of
aldehyde dehydrogenases family, and participated the oxidative
pathway of alcohol metabolism. In many studies, the expression of
ALDH1A1 was confirmed to be higher in myoma samples than in the
myometrium cells (21). However,
the mechanism of this gene for uterine leiomyomas has not been
identified. Through an experimental study of myoma and myometrium,
Shveiky and Rojansky (22) found
that acetaldehyde was with the inhibitory effect on myoma by
participating in the pathway of cell growth. In the present study,
ALDH1A1 was a key gene in two pathways of small molecule metabolic
process and positive regulation of Ras GTPase activity and with
higher expression level in uterine leiomyomas samples. In similarly
to our results, Luo and Chegini (23) found that Ras GTPase activating
protein was associated with cell differentiation, hypertrophy and
apoptosis, which could further influence the growth and regression
of leiomyoma. The results of western blot and RT-PCR in previous
study showed that ALDH isozymes affected cell growth and motility
(24). Besides, the risk of
fibroids was verified to be statistically positively associated
with small molecule metabolic process, such as metabolic process of
triglyceride (25). Thus, we
speculate that ALDH1A1 may be associated with small molecule
metabolic process and positive regulation of Ras GTPase activity,
and could be a key target for uterine leiomyomas treatment.
PROS1 encoded S-protein which is a vitamin
K-dependent plasma glycoprotein synthesized in the liver. It always
combined with protein C and further participated into the pathway
of coagulation (26). Previous
study processed western blot and confirmed that the nonsense
mutation of PROS1 could induce anticoagulation protein S deficiency
(27). In addition, this protein
could also bind to negatively charged phospholipids to form a
bridging which enhanced the phagocytosis of the apoptotic cell and
reduced the inflammation occurring. Furthermore, Cunin et al
(28) found that numbers of
apoptotic cells might induce an autoimmune response. In this study,
PROS1 participated into pathways including innate immune response,
platelet activation and leukocyte migration and expressed lower in
uterine leiomyomas samples. All of these pathways were closely
related to immune process. Above all, PROS2 might be a potential
target for uterine leiomyomas treatment by participating into the
immune process.
Besides, there were several special pathways in
MED12 mutation leiomyoma samples and 2 MED12 wild-type leiomyoma
samples. For example, the pathway of arachidonic acid metabolism
was downregulated expressed in MED12 mutation leiomyoma samples but
upregulated expressed in MED12 wild-type leiomyoma samples. In
MED12 mutation leiomyoma samples, this pathway was enriched by
HPGDS, phospholipase A2 group XVI (PLA2G16), glutathione peroxidase
3 (GPX3), PTGS2 and phospholipase A2 group IVA (PLA2G4A).
Similarly, in MED12 wild-type leiomyoma samples, this pathway
involved genes including CBR3, PTGS2, PLA2G16, PLA2G4A and GPX3. By
far, there's no studies showed the relationship between MED12
mutation and arachidonic acid metabolism. Based on the results of
this study, we inferred that HPGDS and CBR3 might be the special
genes related with MED12 mutation in uterine leiomyomas
disease.
In conclusions, CASP1, ALDH1A and PROS1 might be the
potential biomarkers for uterine leiomyomas diagnose and treatment
by participating into the pathways of immune response and small
molecule metabolic process. In addition, HPGDS and CBR3 might be
the special genes related with MED12 mutation in uterine leiomyomas
disease. The present findings offer us a new perspective for
further clinical diagnosis.
References
|
1
|
Moroni RM, Vieira CS, Ferriani RA,
Candido-dos-Reis FJ and Brito LGO: Pharmacological treatment of
uterine fibroids. Ann Med Health Sci Res. 4 Suppl 3:S185–S192.
2014. View Article : Google Scholar : PubMed/NCBI
|
|
2
|
Razavi MK, Hwang G, Jahed A, Modanlou S
and Chen B: Abdominal myomectomy versus uterine fibroid
embolization in the treatment of symptomatic uterine leiomyomas.
AJR Am J Roentgenol. 180:1571–1575. 2003. View Article : Google Scholar : PubMed/NCBI
|
|
3
|
He X: Estrogen receptor and progesterone
receptor expressions at the edge of the targeted region of uterus
fibroids ablated by acoustic power. J Chongqing Med Univ. 36:5–7.
2011.
|
|
4
|
Mäkinen N, Mehine M, Tolvanen J, Kaasinen
E, Li Y, Lehtonen HJ, Gentile M, Yan J, Enge M, Taipale M, et al:
MED12, the mediator complex subunit 12 gene, is mutated at high
frequency in uterine leiomyomas. Science. 334:252–255. 2011.
View Article : Google Scholar : PubMed/NCBI
|
|
5
|
Raimundo N, Vanharanta S, Aaltonen LA,
Hovatta I and Suomalainen A: Downregulation of SRF-FOS-JUNB pathway
in fumarate hydratase deficiency and in uterine leiomyomas.
Oncogene. 28:1261–1273. 2009. View Article : Google Scholar : PubMed/NCBI
|
|
6
|
Shen Y, Wu Y, Lu Q, Zhang P and Ren M:
Transforming growth factor-β signaling pathway cross-talking with
ERα signaling pathway on regulating the growth of uterine leiomyoma
activated by phenolic environmental estrogens in vitro. Tumour
Biol. 37:455–462. 2016. View Article : Google Scholar : PubMed/NCBI
|
|
7
|
Klotzbücher M, Wasserfall A and Fuhrmann
U: Misexpression of wild-type and truncated isoforms of the
high-mobility group I proteins HMGI-C and HMGI(Y) in uterine
leiomyomas. Am J Pathol. 155:1535–1542. 1999. View Article : Google Scholar : PubMed/NCBI
|
|
8
|
Chuang TY, Min J, Wu HL, McCrary C, Layman
LC, Diamond MP, Azziz R, Al-Hendy A and Chen YH: Berberine inhibits
uterine leiomyoma cell proliferation via downregulation of
cyclooxygenase 2 and pituitary tumor-transforming gene 1. Reprod
Sci. 24:1005–1013. 2017. View Article : Google Scholar : PubMed/NCBI
|
|
9
|
Gautier L, Cope L, Bolstad BM and Irizarry
RA: affy-analysis of Affymetrix GeneChip data at the probe level.
Bioinformatics. 20:307–315. 2004. View Article : Google Scholar : PubMed/NCBI
|
|
10
|
Huan JL, Gao X, Xing L, Qin XJ, Qian HX,
Zhou Q and Zhu L: Screening for key genes associated with invasive
ductal carcinoma of the breast via microarray data analysis. Genet
Mol Res. 13:7919–7925. 2014. View Article : Google Scholar : PubMed/NCBI
|
|
11
|
Chen L, Chu C, Lu J, Kong X, Huang T and
Cai YD: Gene ontology and KEGG pathway enrichment analysis of a
drug target-based classification system. PLoS One. 10:e01264922015.
View Article : Google Scholar : PubMed/NCBI
|
|
12
|
Smoot ME, Ono K, Ruscheinski J, Wang PL
and Ideker T: Cytoscape 2.8: New features for data integration and
network visualization. Bioinformatics. 27:431–432. 2011. View Article : Google Scholar : PubMed/NCBI
|
|
13
|
Southby J, Murphy LM, Martin TJ and
Gillespie MT: Cell-specific and regulator-induced promoter usage
and messenger ribonucleic acid splicing for parathyroid
hormone-related protein. Endocrinology. 137:1349–1357. 1996.
View Article : Google Scholar : PubMed/NCBI
|
|
14
|
Commandeur AE, Styer AK and Teixeira JM:
Epidemiological and genetic clues for molecular mechanisms involved
in uterine leiomyoma development and growth. Hum Reprod Update.
21:593–615. 2015. View Article : Google Scholar : PubMed/NCBI
|
|
15
|
Kessel PdAHMGv, Pauwels PAA and
Schoenmakers EFPM: Molecular genetic and functional
characterization of signalling networks that govern the development
of human uterine leiomyomas. IEEE International Symposium on
Multiple-valued Logic. pp. 2331998;
|
|
16
|
Commandeur AE, Styer AK and Teixeira JM:
Epidemiological and genetic clues for molecular mechanisms involved
in uterine leiomyoma development and growth. Hum Reprod Update.
21:593–615. 2015. View Article : Google Scholar : PubMed/NCBI
|
|
17
|
Rice KE, Secrist JR, Woodrow EL, Hallock
LM and Neal JL: Etiology, diagnosis, and management of uterine
leiomyomas. J Midwifery Womens Health. 57:241–247. 2012. View Article : Google Scholar : PubMed/NCBI
|
|
18
|
Thirupathi A, Elango T, Subramanian S and
Gnanaraj P: Methotrexate regulates Th-1 response by suppressing
caspase-1 and cytokines in psoriasis patients. Clin Chim Acta.
453:164–169. 2016. View Article : Google Scholar : PubMed/NCBI
|
|
19
|
Gloria-Bottini F, Pietropolli A, Ammendola
M, Saccucci P and Bottini E: PTPN22 and uterine leiomyomas. Eur J
Obstet Gynecol Reprod Biol. 185:96–98. 2015. View Article : Google Scholar : PubMed/NCBI
|
|
20
|
Christman GM, Tang H, Ahmad I and Stribley
JM: Differential expression of the Notch signal transduction
pathway: Ligands, receptors and Numb in uterine leiomyomas vs.
myometrium. Fertil Steril. 88 Suppl 1:S722007. View Article : Google Scholar
|
|
21
|
Zaitseva M, Vollenhoven BJ and Rogers PAW:
443. The fibroblast-smooth muscle cell relationship is altered in
uterine leiomyoma. Reprod Fertil Dev. 20:1232008. View Article : Google Scholar
|
|
22
|
Shveiky D and Rojansky N: 255: Alcohol has
a permissive effect on the growth of uterine leiomyomata cells in
tissue cultures. J Minim Invasive Gynecol. 14 Suppl:S92–S93. 2007.
View Article : Google Scholar
|
|
23
|
Luo X and Chegini N: The expression and
potential regulatory function of microRNAs in the pathogenesis of
leiomyoma. Semin Reprod Med. 26:500–514. 2008. View Article : Google Scholar : PubMed/NCBI
|
|
24
|
Moreb JS, Baker HV, Chang LJ, Amaya M,
Lopez MC, Ostmark B and Chou W: ALDH isozymes downregulation
affects cell growth, cell motility and gene expression in lung
cancer cells. Mol Cancer. 7:872008. View Article : Google Scholar : PubMed/NCBI
|
|
25
|
Takeda T, Sakata M, Isobe A, Miyake A,
Nishimoto F, Ota Y, Kamiura S and Kimura T: Relationship between
metabolic syndrome and uterine leiomyomas: A case-control study.
Gynecol Obstet Invest. 66:14–17. 2008. View Article : Google Scholar : PubMed/NCBI
|
|
26
|
Castoldi E and Hackeng TM: Regulation of
coagulation by protein S. Curr Opin Hematol. 15:529–536. 2008.
View Article : Google Scholar : PubMed/NCBI
|
|
27
|
Fang BQ and Zhang JW: Molecular mechanisms
of protein S deficiency caused by a novel nonsense mutation. Chin J
Vasc Surg. 2:32–35. 2015.
|
|
28
|
Cunin P, Beauvillain C, Miot C, Augusto
JF, Preisser L, Blanchard S, Pignon P, Scotet M, Garo E, Fremaux I,
et al: Clusterin facilitates apoptotic cell clearance and prevents
apoptotic cell-induced autoimmune responses. Cell Death Dis.
7:e22152016. View Article : Google Scholar : PubMed/NCBI
|