Introduction
Ischemic stroke, the third leading cause of death,
leads to neuronal cell death by necrosis or apoptosis,
mitochondrial dysfunction, energy depletion, and its complications
such as coma, and hemiplegia (1–3). The
study shows that the incidence of ischemic stroke decrease over
time among men, but it is stable among women (4). It is report that the incidence of
ischemic stroke is 170/100 thousand in adult women (5,6), and
it is 212/100 thousand in men. Notably, the incidence of ischemic
stroke is 91.3/100 thousand-263.1/100 thousand in China (7). Usually, the middle cerebral artery is
related to ischemic stroke (8).
Despite some clot lysing drugs have applied to ameliorate cerebral
ischemic according to clinical experience, the treatment efficacy
is limited by the narrow therapeutic safety and time window
(1,9). In addition, reperfusion also
aggravates brain injury, such as neuronal apoptosis, reactive
oxygen species overproduction, and neuro-inflammation (10,11).
Thus, it is critical to explore the novel therapeutic agents and
targets of ischemic stroke.
Currently, numerous studies involved the
pathophysiological of ischemic stroke are performed. For example,
the Janus kinase 2/signal transducer and activator of transcription
3 (JAK2/STAT3) signaling pathway is suggested to play a vital role
in central nervous system (12).
In this pathway, hypoxia preconditioning (13), rhEPO (14), IL-6 (15) can activate JAK2-STAT3 pathway and
promote neurological recovery (13,16).
In addition, the suppressor of cytokine signaling (SOCS) family of
proteins, including SOCS1 and SOCS3, can suppress cytokine activity
by interacting with JAK (17),
indicating JAK2/STAT3 pathway is associated with cerebral ischemia
reperfusion injury. Moreover, studies show that Rac family small
GTPase 2 (Rac2), a well-studied small GTPase, has the effect on
hematopoietic and endothelial cell integrin and immunoreceptor
signaling (18,19). Joshi et al demonstrate that
Rac2 is related to macrophage autonomous process, which can control
tumor growth (20). However, the
relationship between Rac2 and cerebral ischemia need to be further
investigated.
MicroRNA (miRNA), a small non-coding RNA molecule,
has important functions in the RNA silencing and
post-transcriptional regulation of gene expression (21). The study shows that miRNAs are
involved in neuro protection, ischemia, and injury (21). Previous study indicated that
miR-29a had the protective effect on reperfusion injury by
targeting a pro-apoptotic family member (22). However, potential gene markers
related to brain ischemia based on gene or miRNA expression remains
unclear.
The GSE52001 is obtained on Agilent Array platform
and firstly analyzed by Lai et al (23). However, based on the huge
information of gene expression profile, the data about the role of
potential gene markers in cerebral ischemia are limited. In the
present study, a bioinformatics study was performed based on the
microarray data deposited by Lai et al (23). On the basis of differentially
expressed gene (DEGs) between sham brain samples (sham group) and
cerebral ischemia brain samples (ischemia brain group), the
function and pathways analyses were investigated. Protein-protein
interaction (PPI) network analysis was also conducted. Then the
analysis for potential miRNA-target regulation in the process of
glioma was performed. We expected to explore a detailed mechanism
of transcriptional regulation in the cerebral ischemia, and provide
a novel strategy for cerebral ischemia therapy.
Materials and methods
Microarray data
The gene expression profiling GSE52001 was
downloaded from the Gene Expression Omnibus (http://www.ncbi.nlm.nih.gov/geo/) database (24), which was based on the platform of
GPL14746 Agilent-028282 Whole Rat Genome Microarray 4×44 K V3.0
expression beadchip. The organism of this dataset was Rattus
norvegicus, including 3 normal brain samples (Sham brain, SB,
SB1, SB2, SB3) and 3 brain samples of cerebral ischemia (ischemia
brain, IB, IB1, IB2, IB3) (23).
The IB samples were collected as follows: Male Sprague Dawley rats
(220±20 g; 7–8 weeks old) were anesthetized with 10% chloral
hydrate (3 ml/kg). Then a silicone-coated nylon monofilament was
inserted from the left common carotid artery to the origin of the
middle cerebral artery. After 2 h of occlusion, reperfusion was
induced by withdrawing the filament. Sham animals were operated on
in the same manner except that the middle cerebral artery was not
occluded. The animal experiments were conducted in accordance with
the guidelines of the National Institutes of Health Guide for the
Care and Use of Laboratory Animals. The study of Lai et al
was approved by the Animal Care and Use Committee of Fujian
University of Traditional Chinese Medicine (23).
Pretreatment and differential
analysis
The robust multi-array average (RMA) method in limma
package (http://www.bioconductor.org/packages/2.9/bioc/html/limma.html)
(25) was applied to preprocess
the raw CEL data by performing background correction, data
normalization, conversion of original data, and quartile data
normalization. Then the DEGs were identified by the non-paired
t-test in limma package (25).
Here, the adjusted P-value <0.05 and |log fold change (FC) |≥1
were set as the threshold value. Finally, the heat map for DEGs was
generated via the Pheatmap package (https://CRAN.R-project.org/package=pheatmap) (26) in R (version 3.3.2).
Functional and pathway enrichment
analyses
Gene Ontology (GO) (http://www.geneontology.org) analysis (27) is used for analyzing the functions
of a large number of genes. The Kyoto Encyclopedia of Genes and
Genomes (KEGG, http://www.genome.ad.jp/kegg/) (28,29)
pathway is the major recognized pathway-related database which
contains varieties of biochemical pathways (29). Multifaceted Analysis Tool for Human
Transcriptome (MATHT) (www.biocloudservice.com) was used to perform GO term
and KEGG pathway enrichment analyses for the DEGs. The setting of
cut-off value was P-value <0.05.
PPI network and module analyses
The Search Tool for the Retrieval of Interacting
Genes (STRING) (version 10.0) (30) (http://www.string-db.org/) is an online database
providing experimental and predicted PPI information. Here, the
STRING database (30) was applied
to analyze the PPIs among the proteins encoded by the DEGs. The
parameter was set as medium confidence score >0.4. Then the PPI
networks for the upregulated genes and the downregulated genes were
separately visualized by Cytoscape software (version 3.2.0)
(http://www.cytoscape.org/) (31), and node degrees were determined. In
addition, the significant modules were obtained using the MCODE
plug-in (http://apps.cytoscape.org/apps/mcode) (32) in Cytoscape software. Additionally,
the KEGG pathway enrichment analysis for nodes in the significant
modules was performed using MATHT tool.
miRNA-target gene regulatory network
analyses
With the discovery of RNA interference (RNAi), the
function of noncoding RNAs in gene expression and regulation was
widely focused (33). MiRNAs
regulate the expression of genes by interacting with their target
genes at the post transcription stage (33). In the present study, the miRNAs
associated with DEGs were searched utilizing WebGestal (http://www.webgestalt.org/option.php)
(34,35) online tool, and miRNA-DEG regulatory
network was visualized by Cytoscape software (31).
Results
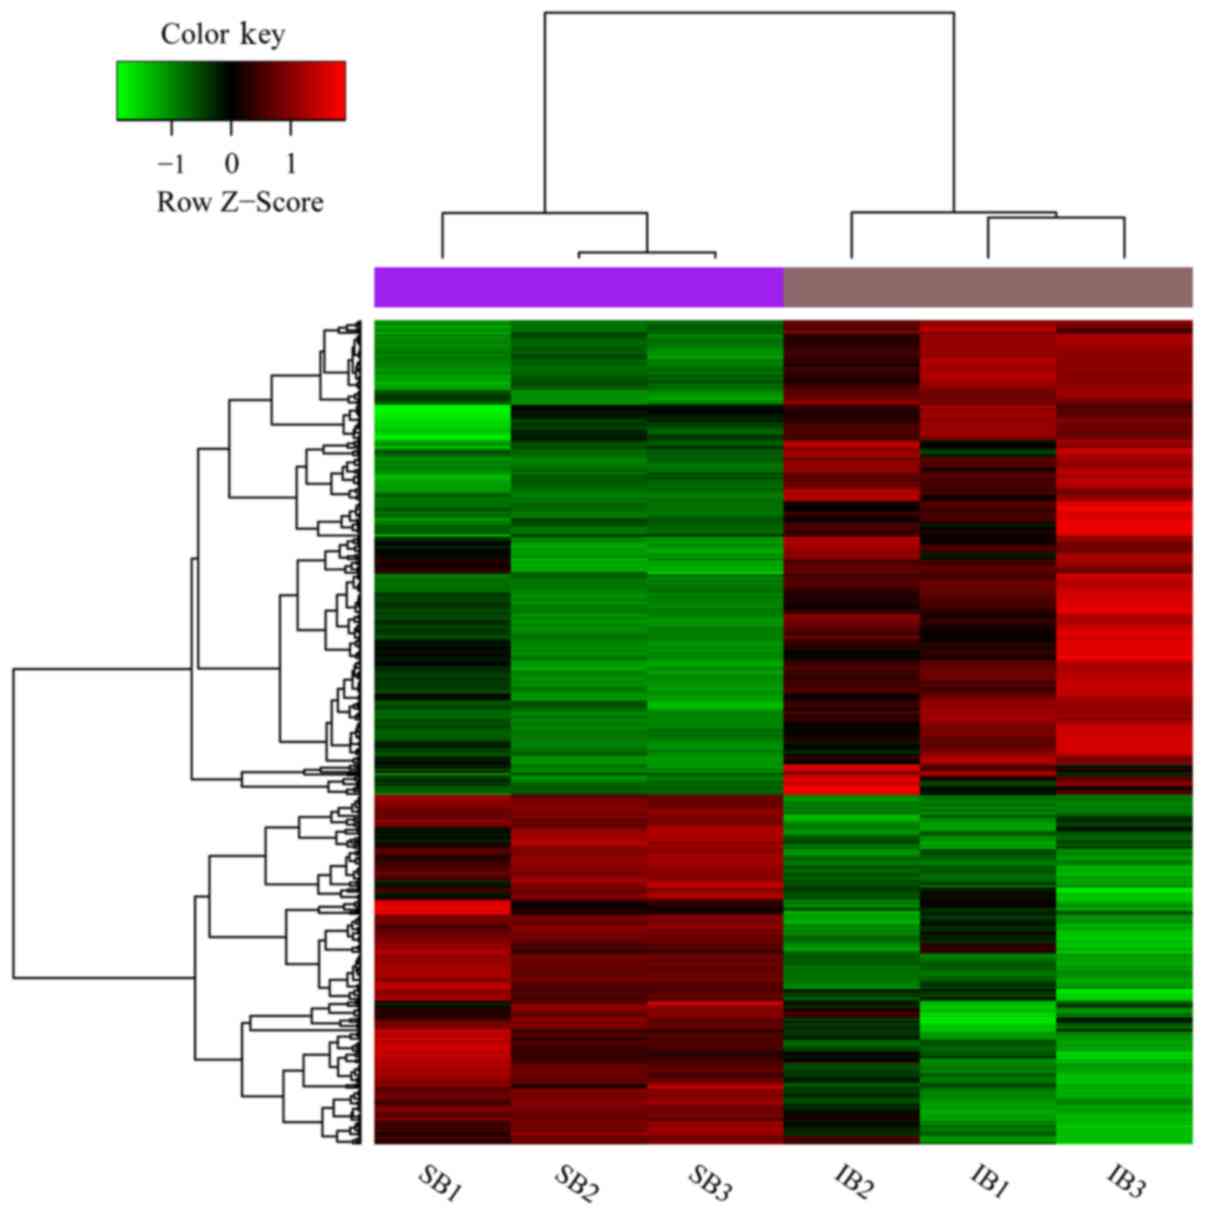
DEGs and clusters
In total, 488 DEGs were identified, including 281
upregulated and 207 downregulated DEGs. Thereafter, the 488 DEGs
and 6 samples were clustered, and DEGs could well differentiate the
IB samples from the SB controls (Fig.
1).
Functional and pathway enrichment
analyses
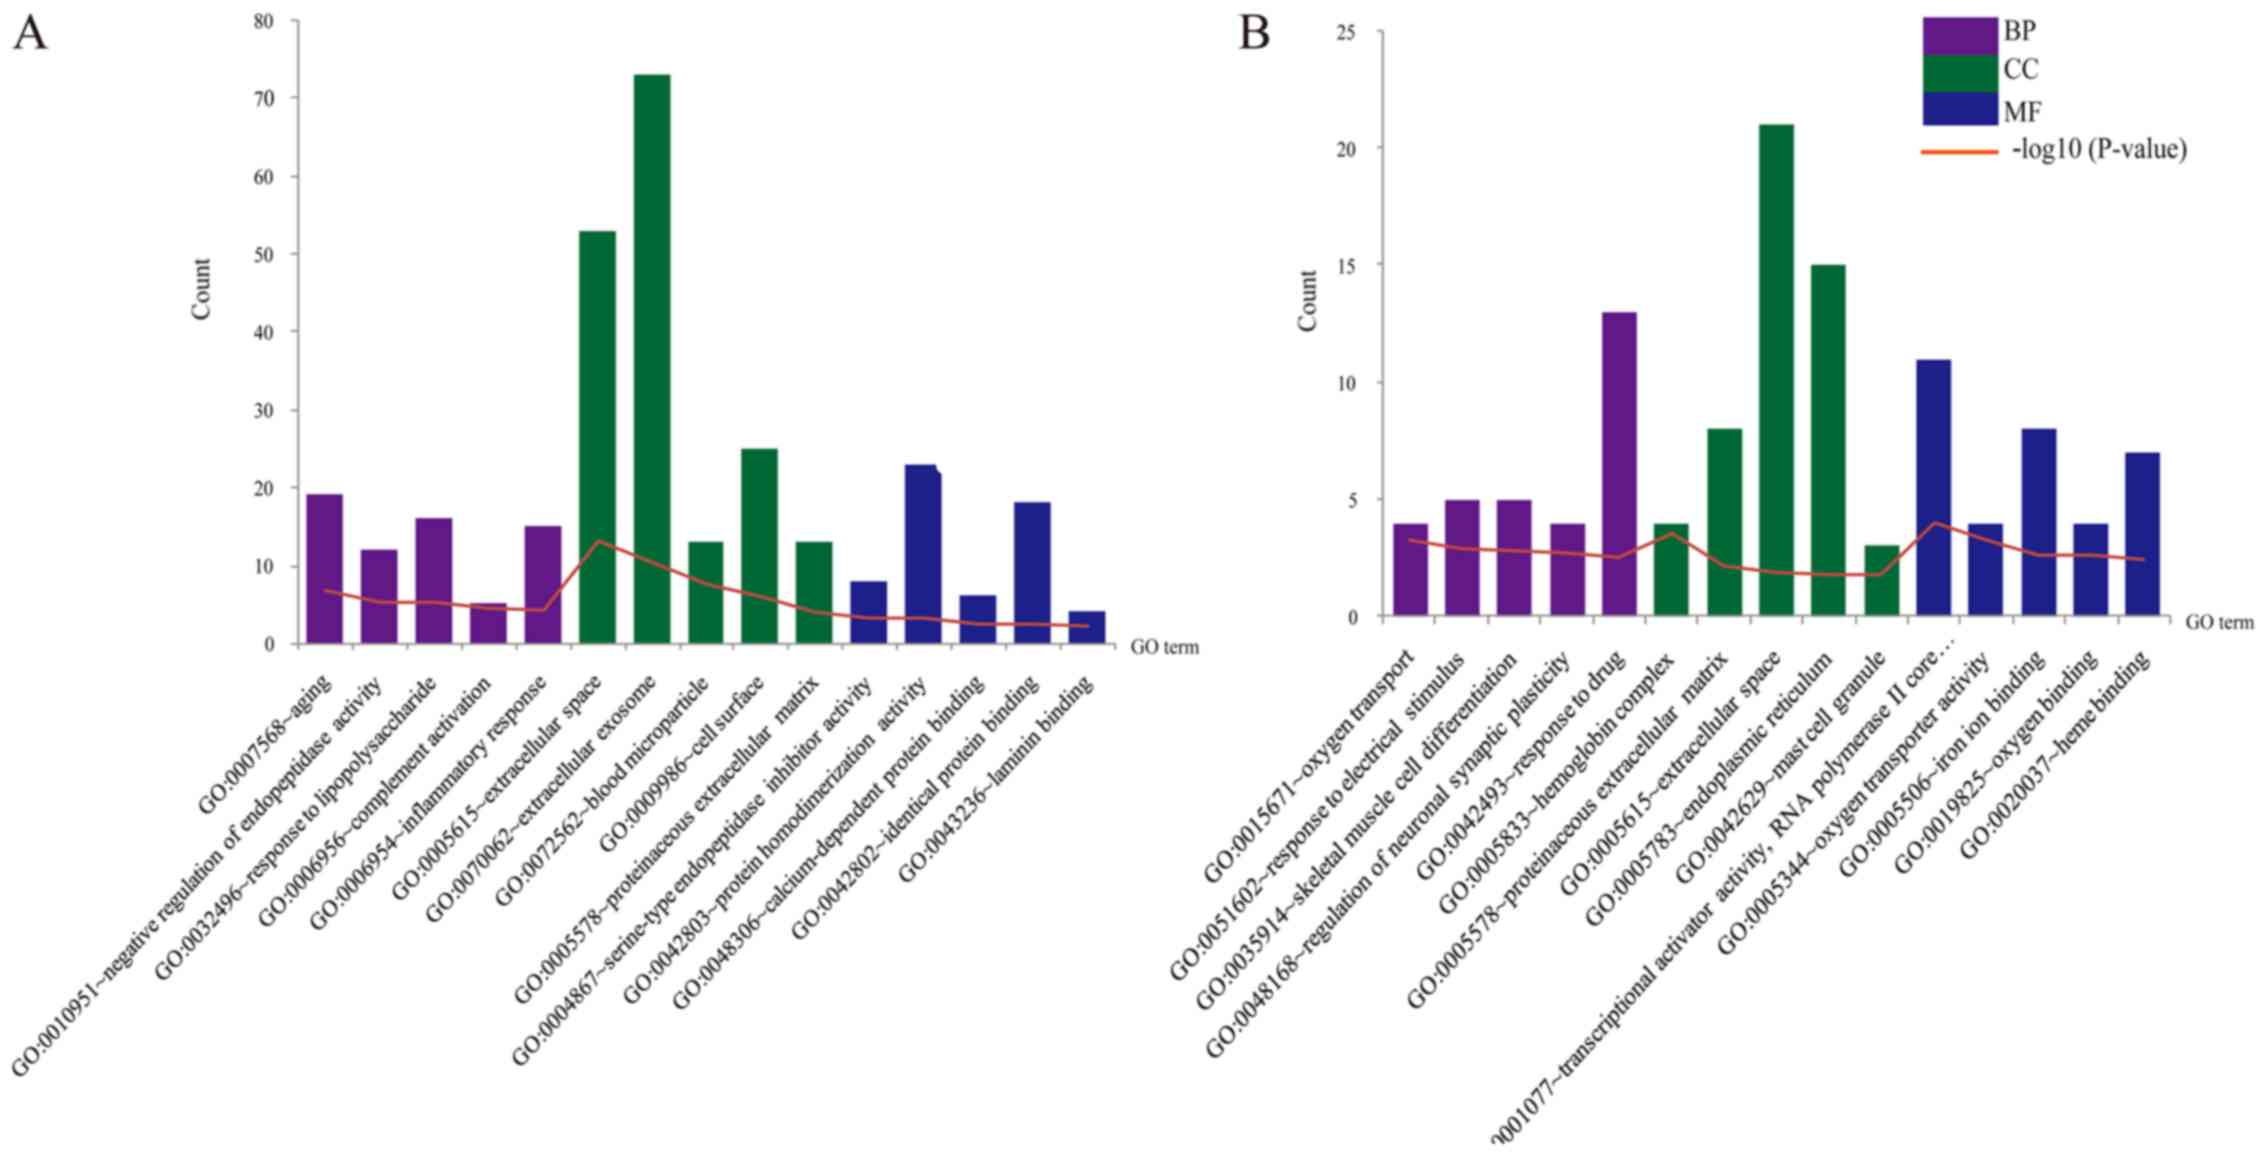
The enriched GO terms and KEGG pathways for DEGs
were identified. According to the P-values (ascending sort), the
top 5 enriched terms were exhibited in Fig. 2. The upregulated genes were
significantly enriched in the functions of aging (BP,
P=1.69×10⁻⁷), extracellular exosome (CC,
P=3.58×10⁻¹¹), extracellular space (CC,
P=5.70×10⁻¹⁴), protein homodimerization activity (MF,
P=6.23×10⁻⁴), and identical protein binding (MF,
P=3.80×10⁻³) (Fig. 2A).
While the downregulated genes were dramatically enriched in the
functions of response to drug (BP, P=3.20×10⁻³),
extracellular space (CC, P=1.25×10⁻²), transcriptional
activator activity (MF, P=1.03×10⁻⁴), and RNA polymerase
II core promoter proximal region sequence-specific binding (MF,
P=1.03×10⁻⁴) (Fig. 2B).
Besides, the significantly enriched KEGG pathways were presented in
Table I. For the upregulated
genes, the significantly enriched KEGG pathways mainly include
staphylococcus aureus infection (pathway, P=8.15×10⁻¹⁰),
pertussis (pathway, P=2.64×10⁻⁷), and complement and
coagulation cascades (pathway, P=2.36×10⁻⁶). There were
only 2 significantly enriched KEGG pathways for the downregulated
genes, which include African trypanosomiasis and Aldosterone
synthesis (pathway, P=4.70×10⁻³), and secretion
(pathway, P=3.96×10⁻²) (Table I).
 | Table I.KEGG pathways significantly enriched
by DEGs. |
Table I.
KEGG pathways significantly enriched
by DEGs.
| A, Upregulated
genes |
|---|
|
|---|
| Pathway ID | Pathway name | Count | P-value | Genes |
|---|
| rno05150 | Staphylococcus
aureus infection | 12 |
8.15×10⁻¹⁰ | C1QA, C1QB,
C5AR1, FCGR2B, C3, LOC498276, C1R, ITGB2, C2, C1S, FCGR3A,
C1QC |
| rno05133 | Pertussis | 11 |
2.64×10⁻⁷ | C1QA, C1QB, C3,
PYCARD, SERPING1, C1R, ITGB2, C2, C1S, C1QC, CD14 |
| rno04610 | Complement and
coagulation cascades | 10 |
2.36×10⁻⁶ | C1QA, C1QB, A2M,
C5AR1, C3, SERPING1, C1R, C2, C1S, C1QC |
| rno04650 | Natural killer cell
mediated cytotoxicity | 10 |
3.05×10⁻⁵ | CD48, PTPN6,
RAC2, FCER1G, ITGB2, VAV2, FCGR3A, IFNGR1, HCST, TYROBP |
| rno05140 | Leishmaniasis | 7 |
1.13×10⁻³ | PTPN6, CYBA, C3,
LOC498276, ITGB2, FCGR3A, IFNGR1 |
| rno04145 | Phagosome | 11 |
1.41×10⁻³ | RT1-A2, CYBA,
RT1-A1, FCGR2B, C3, LOC498276, C1R, ITGB2, CTSS, FCGR3A,
CD14 |
| rno05322 | Systemic lupus
erythematosus | 9 |
1.44×10⁻³ | C1QA, C1QB, C3,
LOC498276, C1R, C2, C1S, FCGR3A, C1QC |
| rno05152 | Tuberculosis | 10 |
3.01×10⁻³ | LSP1, FCGR2B,
C3, LOC498276, FCER1G, ITGB2, CTSS, FCGR3A, IFNGR1, CD14 |
| rno04666 | FcγR-mediated
phagocytosis | 6 |
1.28×10⁻² | PTPRC, RAC2,
FCGR2B, HCK, LOC498276, VAV2 |
| rno04142 | Lysosome | 7 |
1.81×10⁻² | CTSZ, GUSB,
LGMN, CTSE, CTSC, CTSS, CD63 |
| rno04380 | Osteoclast
differentiation | 7 |
1.94×10⁻² | CYBA, FCGR2B,
LOC498276, TREM2, FCGR3A, IFNGR1, TYROBP |
| rno04611 | Platelet
activation | 7 |
2.37×10⁻² | P2RY12, ORAI1,
TBXAS1, FERMT3, LOC498276, COL3A1, FCER1G |
| rno00860 | Porphyrin and
chlorophyll metabolism | 4 |
2.94×10⁻² | GUSB, HMOX1,
HEPH, CP |
| rno05146 | Amoebiasis | 6 |
3.70×10⁻² | ARG1, COL3A1,
SERPINB1A, ITGB2, SERPINB1B, CD14 |
| rno04670 | Leukocyte
transendothelial migration | 6 |
4.75×10⁻² | CYBA, RAC2,
CLDN1, ITGB2, VAV2, MMP2 |
|
| B, Downregulated
genes |
|
|
PathwayID | Pathway
name | Count | P-value | Genes |
|
| rno05143 | African
trypanosomiasis | 4 |
4.70×10⁻³ | LOC689064,
HBB-B1, PLCB1, HBB |
| rno04925 | Aldosterone
synthesis and secretion | 4 |
3.96×10⁻² | CYP11B1, NR4A1,
PLCB1, CACNA1S |
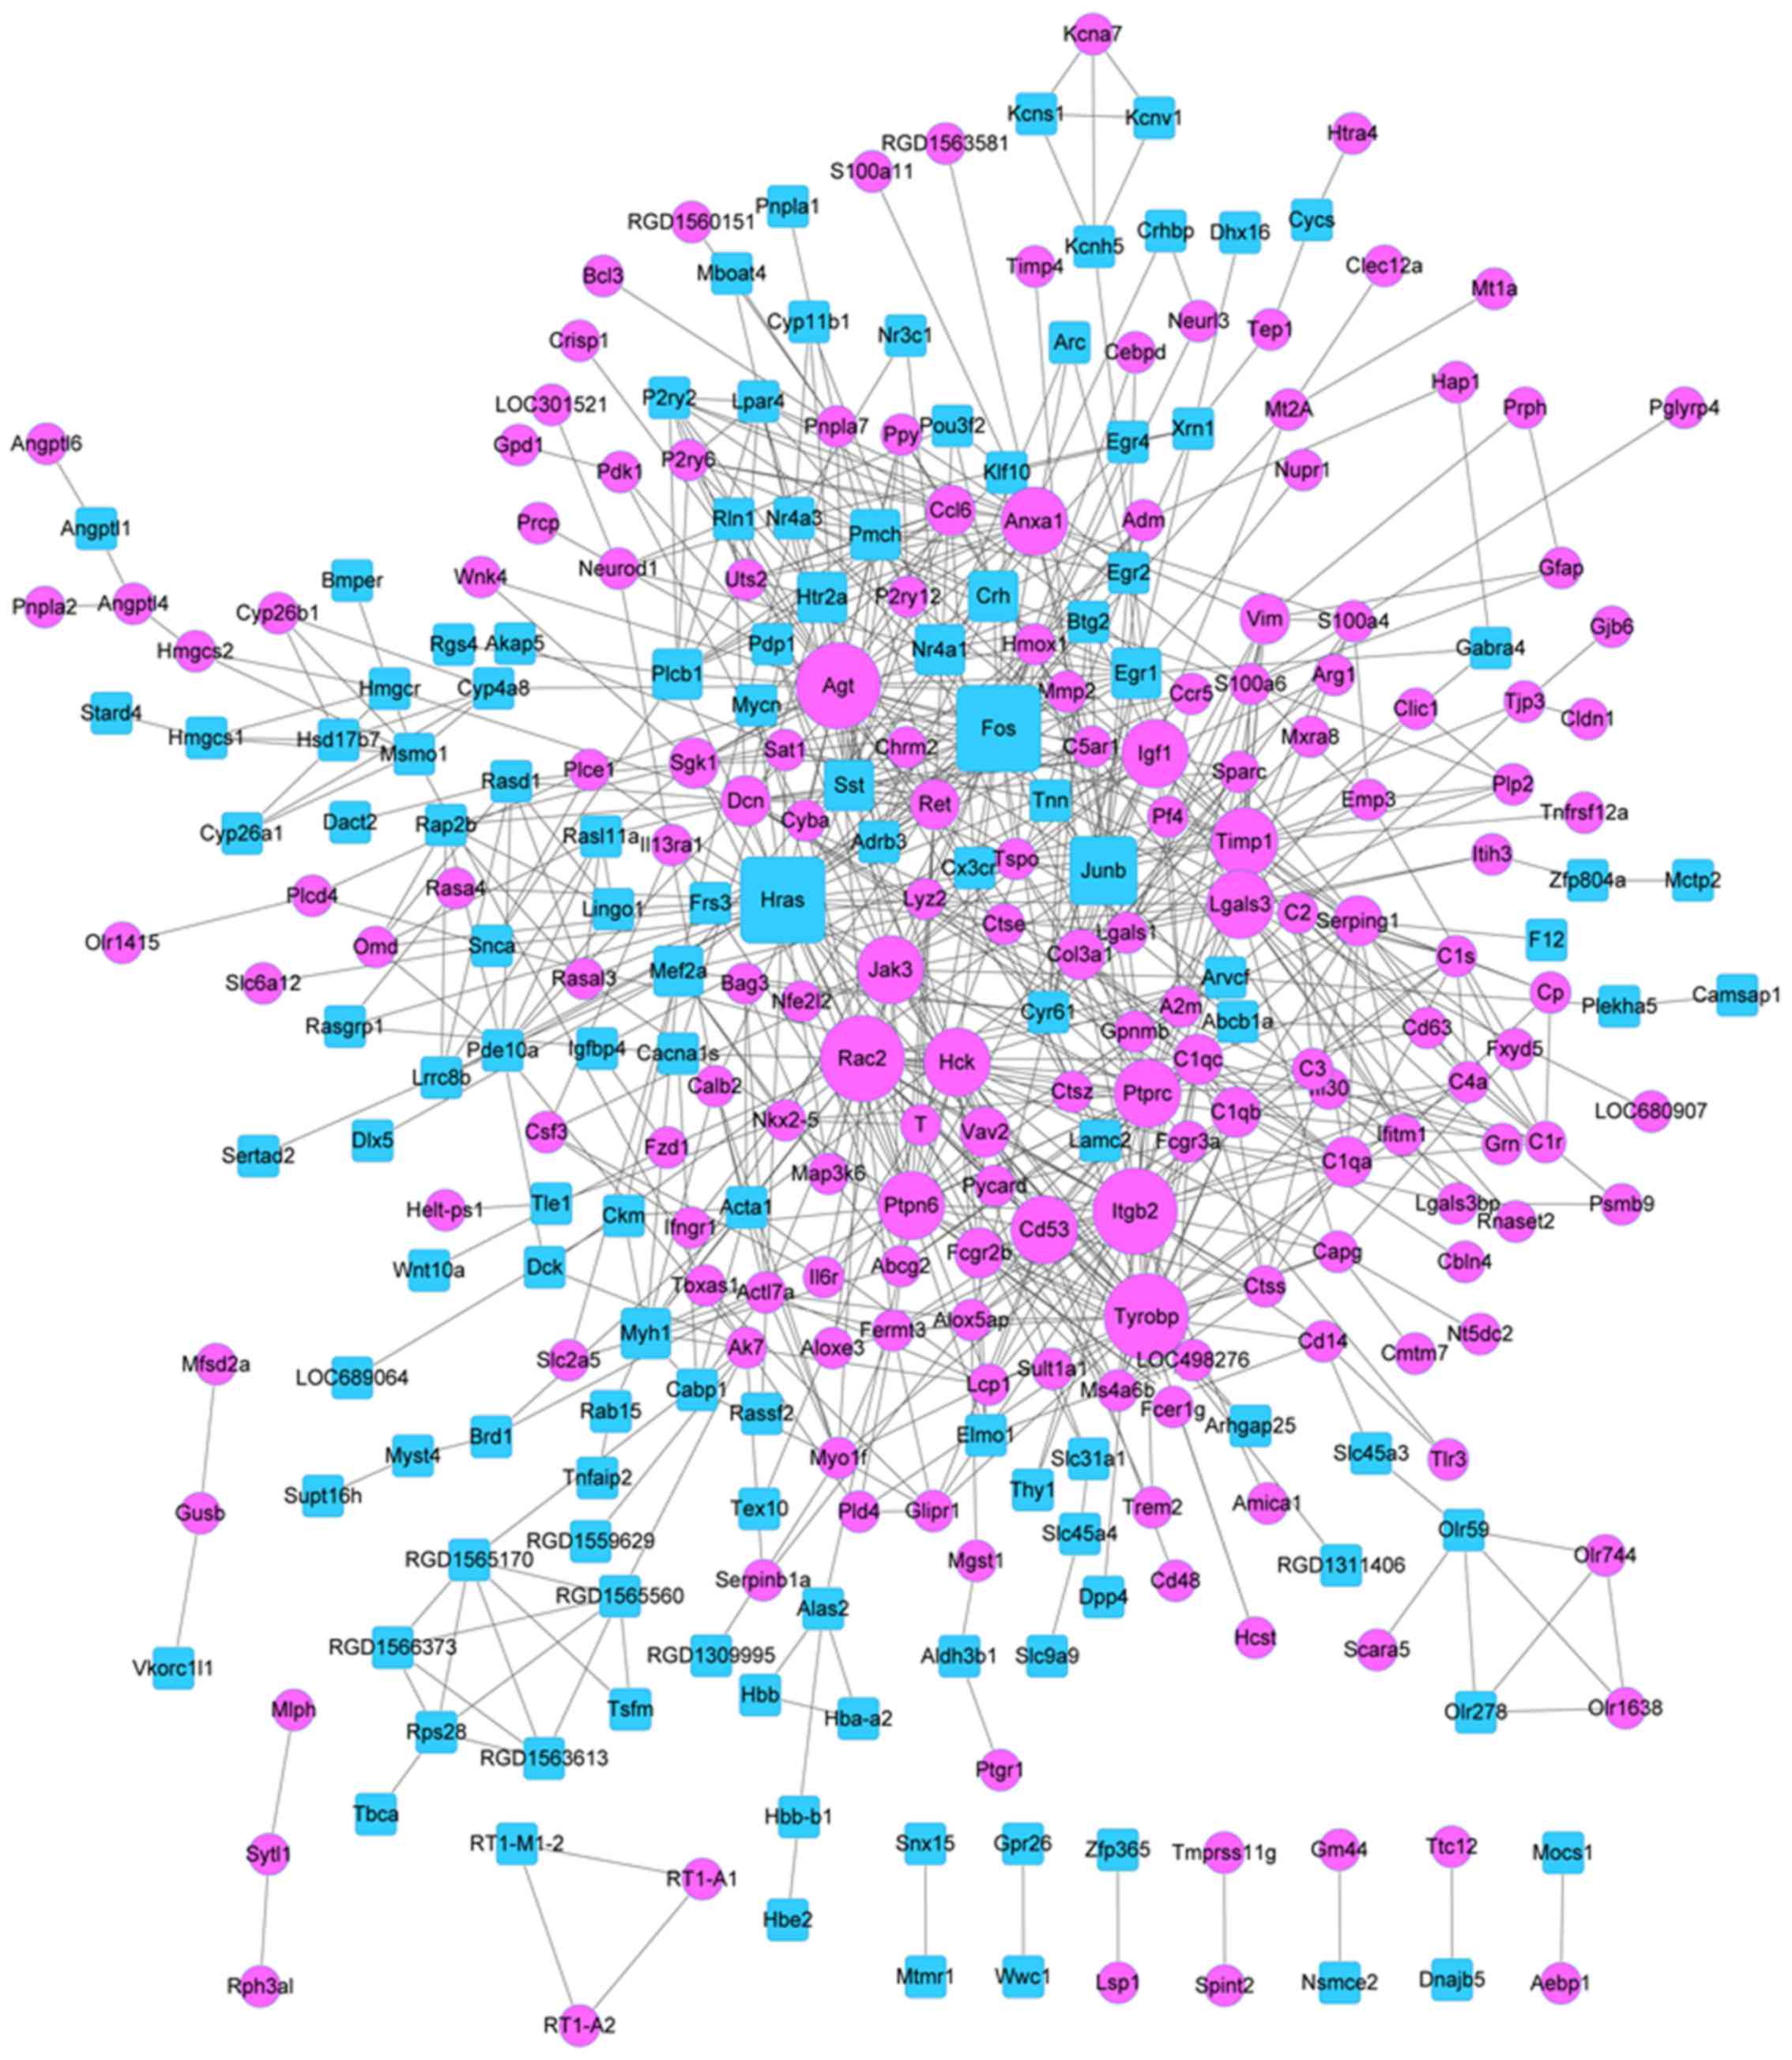
PPI network and module analyses
The PPI network with 295 nodes and 827 edges was
constructed (Fig. 3). Upregulated
gene with higher node degree were Rac2, angiotensinogen (Agt),
integrin β2 (Itgb2), protein tyrosine phosphatase, receptor type, C
(Ptprc), protein tyrosine phosphatase, non-receptor type 6 (Ptpn6),
and hematopoietic cell kinase (Hck). Downregulated genes with
higher degrees were Fos, Hras, and Junb. The degree of top 20 DEGs
was listed in the Table II. In
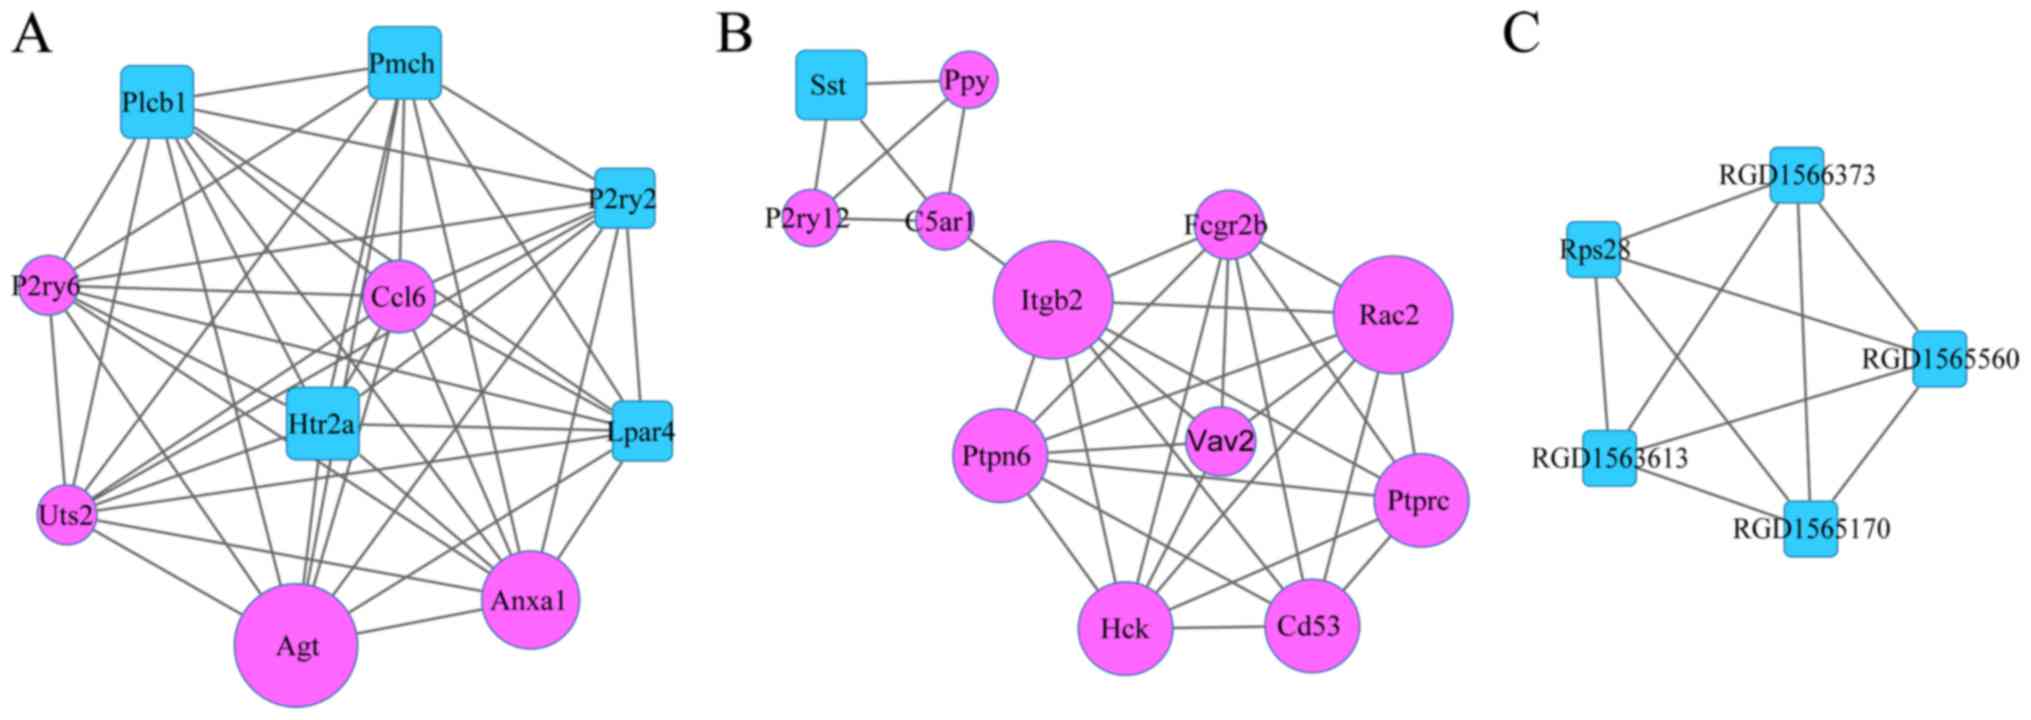
this study, 3 significant modules were obtained by MCODE plug-in,
which included module A (10 nodes and 45 edges), module B (12 nodes
and 33 edges), and module C (5 nodes and 10 edges) (Fig. 4).
| Table II.Degree of top 20
differentially-expressed genes in the protein-protein interaction
network. |
Table II.
Degree of top 20
differentially-expressed genes in the protein-protein interaction
network.
| A, Upregulated |
|---|
|
|---|
| Gene | Degree |
|---|
| Rac2 | 35 |
| Agt | 34 |
| Tyrobp | 30 |
| Itgb2 | 30 |
| Ptprc | 28 |
| Timp1 | 27 |
| Ptpn6 | 24 |
| Lgals3 | 23 |
| Hck | 21 |
| Igf1 | 20 |
| Jak3 | 20 |
| Anxa1 | 20 |
| Cd53 | 20 |
| Dcn | 18 |
| C1qb | 16 |
|
| B,
Downregulated |
|
| Gene | Degree |
| Fos | 34 |
| Hras | 32 |
| Junb | 20 |
| Sst | 19 |
| Egr1 | 17 |
In addition, 2 KEGG pathways were significantly
enriched in module A, including neuroactive ligand-receptor
interaction (P=9.62×10⁻⁴), and inflammatory mediator
regulation of TRP channels (P=3.03×10⁻³). Meanwhile, 8
KEGG pathways were dramatically enriched in module B, such as
FcγR-mediated phagocytosis (P=1.60×10⁻⁶), B cell
receptor signaling pathway (P=5.40×10⁻⁵), and natural
killer cell mediated cytotoxicity (P=1.54×10⁻⁴)
(Table III). However, no
pathways were enriched for the nodes in module C.
| Table III.Enriched pathways for the nodes in
module A and B. |
Table III.
Enriched pathways for the nodes in
module A and B.
| Pathway ID | Pathway name | Count | P-value | Genes |
|---|
| MEA |
|
|
|
|
|
rno04080 | Neuroactive
ligand-receptor interaction | 4 |
9.62×10⁻⁴ | P2RY6, P2RY2,
LPAR4, HTR2A |
|
rno04750 | Inflammatory
mediator regulation of TRP channels | 3 |
3.13×10⁻³ | P2RY2, PLCB1,
HTR2A |
| MEB |
|
|
|
|
|
rno04666 | FcγR-mediated
phagocytosis | 5 |
1.60×10⁻⁶ | PTPRC, RAC2,
FCGR2B, HCK, VAV2 |
|
rno04662 | B cell receptor
signaling pathway | 4 |
5.40×10⁻⁵ | PTPN6, RAC2,
FCGR2B, VAV2 |
|
rno04650 | Natural killer cell
mediated cytotoxicity | 4 |
1.54×10⁻⁴ | PTPN6, RAC2,
ITGB2, VAV2 |
|
rno05150 | Staphylococcus
aureus infection | 3 |
1.65×10⁻³ | C5AR1, FCGR2B,
ITGB2 |
|
rno04660 | T cell receptor
signaling pathway | 3 |
6.45×10⁻³ | PTPN6, PTPRC,
VAV2 |
|
rno04670 | Leukocyte
transendothelial migration | 3 |
7.91×10⁻³ | RAC2, ITGB2,
VAV2 |
|
rno04062 | Chemokine signaling
pathway | 3 |
1.67×10⁻² | RAC2, HCK,
VAV2 |
|
rno04810 | Regulation of actin
cytoskeleton | 3 |
2.47×10⁻² | RAC2, ITGB2,
VAV2 |
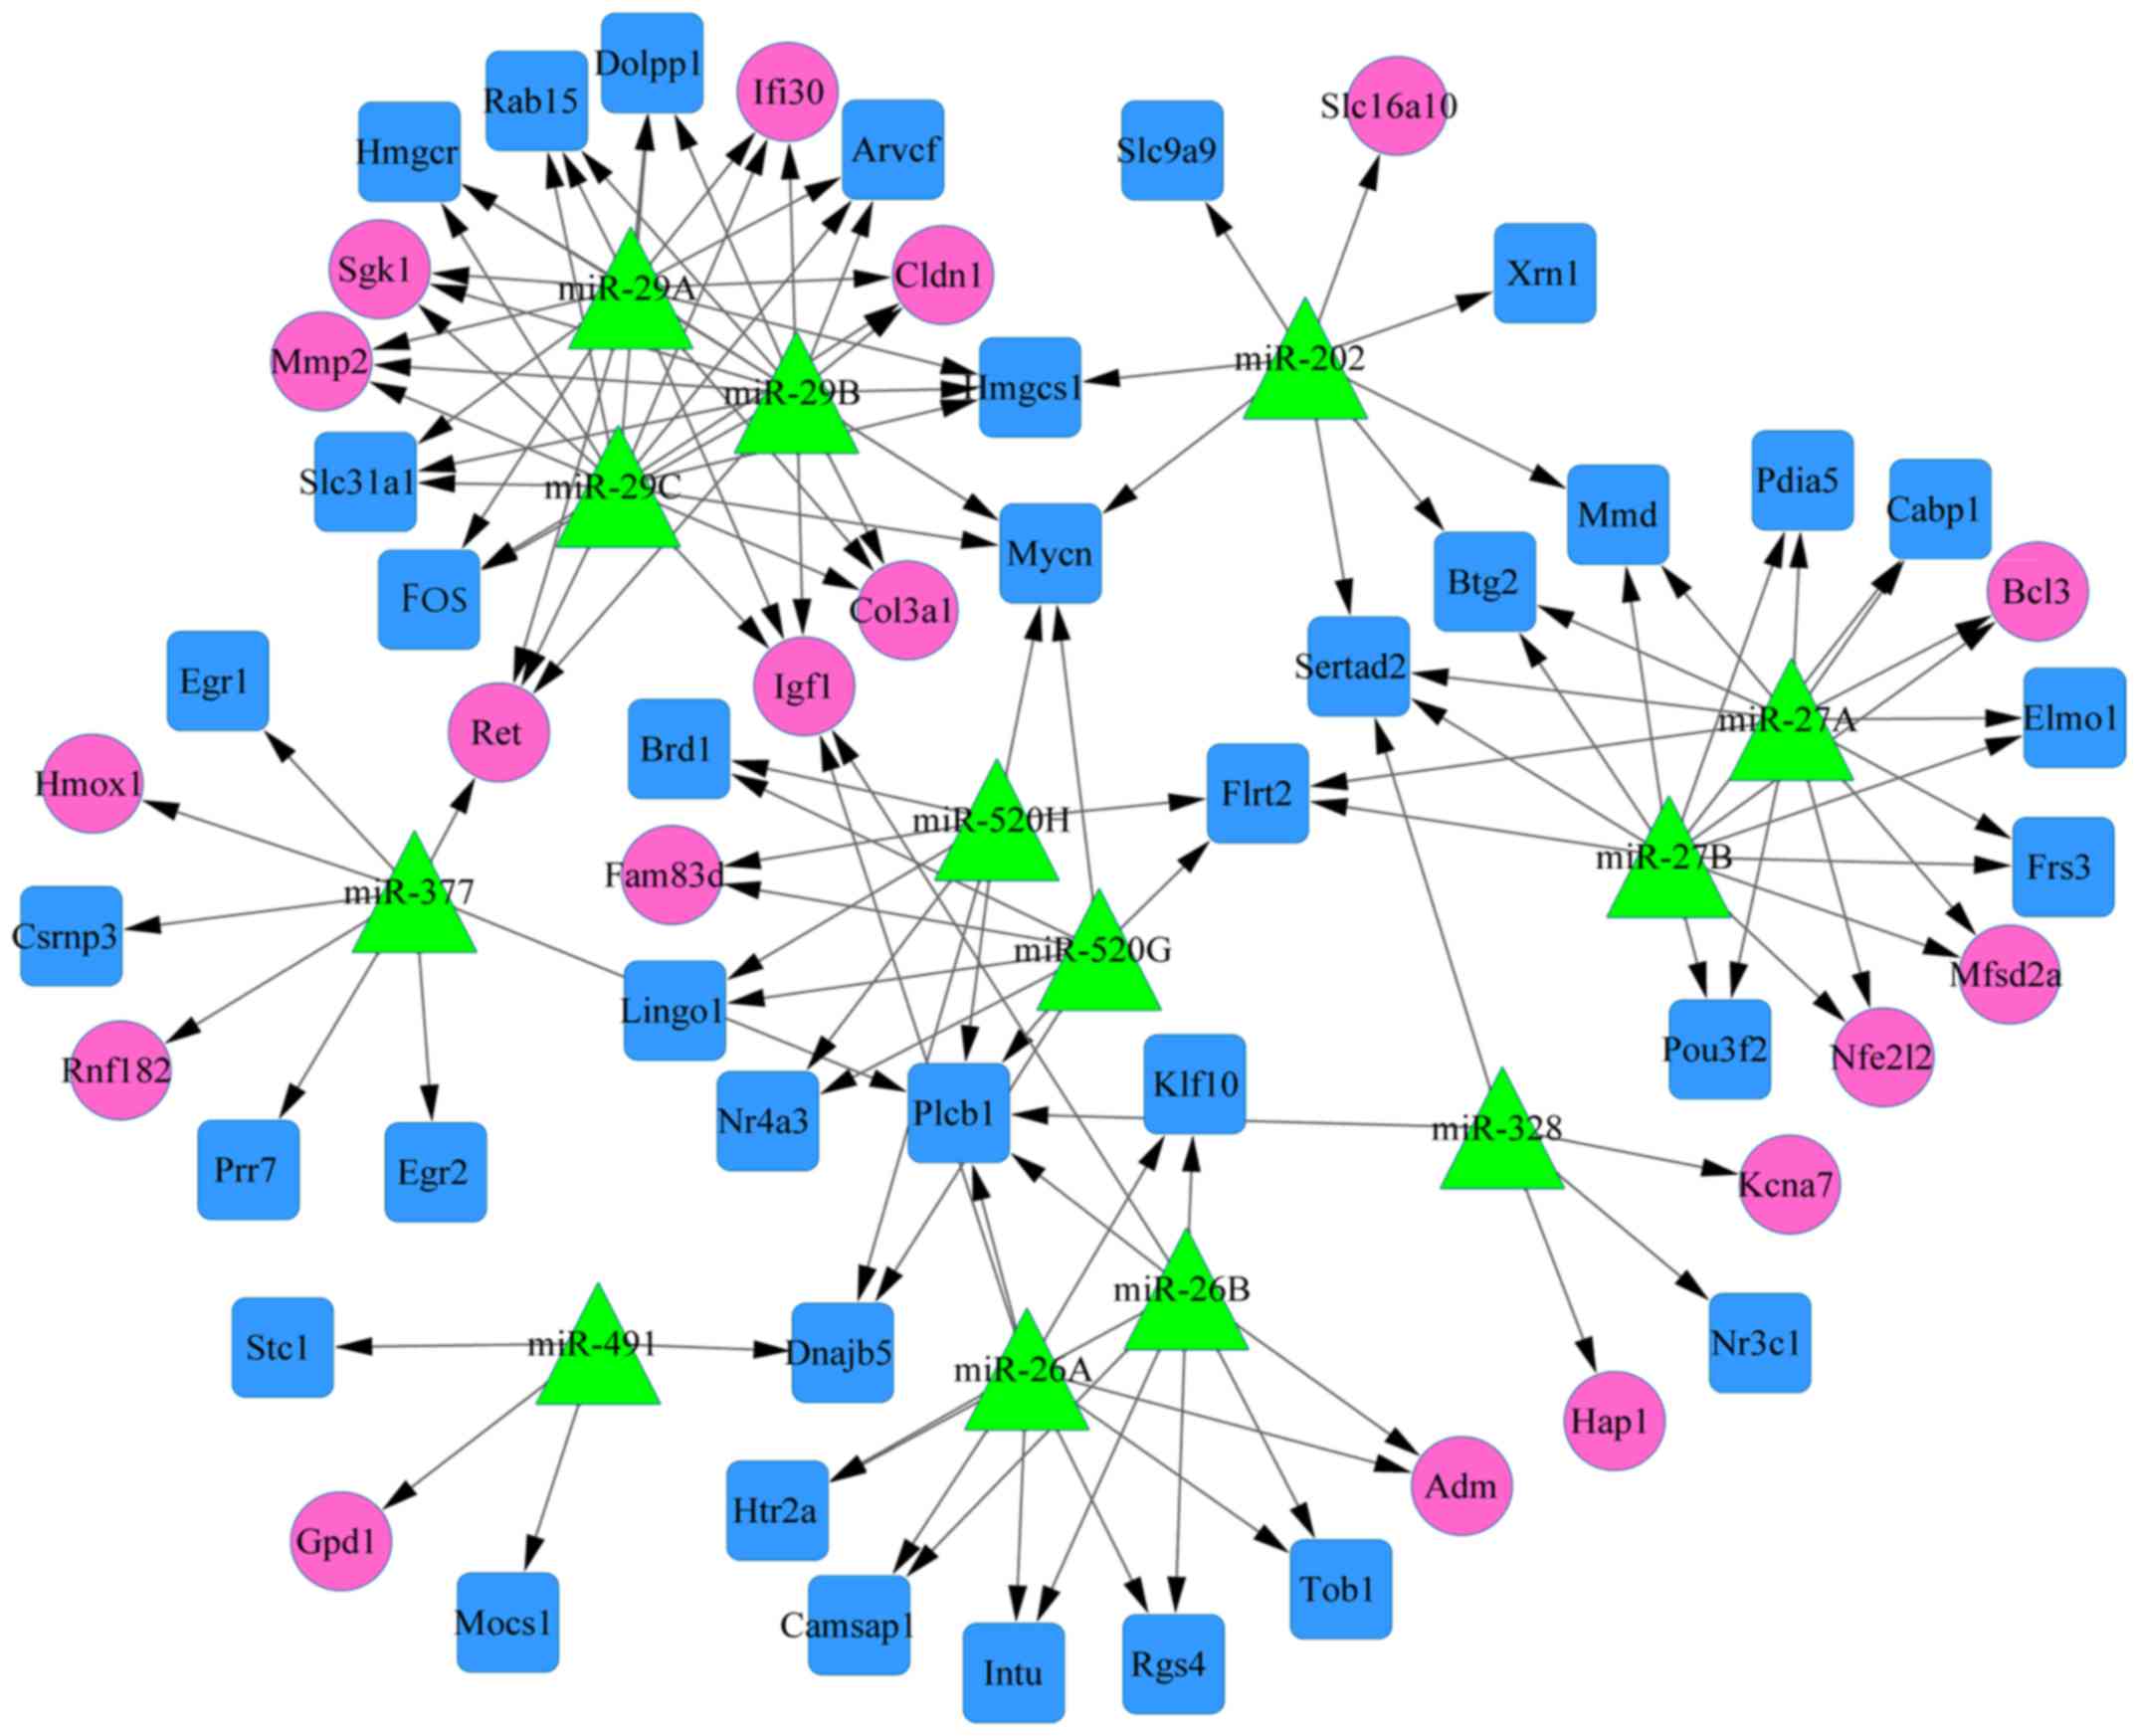
miRNA-target regulatory network
analysis
A total of 58 DEGs, 13 miRNAs, and 128 edges were
contained in the miRNA-DEG regulatory network (Fig. 5). The nodes with top 10 degrees
were listed in Table IV. Among
them, the degrees of miR-29A, miR-29B and miR-29C
were higher than other miRNAs in the miRNA-target regulatory
network. Besides, target genes with higher degrees such as Mycn,
Plcb1, Igf1 were shown in Fig.
5.
| Table IV.Degree of top 10 miRNAs in the
miRNAs-target regulatory network. |
Table IV.
Degree of top 10 miRNAs in the
miRNAs-target regulatory network.
| miRNA | Degree |
|---|
| miR-29A | 15 |
| miR-29B | 15 |
| miR-29C | 15 |
| miR-27A | 12 |
| miR-27B | 12 |
| miR-26A | 9 |
| miR-26B | 9 |
| miR-377 | 8 |
| miR-202 | 8 |
| miR-520G | 8 |
Discussion
In the present study, a total of 488 DEGs were
identified, including 281 upregulated and 207 downregulated DEGs.
Rac2, with higher degree in the PPI network, was associated with
FcγR-mediated phagocytosis pathway. In the miRNA-target gene
network, the degrees of miR-29A, miR-29B and miR-29C
were higher than other miRNAs. Notably, the target gene Igf1
was regulated by miR-29A, miR-29B and miR-29C.
Rac2, a member of Rac sub-class 3 proteins
(including Rac1, Rac2 and Rac3), is a well-studied small GTPase
(36,37). Among sub-class proteins, there are
92% sequence identity between Rac1 and Rac2, 83% identity between
Rac2 and Rac3, and 77% identity between Rac1 and Rac3 (18). Rac2 is only expressed in
hematopoietic and endothelial cells, while Rac1 and Rac3 are
comprehensively expressed in mammalian systems (36–38).
Rac2, the hematopoietic specific GTPase, plays an obligate role in
endothelial integrin signaling and the postnatal neovascularization
response in vivo (19).
Additionally, some studies demonstrated that Rac2 regulates
FcγR-mediated phagocytosis (39–41).
Consistent with Yang et al (42), this study also shows that RAC2 is
related to FcγR-mediated phagocytosis pathway in brain ischemia by
bioinformatics methods. Yang et al (42) point that pathological nerve pain
may be related to immune dysfunctions. Here, our results showed
that RAC2 gene and FcγR-mediated phagocytosis pathway may
have vital effect on the progress of pathological nerve pain in
nervous system. Therefore, RAC2 may play an important role in the
development of brain ischemia by mediating FcγR-mediated
phagocytosis pathway.
In recent years, Kriegel et al reveal that
the miR-29 family, including miR-29A, miR-29B-1, miR-29B-2
and miR-29C (43), is found
to be enriched in astrocytes (44). Previous study also shows that
miR-29 family is downregulated in cortex (45), but is upregulated in hippocampus
after focal ischemia (46).
miR-29A/B-1 is reported in Alzheimer's disease (47). Ouyang et al uncover that
miR-29A is significantly upregulated in astrocytes, and
regulates ischemic injury by BH3-only protein PUMA (22). The study shows that miR-29B
loss at the infarct site is an important contributor to stroke
lesion by 12-lipoxygenase pathway (48). Downregulated miR-29C
promotes ischemic brain damage by its target gene DNMT3a. REST, an
upstream transcriptional controller of miR-29C, can impede
miR-29C downregulation and ischemic neuronal death by
reducing REST induction (49). In
this study, the degrees of miR-29A, miR-29B and
miR-29C were higher than other miRNAs in the miRNA-target
regulatory network. These results suggest that miR-29A/B/C may be
novel biomarkers for the protection of brain ischemia injury.
Intriguingly, these results were also in accordance with previous
studies (22,48,49).
In addition, our results indicated that miR-29A/B/C regulated the
upregulated target gene Igf1 in brain ischemia. Nicholas
et al find that Igf1 and Il1RAP are direct
targets of miR-29 in biliary atresia (50). Therefore, we speculated that
Igf1 targeted by miR-29A/B/C may have significant effect in
brain ischemia. However, the detailed regulatory relationship
between Igf1 and miR-29A/B/C in brain ischemia is not
validated.
In conclusion, this study indicated that RAC2 may
function in brain ischemia through the FcγR-mediated phagocytosis
pathway. Meanwhile, miR-29A/B/C and their target gene
Igf1 may have critical roles in brain ischemia. This study
provides new insights into the molecular mechanisms for the
progression of brain ischemia and suggests directions for future
study. However, it is essential for verifying these results by the
experiment in the future.
Acknowledgements
Not applicable.
Funding
This study was supported by the National Natural
Science Foundation of China (grant no. 81270435).
Availability of data and materials
The datasets used and/or analyzed during the present
study are available from the corresponding author on reasonable
request.
Authors' contributions
JH and YG conceived and designed the research. YZ
acquired the data. WP, GW and XL analyzed and interpreted the data.
JH and HY performed the statistical analysis. YG obtained the
funding. JH drafted the manuscript. YG, GW and XL revised the
manuscript. All authors have read and approved the final
manuscript.
Ethics approval and consent to
participate
The animal experiments were conducted in accordance
with the guidelines of the National Institutes of Health Guide for
the Care and Use of Laboratory Animals. The study of Lai et
al was approved by the Animal Care and Use Committee of Fujian
University of Traditional Chinese Medicine.
Consent for publication
Not applicable.
Competing interests
The authors declare that they have no competing
interest.
References
|
1
|
Muresanu DF, Buzoianu A, Florian SI and
von Wild T: Towards a roadmap in brain protection and recovery. J
Cell Mol Med. 16:2861–2871. 2012. View Article : Google Scholar : PubMed/NCBI
|
|
2
|
Hankey GJ: Anticoagulant therapy for
patients with ischaemic stroke. Nat Rev Neurol. 8:319–328. 2012.
View Article : Google Scholar : PubMed/NCBI
|
|
3
|
Klimkiewicz P, Kubsik A and
Woldańska-Okońska M: NDT-Bobath method used in the rehabilitation
of patients with a history of ischemic stroke. Wiad Lek.
65:102–107. 2012.(In Polish). PubMed/NCBI
|
|
4
|
Malki N, Koupil I, Eloranta S, Weibull CE,
Tiikkaja S, Ingelsson E and Sparén P: Temporal trends in incidence
of myocardial infarction and ischemic stroke by socioeconomic
position in Sweden 1987–2010. PLoS One. 9:e1052792014. View Article : Google Scholar : PubMed/NCBI
|
|
5
|
Sherzai AZ, Ma H, Hornross P, Canchola AJ,
Voutsinas J, Willey JZ, Gu Y, Scarmeas N, Sherzai D, Bernstein L,
et al: Abstract MP85: Mediterranean diet and incidence of stroke in
the California teachers study. Circulation. 131:AMP85. 2015.
|
|
6
|
Khoury JC, Kissela B, Sucharew H, Alwell
K, Moomaw C, Woo D, Flaherty M, Adeoye O, Khatri P, Ferioli S, et
al: Abstract 145: Is the rate of ischemic stroke incidence changing
differentially over time for women and men? In:
American-Heart-Association/American-Stroke-Association
International. Stroke. 44 Suppl 1:A1452013.
|
|
7
|
Tu XS: Epidemiological studies of acute
ischemic stroke. Chin J Clin Neurosci. 24:594–599. 2016.
|
|
8
|
Li L, Li H and Li M: Curcumin protects
against cerebral ischemia-reperfusion injury by activating
JAK2/STAT3 signaling pathway in rats. Int J Clin Exp Med.
8:14985–14991. 2015.PubMed/NCBI
|
|
9
|
Yepes M, Roussel BD, Ali C and Vivien D:
Tissue-type plasminogen activator in the ischemic brain: More than
a thrombolytic. Trends Neurosci. 32:48–55. 2009. View Article : Google Scholar : PubMed/NCBI
|
|
10
|
Yang Y, Jiang S, Dong Y, Fan C, Zhao L,
Yang X, Li J, Di S, Yue L, Liang G, et al: Melatonin prevents cell
death and mitochondrial dysfunction via a SIRT1-dependent mechanism
during ischemic-stroke in mice. J Pineal Res. 58:61–70. 2015.
View Article : Google Scholar : PubMed/NCBI
|
|
11
|
Palencia G, Medrano JÁ, Ortiz-Plata A,
Farfán DJ, Sotelo J, Sánchez A and Trejo-Solís C: Anti-apoptotic,
anti-oxidant, and anti-inflammatory effects of thalidomide on
cerebral ischemia/reperfusion injury in rats. J Neurol Sci.
351:78–87. 2015. View Article : Google Scholar : PubMed/NCBI
|
|
12
|
Nicolas CS, Amici M, Bortolotto ZA,
Doherty A, Csaba Z, Fafouri A, Dournaud P, Gressens P, Collingridge
GL and Peineau S: The role of JAK-STAT signaling within the CNS.
JAKSTAT. 2:e229252013.PubMed/NCBI
|
|
13
|
Wang G, Zhou D, Wang C, Gao Y, Zhou Q,
Qian G and Decoster MA: Hypoxic preconditioning suppresses group
III secreted phospholipase A2-induced apoptosis via JAK2-STAT3
activation in cortical neurons. J Neurochem. 114:1039–1048.
2010.PubMed/NCBI
|
|
14
|
Zhou TF and Yu JG: Recombinant human
erythropoietin attenuates neuronal apoptosis and cognitive defects
via JAK2/STAT3 signaling in experimental endotoxemia. J Surg Res.
183:304–312. 2013. View Article : Google Scholar : PubMed/NCBI
|
|
15
|
Feng Q, Wang YI and Yang Y:
Neuroprotective effect of interleukin-6 in a rat model of cerebral
ischemia. Exp Ther Med. 9:1695–1701. 2015. View Article : Google Scholar : PubMed/NCBI
|
|
16
|
Zhu H, Zou L, Tian J, Du G and Gao Y:
SMND-309, a novel derivative of salvianolic acid B, protects rat
brains ischemia and reperfusion injury by targeting the JAK2/STAT3
pathway. Eur J Pharmacol. 714:23–31. 2013. View Article : Google Scholar : PubMed/NCBI
|
|
17
|
Yasukawa H, Misawa H, Sakamoto H, Masuhara
M, Sasaki A, Wakioka T, Ohtsuka S, Imaizumi T, Matsuda T and Ihle
JN: The JAK-binding protein JAB inhibits Janus tyrosine kinase
activity through binding in the activation loop. EMBO J.
18:1309–1320. 1999. View Article : Google Scholar : PubMed/NCBI
|
|
18
|
Pradip D, Peng X and Durden DL: Rac2
specificity in macrophage integrin signaling: Potential role for
Syk kinase. J Biol Chem. 278:41661–14669. 2003. View Article : Google Scholar : PubMed/NCBI
|
|
19
|
De P, Peng Q, Traktuev DO, Li W, Yoder MC,
March KL and Durden DL: Expression of RAC2 in endothelial cells is
required for the postnatal neovascular response. Exp Cell Res.
315:248–263. 2009. View Article : Google Scholar : PubMed/NCBI
|
|
20
|
Joshi S, Singh AR, Zulcic M, Bao L, Messer
K, Ideker T, Dutkowski J and Durden DL: Rac2 controls tumor growth,
metastasis and M1-M2 macrophage differentiation in vivo. PLoS One.
9:e958932014. View Article : Google Scholar : PubMed/NCBI
|
|
21
|
Saugstad JA: MicroRNAs as effectors of
brain function with roles in ischemia and injury, neuroprotection,
and neurodegeneration. J Cereb Blood Flow Metab. 30:1564–1576.
2010. View Article : Google Scholar : PubMed/NCBI
|
|
22
|
Ouyang YB, Xu L, Lu Y, Sun X, Yue S, Xiong
XX and Giffard RG: Astrocyte-enriched miR-29a targets PUMA and
reduces neuronal vulnerability to forebrain ischemia. Glia.
61:1784–1794. 2013. View Article : Google Scholar : PubMed/NCBI
|
|
23
|
Lai W, Zheng Z, Zhang X, Wei Y, Chu K,
Brown J, Hong G and Chen L: Salidroside-mediated neuroprotection is
associated with induction of early growth response genes (Egrs)
across a wide therapeutic window. Neurotox Res. 28:108–121. 2015.
View Article : Google Scholar : PubMed/NCBI
|
|
24
|
Barrett T, Suzek TO, Troup DB, Wilhite SE,
Ngau WC, Ledoux P, Rudnev D, Lash AE, Fujibuchi W and Edgar R: NCBI
GEO: Mining millions of expression profiles-database and tools.
Nucleic Acids Res. 33:D562–D566. 2005. View Article : Google Scholar : PubMed/NCBI
|
|
25
|
Smyth GK: Limma: Linear Models for
Microarray DataBioinformatics and Computational Biology Solutions
Using R and Bioconductor. Gentleman R, Carey VJ, Huber W, Irizarry
RA and Dudoit S: Springer; New York, NY: pp. 397–420. 2005,
View Article : Google Scholar
|
|
26
|
Kolde R: Pheatmap: Pretty HeatmapsR
Package. Version 0.7. 7. CRAN Repository; 2012
|
|
27
|
Ashburner M, Ball CA, Blake JA, Botstein
D, Butler H, Cherry JM, Davis AP, Dolinski K, Dwight SS, Eppig JT,
et al: Gene ontology: Tool for the unification of biology. The Gene
Ontology Consortium. Nat Genet. 25:25–29. 2000. View Article : Google Scholar : PubMed/NCBI
|
|
28
|
Kanehisa M and Goto S: KEGG: Kyoto
Encyclopedia of Genes and Genomes. Nucleic Acids Res. 28:27–30.
2000. View Article : Google Scholar : PubMed/NCBI
|
|
29
|
Du J, Yuan Z, Ma Z, Song J, Xie X and Chen
Y: KEGG-PATH: Kyoto encyclopedia of genes and genomes-based pathway
analysis using a path analysis model. Mol Biosyst. 10:2441–2447.
2014. View Article : Google Scholar : PubMed/NCBI
|
|
30
|
Szklarczyk D, Franceschini A, Wyder S,
Forslund K, Heller D, Huerta-Cepas J, Simonovic M, Roth A, Santos
A, Tsafou KP, et al: STRING v10: PRotein-protein interaction
networks, integrated over the tree of life. Nucleic Acids Res.
43:(Database Issue). D447–D452. 2015. View Article : Google Scholar : PubMed/NCBI
|
|
31
|
Shannon P, Markiel A, Ozier O, Baliga NS,
Wang JT, Ramage D, Amin N, Schwikowski B and Ideker T: Cytoscape: A
software environment for integrated models of biomolecular
interaction networks. Genome Res. 13:2498–2504. 2003. View Article : Google Scholar : PubMed/NCBI
|
|
32
|
Bandettini WP, Kellman P, Mancini C,
Booker OJ, Vasu S, Leung SW, Wilson JR, Shanbhag SM, Chen MY and
Arai AE: MultiContrast Delayed Enhancement (MCODE) improves
detection of subendocardial myocardial infarction by late
gadolinium enhancement cardiovascular magnetic resonance: A
clinical validation study. J Cardiovasc Magn Reson. 14:832012.
View Article : Google Scholar : PubMed/NCBI
|
|
33
|
Slezak-Prochazka I, Durmus S, Kroesen BJ
and van den Berg A: MicroRNAs, macrocontrol: Regulation of miRNA
processing. RNA. 16:1087–1095. 2010. View Article : Google Scholar : PubMed/NCBI
|
|
34
|
Wang J, Duncan D, Shi Z and Zhang B:
WEB-based GEne SeT AnaLysis Toolkit (WebGestalt): update 2013.
Nucleic Acids Res. 41:W77–W83. 2013. View Article : Google Scholar : PubMed/NCBI
|
|
35
|
Zhang B, Kirov S and Snoddy J: WebGestalt:
An integrated system for exploring gene sets in various biological
contexts. Nucleic Acids Res. 33:W741–W748. 2005. View Article : Google Scholar : PubMed/NCBI
|
|
36
|
Didsbury J, Weber RF, Bokoch GM, Evans T
and Snyderman R: rac, a novel ras-related family of proteins that
are botulinum toxin substrates. J Biol Chem. 264:16378–16382.
1989.PubMed/NCBI
|
|
37
|
Haataja L, Groffen J and Heisterkamp N:
Characterization of RAC3, a novel member of the Rho family. J Biol
Chem. 272:20384–20388. 1997. View Article : Google Scholar : PubMed/NCBI
|
|
38
|
Diekmann D, Nobes CD, Burbelo PD, Abo A
and Hall A: Rac GTPase interacts with GAPs and target proteins
through multiple effector sites. EMBO J. 14:5297–5305.
1995.PubMed/NCBI
|
|
39
|
Ueyama T, Eto M, Kami K, Tatsuno T,
Kobayashi T, Shirai Y, Lennartz MR, Takeya R, Sumimoto H and Saito
N: Isoform-specific membrane targeting mechanism of Rac during Fc
gamma R-mediated phagocytosis: Positive charge-dependent and
independent targeting mechanism of Rac to the phagosome. J Immunol.
175:2381–2390. 2005. View Article : Google Scholar : PubMed/NCBI
|
|
40
|
Yamauchi A, Li SJ, Marchal CC and Dinauer
MC: Rac2-null macrophages have defects in superoxide production and
Fc gamma-R-mediated phagocytosis. Blood. 100:17722002.
|
|
41
|
Patel JC, Hall A and Caron E: Vav
regulates activation of Rac but not Cdc42 during FcgammaR-mediated
phagocytosis. Mol Biol Cell. 13:1215–1226. 2002. View Article : Google Scholar : PubMed/NCBI
|
|
42
|
Yang YK, Lu XB, Wang YH, Yang MM and Jiang
DM: Identification crucial genes in peripheral neuropathic pain
induced by spared nerve injury. Eur Rev Med Pharmacol Sci.
18:2152–2159. 2014.PubMed/NCBI
|
|
43
|
Kriegel AJ, Liu Y, Fang Y, Ding X and
Liang M: The miR-29 family: Genomics, cell biology, and relevance
to renal and cardiovascular injury. Physiol Genomics. 44:237–244.
2012. View Article : Google Scholar : PubMed/NCBI
|
|
44
|
Smirnova L, Gräfe A, Seiler A, Schumacher
S, Nitsch R and Wulczyn FG: Regulation of miRNA expression during
neural cell specification. Eur J Neurosci. 21:1469–1477. 2005.
View Article : Google Scholar : PubMed/NCBI
|
|
45
|
Dharap A, Bowen K, Place R, Li LC and
Vemuganti R: Transient focal ischemia induces extensive temporal
changes in rat cerebral microRNAome. J Cereb Blood Flow Metab.
29:675–687. 2009. View Article : Google Scholar : PubMed/NCBI
|
|
46
|
Yuan Y, Wang JY, Xu LY, Cai R, Chen Z and
Luo BY: MicroRNA expression changes in the hippocampi of rats
subjected to global ischemia. J Clin Neurosci. 17:774–778. 2010.
View Article : Google Scholar : PubMed/NCBI
|
|
47
|
Shioya M, Obayashi S, Tabunoki H, Arima K,
Saito Y, Ishida T and Satoh J: Aberrant microRNA expression in the
brains of neurodegenerative diseases: miR-29a decreased in
Alzheimer disease brains targets neurone navigator 3. Neuropathol
Appl Neurobiol. 36:320–330. 2010. View Article : Google Scholar : PubMed/NCBI
|
|
48
|
Khanna S, Rink C, Ghoorkhanian R, Gnyawali
S, Heigel M, Wijesinghe DS, Chalfant CE, Chan YC, Banerjee J, Huang
Y, et al: Loss of miR-29b following acute ischemic stroke
contributes to neural cell death and infarct size. J Cereb Blood
Flow Metab. 33:1197–1206. 2013. View Article : Google Scholar : PubMed/NCBI
|
|
49
|
Pandi G, Nakka VP, Dharap A, Roopra A and
Vemuganti R: MicroRNA miR-29c downregulation leading to
de-repression of its target DNA methyltransferase 3a promotes
ischemic brain damage. PLoS One. 8:e580392013. View Article : Google Scholar : PubMed/NCBI
|
|
50
|
Hand NJ, Horner AM, Master ZR, Boateng LA,
LeGuen C, Uvaydova M and Friedman JR: MicroRNA profiling identifies
miR-29 as a regulator of disease-associated pathways in
experimental biliary atresia. J Pediatr Gastroenterol Nutr.
54:186–192. 2012. View Article : Google Scholar : PubMed/NCBI
|