Introduction
It has become increasingly apparent that the
non-protein coding parts of the genome, including microRNAs (miRs),
are crucial for normal development and function in humans (1). miRs regulate gene expression by
mediating post-transcriptional gene silencing through degradation
of target mRNAs or translation inhibition (2). Although the exact mechanism
underlying miR targeting and activity is not completely understood,
a single miR may regulate multiple target genes, and a single gene
may be regulated by multiple miRs (3). Thus, miRs are predicted to control
the expression of 50–60% of all coding genes within mammalian
genomes (3). Consequently, miRs
have been demonstrated to regulate a number of biological
processes, including growth, metabolism and inflammatory responses
(4), and alterations in their
expression have been frequently observed in various diseases
(5,6).
As miRs have additionally been identified
extracellularly, packaged in microvesicles or bound to proteins,
they are very stable and protected from RNase digestion (7,8). In
addition, the expression levels of circulating miRs in the blood
differed considerably between healthy people and those with
diseases, suggesting that they may be ideal biomarkers for a number
of diseases, including cancer (9,10),
type 2 diabetes (T2D) and associated vascular complications
(11–14).
Diabetic nephropathy (DN) is an important long-term
microvascular complication of diabetes mellitus and is a notable
cause of end-stage renal disease (ESRD) with a high mortality rate,
primarily among patients with T2D who frequently remain undiagnosed
for a number of years (15) as
hyperglycemia develops gradually and may not produce any symptoms
(15,16). DN is characterized by glomerular
basement membrane thickening, mesangial expansion and hypertrophy,
and an accumulation of extracellular matrix (ECM) proteins
(17). Although the pathogenesis
of DN is not completely understood, numerous mechanisms have been
proposed to be involved, including the overproduction of reactive
oxygen species, formation of advanced glycation end products,
activation of protein kinase C and upregulation of transforming
growth factor (TGF)-β1, leading to the deposition of ECM proteins,
including collagen and fibronectin in the mesangium, and renal
tubulointerstitium of the glomerulus and basement membranes
(18,19).
Clinically, DN is characterized by increased rates
of urinary albumin excretion and decreased renal function and
glomerular filtration rate. Diabetic patients at risk of developing
DN go through the stages of normoalbuminuria, microalbuminuria and
macroalbuminuria, and eventually ESRD (20). While microalbuminuria may be an
indicator of early DN, macroalbuminuria represents DN progression
(20). It has been reported that
impaired renal function may present in diabetic patients in the
absence of significant increases in microalbuminuria, or while
remaining normoalbuminuric (21,22).
Moreover, a number of DN-associated structural alterations have
been demonstrated to be already manifested prior to the development
of microalbuminuria (23,24). Therefore, microalbuminuria has been
regarded as an indicator of kidney damage rather than a DN
prognostic marker (25,26). Microalbuminuria is strongly and
independently associated with increased cardiovascular risk among
individuals with and without diabetes (27), and was associated with impaired
arterial and venous endothelium-dependent vasodilation in patients
with T2D (28). These studies
highlight the requirement for more sensitive biomarkers for the
early detection of DN (29,30),
which is a key point in disease management. A previous study
reported that numerous miRs regulate signaling pathways in the
diabetic kidney, and their dysregulation contributes to DN
pathogenesis and development (31). Among the earliest studied miRs that
regulate pathological pathways induced in DN are miR-377 and
miR-192.
miR-377 has been demonstrated to be overexpressed in
in vitro and in vivo models of DN and its increase
suppressed the translation of p21-activated kinase and manganese
superoxide dismutase 1 and 2, and enhanced the production of
fibronectin, a matrix protein that excessively accumulates in DN
(32). By contrast, miR-192 has
been reported to be implicated in the development of matrix
accumulation by controlling TGF-β-induced collagen type 1 α-2
(COL1A2) expression by downregulating the E-box repressors zinc
finger E-box-binding homeobox (ZEB)1 and ZEB2 (33), and thus serves a vital role in the
development and progression of DN.
Given that circulating miRs reflect a
tissue-specific injury or expression (34), and as a number of these circulating
miRs may represent a potential novel source of non-invasive
biomarkers for kidney diseases (35,36),
the present study aimed to evaluate the expression of miR-192 and
miR-377 and to establish their potential as blood-based biomarkers
in the early stage of DN in patients with T2D.
Materials and methods
Patients and healthy controls
In the period between January 2013 and October 2014,
55 patients diagnosed with T2D with and without DN at King Abdullah
University Medical Centre (Arabian Gulf University, Manama, Kingdom
of Bahrain) and 30 healthy control individuals without any history
of T2D, were recruited. Patient characteristics are displayed in
Table I. The following parameters
were studied in the participants: Age, sex, body mass index (BMI),
mean blood pressure, fasting blood glucose (FG) levels, glycated
hemoglobin (HbA1c), diabetes duration, urinary albumin excretion
rate (AER), albumin-to-creatinine ratio (ACR), serum creatinine,
estimated glomerular filtration rate (eGFR), total cholesterol, low
density lipoprotein (LDL), high density lipoprotein (HDL) and
triglyceride. The diabetic patients were divided into three groups
according to ACR as follows: 30 patients with normoalbuminuria
(ACR, <3.5 mg/mmol), 15 patients with microalbuminuria (ACR,
2.5–25 mg/mmol) and 10 patients with macroalbuminuria (ACR, >25
mg/mmol). The diabetic patients fulfilled the World Health
Organization criteria for T2D (37). Renal function was established based
on eGFR according to the Modification of Diet in Renal Disease
formula (38). Informed consent
was provided by the patients and procedures were approved by the
Medical Research and Ethics Committee at the College of Medicine
and Medical Sciences, Arabian Gulf University.
 | Table I.Baseline characteristics of
patients. |
Table I.
Baseline characteristics of
patients.
|
| T2D | DN |
|
|---|
|
|
|
|
|
|---|
| Characteristic |
Normoalbuminuria |
Microalbuminuria |
Macroalbuminuria | Healthy |
|---|
| No. of
subjects | 30 | 15 | 10 | 30 |
| Age, years | 60.3±12.2 | 61.2±6.1 |
67.3±6.0a,b | 56.4±5.1 |
| Sex,
male/female | 12/18 | 11/4 | 4/6 | 14/16 |
| BMI,
kg/m2 | 25.7±5.2 |
29.1±5.7a,b |
27.1±5.5a,b | 24.2±4.6 |
| FG, mmol/l |
8.6±13.6a |
9.5±1.8a,b |
9.8±1.7a,b | 4.3±0.6 |
| HbA1c, % |
8.7±2.6a |
9.7±1.1a,b |
11.2±1.6a,b | 5.0±0.7 |
| Diabetes duration,
years | 15.0±4.4 | 16.2±4.8 |
18.0±2.9b | – |
| Mean blood
pressure, mmHg | 87.5±5.3 |
95.1±11.6a,b |
105.1±17.4a,b | 86.9±4.0 |
| Albuminuria,
mg/day | 6.0±3.5 |
100.3±41.9a,b |
325.4±24.3a,b | 4.9±1.7 |
| ACR, mg/mmol | 1.0±0.7 |
13.9±7.3a,b |
30.4±8.7a,b | 0.78±0.3 |
| Serum creatinine,
µm/l |
68.1±16.0a |
100.7±38.8a,b |
141.1±33.0a,b | 55.4±10.0 |
| eGFR, ml/min/1.73
m2 | 97.0±10.6 |
76.9±6.6a,b |
55.4±8.3a,b | 106.3±13.7 |
| LDL, mmol/l |
2.4±1.1a |
3.5±1.6a,b |
4.2±1.1a,b | 2.1±0.8 |
| HDL, mmol/l | 1.3±0.2 | 1.2±0.2 | 1.4±0.3 | 1.3±0.3 |
| Triglyceride,
mmol/l | 1.6±0.5 |
2.0±1.1a,b |
3.1±1.1a,b | 1.6±0.6 |
| Total cholesterol,
mmol/l | 4.6±1.1 | 4.6±1.3 |
4.9±0.3a,b | 4.3±0.6 |
Blood collection and miR
extraction
Peripheral blood samples (5 ml) were collected from
the participants in EDTA-coated tubes (BD Biosciences, Franklin
Lakes, NJ, USA). Aliquots of 0.5 ml EDTA-blood were mixed with 1.3
ml RNA later, an RNA stabilizing agent (Ambion; Thermo Fisher
Scientific, Inc., Waltham, MA, USA). The samples were stored at
−80°C until processing. Total RNA, including miRs, was extracted
from whole blood using a blood miR kit (Qiagen GmbH, Hilden,
Germany), as previously described (11,14,36).
RNA quality and concentration were assessed using a NanoDrop
ND-1000 spectrophotometer (Thermo Fisher Scientific, Inc.). RNA
purity was determined by measuring the absorbance ratios 260/280 nm
and 260/230 nm. All RNA samples were diluted to final identical
concentrations of 20 ng/µl.
Reverse transcription-quantitative
polymerase chain reaction (RT-qPCR) analysis
Total RNA was reverse transcribed for the target
miRs (miR-377 and miR-192) and the housekeeping miR (RNU6B) using a
TaqMan microRNA RT kit (Applied Biosystems; Thermo Fisher
Scientific, Inc.). For cDNA synthesis, RNA (20 ng) was mixed with
specific stem-loop RT primers (3 µl), 100 mM dNTPs (0.15 µl), 10X
RT buffer (1.5 µl), 20 U/µl RNase inhibitor (0.19 µl) and 50 U/ml
MultiScribe™ Reverse Transcriptase (1 µl). Nuclease-free water was
added to a final volume of 15 µl. The reactions were incubated in a
GeneAmp® PCR System 9700 thermal cycler (Applied
Biosystems; Thermo Fisher Scientific, Inc.) in a 96-well plate at
16°C for 30 min, followed by 42°C for 30 min, 85°C for 5 min and
then 4°C.
Subsequently, the expression levels of miR-377 and
miR-192 were determined via qPCR using RNU6B as a control. qPCR was
performed using a TaqMan microRNA assay on a Real-Time PCR
detection system (Applied Biosystems; Thermo Fisher Scientific,
Inc.), as previously described (10,11,14,36),
with the cycling conditions of 95°C for 10 min, 95°C for 15 sec and
60°C for 60 sec for 40 cycles. The primers used were: miR-377
forward, 5′-ACAAAAGTTGCCTTTGTGTGAT-3′ and reverse,
GGCTAGTCTCGTGATCGA-3′; miR-192 forward,
5′-CTGACCTATGAATTGACAGCCA-3′ and reverse,
5′-GCTGTCAACGATACGCTACGT-3′; and RNU6B forward,
5′-GCTTCGGCAGCACATATACTAAAAT-3′ and reverse,
5′-CGCTTCACGAATTTGCGTGTCAT-3′.
Each sample was run in duplicate, and the quantity
of miRs in each sample was calculated as the quantification cycle
(Cq) and normalized to that of endogenous control RNU6B. For each
sample, the difference in the Cq of the target and the Cq of the
reference was calculated as ΔCq, and the fold change of relative
expression (ΔΔCq) was determined by calculating the difference in
ΔCq of the case and ΔCq of the control. The relative quantification
was calculated using the 2−ΔΔCq method as previously
described (10,11,14,36).
The data were analyzed using Sequence Detection software, version
1.7 (Applied Biosystems; Thermo Fisher Scientific, Inc.).
Statistical analysis
Differences in the expression of miRs and other
clinical parameters between cases (T2D or DN) and controls were
obtained using the Student's t-test. Differences in the expression
of miRs and other clinical parameters among the three subject
groups were completed using one-way analysis of variance and Tukey
post hoc tests. All quantitative data were presented as the mean ±
standard deviation.
Multivariate tests were performed using the
regression models for association, with unadjusted odds ratios
(aModel 1 and bModel 1) or adjusted odds
ratios (aModel 2, bModel 2) for different
variables such as age, sex, BMI, FG, HbA1c, diabetes duration, mean
blood presser, LDL, triglyceride and total cholesterol.
Linear regression stepwise analyses were performed
to identify independent predictors. Receiver operating
characteristic (ROC) analyses were performed and the areas under
ROC curves (AUCs) were used as the accuracy indexes for evaluating
the diagnostic ability of the miRs. For correlation analyses,
Pearson's correlation coefficient was used. All statistical
analyses were performed using SPSS software version 21 (IBM Corps.,
Armonk, NY, USA) and a 2-sided P < 0.05 was considered to
indicate a statistically significant difference.
Results
Baseline characteristics of
participants
A total of 85 patients were recruited in this study:
55 patients with T2D with and without DN, and 30 healthy control
subjects. The diabetic patients were classified according to ACR
into three groups: Normoalbuminuric group (n=30), microalbuminuric
group (n=15) and macroalbuminuric group (n=10). The baseline
characteristics of participants are presented in Table I.
Among the patients, there were 12 males and 18
females in the normoalbuminuric group, 11 males and 4 females in
the microalbuminuric group, and 4 males and 6 females in the
macroalbuminuric group. In the control group, 14 were male and 16
were female. The mean age was 60±12 years in the normoalbuminuric
group, 61±6.1 in the microalbuminuric group, 67±6.0 in the
macroalbuminuric group and 56±5.1 in the control group. The mean
age was thus significantly higher in the diabetic patients compared
with the healthy controls (P<0.05). The values of FG and HbA1c
differed among the subject groups and were significantly higher in
the diabetic patients compared with the healthy controls
(P<0.05). The values of BMI, mean blood pressure, ACR, serum
creatinine, total cholesterol, LDL and triglyceride were
significantly higher in patients with microalbuminuria and
macroalbuminuria, compared with patients with normoalbuminuria and
controls (P<0.05). There were no significant differences in HDL
values among the subject groups (P>0.05). Furthermore, eGFR
values were significantly lower in patients with macroalbuminuria
compared with patients with microalbuminuria and
normoalbuminuria.
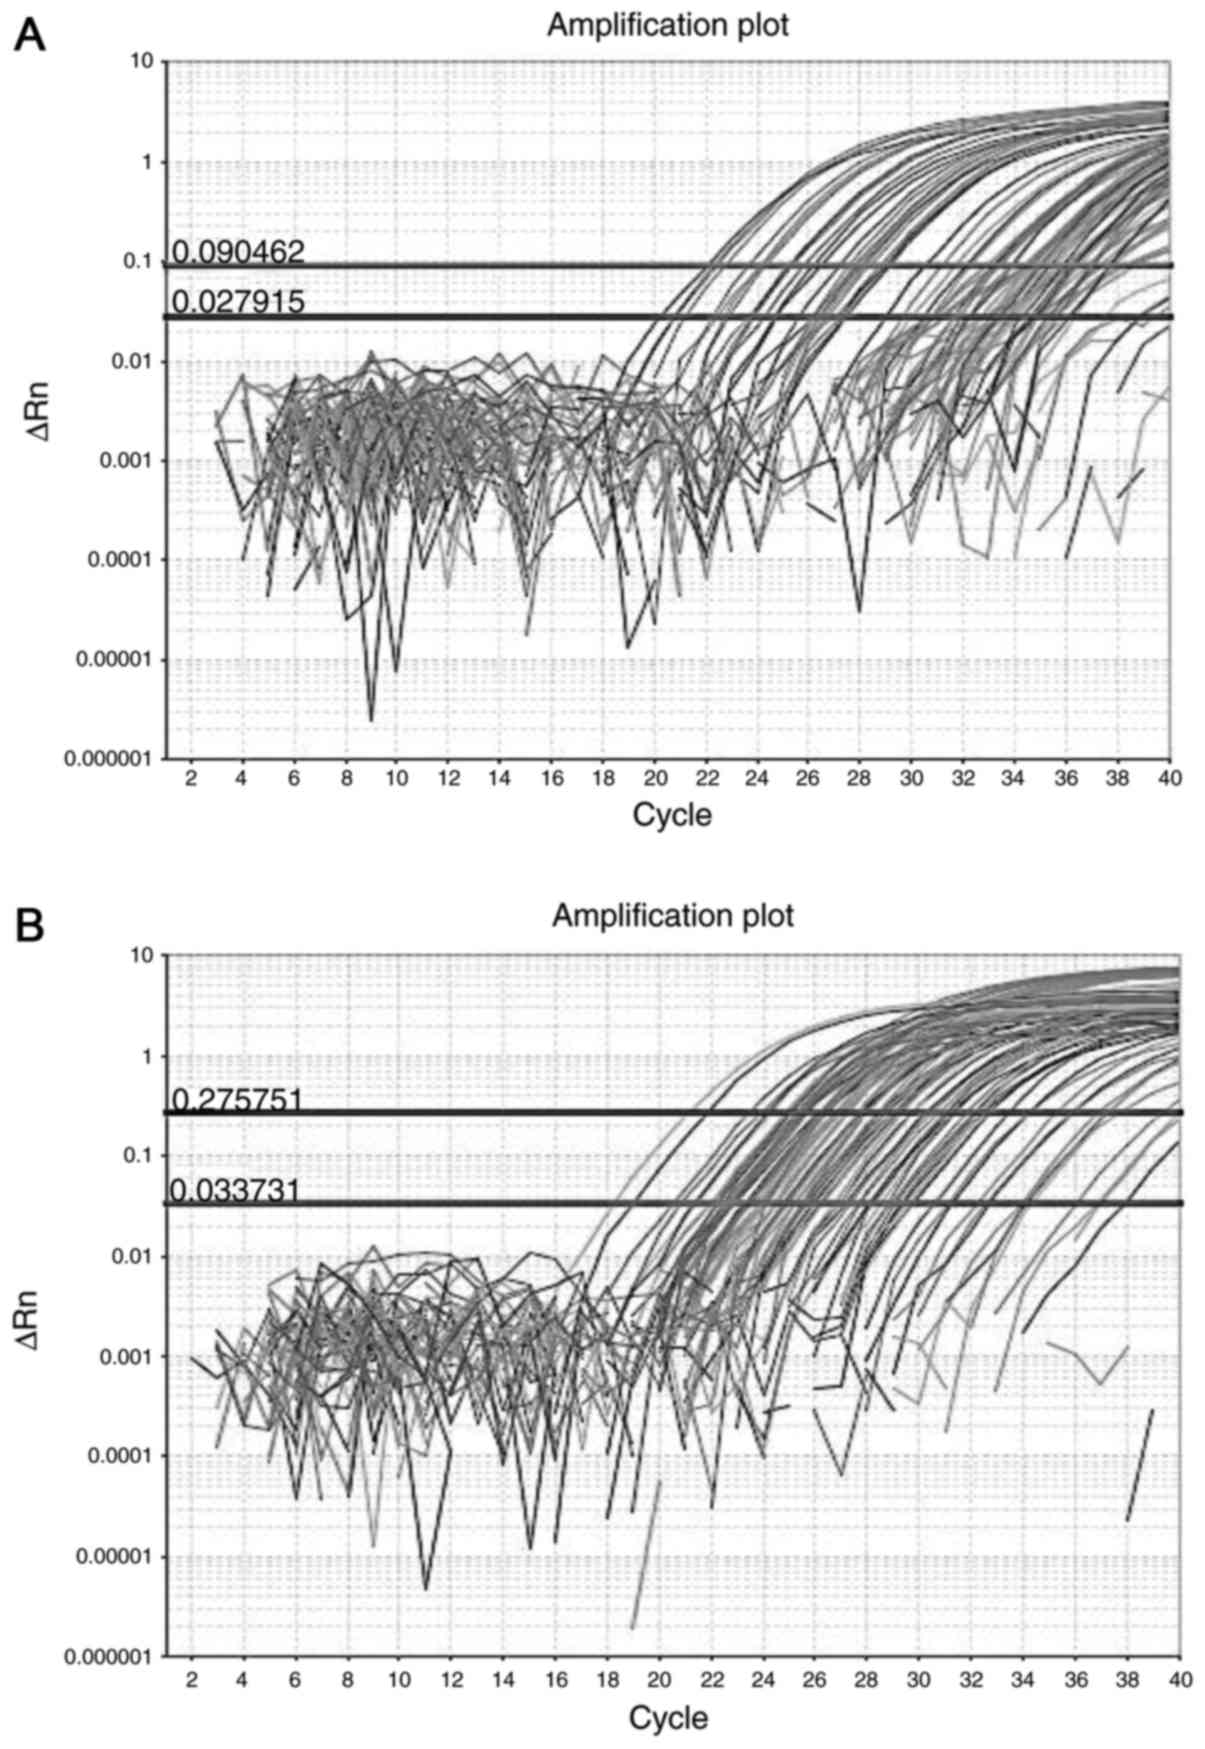
Detection of miR-377 and miR-192 in
whole blood samples
Whole blood samples were collected from subject
groups. miRs were extracted from peripheral blood and converted to
cDNA. Validation experiments were performed to evaluate the
reliability of miR-377 and miR-192 assays by RT-qPCR. The results
demonstrated that miR-377 and miR-195 were successfully amplified
in whole blood samples from subject groups with high PCR
efficiency. The amplification curves for miR-377 and miR-192,
plotted as the increase in fluorescence emissions vs. cycle
numbers, are presented in Fig. 1.
The amplified RT-qPCR products were analyzed by 1.5% agarose gel
electrophoresis in 1X Tris-Borate-EDTA (TBE) buffer containing 89
mM of Tris Base and 89 mM of Boric Acid. Electrophoresis was
performed at 100 V for 60 min. Gel was stained with ethidium
bromide for 10 min prior to visualization using a UV
transilluminator (data are not shown).
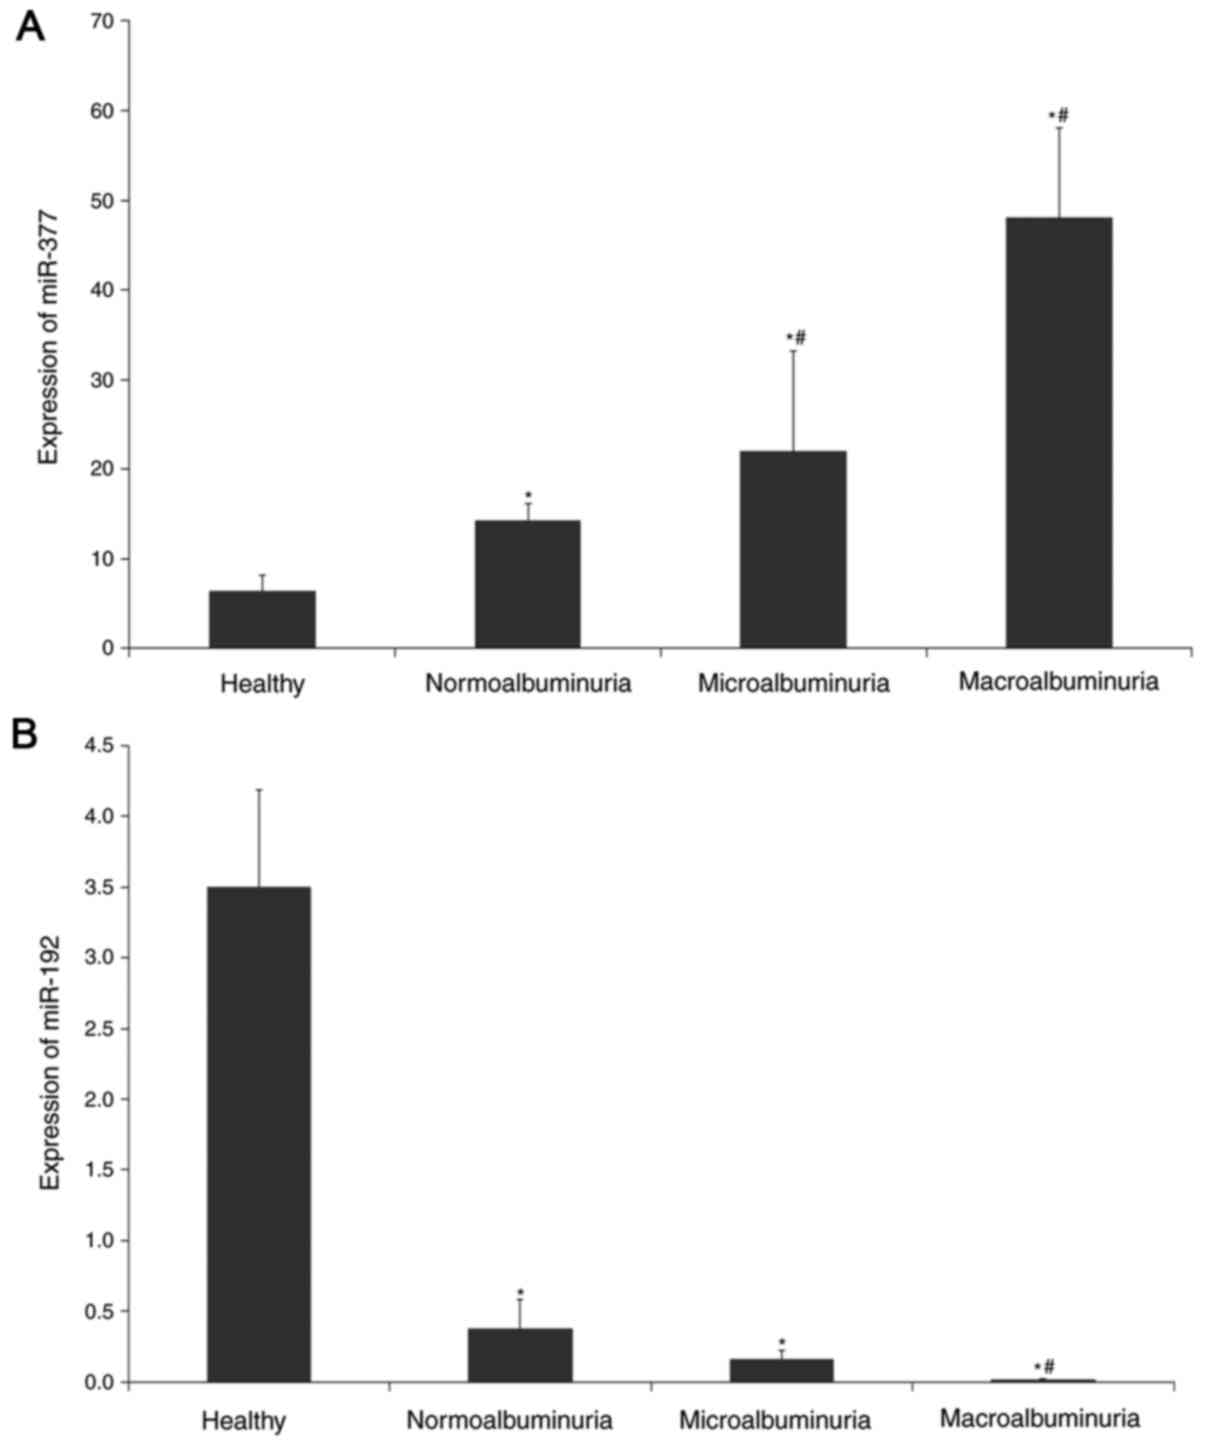
Expression of miR-377 and miR-192 and
their association with albuminuria
Having successfully validated the reliability of
miR-377 and miR-192 assays from whole blood samples, the present
study compared their expression levels in the groups of patients
with normoalbuminuria, microalbuminuria and macroalbuminuria, and
the healthy control subjects by RT-qPCR. The mean expression of
miR-377 and miR-192 normalized to the mean expression of RNU6B was
calculated to determine the fold change in miR expression using the
comparative 2−ΔΔCq method.
Fig. 2 illustrates
the expression of miR-377 and miR-192 in the subject groups. The
expression of miR-377 was significantly higher by 3.5-fold in
overall T2D patients with and without DN compared with the healthy
controls (P<0.005) and was progressively increased in the
normoalbuminuric group and further increased in the
microalbuminuric and macroalbuminuric groups (P<0.005). miR-377
expression was 3.4-fold higher in the macroalbuminuric group and
was 1.4-fold higher in the microalbuminuric group compared with the
normoalbuminuric group (P<0.005).
Conversely, miR-192 expression was decreased by
14-fold in in overall T2D patients with and without DN compared
with the healthy control group (P<0.005). miR-192 expression was
2.4-fold lower in the microalbuminuric group compared with the
normoalbuminuric group, although it did not reach statistical
significance (P>0.05); however, it was significantly lower by
19-fold in the macroalbuminuric group compared with the
normoalbuminuric group (P<0.005).
Regression analysis
To further evaluate the association of miR-377 and
miR-192 with albuminuria and DN risk, regression analysis was
performed. Table II summarizes
the results of the multivariate logistic regression analysis for
miR-377 and miR-192.
| Table II.Multivariate logistic regression
analysis of miR-377 and miR-192. |
Table II.
Multivariate logistic regression
analysis of miR-377 and miR-192.
|
| miR-377 | miR-192 |
|---|
|
|
|
|
|---|
|
| OR | 95% CI | P-value | OR | 95% CI | P-value |
|---|
| aModel 1 |
|
|
|
|
|
|
|
Normoalbuminuria | 1.12 | 1.031–1.215 | 0.02 | 0.621 | 0.386–0.99 | 0.049 |
|
Microalbumiuria/Macroalbuminuria | 1.2 | 1.085–1.289 | 0.001 | 0.153 | 0.03–0.92 | 0.040 |
| bModel 1 |
|
|
|
|
|
|
|
Normoalbuminuria | 1.32 | 1.03–1.244 | 0.011 | 0.821 | 0.63–1.43 | 0.25 |
|
Microalbumiuria/Macroalbuminuria | 1.234 | 1.06–1.44 | 0.007 | 0.472 | 0.09–1.32 | 0.41 |
| aModel 2 |
|
|
|
|
|
|
|
Microalbumiuria/Macroalbuminuria | 1.067 | 1.022–1.115 | 0.04 | 0.421 | 0.109–0.132 | 0.13 |
| bModel 2 |
|
|
|
|
|
|
|
Microalbumiuria/Macroalbuminuria | 1.119 | 0.98–1.217 | 0.018 | 0.505 | 0.123–0.634 | 0.223 |
Using the healthy control group as the reference
category, miR-377 was directly associated with albuminuria and
exhibited an odds ratio (OR) of 1.12 [95% confidence interval (CI),
1.031–1.215; P=0.02] for normoalbuminuria and an OR of 1.2 (95% CI,
1.085–1.289; P=0.001) for microalbuminuria/macroalbuminuria. This
association remained statistically significant following
multivariable adjustment including age, sex, BMI, HbA1c, mean blood
pressure, LDL, triglyceride and total cholesterol (OR, 1.32; 95%
CI, 1.03–1.244; P=0.011 for normoalbuminuria; and OR, 1.234; 95%
CI, 1.06–1.44; P=0.007 for microalbuminuria/macroalbuminuria).
miR-192 was directly associated with albuminuria and
exhibited an OR of 0.621 (95% CI, 0.386–0.99; P=0.049) for
normoalbuminuria and an OR of 0.153 (95% CI, 0.03–0.92; P=0.040)
for microalbuminuria/macroalbuminuria. However, this association
was not significant following adjustment for different parameters
(P>0.05).
When the present study further evaluated the
associations of these miRs with DN risk using the normoalbuminuric
group as the reference category (Table II), multivariate logistic
regression analysis revealed that miR-377 was significantly
associated with the severity of albuminuria and DN risk (OR, 1.067;
95% CI, 1.022–1.115; P=0.04). In addition, miR-377 was demonstrated
to be independently associated with DN risk with an OR of 1.119
(95% CI; 0.98–1.217; P=0.018) adjusted for age, sex, BMI, FG,
HbA1c, diabetes duration, mean blood pressure, LDL, triglyceride
and total cholesterol. By comparison, miR-192 was not an
independent risk factor of DN (OR, 0.421; 95% CI, 0.109–0.132;
P=0.13).
In addition, on applying a linear stepwise
regression model using miR-377 as a dependent variable, only
albuminuria was identified as a significant predictor of miR-377,
among a number of other variables included in the analysis,
including age, sex, BMI, FG, HbA1c, diabetes duration, mean blood
pressure, total cholesterol, triglyceride and LDL (P<0.001).
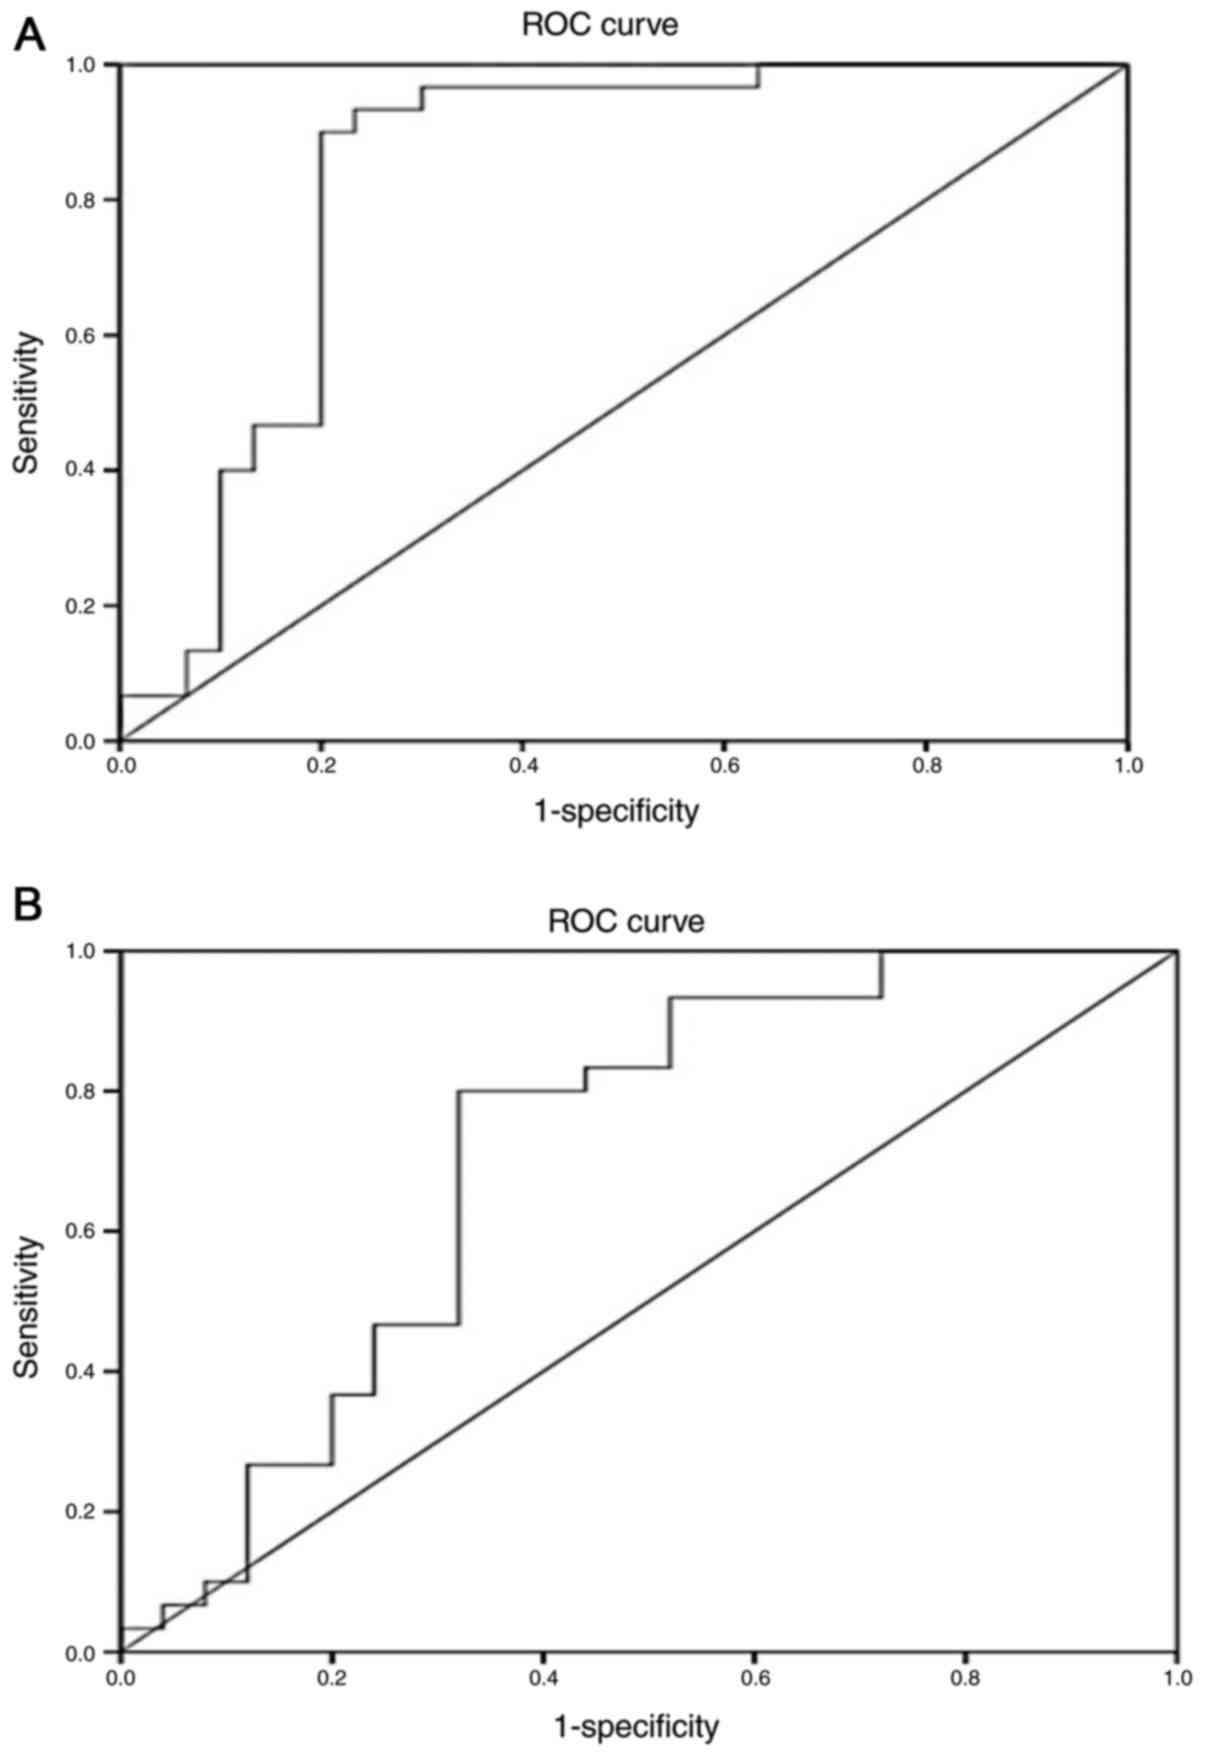
Evaluation of the biomarker potential
of miR-377 and miR-192 for early detection of DN
To further explore whether miR-377 and miR-192 may
be used potential diagnostic biomarkers of DN, ROC analyses were
performed on the subject groups. The ROC curves were constructed
for the two miRs and AUCs were calculated.
The ROC curves for miR-377 yielded an AUC of 0.851
(95% CI, 0.745–0.957; P<0.001) in distinguishing overall
diabetic patients from healthy subjects (Fig. 3A), and an AUC of 0.711 (95% CI,
0.565–0.857; P=0.008) in discriminating the normoalbuminuric group
from the microalbuminuric/macroalbuminuric groups (Fig. 3B).
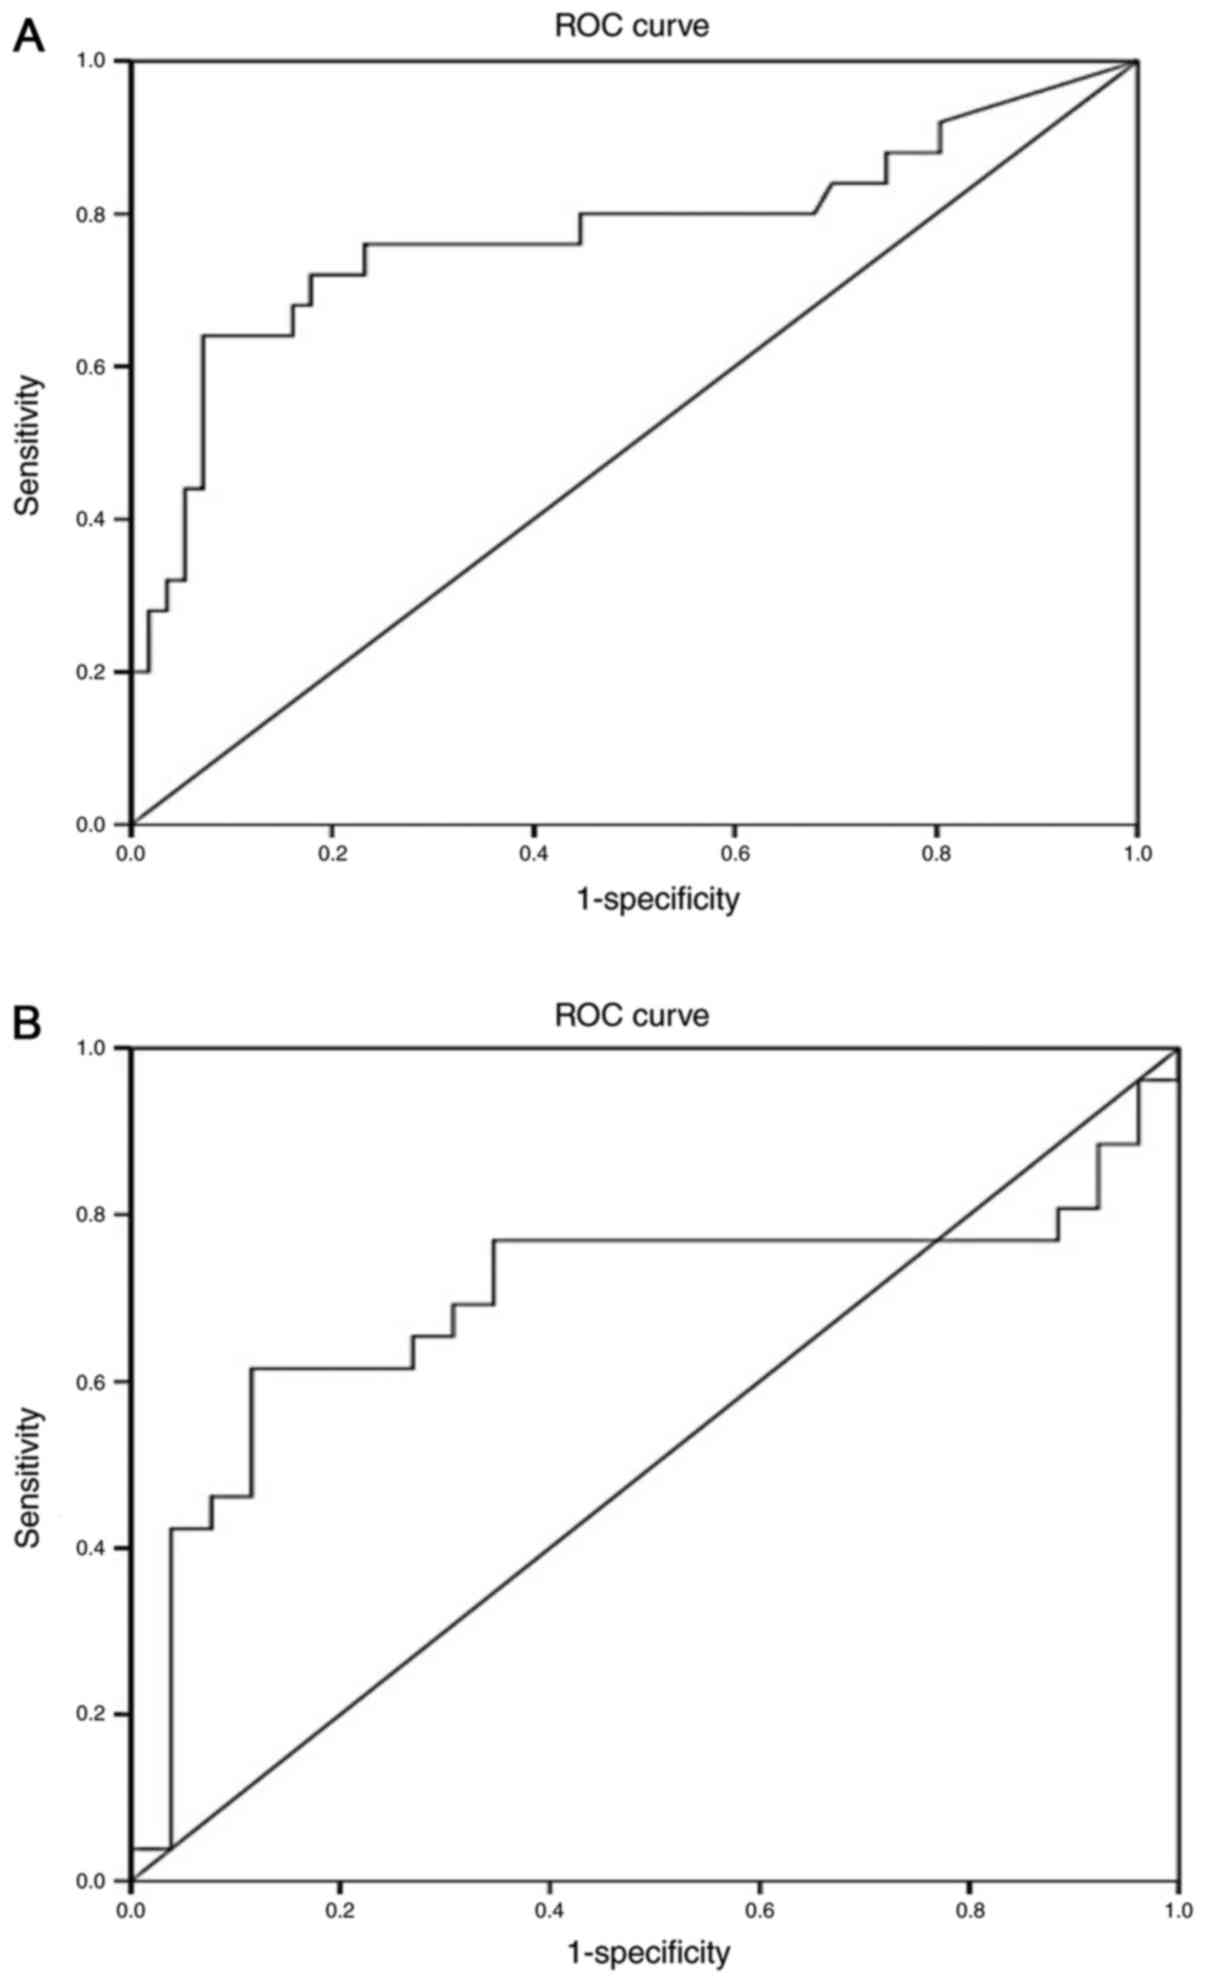
For miR-192, the ROC curves yielded an AUC of 0.774
(95% CI, 0.645–0.903; P<0.001) in distinguishing overall
diabetic patients from healthy subjects (Fig. 4A), and an AUC of 0.70 (95% CI,
0.542–0.854; P=0.049) in discriminating the normoalbuminuric group
from the microalbuminuric/macroalbuminuric groups (Fig. 4B).
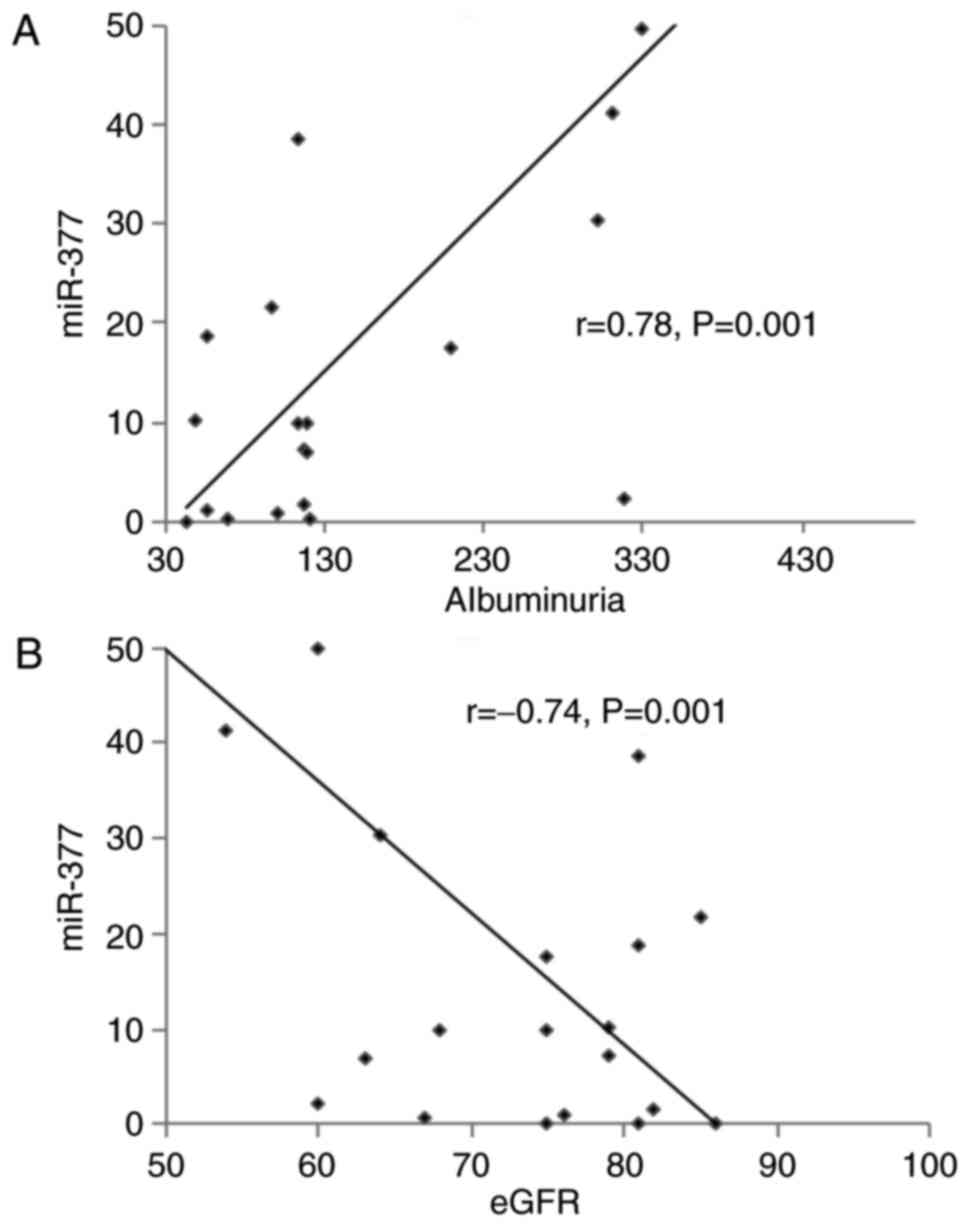
Correlation between miRs and
albuminuria, renal function and other risk factors of DN
To determine the correlation of miR-377 and miR-192
with albuminuria and renal function, Pearson's correlation
coefficient analysis was undertaken in patients with
microalbuminuria and macroalbuminuria.
As presented in Fig.
5, increased miR-377 expression was positively correlated with
albuminuria (r=0.78; P=0.001) and negatively correlated with renal
function (r=−0.74; P=0.001).
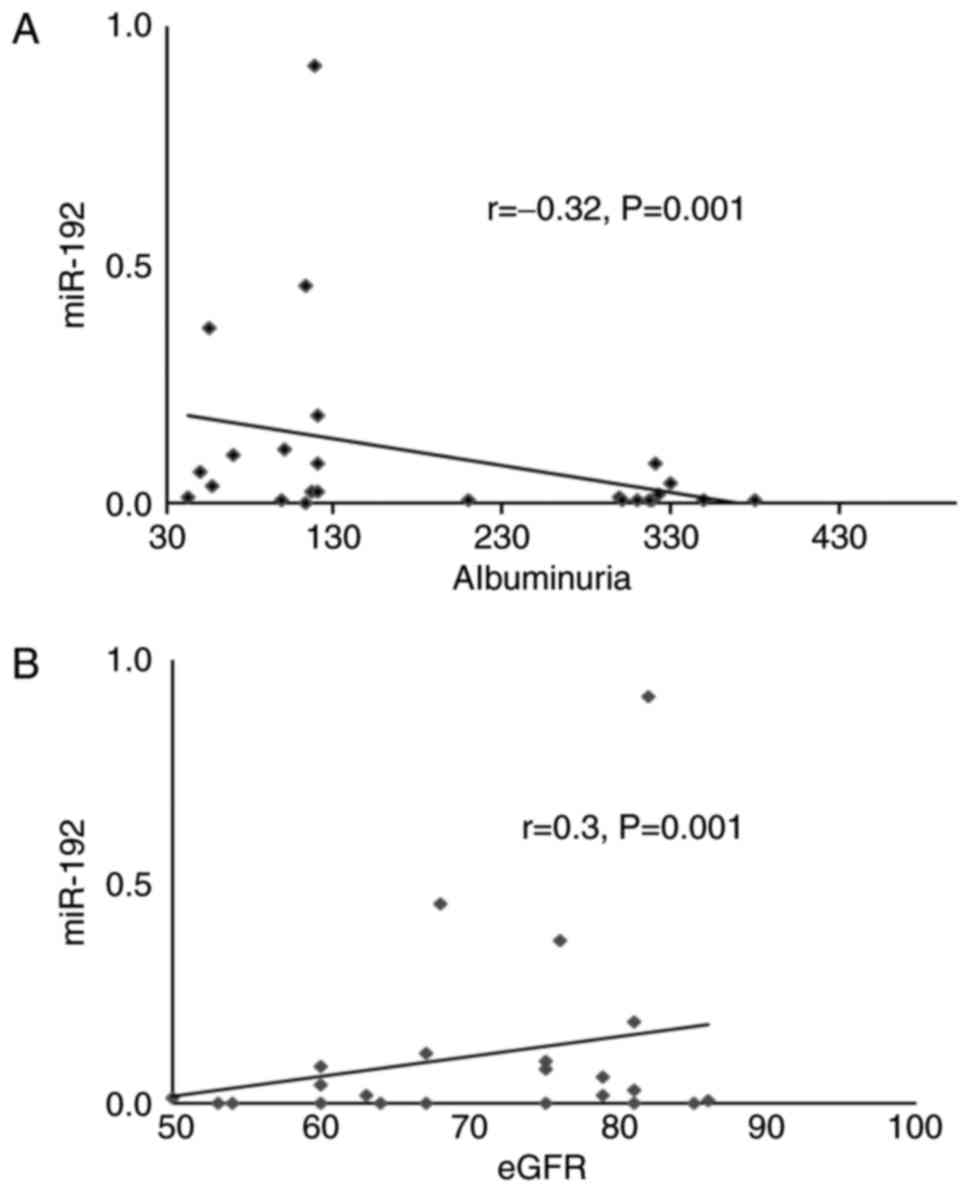
By comparison, a decreased miR-192 expression
exhibited a positive correlation with albuminuria (r=−0.32;
P=0.001) and a negative correlation with renal function (r=0.3;
P=0.001) (Fig. 6).
In addition, increased miR-377 and decreased miR-192
expression correlated significantly with certain known risk factors
of DN, including age, hyperglycemia, hypertension and lipid
abnormalities (P<0.05; Table
III).
| Table III.Correlation between miRNAs and risk
factors of DN. |
Table III.
Correlation between miRNAs and risk
factors of DN.
|
| miR-377 | miR-192 |
|---|
|
|
|
|
|---|
| Parameters | r | P-value | R | P-value |
|---|
| Age | 0.270 | 0.031 | −0.439 | 0.041 |
| FG | 0.085 | 0.001 | −0.392 | 0.001 |
| HbA1c | 0.625 | 0.001 | −0.2 | 0.001 |
| Diabetes
duration | −0.103 | 0.001 | 0.392 | 0.001 |
| BMI | −0.064 | 0.01 | 0.107 | 0.03 |
| Mean blood
pressure | 0.171 | 0.001 | −0.20 | 0.001 |
| Total
cholesterol | 0.137 | 0.001 | −0.07 | 0.001 |
| Triglyceride | 0.353 | 0.001 | 0.20 | 0.001 |
| LDL | 0.001 | 0.031 | −0.316 | 0.001 |
Discussion
Among long-term diabetes-associated microvascular
complications, DN accounts for a notable cause of ESRD with a high
mortality rate in patients with T2D (15,16).
A key pathological feature of DN is mesangial expansion as a result
of ECM accumulation and glomerular basement membrane thickening,
which consequently lead to increased extracellular depositions in
the glomerulus (17). The exact
molecular mechanism responsible for these pathological alterations
remains uncertain. However, a number of reports have demonstrated
that TGF-β1 is a key player and its upregulation promotes
pathogenic collagen synthesis and cellular hypertrophy (18,19).
The risk of developing DN begins with albuminuria, progressing from
microalbuminuria towards macroalbuminuria, which indicates more
serious kidney disease, and the progression from macroalbuminuria
to renal failure is irreversible (39). Although microalbuminuria is
regarded as the early sign of DN, it is more a diagnostic marker
than a tool to predict DN, and a number of factors have called into
question its ability to precisely detect disease progression. For
example, a significant proportion of diabetic patients with
microalbuminuria may revert to normoalbuminuria (40) and only ~30% of microalbuminuric
patients progress to overt nephropathy subsequent to 10 years of
follow up (41). Microalbuminuria
is additionally an indicator of risk of cardiovascular disease
among individuals with and without diabetes (27), and correlates with endothelial
dysfunction in patients with T2D (28). Therefore, there is a requirement
for improved biomarkers for early detection of DN, which may enable
earlier diagnosis and facilitate more efficient intervention.
Previous studies have defined the regulatory role of miRs in renal
development, physiology and pathology (31), and dysregulation of a number of
these miRs has been demonstrated to contribute to the pathogenesis
and development of DN (31).
Findings that miRs are stably present extracellularly in the blood
circulation (7) and other body
fluids, including the urine and saliva (42), have suggested that circulating miRs
act as signaling molecules outside the cell and may be developed as
non-invasive biomarkers for a variety of diseases.
Previous results from the authors' laboratory
(10,11,14,36)
and numerous other reports (9,13,43)
have demonstrated that miRs in peripheral whole blood may serve as
disease biomarkers.
The present study evaluated the expression of two
DN-related miRs (miR-377 and miR-192) in the peripheral blood of
patients with T2D with different levels of albuminuria
(normoalbuminuria, microalbuminuria and macroalbuminuria) and
healthy controls to establish their potential as biomarkers in the
early stage of DN.
It was observed that the expression of miR-377 was
significantly increased in overall diabetic patients compared with
healthy controls. miR-377 expression was gradually increased in
patients with normoalbuminuria and further increased in patients
with microalbuminuria and microalbuminuria. This significant
increase in miR-377 expression with the severity of albuminuria may
suggest a potential role of miR-377 in DN progression.
There have been no previous reports investigating
circulating miR-377 in DN, to the best of our knowledge, and the
present study may be the first to demonstrate increased blood
miR-377 in patients with DN throughout disease progression.
miR-377 is a key regulator and serves a critical
role in the pathophysiology of DN. Elevated levels of miR-377 in
high glucose culture or TGF-β-treated human and mouse mesangial
cells repressed the expression of p21-activated kinase and
superoxide dismutase, and enhanced the production of fibronectin
protein, a matrix protein that excessively accumulates in DN
(32). Thus, miR-377 was suggested
to be a target for therapy (32).
The present study additionally revealed that the
expression of miR-192 was significantly lower in overall diabetic
patients compared with healthy controls, and was significantly
lower in patients with microalbuminuria compared with patients with
normoalbuminuria. However, the decrease in miR-192 expression was
not significant between microalbuminuria and normoalbuminuria. The
results of decreased miR-192 expression in patients with
macroalbuminuria and microalbuminuria compared with patients with
normoalbuminuria observed in the present study are consistent with
a recent report by Ma et al (44) conducted on a large cohort, which
demonstrated that miR-192 was significantly decreased in patients
with macroalbuminuria (n=148) compared with patients with
normoalbuminuria (n=159). However, the results of the present study
differ from a previous study by Chien et al (45) who reported increased expression of
miR-192 in overt proteinuria patients compared with
microalbuminuria patients.
miR-192 was initially identified to be enriched in
the normal renal cortex (46) and
serves an important role in normal kidney function (47). miR-192 regulates TGF-β-induced
COL1A2 expression by targeting and downregulating E-box repressors
ZEB1 and ZEB2; thus, it is involved in matrix accumulation in DN
(33). Low expression of miR-192
was observed in renal tubular cells cultured in a high glucose
concentration and TGF-β1, and in renal biopsy samples from patients
with established DN in association with tubulointerstitial fibrosis
and a reduction in eGFR (48).
TGF-β1 additionally decreases the expression of miR-192 in rat
proximal tubular cells, mesangial cells and human podocytes
(49). In contrast to these
observations, Putta et al (50) demonstrated that miR-192 levels were
increased by TGF-β1 in cultured glomerular mesangial cells and in
glomeruli from diabetic mice, and that decreased renal miR-192
resulted in a reduction in renal fibrosis and improves
proteinuria.
A number of factors have been demonstrated to have
an important impact on the development of DN, including age (>45
years), long duration of diabetes mellitus, poor glycemic control
(high HbA1c), hypertension and hyperlipidemia (51,52).
The present study evaluated the association of
miR-377 and miR-192 with albuminuria and DN risk using different
models of regression analysis. A direct, significant association
between increased miR-377 or decreased miR-192 and albuminuria was
observed. Of note, miR-377 expression was significantly associated
with the progression of albuminuria, supporting the authors earlier
suggestion of the association between miR-377 DN progression. In
addition, the association of miR-377 with the degree of albuminuria
remained significantly independent of known risk factors of DN,
including age, sex, BMI, blood pressure, total cholesterol,
triglyceride and LDL. In addition, in linear stepwise regression
analysis, the present study demonstrated that albuminuria was the
only significant predictor of miR-377 among other variables,
including age, sex, BMI, FG, HbA1c, diabetes duration, mean blood
pressure, total cholesterol, triglyceride and LDL.
When the present study evaluated the possibility of
using blood miR-377 and blood miR-192 as biomarkers for DN, ROC
analysis revealed that the two miRs were significantly able to
discriminate overall patients from healthy subjects. The two miRs
exhibited a significant ability to discriminate patients with
normoalbuminuric from patients with
microalbuminuria/macroalbuminuria. The present study may be the
first to demonstrate the potential of blood-based miR-377 and
miR-192 biomarkers for early detection of DN. Conversely, previous
studies of miR biomarkers of renal disease revealed that miR-192 in
urine extracellular vesicles is a useful biomarker for the early
stage of DN (53).
In the present study, Pearson's correlation
coefficient analysis undertaken on patients with microalbuminuria
and macroalbuminuria demonstrated that increased miR-377 was
positively correlated with albuminuria and negatively with renal
function, while decreased miR-192 was negatively correlated with
albuminuria and positively with renal function. Furthermore,
miR-377 and miR-192 were significantly correlated with age,
hyperglycemia, diabetes duration, hypertension and lipid
abnormalities. These results may indicate that higher expression of
miR-377 and lower expression of miR-192 in the blood may be used as
useful biomarkers to evaluate renal damage and the risk of DN.
Although the results of the present study
demonstrated that miR-377 and miR-192 in peripheral blood may be
utilized as biomarkers for early detection of DN, it should be
noted that the evaluation of the biomarker potential of these miRs
was conducted in a relatively small sample size, and larger studies
are recommended for validation of the present results.
In summary, increased miR-377 expression and
decreased miR-192 expression was observed in the blood of patients
with T2D with and without DN compared with healthy controls, and
blood miR-377 expression was increased with the severity of
albuminuria. miR-377 and miR-192 were directly associated with
albuminuria, miR-377 was independently associated with DN risk, and
albuminuria was observed to be the only predictor of miR-377. The
two miRs were correlated with albuminuria, renal function and other
risk factors of DN. It was additionally revealed that miR-377 and
miR-192 may be utilized as blood-based biomarkers for early DN
prediction in patients with T2D. The present study may provide the
first evidence of the association between miR-377 and the risk of
DN, and its potential usefulness as a biomarker in the early stage
of DN.
Acknowledgements
The authors are thankful for the assistance of the
technical research staff at the Department of Molecular Medicine
and Al-Jawhara Centre, College of Medicine and Medical Sciences,
Arabian Gulf University. We also thank the staff of the Clinical
Laboratory of King Abdullah Medical Centre in the Kingdom of
Bahrain.
Funding
The current study was supported by a research grant
from the College of Medicine and Medical Sciences, Arabian Gulf
University, Kingdom of Bahrain (grant no. 81).
Availability of data and materials
The analyzed data sets generated during the study
are available from the corresponding author, on reasonable
request.
Authors' contributions
GAK: Project development, data management, data
analysis, manuscript writing, manuscript editing. HAAM: Project
development, data collection, data analysis, manuscript
writing.
Ethics approval and consent to
participate
Ethical approval to conduct the present study was
obtained from the Medical Research and Ethics Committee of the
College of Medicine and Medical Sciences, Arabian Gulf University
(Manama, Bahrain). All participants provided informed consent for
the use of their blood samples and data.
Consent for publication
All participants provided informed consent for the
use of their blood samples and data.
Competing interests
The authors declare that they have no competing
interests.
References
|
1
|
Esteller M: Non-coding RNAs in human
disease. Nat Rev Genet. 12:861–874. 2011. View Article : Google Scholar : PubMed/NCBI
|
|
2
|
Bartel DP: MicroRNAs: Target recognition
and regulatory functions. Cell. 136:215–233. 2009. View Article : Google Scholar : PubMed/NCBI
|
|
3
|
Friedman RC, Farh KK, Burge CB and Bartel
DP: Most mammalian mRNAs are conserved targets of microRNAs. Genome
Res. 19:92–105. 2009. View Article : Google Scholar : PubMed/NCBI
|
|
4
|
Kloosterman WP and Plasterk RH: The
diverse functions of microRNAs in animal development and disease.
Dev Cell. 11:441–450. 2006. View Article : Google Scholar : PubMed/NCBI
|
|
5
|
Ha TY: MicroRNAs in human diseases: From
cancer to cardiovascular disease. Immune Netw. 11:135–154. 2011.
View Article : Google Scholar : PubMed/NCBI
|
|
6
|
Lorenzen J, Kumarswamy R, Dangwal S and
Thum T: MicroRNAs in diabetes and diabetes-associated
complications. RNA Biol. 9:820–827. 2012. View Article : Google Scholar : PubMed/NCBI
|
|
7
|
Mitchell PS, Parkin RK, Kroh EM, Fritz BR,
Wyman SK, Pogosova-Agadjanyan EL, Peterson A, Noteboom J, O'Briant
KC, Allen A, et al: Circulating microRNAs as stable blood-based
markers for cancer detection. Proc Natl Acad Sci USA.
105:10513–10518. 2008. View Article : Google Scholar : PubMed/NCBI
|
|
8
|
Etheridge A, Lee I, Hood L, Galas D and
Wang K: Extracellular microRNA: A new source of biomarkers. Mutat
Res. 717:85–90. 2011. View Article : Google Scholar : PubMed/NCBI
|
|
9
|
Roth P, Wischhusen J, Happold C, Chandran
PA, Hofer S, Eisele G, Weller M and Keller A: A specific miRNA
signature in the peripheral blood of glioblastoma patients. J
Neurochem. 118:449–457. 2011. View Article : Google Scholar : PubMed/NCBI
|
|
10
|
Al-Kafaji G, Al Naieb ZT and Bakhiet M:
Increased oncogenic microRNA-18a expression in peripheral blood of
patients with prostate cancer: A potential role as new non-invasive
biomarker. Oncol Lett. 11:1201–1206. 2016. View Article : Google Scholar : PubMed/NCBI
|
|
11
|
Al-Kafaji G, Al-Mahroos G, Alsayed NA,
Hasan ZA, Nawaz S and Bakhiet M: Peripheral blood microRNA-15a is a
potential biomarker for type 2 diabetes mellitus and pre-diabetes.
Mol Med Rep. 12:7485–7490. 2015. View Article : Google Scholar : PubMed/NCBI
|
|
12
|
Zampetaki A, Kiechl S, Drozdov I, Willeit
P, Mayr U, Prokopi M, Mayr A, Weger S, Oberhollenzer F, Bonora E,
et al: Plasma microRNA profiling reveals loss of endothelial
miR-126 and other microRNAs in type 2 diabetes. Circ Res.
107:810–817. 2010. View Article : Google Scholar : PubMed/NCBI
|
|
13
|
Meder B, Keller A, Vogel B, Haas J,
Sedaghat-Hamedani F, Kayyanpour E, Just S, Borries A, Rudloff J,
Leidinger P, et al: MicroRNA signatures in total peripheral blood
as novel biomarkers for acute myocardial infarction. Basic Res
Cardiol. 106:13–23. 2011. View Article : Google Scholar : PubMed/NCBI
|
|
14
|
Al-Kafaji G, Al-Mahroos G, Al-Muhtaresh
HA, Sabry MA, Razzak Abdul R and Salem AH: Circulating
endothelium-enriched microRNA-126 as a potential biomarker for
coronary artery disease in type 2 diabetes mellitus patients.
Biomarkers. 22:268–278. 2017. View Article : Google Scholar : PubMed/NCBI
|
|
15
|
Shahbazian H and Rezaii I: Diabetic kidney
disease; review of the current knowledge. J Renal Inj Prev.
2:73–80. 2013.PubMed/NCBI
|
|
16
|
Dronavalli S, Duka I and Bakris GL: The
pathogenesis of diabetic nephropathy. Nat Clin Pract Endocrinol
Metab. 4:444–452. 2008. View Article : Google Scholar : PubMed/NCBI
|
|
17
|
Hu C, Sun L, Xiao L, Han Y, Fu X, Xiong X,
Xu X, Liu Y, Yang S, Liu F and Kanwar YS: Insight into the
mechanisms involved in the expression and regulation of
extracellular matrix proteins in diabetic nephropathy. Curr Med
Chem. 22:2858–2870. 2015. View Article : Google Scholar : PubMed/NCBI
|
|
18
|
Arora MK and Singh UK: Molecular
mechanisms in the pathogenesis of diabetic nephropathy: An update.
Vascul Pharmacol. 58:259–271. 2013. View Article : Google Scholar : PubMed/NCBI
|
|
19
|
Chang AS, Hathaway CK, Smithies O and
Kakoki M: Transforming growth factor-β1 and diabetic nephropathy.
Am J Physiol Renal Physiol. 310:F689–F696. 2016. View Article : Google Scholar : PubMed/NCBI
|
|
20
|
Rossing K, Christensen PK, Hovind P,
Tarnowl L, Rossing P and Parving HH: Progression of nephropathy in
type 2 diabetic patients. Kidney Int. 66:1596–1605. 2004.
View Article : Google Scholar : PubMed/NCBI
|
|
21
|
MacIsaac RJ, Tsalamandris C,
Panagiotopoulos S, Smith TJ, McNeil KJ and Jerums G:
Normoalbuminuric renal insufficiency in type 2 diabetes. Diabetes
Care. 27:195–200. 2004. View Article : Google Scholar : PubMed/NCBI
|
|
22
|
Tsalamandris C, Allen TJ, Gilbert RE,
Sinha A, Panagiotopoulos S, Cooper ME and Jerums G: Progressive
decline in renal function in diabetic patients with and without
albuminuria. Diabetes. 43:649–655. 1994. View Article : Google Scholar : PubMed/NCBI
|
|
23
|
Caramori ML, Kim Y, Huang C, Fish AJ, Rich
SS, Miller ME, Russell G and Mauer M: Cellular basis of diabetic
nephropathy: 1. Study design and renal structural-functional
relationships in patients with long-standing type 1 diabetes.
Diabetes. 51:506–513. 2002. View Article : Google Scholar : PubMed/NCBI
|
|
24
|
Najafian B, Crosson JT, Kim Y and Mauer M:
Glomerulotubular junction abnormalities are associated with
proteinuria in type 1 diabetes. J Am Soc Nephrol. 17 Suppl
2:S53–S60. 2006. View Article : Google Scholar : PubMed/NCBI
|
|
25
|
Levey AS, Becker C and Inker LA:
Glomerular filtration rate and albuminuria for detection and
staging of acute and chronic kidney disease in adults: A systematic
review. JAMA. 313:837–846. 2015. View Article : Google Scholar : PubMed/NCBI
|
|
26
|
Glassock RJ: Is the presence of
microalbuminuria a relevant marker of kidney disease? Curr
Hypertens Rep. 12:364–368. 2010. View Article : Google Scholar : PubMed/NCBI
|
|
27
|
Stehouwer CDA and Smulders YM:
Microalbuminuria and risk for cardiovascular disease: Analysis of
potential mechanisms. J Am Soc Nephrol. 17:2106–2111. 2006.
View Article : Google Scholar : PubMed/NCBI
|
|
28
|
Silva AM, Schaan BD, Signori LU, Plentz
RD, Moreno H Jr, Bertoluci MC and Irigoyen MC: Microalbuminuria is
associated with impaired arterial and venous endothelium dependent
vasodilation in patients with type 2 diabetes. J Endocrinol Invest.
33:696–700. 2010. View Article : Google Scholar : PubMed/NCBI
|
|
29
|
Suarez Gonzalez ML, Thomas DB, Barisoni L
and Fornoni A: Diabetic nephropathy: Is it time yet for routine
kidney biopsy? World J Diabetes. 4:245–255. 2013. View Article : Google Scholar : PubMed/NCBI
|
|
30
|
Alter ML, Kretschmer A, Von Websky K,
Tsuprykov O, Reichetzeder C, Simon A, Stasch JP and Hocher B: Early
urinary and plasma biomarkers for experimental diabetic
nephropathy. Clin Lab. 58:659–671. 2012.PubMed/NCBI
|
|
31
|
Kato M and Natarajan R: MicroRNAs in
diabetic nephropathy: Functions, biomarkers, and therapeutic
targets. Ann N Y Acad Sci. 1353:72–88. 2015. View Article : Google Scholar : PubMed/NCBI
|
|
32
|
Wang Q, Wang Y, Minto AW, Wang J, Shi Q,
Li X and Quigg RJ: MicroRNA-377 is up-regulated and can lead to
increased fibronectin production in diabetic nephropathy. FASEB J.
22:4126–4135. 2008. View Article : Google Scholar : PubMed/NCBI
|
|
33
|
Kato M, Zhang J, Wang M, Lanting L, Yuan
H, Rossi J and Natarajan R: MicroRNA-192 in diabetic kidney
glomeruli and its function in TGF-induced collagen expression via
inhibition of E-box repressors. Proc Natl Acad Sci USA.
104:93432–3437. 2007. View Article : Google Scholar
|
|
34
|
Yang Y, Xiao L, Li J, Kanwar YS, Liu F and
Sun L: Urine miRNAs: Potential biomarkers for monitoring
progression of early stages of diabetic nephropathy. Med
Hypotheses. 81:274–278. 2013. View Article : Google Scholar : PubMed/NCBI
|
|
35
|
Simpson K, Wonnacott A, Fraser DJ and
Bowen T: MicroRNAs in diabetic nephropathy: From biomarkers to
therapy. Curr Diab Rep. 16:352016. View Article : Google Scholar : PubMed/NCBI
|
|
36
|
Al-Kafaji G, Al-Mahroos G, Al-Muhtaresh
HA, Skrypnyk C, Sabry MA and Ramadan AR: Decreased expression of
circulating microRNA-126 in patients with type 2 diabetic
nephropathy: A potential blood-based biomarker. Exp Ther Med.
12:815–822. 2016. View Article : Google Scholar : PubMed/NCBI
|
|
37
|
Alberti KG and Zimmet PZ: Definition,
diagnosis and classification of diabetes mellitus and its
complications. Part 1: Diagnosis and classification of diabetes
mellitus provisional report of a WHO consultation. Diabet Med.
15:539–553. 1998. View Article : Google Scholar : PubMed/NCBI
|
|
38
|
Stoves J, Lindley EJ, Barnfield MC,
Burniston MT and Newstead CG: MDRD equation estimates of glomerular
filtration rate in potential living kidney donors and renal
transplant recipients with impaired graft function. Nephrol Dial
Transplant. 17:2036–2037. 2002. View Article : Google Scholar : PubMed/NCBI
|
|
39
|
Lutale JJ, Thordarson H, Abbas ZG and
Vetvik K: Microalbuminuria among type 1 and type 2 diabetic
patients of African origin in Dar Es Salaam, Tanzania. BMC Nephrol.
8:22007. View Article : Google Scholar : PubMed/NCBI
|
|
40
|
Perkins BA, Ficociello LH, Silva KH,
Finkelstein DM, Warram JH and Krolewski AS: Regression of
microalbuminuria in type 1 diabetes. N Engl J Med. 348:2285–2293.
2003. View Article : Google Scholar : PubMed/NCBI
|
|
41
|
Rossing P, Hougaard P and Parving HH:
Progression of microalbuminuria in type 1 diabetes: Ten-year
prospective observational study. Kidney Int. 68:1446–1450. 2005.
View Article : Google Scholar : PubMed/NCBI
|
|
42
|
Weber JA, Baxter DH, Zhang S, Huang DY,
Huang KH, Lee MJ, Galas DJ and Wang K: The microRNA spectrum in 12
body fluids. Clin Chem. 56:1733–1741. 2010. View Article : Google Scholar : PubMed/NCBI
|
|
43
|
Keller A, Leidinger P, Bauer A, Elsharawy
A, Haas J, Backes C, Wendschlag A, Giese N, Tjaden C, Werner J, et
al: Toward the blood-borne miRNome of human diseases. Nat Methods.
8:841–843. 2011. View Article : Google Scholar : PubMed/NCBI
|
|
44
|
Ma X, Lu C, Lv C, Wu C and Wang Q: The
expression of miR-192 and its significance in diabetic nephropathy
patients with different urine albumin creatinine ratio. J Diabetes
Res. 2016:67894022016. View Article : Google Scholar : PubMed/NCBI
|
|
45
|
Chien HY, Chen CY, Chiu YH, Lin YC and Li
WC: Differential microRNA profiles predict diabetic nephropathy
progression in Taiwan. Int J Med Sci. 13:457–465. 2016. View Article : Google Scholar : PubMed/NCBI
|
|
46
|
Tian Z, Greene AS, Pietrusz JL, Matus IR
and Liang M: MicroRNA-target pairs in the rat kidney identified by
microRNA microarray, proteomic, and bioinformatic analysis. Genome
Res. 18:404–411. 2008. View Article : Google Scholar : PubMed/NCBI
|
|
47
|
Sun Y, Koo S, White N, Peralta E, Esau C,
Dean NM and Perera RJ: Development of a micro-array to detect human
and mouse microRNAs and characterization of expression in human
organs. Nucleic Acids Res. 32:e1882004. View Article : Google Scholar : PubMed/NCBI
|
|
48
|
Krupa A, Jenkins R, Luo DD, Lewis A,
Phillips A and Fraser D: Loss of microRNA-192 promotes fibrogenesis
in diabetic nephropathy. J Am Soc Nephrol. 21:438–447. 2010.
View Article : Google Scholar : PubMed/NCBI
|
|
49
|
Wang B, Herman-Edelstein M, Koh P, Burns
W, Jandeleit-Dahm K, Watson A, Saleem M, Goodall GJ, Twigg SM,
Cooper ME and Kantharidis P: E-cadherin expression is regulated by
miR-192/215 by a mechanism that is independent of the profibrotic
effects of transforming growth factor-β. Diabetes. 59:1794–1802.
2010. View Article : Google Scholar : PubMed/NCBI
|
|
50
|
Putta S, Lanting L, Sun G, Lawson G, Kato
M and Natarajan R: Inhibiting MicroRNA-192 ameliorates renal
fibrosis in diabetic nephropathy. J Am Soc Nephrol. 23:458–469.
2012. View Article : Google Scholar : PubMed/NCBI
|
|
51
|
Gross JL, de Azevedo MJ, Silveiro SP,
Canani LH, Caramori ML and Zelmanovitz T: Diabetic nephropathy:
Diagnosis, prevention, and treatment. Diabetes Care. 28:164–176.
2005. View Article : Google Scholar : PubMed/NCBI
|
|
52
|
Al-Rubeaan K, Youssef AM, Subhani SN,
Ahmad NA, Al-Sharqawi AH, Al-Mutlaq HM, David SK and AlNaqeb D:
Diabetic nephropathy and its risk factors in a society with a type
2 diabetes epidemic: A Saudi National Diabetes Registry-based
study. PLoS One. 9:e889562014. View Article : Google Scholar : PubMed/NCBI
|
|
53
|
Jia Y, Guan M, Zheng Z, Zhang Q, Tang C,
Xu W, Xiao Z, Wang L and Xue Y: miRNAs in urine extracellular
vesicles as predictors of early-stage diabetic nephropathy. J
Diabetes Res. 2016:79327652016. View Article : Google Scholar : PubMed/NCBI
|