Introduction
Renovascular hypertension resulting from renal
artery stenosis is an important cause of secondary hypertension
that is often related to the activation of the renin-angiotensin
system (RAS), leading to problems in many organs, including cardiac
insufficiency (1). This condition,
which affects 5% of patients suffering from systemic arterial
hypertension, can be caused by atherosclerosis and is associated
with cardiovascular disease (2).
In the same way, poor renal function in cases of renovascular
hypertension is associated with an increase in oxidative stress and
markers of renal damage, indicated by inflammation and fibrosis
(3). Inflammation and oxidative
stress have synergistic effects on the pathophysiology of arterial
hypertension and cardiovascular remodeling (4). Oxidative stress resulting from the
imbalance between the production and degradation of reactive oxygen
species (ROS) is one of the main causes of endothelial dysfunction,
due to the decreased bioavailability of nitric oxide to react with
superoxide anions, resulting in the formation of peroxynitrite
(5).
Epithelial-to-mesenchymal transition (EMT) and
endothelial-to-mesenchymal transition (EndMT) are complex and
dynamic processes that are important for normal wound healing, but
are deleterious in fibrogenic diseases, including hepatic, cardiac
and renal fibrosis (6–8). During EMT/EndMT,
epithelial/endothelial cells modify their phenotype and express
markers of mesenchymal cells, with leads to an alteration of their
functions; for example, the acquisition of the ability to migrate
and synthesize interstitial matrix (9). Members of the cadherin family of
transmembrane glycoproteins, including E-cadherin (E-cad) and
N-cadherin (N-cad), represent the main components of adherens
junctions (AJs), and are mediators of Ca2+-dependent
adhesion between cells and promote intercellular binding to the
actin of the cytoskeleton (10).
E-cad and N-cad are very similar in terms of sequence and
structure, but demonstrate highly specific cell adhesion behavior
(11). E-cad acts in the
maintenance of epithelium integrity (12), while N-cad is known to be a
mediator of the connections between fibroblasts (13). The EMT process requires the
inhibition of several genes encoding proteins responsible for cell
adhesion, such as E-cad. However, there is an upregulation of genes
encoding cytoskeletal proteins, such as N-cad and α-smooth muscle
actin (α-SMA), that undergo intracellular rearrangements, allowing
stroma invasion. In addition, there is an upregulation of
extracellular matrix-associated proteins, such as fibronectin,
collagen I/III and metalloproteinases (14).
There have been several previous studies concerning
EMT in cancer (15,16) and repair following damage (17,18).
However, little is known about the role of AJs, mediated by
proteins such as E-cad and N-cad, or the transdifferentiation of
epithelial/endothelial and mesenchymal markers in cases of
renovascular hypertension. Thus, it was hypothesized that
epithelial/endothelial and mesenchymal markers are differentially
regulated by hypertension in different tissues. In the present
study, the effect of renovascular hypertension on the gene
expression of epithelial/endothelial and mesenchymal markers was
investigated, following inflammatory processes and oxidative stress
in the liver, kidneys and cardiac muscle.
Materials and methods
Ethics declaration and animal
care
All the surgical and experimental procedures carried
out in the present study complied with the Care and Use of
Laboratory Animals standards established by the National Institute
of Health (NIH Publication 80–23, revised in 2011). The present
study was carried out in accordance with Brazilian legal
requirements (federal law 11794/2008) and were approved by the
Animal Use Ethics Committee of the University Center of the
Hermínio Ometto Foundation (protocol no. 036/2014). The work
complied with the animal experimentation ethical standards of the
Brazilian College of Animal Experimentation. The experiments used
18 male Wistar rats (age, 50 days) weighing 180–200 g obtained from
the Animal Experimentation Center of the Hermínio Ometto
Foundation. The animals were housed in cages (2–3 rats/cage) at a
controlled temperature of 21–23°C and humidity of 60%, with a 12 h
light/dark cycle and free access to water and feed.
Experimental groups and induction of
hypertension
The animals were randomly divided into two
experimental groups and were anesthetized by intraperitoneal
injection of ketamine (100 mg/kg) and xylazine (10 mg/kg). The left
kidney was exposed using a small incision in the flank and the
renal artery was dissected from the renal vein and the adjacent
tissues. In 11 animals, a U-shaped silver clip with an internal
diameter of 0.2 mm was placed around the renal artery [according to
the 2-kidney, 1-clip (2K1C) model of renin-dependent hypertension],
resulting in stenosis of the artery, as described by Goldblatt
et al (19). The sham
animals (n=7) underwent the same surgical procedure, but without
insertion of the clip. After 4 weeks of hypertension induction, the
animals were euthanized by deep anesthesia (100 mg/kg ketamine and
10 mg/kg xylazine) and the liver, heart and kidneys were
removed.
Monitoring of systolic blood pressure
and body weight
The systolic blood pressure was measured by the
noninvasive method of tail plethysmography. Cuffs coupled to
pressure transducers were placed around the tails of the awake
animals, which had been previously warmed in a cabinet at 37°C. The
pressure change data were acquired using a Power Lab 4/S
analog-to-digital converter (ADInstruments Pty Ltd.) and the
results were presented as the average of three consecutive
measurements for each animal. Prior to the first arterial pressure
measurement, the animals were adapted to the procedure by placing
them in the acrylic container on 5 consecutive days. The arterial
pressure and body weight were determined on a weekly basis during
the 4 weeks of the study. The model was deemed to have been
successfully established if the systolic blood pressure was higher
than 160 mmHg after 4 weeks of operation.
Morphometry and stereology
Representative areas of the hepatic tissue, left
cardiac ventricle and renal cortex were imaged using a Leica DM2000
light microscope (magnification, ×400). The samples were fixed in
formaline 10% for 48 h at room temperature. Samples were embedded
in Paraplast® (Sigma-Aldrich; Merck KGaA) and dehydrated
using increasing alcohol series. This was followed by morphometric
and stereological analyses performed with Image-Pro
Plus® v.4.5.0.29 software (Media Cybernetics, Inc.). The
analyses used 5 µm histological sections, with spacings between the
sections of 40 µm (liver and heart) and 20 µm (kidney). The
histological sections were treated at 37°C using a combined
histochemical technique employing 1% Alcian Blue (pH 2.5) with 0.5%
Periodic Acid with Schiff Reagent (AB + PAS) for 15, 5 and 10 min,
respectively, or using a traditional Mallory's trichrome (MT)
staining solution at 37°C for 35 min.
Stereological analysis of the liver was performed
using the previous samples treated with AB + PAS and imaged using a
Leica DM2000 light microscope (magnification, ×400). A grid of 475
intersections was selected for each of 10 images, totaling 4,750
intersections per animal, in order to determine the frequencies of
interstitial and cellular components, and the corresponding areas
occupied. The interstitial components observed were the connective
tissue and the blood vessels, while the cellular components were
the hepatocyte cytoplasm and the mono- or binucleate nucleus of
these cells. The total number of hepatocytes was counted in 10
fields of view, with a morphometric assessment of the area of these
cells also carried out.
Evaluation of the cardiac tissue employed samples
stained with MT and imaged at ×400 magnification. The analysis
involved the determination of the number of cardiomyocytes and the
area occupied, considering cells in the transversal plane occupying
the entire image in question, as well as the percentage of the area
occupied by collagen fibers in regions with a predominance of
fibers cut in the longitudinal plane. This evaluation used 10
images, each with a grid with 540 intersections, totaling 5,400
intersections per animal. This procedure enabled the determination
of the frequency of areas with connective tissue associated with
the cardiac cells.
The morphometric analyses of the right and left
renal cortex were used to determine the corpuscle and glomerular
capillary diameters, considering 10 glomeruli. For this, samples
subjected to the AB + PAS histochemical procedure were
photo-documented at ×400 magnification. The stereological analysis
used samples stained with MT and photo-documented at 400×
magnification. A grid with 690 intersections was applied to each of
10 images of the renal cortex, totaling 6,900 intersections per
animal, in order to determine the proportions of the kidney
components (blood vessels, connective tissue, glomerular corpuscles
and tubular epithelium and lumen).
ELISA
Total proteins were extracted from hepatic, cardiac
and renal tissues samples using a detergent-based extraction buffer
(T-PER Tissue Protein Extraction Reagent; Thermo Fisher Scientific,
Inc.) containing a protease inhibitor cocktail (Roche Diagnostics).
The tissue samples were macerated in buffer [1:20 (w/v) of tissue
to T-PER Reagent], centrifuged at 1,200 × g for 10 min at 4°C and
the supernatant was collected. The total protein present in each
sample was quantified using the Bradford assay. The levels of
interleukin (IL)-4, IL-6, IL-10, tumor necrosis factor-α (TNF-α)
and transforming growth factor-β1 (TGF-β1) were determined using
Rat Platinum ELISA kits (cat. nos. 5018354, 13467093, 15532067,
13427093 and 15512057, respectively; eBioscience; Thermo Fisher
Scientific, Inc.), according to the manufacturer's instructions.
Standard curves were constructed for the cytokine protein
concentration (pg/ml) plotted against the mean optical density for
the replicates. The concentrations of the cytokines in the samples
(in duplicate) were determined using the standard curves.
Evaluation of the redox state
Lipid peroxidation was evaluated by quantification
of the levels of thiobarbituric acid reactive substances (TBARS) in
hepatic, cardiac and renal tissue homogenates, as described
previously (20). The reduced
thiols (-SH groups) of proteins were determined using
5.5′-dithiobis-(2-nitrobenzoic acid), as described by Faure and
Lafond (21).
Determination of mRNA expression by
reverse transcription (RT)-PCR
Total RNA was extracted from the liver, left cardiac
ventricle and kidneys of the sham and 2K1C animals using
TRIzol® reagent (Invitrogen; Thermo Fisher Scientific,
Inc.), followed by quantification using UV spectrophotometry at a
wavelength of 260 nm. The quality was evaluated using 1% agarose
gel electrophoresis. Generation of cDNA was performed using RT with
2 µg/µl total RNA with random primers (150 ng/µl), dNTPs (10
mmol/µl) and the SuperScript II Reverse Transcriptase kit at 25°C
for 10 min, followed by an incubation at 42°C for 50 min and at
70°C for 15 min (Invitrogen; Thermo Fisher Scientific, Inc.) in a
final volume of 20 µl, according of the manufacturer's protocol.
mRNA expression was determined by semiquantitative RT-PCR using a
PCR thermocycler (AmpliTherm) in a final volume of 25 µl containing
1 µl cDNA, 10X PCR buffer (10 mM Tris-HCL; pH 8.8) (Invitrogen;
Thermo Fisher Scientific, Inc.), 200–400 mM of each dNTP, 0.2 pmol
of each primer, 1.6–2.0 mM MgCl2, and 0.04 U Taq DNA
polymerase (Invitrogen; Thermo Fisher Scientific, Inc.). The
primers specific for each gene used for PCR were: E-cad, forward
(F) 5′-GCAGTTCTGCCAGAGAAACC-3′ and reverse (R)
5′-AATCCTGCTTCCAGGGAGAT-3′; N-cad, F 5′-TGTTGCTGAAGAAAACCAAG-3′ and
R 5′-GGCGACTCTCTGTCCAGAAC-3′; α-SMA, F 5′-CACCATCGGGAATGAACGCT-3′
and R 5′-CGAGAGGACGTTGTTAGCATAGAG-3′; collagen I (COL1A1), F
5′-GGAAGCTTGGTCCTCTTGCT-3′ and R 5′-GTTAGGCTCCTTCAATAGTCC-3′;
collagen III (COL3A1), F 5′-AGGCCAATGGCAATGTAAAG-3′ and R
5′-CAATGTCATAGGGTGCGATA-3′; hepatocyte growth factor (HGF), F
5′-TTCCCAGCTAGTCTATGGAC-3′ and R 5′-TGGTGCTGACTGCATTTCTC-3′; and
β-actin, F 5′-AGAGGGAAATCGTGCGTGACA-3′ and R
5′-CGATAGTGATGACCTGACCGTCA-3′. The amplification conditions were as
follows: Initial denaturation at 93°C for 3 min, followed by 26
cycles for the β-actin gene, 30 cycles for E-cad, N-cad and COL3A1,
32 cycles for α-SMA, and 34 cycles for COL1A1 and HGF. The cycles
consisted of a denaturation step at 94°C for 30 sec (β -actin,
E-cad, N-cad, COL1A1 and COL3A1) or 1 min (α-SMA and HGF);
annealing at 55°C for 30 sec (E-cad, N-cad, COL1A1 and COL3A1), at
57°C for 30 sec (β-actin), or at 59°C for 1 min (α-SMA and HGF);
extension at 72°C for 30 sec (β-actin, E-cad, N-cad, COL1A1 and
COL3A1) or 1 min (α-SMA and HGF). The PCR products were separated
by 1.5% agarose gel electrophoresis and were stained with ethidium
bromide. The gel was imaged using the Syngen G:Box®
system, followed by densitometric quantification of the bands using
Scion Image 4.0 software (Scion Corporation). The relative
expression of the genes investigated were obtained by normalization
with the expression values obtained for the β-actin gene.
Statistical analysis
The data are presented as the mean ± SEM,
considering the results of three independent experiments.
Differences between groups were evaluated using the unpaired
Student's t-test and one-way ANOVA followed by the Bonferroni
post-hoc test. Statistical analyses were performed using GraphPad
Prism v. 5.0 software (GraphPad Software, Inc.). P<0.05 was
considered to indicate a statistically significant difference.
Results
Biometric and morphometric
analyses
Table I details the
characteristics of the sham and 2K1C groups as assessed on the day
of the experiment. Compared with the sham group, the 2K1C animals
subjected to the clipping of the renal artery exhibited higher
systolic arterial pressure (203±9 vs. 148±4 mmHg in sham;
P=0.0003), increased heart weight (1.39±0.09 vs. 1.005±0.09 g in
sham, P=0.01) and right kidney weight (1.63±0.13 vs. 1.25±0.07 g in
sham, P=0.04; Table I). The body
and liver weights were similar for the two groups. Histological
analysis showed that the 2K1C animals had a normal hepatic
cytoarchitecture, without any changes in the hepatocyte number or
area. The areas occupied by connective tissue, blood vessels, and
mono- and binucleate nuclei were similar for all the animals
(Fig. 1A-D).
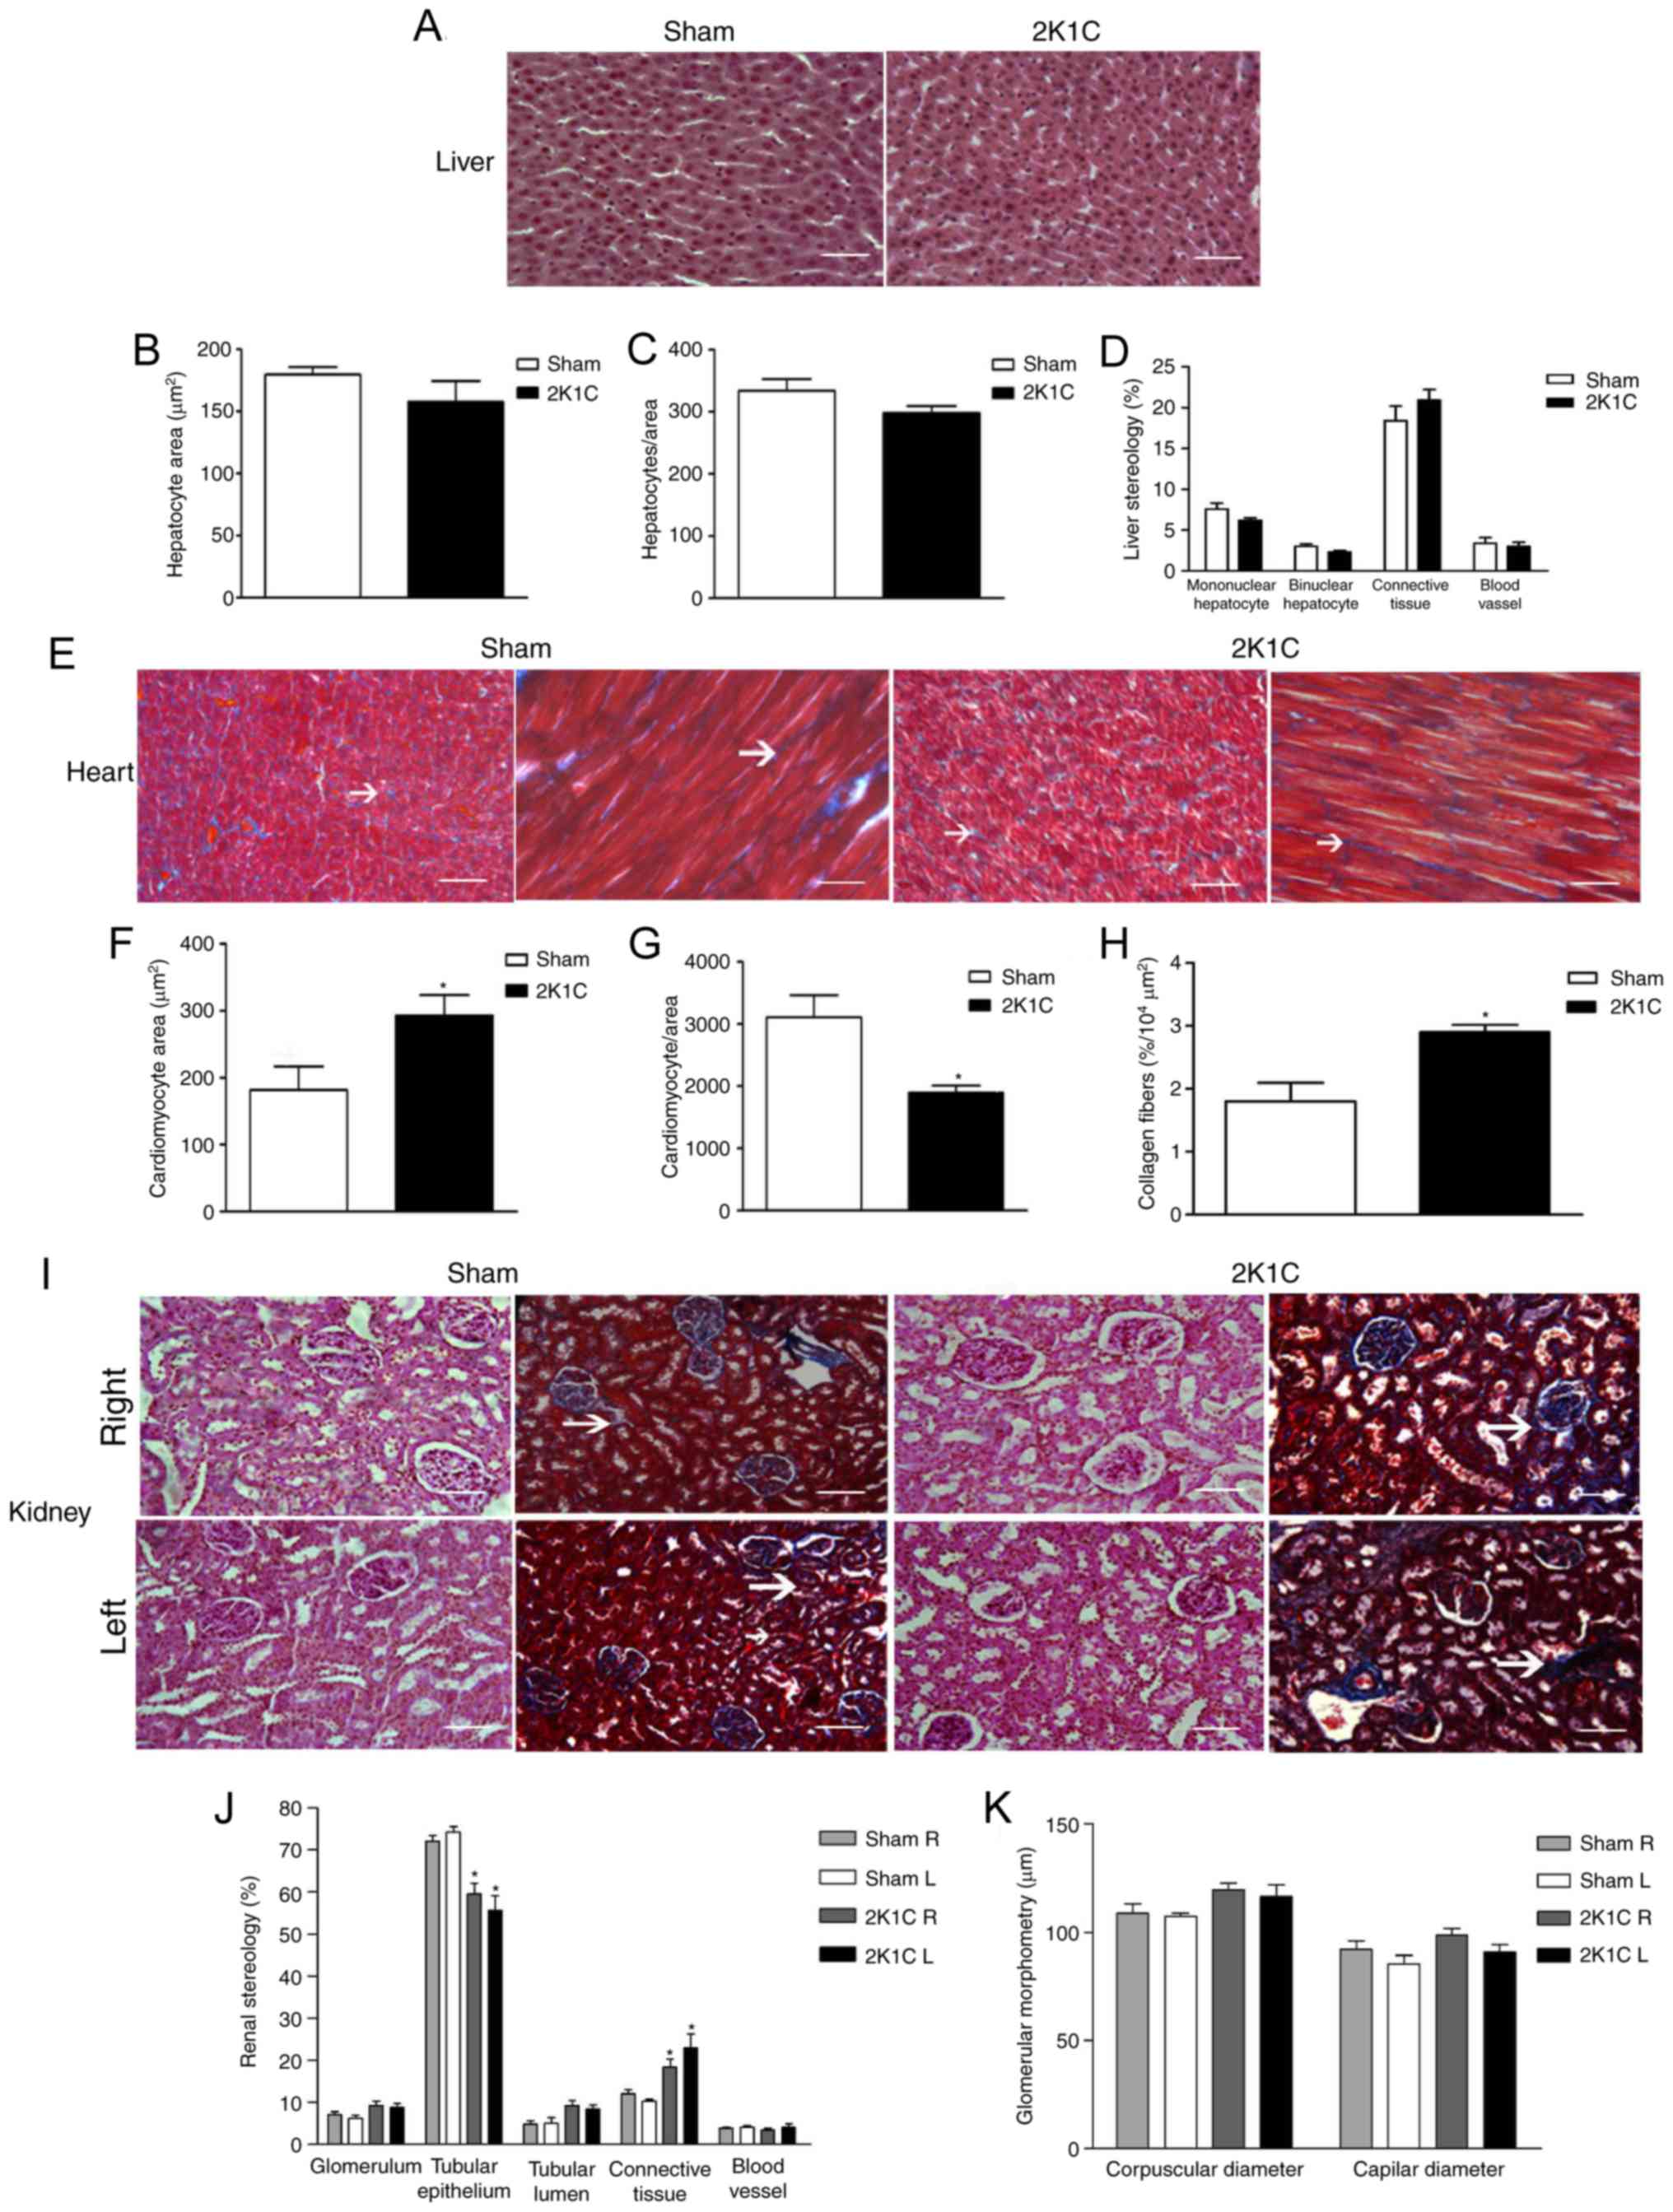 | Figure 1.Histology pattern, morphometry and
stereology results. (A) Liver sections stained with AB + PAS show
similar structures in both the sham and 2K1C groups, with the liver
morphometry and stereology results exhibiting no statistical
differences between the groups in terms of (B) the hepatocyte area,
(C) the number of hepatocyte per unit of area and (D) stereology.
(E) Heart sections stained with MT, arrows indicate connective
tissue; the 2K1C group showed an increase in (F) cardiomyocyte area
combined with a reduction in the (G) frequency of cardiomyocytes
per unit area. (H) In accordance with this pattern, an increased
area occupied by connective tissue was observed. (I) R and L
kidneys stained with AB + PAS and MT. (I) The 2K1C group showed
more area occupied by connective tissue (as indicated by the arrow)
and less area occupied by (J) tubular epithelium. (K) There were no
differences in glomerular morphometry between the groups. Blue
areas in MT stained samples indicates areas with collagen fibers,
indicative of connective tissue. Scale bar, 50 µm. *P<0.05 vs.
sham. AB + PAS, Alcian Blue (pH 2.5) with Periodic Acid-Schiff;
2K1C, 2 kidney 1 clip; R, right; L, left; MT, Mallory's
trichrome. |
 | Table I.Characteristics of the sham and 2K1C
animals at the end of the experimental period. |
Table I.
Characteristics of the sham and 2K1C
animals at the end of the experimental period.
| Parameter | Sham (n=7) | 2K1C (n=11) |
|---|
| Body weight
(g) | 360±29 | 382±22 |
| SBP (mmHg) | 148±4 | 203±9a |
| Liver weight
(g) | 9.24±0.36 | 8.74±0.19 |
| HWI (g/g) | 0.033±0.001 | 0.031±0.001 |
| Heart weight
(g) | 1.005±0.091 |
1.391±0.097a |
| CWI (g/g) | 0.0028±0.0001 |
0.0036±0.0001a |
| Kidney weight
(g) |
|
|
|
Right | 1.25±0.07 |
1.63±0.13a,b |
|
Left | 1.28±0.11 |
0.93±0.07a |
| KWI (g/g) |
|
|
|
Right | 0.0035±0.0001 |
0.0042±0.0002a,b |
|
Left | 0.0036±0.0001 |
0.0025±0.0002a |
| Left kidney/right
kidney ratio | 1.018±0.04 | 0.599±0.06 |
Hypertension led to cardiac hypertrophy, as shown by
a 29% increase in the heart weight index (Table I), and was associated with a
decrease in the number of cardiomyocytes (1,894±114.7 vs.
3,107±357.1 in sham, P=0.005; Fig. 1E
and G) and an increase in their area (292.9±30.54 vs.
181.6±35.43 µm2 in sham, P=0.04; Fig. 1E and F) in the animals in the 2K1C
group. This was accompanied by an increase in the area occupied by
collagen fibers in the cardiac tissue of the 2K1C animals compared
with the sham group (2.90±0.12 vs. 1.80±0.30%/104
µm2, respectively, P=0.004; Fig. 1E and H).
By contrast, the weight value of the left kidney in
the 2K1C animals (0.93±0.07 g) was lower in comparison to the
contralateral kidney (1.63±0.13 g, P=0.0001) and the sham group
(1.28±0.11 g, P=0.012; Table I).
The left kidney/right kidney ratio was lower in the 2K1C animals
than in the sham group (Table I).
Renovascular hypertension also led to fibrotic changes in the
stenotic kidney, as shown by the greater area of the renal cortex
occupied by connective tissue (22.98±3.33%) compared with the sham
group (10.32±0.37%; P=0.01; Fig. 1I
and J). This was supported by a decrease of the area occupied
by epithelium in the 2K1C animals (55.62±3.5 vs. 74.29±1.3%,
P=0.003; Fig. 1I and J). No
differences between the groups were observed for the remaining
parameters determined for both kidneys (Fig. 1J and K).
Inflammatory and fibroproliferative
profiles
The 2K1C group showed increases in the levels of the
inflammatory cytokine TNF-α in the liver (1,114.5±99.6 vs.
813.9±52; P=0.04) and IL-6 in the stenotic kidney (9,896.9±252 vs.
8,333.1±267; P=0.004) compared with the sham group (Table II). No differences between the
groups were observed for the anti-inflammatory cytokines IL-4 and
IL-10 in the liver, heart and kidneys. However, there were
increases in the levels of the fibroproliferative cytokine TGF-β1
in the liver, heart and stenotic kidney in the 2K1C group
(599.4±80.3 vs. 353.6±42.9, P=0.04; 115.0±4 vs. 89.05±4, P=0.004;
631.2±42 vs. 438.6±40, P=0.01; respectively; Table II).
| Table II.Pro- and anti-inflammatory profile in
2K1C experimental model. |
Table II.
Pro- and anti-inflammatory profile in
2K1C experimental model.
| A, Liver |
|---|
|
|---|
| Protein
(pg/ml) |
| Sham (n=7) |
| 2K1C (n=11) |
|---|
| TGF-β1 |
| 353.6±42.9 |
|
599.4±80.32a |
| TNF-α |
| 813.9±52 |
|
1,114.5±99.61a |
| IL-4 |
| 71.9±2 |
| 69.0±4 |
| IL-10 |
| 782.9±83 |
| 812.8±23 |
| IL-6 |
| 10,135.6±376 |
| 9,475.9±253 |
|
| B,
Heart |
|
| Protein
(pg/ml) |
| Sham
(n=7) |
| 2K1C
(n=11) |
|
| TGF-β1 |
| 89.05±4 |
|
115.0±4a |
| TNF-α |
| 2,616.8±239 |
| 2,247.4±95 |
| IL-4 |
| 20.9±1 |
| 20.7±2 |
| IL-10 |
| 1,459.1±112 |
| 1,468.8±143 |
| IL-6 |
| 3,728.9±80 |
| 3,682.5±243 |
|
| C,
Kidney |
|
|
| Sham
(n=7) | 2K1C
(n=11) |
|
|
|
|
| Protein
(pg/ml) | Right | Left | Right | Left |
|
| TGF-β1 | 318.0±31 | 438.6±40 | 396.6±44 |
631.2±2b,c |
| TNF-α | 3,138.7±56 | 3,103.6±279 | 3,337.8±264 | 3,175.5±447 |
| IL-4 | 99.7±6 | 104.9±6 | 101.6±5 | 111.9±5 |
| IL-10 | 1,854.4±64 | 1,844.8±100 | 1,859.8±98 | 1,812.4±66 |
| IL-6 | 8,855.3±223 | 8,333.1±267 | 8,444.7±287 |
9,896.9±252b,c |
Redox and antioxidant status
The levels of TBARS, an indicator of lipid
peroxidation, were higher in the right (0.021±0.002) and left
kidneys (0.022±0.004) of the 2K1C animals compared with the sham
group (0.017±0.001 and 0.012±0.003, respectively; P=0.01; Table III). No differences between the
experimental groups were observed for this parameter in the liver
and heart. The level of -SH groups, indicative of antioxidant
capacity, was only increased in the heart of the 2K1C animals
(1.376±0.208) compared with the sham group (0.996±0.118, P=0.01;
Table III).
| Table III.Parameters of oxidative stress. |
Table III.
Parameters of oxidative stress.
| A, Liver |
|---|
|
|---|
| Analysis |
| Sham (n=7) |
| 2K1C (n=11) |
|---|
| TBARS (nmol/µg
protein) |
| 0.022±0.004 |
| 0.023±0.008 |
| -SH groups (µmol/µg
protein) |
| 0.770±0.460 |
| 1.053±0.273 |
|
| B,
Heart |
|
|
Analysis |
| Sham
(n=7) |
| 2K1C
(n=11) |
|---|
|
| TBARS (nmol/µg
protein) |
| 0.003±0.001 |
| 0.004±0.002 |
| -SH groups (µmol/µg
protein) |
| 0.996±0.118 |
|
1.376±0.208a |
|
| C,
Kidney |
|
|
| Sham
(n=7) | 2K1C
(n=11) |
|
|
|
|
|
Analysis | Right | Left | Right | Left |
|
| TBARS (nmol/µg
protein) | 0.017±0.001 | 0.012±0.003 |
0.021±0.002a |
0.022±0.004a |
| -SH groups (µmol/µg
protein) | 0.972±0.196 | 0.881±0.094 | 1.045±0.025 | 1.042±0.090 |
Effect of renovascular hypertension on
the mRNA expression of genes involved in fibrosis and
EMT/EndMT
The hepatic mRNA expressions of the E-cad, N-cad,
COL1A1, COL3A1, α-SMA and HGF were not affected by hypertension
(Fig. 2A). The hearts of the 2K1C
animals showed increased mRNA expression of the E-cad (0.69±0.08),
N-cad (0.73±0.02), α-SMA (1.11±0.09), COL1A1 (1.66±0.18) and HGF
(0.56±0.02) compared with the sham group (E-cad, 0.2±0.02,
P=0.0001; N-cad, 0.49±0.04, P=0.0001; α-SMA, 0.72±0.13, P=0.02;
COL1A1, 0.93±0.2, P=0.02; HGF, 0.38±0.03, P=0.0003). No significant
change in the expression of the COL3A1 gene was observed (Fig. 2B). Hypertension decreased the renal
mRNA expression of the E-cad gene (Right-2K1C 0.85±0.06 vs. sham
1.14±0.03, P=0.002; Left-2K1C 0.85±0.06 vs. sham 1.25±0.08,
P=0.001) and increased expression of the α-SMA (Right-2K1C
1.69±0.19 vs. sham 1.03±0.03, P=0.01; Left-2K1C 1.63±0.13 vs. sham
1.00±0.06, P=0.002). However, increased expression of the N-cad
(2K1C 1.17±0.08 vs. sham 0.82±0.05, P=0.006) and COL1A1 (2K1C
3.41±0.39 vs. sham 1.96±0.32, P=0.02), and the decreased expression
of the COL3A1 gene (2K1C 0.89±0.08 vs. sham 1.63±0.28, P=0.008) was
only observed in the left stenotic kidney. The 2K1C group presented
differential regulation of HGF expression in the two kidneys
(Fig. 2C). Hypertension increased
the mRNA expression of HGF in the left kidney (2K1C 0.94±0.03 vs.
sham 0.77±0.07, P=0.02) but decreased the expression of this gene
in the contralateral kidney (2K1C 0.58±0.05 vs. sham 0.82±0.09,
P=0.02; Fig. 2C).
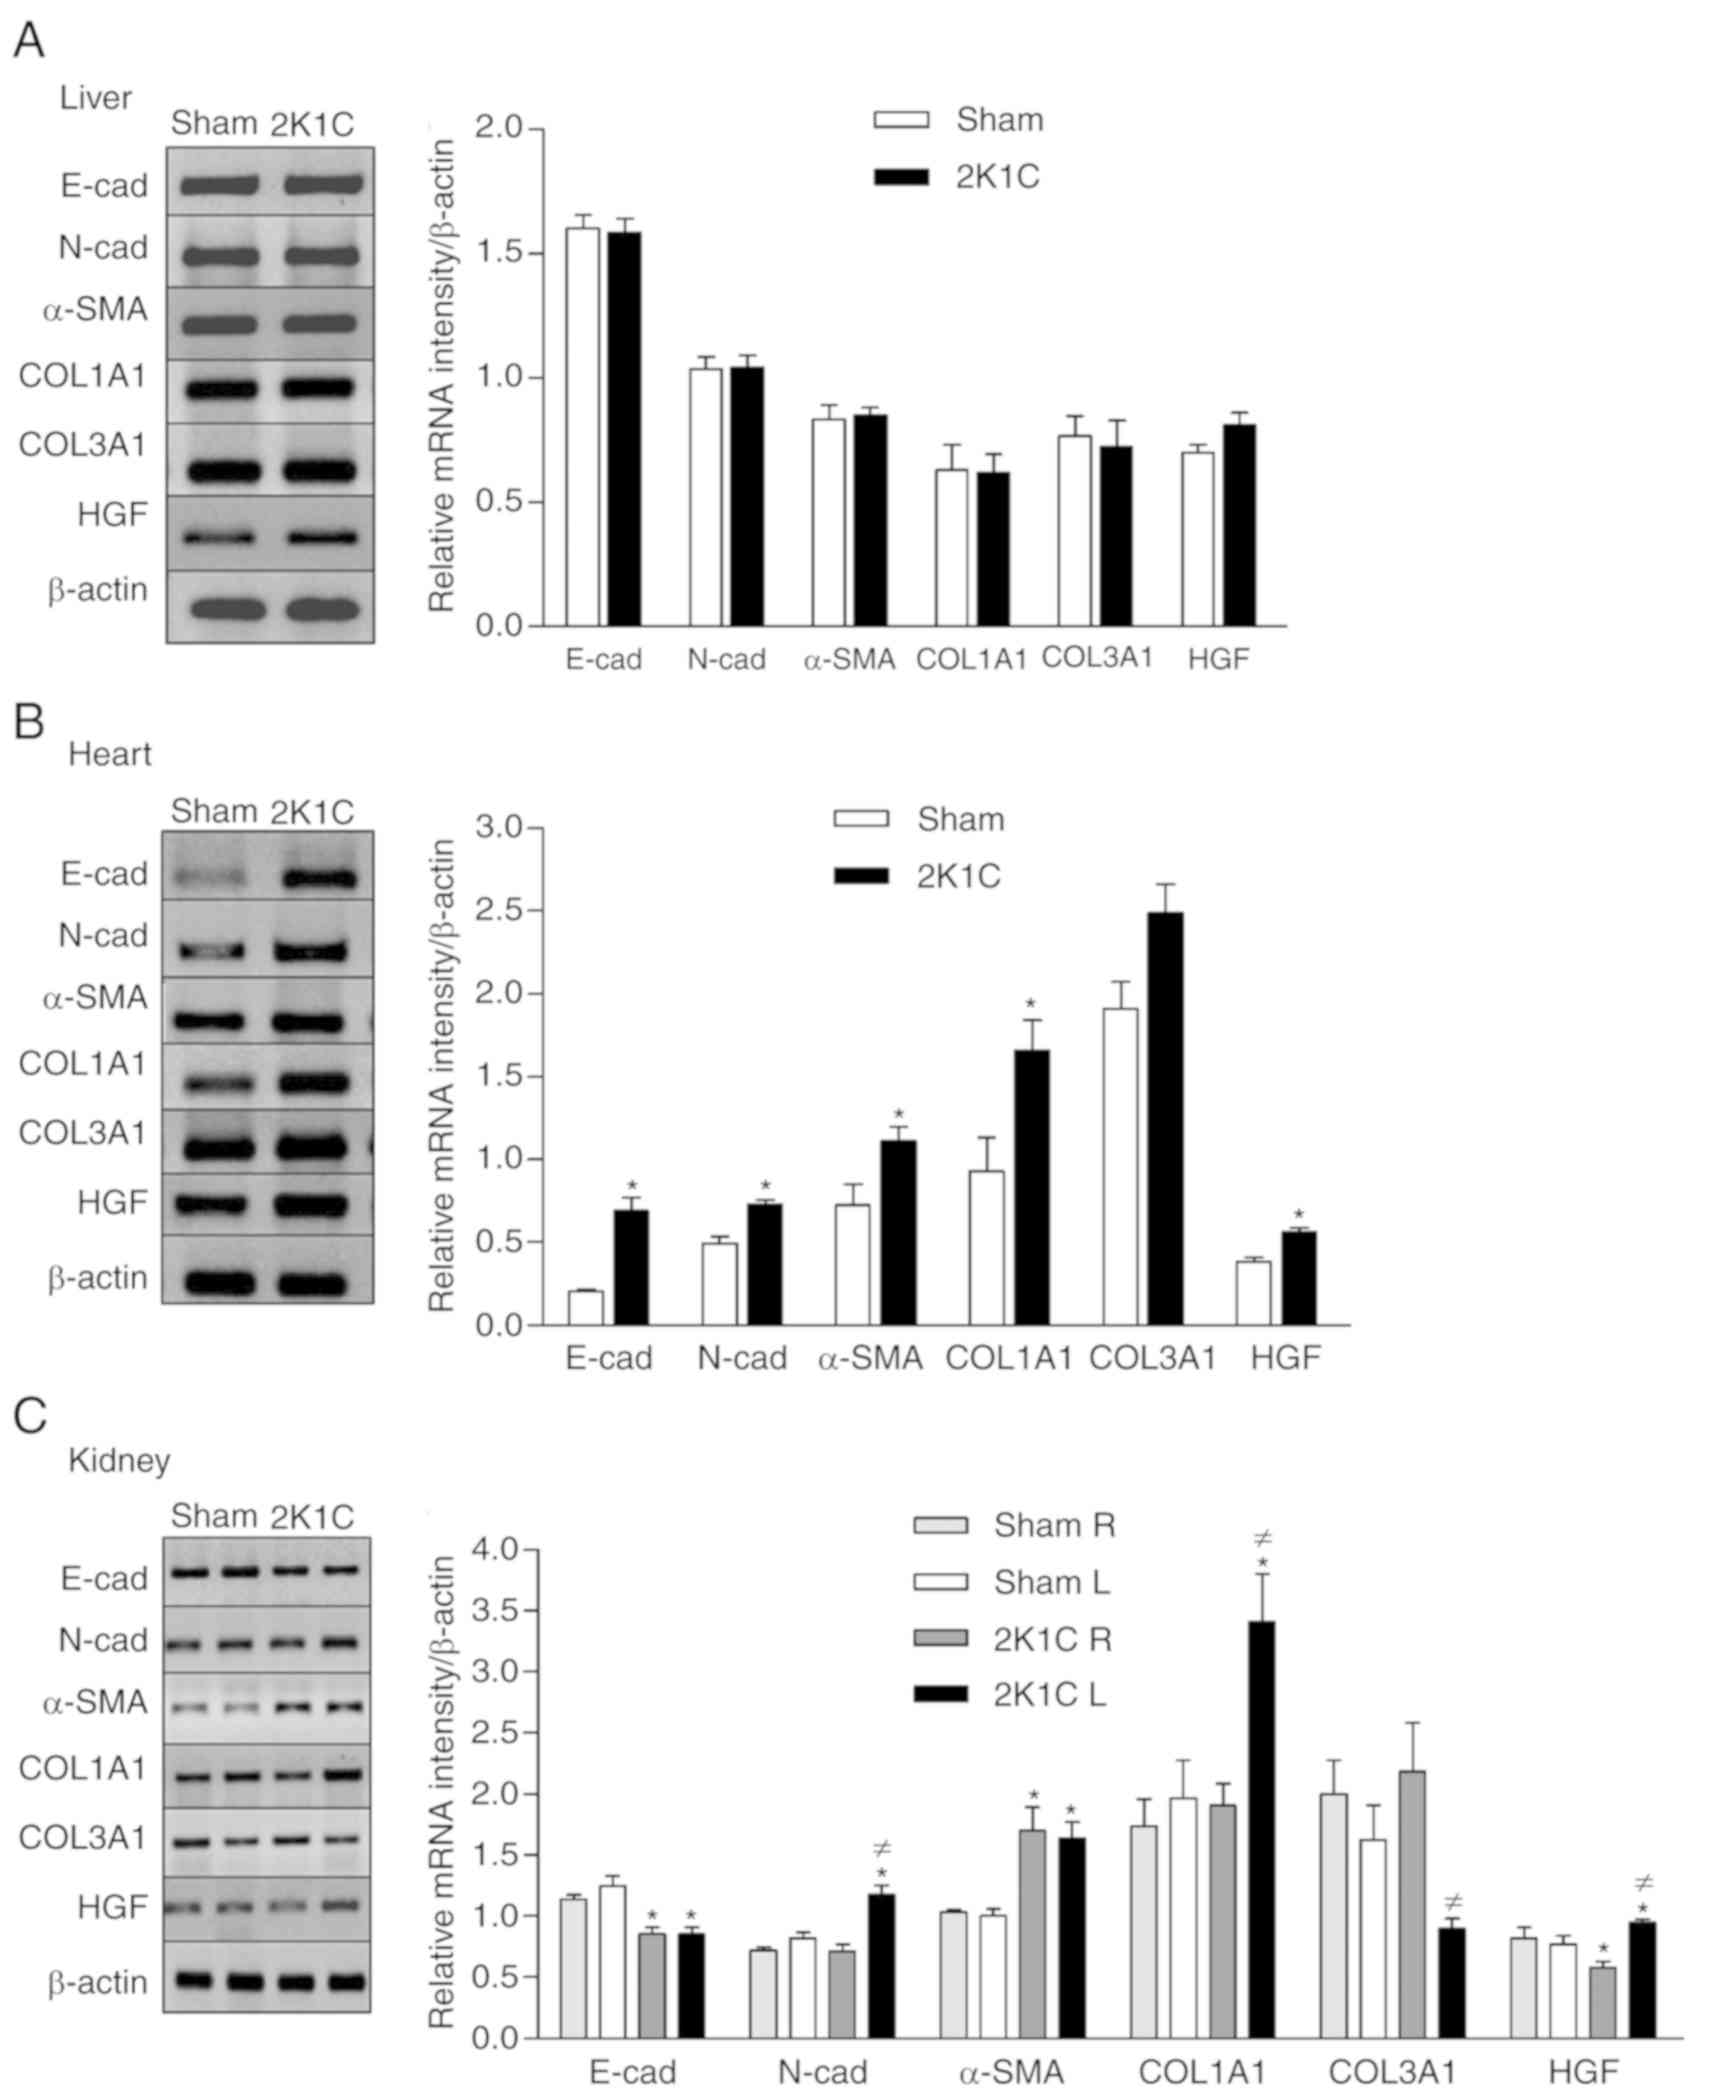 | Figure 2.Effect of renovascular hypertension
on the expression of E-cad, N-cad, α-SMA, COL1A1, COL3A1 and HGF
genes. Expression was detected using reverse transcription-PCR in
the (A) liver, (B) heart and (C) kidneys with densitometric
analysis was carried out for each gene for the sham and 2K1C
groups. Values are expressed as the mean ± SEM for each group.
*P<0.05 vs. respective sham; ≠P<0.05 vs.
contralateral 2K1C kidney. 2K1C, 2 kidney 1 clip; E-cad,
E-cadherin; N-cad, N-cadherin; α-SMA, α-smooth muscle actin;
COL1A1, collagen I; COL3A1, collagen III; HGF, hepatocyte growth
factor; L, left; R, right. |
Discussion
In the 2K1C renovascular hypertension model, there
is a chronic decrease of the blood flow and consequently of the
renal perfusion pressure, resulting in elevated plasma renin
levels. This is associated with an increase in the level of
angiotensin II, which in turn leads to increased arterial pressure
(22). In addition, prolonged
exposure to angiotensin II contributes to the development of
cardiovascular hypertrophy and remodeling (23). Left renal artery clamping leads to
a hypertrophic response in the myocardium. In the present study,
clamping led to an increased cardiac mass and cardiomyocyte area
observed for the 2K1C animals. Thus, hypertension caused the
myocardium to adapt to the increased load, with this adaptive
response eventually resulting in an increased cardiac mass
(24). The weight difference found
between the clipped and non-clipped kidneys in the present study
was also indicative of the effectiveness of the surgically induced
experimental model. The findings of the present study suggested
that the contralateral (non-clipped) kidney was able to prevent an
increase in the blood volume and consequent additional increase in
the arterial pressure. This is consistent with a previous study
where a clip with a 0.2 mm aperture obstructed >70% of the renal
blood flow and led to renovascular hypertension (25).
The increased production of the inflammatory factors
TGF-β1, TNF-α and IL-6 in the different organs of the hypertensive
animals was indicative of the existence of an inflammatory process
(26). Cardiovascular damage
caused by excessive stimulation of the RAS and AT1 receptors
(AT1R), induced by the 2K1C experimental model, is mediated through
proinflammatory activation of the immune system (27). Moreover, inflammatory cell
recruitment is associated with the development of left ventricular
fibrosis and remodeling in the hypertensive heart (28), as demonstrated by the increase of
connective tissue in the 2K1C animals of the present study.
Similarly, increased renal inflammation is associated with greater
tissue fibrosis and loss of renal function (29), which is in agreement with the
histological findings of the present study.
It is known that in addition to vasoconstriction,
angiotensin II can induce oxidative stress due to the stimulation
of AT1R by activation of the NADH/NADPH oxidase enzyme in vascular
cells, increasing intracellular synthesis of ROS (30). Thus, oxidative stress is associated
with the activation of inflammatory processes (31), this is consistent with the
increased production of cytokines or growth factors found in the
hypertensive rats in the present study. The results obtained in the
present study demonstrated that hypertension led to increased
oxidative stress in the kidneys, as indicated by the increase of
TBARS. However, the activity of superoxide dismutase was not
examined and is a limitation of the present study. Previous studies
involving animal models of hypertension have shown that an
abundance of ROS, due either to their increased production or their
decreased degradation, determines the extent of oxidative damage in
tissues (32–34). However, in the present study, no
differences were observed in the levels of lipid peroxidation
between the sham and 2K1C groups in the liver and heart, although
an increased level of TGF-β1 was observed. Whereas elevated lipid
peroxidation is associated with liver damage (35), the results obtained in the liver in
the present study supported the fact that a precise balance between
the levels of ROS and the corresponding antioxidants is important
for maintaining proper cellular functions (36). In the heart, the levels of -SH
groups were increased in an attempt to protect itself against
oxidative damage. This is likely to be the reason that no
alterations in the levels of TBARS were observed.
In addition to the inflammatory damage induced by
hypertension, as shown by the increased levels of proinflammatory
molecules, fibroblast markers and collagen deposition, it was also
observed that epithelial and mesenchymal genes were differentially
expressed in the kidneys, leading to the occurrence of EMT. This
phenotype in the renal cells was observed as a reduction in the
expression of E-cad and an increase of the mesenchymal/fibroblast
markers such as N-cad, α-SMA and COL1A1. These changes were
associated with the loss of tubular epithelial cells and increased
amounts of connective tissue. Both increased proliferation of
resident fibroblasts (and/or collagen) and epithelial cells
undergoing EMT may be associated with the release of TGF-β1
(37). Consistent with this
hypothesis, the upregulated expression of N-cad and COL1A1 in only
the clipped kidney can be explained by the increase of TGF-β1 and
IL-6 in this organ. Moreover, while an increased level of COL1A1
expression was observed, the level of COL3A1 was reduced. This is
indicative of the synthesis of collagen type III gradually being
replaced by collagen type I in the early stages of renal fibrosis
(38). The transition of tubular
epithelial cells into cells with mesenchymal features results in
functional debility and an increased regenerative response,
inducing an immunological reaction and recruitment of
myofibroblasts (39). The
increased gene expression of α-SMA, as well as other data of the
present study, supported these findings. Furthermore, there is
evidence that oxidative stress is involved in the pathogenesis of
TGF-β1-induced EMT through the activation of mitogen-activated
protein kinase and Smad pathways (40).
The HGF gene showed differential expression in the
kidneys of the hypertensive animals. Therefore, increased mRNA
expression of the HGF gene in the left kidney, together with its
decreased expression in the contralateral kidney, was indicative of
the stimulation of the transcriptional regulation of this gene in
an attempt to counter the fibrotic action of TGF-β1. One of the
activities of TGF-β1 is the negative regulation of the
transcription of E-cad and other components of AJs, leading to the
loss of epithelial intercellular adhesion, which is associated with
cellular delamination from the epithelial layer (41). This phenomenon was observed in the
present study, with the decreased expression of E-cad transcripts
in the kidneys being explained by the increased expression of
TGF-β1. However, other factors may be involved in the negative
regulation of E-cad expression, such as microRNA-214-3p, under
hypoxic conditions (42), as well
as the zinc finger protein SNAI1 family of transcription factors
during embryo development and tumor progression (43). In another model of hypertension,
the consumption of dietary salt induced renal fibrosis and tubular
EMT, as identified by reduced E-cad expression and increased α-SMA
expression (44).
In the present study, the increased blood pressure
led to an increase in the area occupied by collagen fibers in the
cardiac tissue, which was associated with the increased expression
of the COL1A1 gene, a marker of fibrosis. These findings were
supported by the increased levels of the TGF-β1 profibrotic
cytokine in the hypertensive animals, as well as by the increased
expression of the N-cad and α-SMA mesenchymal markers. The
increased expression of N-cadherin has been observed in animals
with hypertrophic hearts (45).
The transformation of cardiac fibroblasts into myofibroblasts is
predominantly promoted by TGF-β1 and other growth factors,
resulting in the excessive production of extracellular matrix
proteins (7). In the process of
cardiac fibrosis, the level of α-SMA increases during
transdifferentiation of the fibroblasts into myofibroblasts
(46). The expression of E-cad was
positively regulated by hypertension, consequently, the
transdifferentiation from endothelial to mesenchymal phenotype was
not observed, despite the high levels of TGF-β1 in the heart.
Considering that the dynamic control of E-cad is fundamental in
establishing and maintaining the junctions between epithelial cells
(47), the increased gene
expression observed was suggestive of an attempt to restore cardiac
function. This hypothesis was supported by the increased gene
expression of HGF, which negatively regulates the transformation of
cardiac fibroblasts in response to TGF-β1 (48,49).
On the other hand, partial EndMT may also occur (39), in which cells exhibit both
endothelial and mesenchymal markers and, therefore, have a hybrid
phenotype (50,51).
In the normal liver, the expression of TGF-β1 is
low; however, higher expression occurs in the case of liver damage
(52). Despite the increased
levels of the proinflammatory cytokines TGF-β1 and TNF-α in the
liver of the hypertensive animals, the epithelial E-cad and the
mesenchymal N-cad, α-SMA and COL1A1 gene transcripts were not
modulated by hypertension. There were also no changes in the
expression of the COL3A1 and HGF genes, or the cellular
organization of the hepatic tissue. The data from the present study
suggested that during the 28 day experimental period, renovascular
hypertension did not cause damage to the liver tissue as there was
no proliferation of hepatocytes or activation of hepatic stellate
cells, which would lead to fibrosis (53). Therefore, it is hypothesized that
these results indicate that the hepatic antioxidant capacity
stimulated a protective mechanism for the tissue. Thus, the
epithelial/endothelial and mesenchymal genes expressed in the
liver, heart and kidneys are differentially regulated by
renovascular hypertension. Collectively, the data indicated that
renovascular hypertension caused renal damage that stimulated the
transcription of EMT/EndMT genes in the kidneys and the heart.
However, in the heart, these genes were differentially modulated,
which may occur to maintain cardiac function.
Acknowledgements
The authors would like to thank Dr Cibele M. Prado
(Department of Pathology, Ribeirão Preto Medical School, University
of São Paulo, Brazil) for the surgical training provided.
Funding
The current study was supported by Fundação Hermínio
Ometto/FHO (Araras, SP, Brazil; grant no. 2017/345).
Availability of data and materials
The datasets used and/or analyzed during the current
study are available from the corresponding author on reasonable
request.
Authors' contributions
CAO conceived and designed the experiments. LRF,
BCM, GSRQ, RFF, MAME, MF and AAA performed the experiments. CAO and
BFT analyzed the data. CAO wrote the manuscript. All authors read
and approved the final manuscript.
Ethics approval and consent to
participate
The experimental procedures in the present study
were performed with the approval of the Ethics Committee on Animal
Use of University Center of the Hermínio Ometto Foundation (Araras,
Brazil).
Patient consent for publication
Not applicable.
Competing interests
The authors declare that they have no competing
interests.
References
|
1
|
Levy D, Larson MG, Vasan RS, Kannel WB and
Ho KK: The progression from hypertension to congestive heart
failure. JAMA. 275:1557–1562. 1996. View Article : Google Scholar : PubMed/NCBI
|
|
2
|
Khangura KK, Eirin A, Kane GC, Misra S,
Textor SC, Lerman A and Lerman LO: Cardiac function in renovascular
hypertensive patients with and without renal dysfunction. Am J
Hypertens. 27:445–453. 2014. View Article : Google Scholar : PubMed/NCBI
|
|
3
|
Chade AR, Rodriguez-Porcel M, Grande JP,
Krier JD, Lerman A, Romero JC, Napoli C and Lerman LO: Distinct
renal injury in early atherosclerosis and renovascular disease.
Circulation. 106:1165–1171. 2002. View Article : Google Scholar : PubMed/NCBI
|
|
4
|
Crowley SD: The cooperative roles of
inflammation and oxidative stress in the pathogenesis of
hypertension. Antioxid Redox Signal. 20:102–120. 2014. View Article : Google Scholar : PubMed/NCBI
|
|
5
|
Oliveira-Sales EB, Dugaich AP, Carillo BA,
Abreu NP, Boim MA, Martins PJ, D'Almeida V, Dolnikoff MS,
Bergamaschi CT and Campos RR: Oxidative stress contributes to
renovascular hypertension. Am J Hypertens. 21:98–104. 2008.
View Article : Google Scholar : PubMed/NCBI
|
|
6
|
Lim YS, Lee HC and Lee HS: Switch of
cadherin expression from E- to N-type during the activation of rat
hepatic stellate cells. Histochem Cell Biol. 127:149–160. 2007.
View Article : Google Scholar : PubMed/NCBI
|
|
7
|
Wu M, Peng Z, Zu C, Ma J, Lu S, Zhong J
and Zhang S: Losartan attenuates myocardial
endothelial-to-mesenchymal transition in spontaneous hypertensive
rats via inhibiting TGF-β/Smad signaling. PLoS One.
11:e01557302016. View Article : Google Scholar : PubMed/NCBI
|
|
8
|
Chade AR, Zhu XY, Grande JP, Krier JD,
Lerman A and Lerman LO: Simvastatin abates development of renal
fibrosis in experimental renovascular disease. J Hypertens.
26:1651–1660. 2008. View Article : Google Scholar : PubMed/NCBI
|
|
9
|
Fragiadaki M and Mason RM:
Epithelial-mesenchymal transition in renal fibrosis-evidence for
and against. Int J Exp Pathol. 92:143–150. 2011. View Article : Google Scholar : PubMed/NCBI
|
|
10
|
Niessen CM, Leckband D and Yap AS: Tissue
organization by cadherin adhesion molecules: Dynamic molecular and
cellular mechanisms of morphogenetic regulation. Physiol Rev.
91:691–731. 2011. View Article : Google Scholar : PubMed/NCBI
|
|
11
|
Katsamba P, Carroll K, Ahlsen G, Bahna F,
Vendome J, Posy S, Rajebhosale M, Price S, Jessell TM, Ben-Shaul A,
et al: Linking molecular affinity and cellular specificity in
cadherin-mediated adhesion. Proc Natl Acad Sci USA.
106:11594–11599. 2009. View Article : Google Scholar : PubMed/NCBI
|
|
12
|
Gumbiner BM: Cell adhesion: The molecular
basis of tissue architecture and morphogenesis. Cell. 84:345–357.
1996. View Article : Google Scholar : PubMed/NCBI
|
|
13
|
Murphy F, Waung J, Collins J, Arthur MJ,
Nagase H, Mann D, Benyon RC and Iredale JP: N-Cadherin cleavage
during activated hepatic stellate cell apoptosis is inhibited by
tissue inhibitor of metalloproteinase-1. Comp Hepatol. 3 (Suppl
1):S82004. View Article : Google Scholar : PubMed/NCBI
|
|
14
|
Guarino M, Tosoni A and Nebuloni M: Direct
contribution of epithelium to organ fibrosis:
Epithelial-mesenchymal transition. Hum Pathol. 40:1365–1376. 2009.
View Article : Google Scholar : PubMed/NCBI
|
|
15
|
Voutsadakis IA: HER2 in stemness and
epithelial-mesenchymal plasticity of breast cancer. Clin Transl
Oncol. 21:539–555. 2019. View Article : Google Scholar : PubMed/NCBI
|
|
16
|
Wang H and Unternaehrer JJ:
Epithelial-mesenchymal transition and cancer stem cells: At the
crossroads of differentiation and dedifferentiation. Dev Dyn.
248:10–20. 2019. View Article : Google Scholar : PubMed/NCBI
|
|
17
|
Yu K, Li Q, Shi G and Li N: Involvement of
epithelial-mesenchymal transition in liver fibrosis. Saudi J
Gastroenterol. 24:5–11. 2018. View Article : Google Scholar : PubMed/NCBI
|
|
18
|
Chen DQ, Feng YL, Cao G and Zhao YY:
Natural products as a source for antifibrosis therapy. Trends
Pharmacol Sci. 39:937–952. 2018. View Article : Google Scholar : PubMed/NCBI
|
|
19
|
Goldblatt H, Lynch J, Hanzal RF and
Summerville WW: Studies on experimental hypertension: I. The
production of persistent elevation of systolic blood pressure by
means of renal ischemia. J Exp Med. 59:347–379. 1934. View Article : Google Scholar : PubMed/NCBI
|
|
20
|
Esterbauer H and Cheeseman KH:
Determination of aldehydic lipid peroxidation products:
Malonaldehyde and 4-hydroxynonenal. Methods Enzymol. 186:407–421.
1990. View Article : Google Scholar : PubMed/NCBI
|
|
21
|
Faure P and Lafond JL: Measurement of
plasma sulfhydryl and carbonyl groups as a possible indicator of
protein oxidationAnalysis of Free Radicals in Biological Systems.
Favier AE, Cadet J, Kalyanaraman B, Fontecave M and Pierre JL:
Birkhäuser; Basel: pp. 237–248. 1995, View Article : Google Scholar
|
|
22
|
Hiyoshi H, Yayama K, Takano M and Okamoto
H: Angiotensin type 2 receptor-mediated phosphorylation of eNOS in
the aortas of mice with 2-kidney, 1-clip hypertension.
Hypertension. 45:967–973. 2005. View Article : Google Scholar : PubMed/NCBI
|
|
23
|
Mehta PK and Griendling KK: Angiotensin II
cell signaling: Physiological and pathological effects in the
cardiovascular system. Am J Physiol Cell Physiol. 292:C82–C97.
2007. View Article : Google Scholar : PubMed/NCBI
|
|
24
|
Janicki JS, Brower GL, Gardner JD, Chancey
AL and Stewart JA Jr: The dynamic interaction between matrix
metalloproteinase activity and adverse myocardial remodeling. Heart
Fail Rev. 9:33–42. 2004. View Article : Google Scholar : PubMed/NCBI
|
|
25
|
Peotta VA, Gava AL, Vasquez EC and
Meyrelles SS: Evaluation of baroreflex control of heart rate in
renovascular hypertensive mice. Can J Physiol Pharmacol.
85:761–766. 2007. View
Article : Google Scholar : PubMed/NCBI
|
|
26
|
Ding Y and Choi ME: Regulation of
autophagy by TGF-β: Emerging role in kidney fibrosis. Semin
Nephrol. 34:62–71. 2014. View Article : Google Scholar : PubMed/NCBI
|
|
27
|
Singh MV, Chapleau MW, Harwani SC and
Abboud FM: The immune system and hypertension. Immunol Res.
59:243–253. 2014. View Article : Google Scholar : PubMed/NCBI
|
|
28
|
Levick SP, McLarty JL, Murray DB, Freeman
RM, Carver WE and Brower GL: Cardiac mast cells mediate left
ventricular fibrosis in the hypertensive rat heart. Hypertension.
53:1041–1047. 2009. View Article : Google Scholar : PubMed/NCBI
|
|
29
|
Matavelli LC, Huang J and Siragy HM:
Angiotensin AT₂ receptor stimulation inhibits early renal
inflammation in renovascular hypertension. Hypertension.
57:308–313. 2011. View Article : Google Scholar : PubMed/NCBI
|
|
30
|
Endtmann C, Ebrahimian T, Czech T, Arfa O,
Laufs U, Fritz M, Wassmann K, Werner N, Petoumenos V, Nickenig G
and Wassmann S: Angiotensin II impairs endothelial progenitor cell
number and function in vitro and in vivo: Implications for vascular
regeneration. Hypertension. 58:394–403. 2011. View Article : Google Scholar : PubMed/NCBI
|
|
31
|
Skultetyova D, Filipova S, Riecansky I and
Skultety J: The role of angiotensin type 1 receptor in inflammation
and endothelial dysfunction. Recent Pat Cardiovasc Drug Discov.
2:23–27. 2007. View Article : Google Scholar : PubMed/NCBI
|
|
32
|
Polizio AH and Peña C: Effects of
angiotensin II type 1 receptor blockade on the oxidative stress in
spontaneously hypertensive rat tissues. Regul Pept. 128:1–5. 2005.
View Article : Google Scholar : PubMed/NCBI
|
|
33
|
Dornas WC, Silva M, Tavares R, de Lima WG,
dos Santos RC, Pedrosa ML and Silva ME: Efficacy of the superoxide
dismutase mimetic tempol in animal hypertension models: A
meta-analysis. J Hypertens. 33:14–23. 2015. View Article : Google Scholar : PubMed/NCBI
|
|
34
|
Rizzi E, Ceron CS, Guimaraes DA, Prado CM,
Rossi MA, Gerlach RF and Tanus-Santos JE: Temporal changes in
cardiac matrix metalloproteinase activity, oxidative stress, and
TGF-β in renovascular hypertension-induced cardiac hypertrophy. Exp
Mol Pathol. 94:1–9. 2013. View Article : Google Scholar : PubMed/NCBI
|
|
35
|
Seif HSA: Physiological changes due to
hepatotoxicity and the protective role of some medicinal plants.
Beni-Suef Univ J Basic Appl Sci. 5:134–146. 2016. View Article : Google Scholar
|
|
36
|
Valko M, Leibfritz D, Moncol J, Cronin MT,
Mazur M and Telser J: Free radicals and antioxidants in normal
physiological functions and human disease. Int J Biochem Cell Biol.
39:44–84. 2007. View Article : Google Scholar : PubMed/NCBI
|
|
37
|
Correa-Costa M, Semedo P, Monteiro AP,
Silva RC, Pereira RL, Gonçalves GM, Marques GD, Cenedeze MA,
Faleiros AC, Keller AC, et al: Induction of heme oxygenase-1 can
halt and even reverse renal tubule-interstitial fibrosis. PLoS One.
5:e142982010. View Article : Google Scholar : PubMed/NCBI
|
|
38
|
Genovese F, Manresa AA, Leeming DJ,
Karsdal MA and Boor P: The extracellular matrix in the kidney: A
source of novel non-invasive biomarkers of kidney fibrosis?
Fibrogenesis Tissue Repair. 7:42014. View Article : Google Scholar : PubMed/NCBI
|
|
39
|
Lovisa S, LeBleu VS, Tampe B, Sugimoto H,
Vadnagara K, Carstens JL, Wu CC, Hagos Y, Burckhardt BC,
Pentcheva-Hoang T, et al: Epithelial-to-mesenchymal transition
induces cell cycle arrest and parenchymal damage in renal fibrosis.
Nat Med. 21:998–1009. 2015. View Article : Google Scholar : PubMed/NCBI
|
|
40
|
Wang Y, Pang L, Zhang Y, Lin J and Zhou H:
Fenofibrate improved interstitial fibrosis of renal allograft
through inhibited epithelial-mesenchymal transition induced by
oxidative stress. Oxid Med Cell Longev. 2019:89368562019.PubMed/NCBI
|
|
41
|
Chen Y, Luo Q and Xiong Z, Liang W, Chen L
and Xiong Z: Telmisartan counteracts TGF-β1 induced
epithelial-to-mesenchymal transition via PPAR-γ in human proximal
tubule epithelial cells. Int J Clin Exp Pathol. 5:522–529.
2012.PubMed/NCBI
|
|
42
|
Liu M, Liu L, Bai M, Zhang L, Ma F, Yang X
and Sun S: Hypoxia-induced activation of Twist/miR-214/E-cadherin
axis promotes renal tubular epithelial cell mesenchymal transition
and renal fibrosis. Biochem Biophys Res Commun. 495:2324–2330.
2018. View Article : Google Scholar : PubMed/NCBI
|
|
43
|
Nieto MA and Cano A: The
epithelial-mesenchymal transition under control: Global programs to
regulate epithelial plasticity. Semin Cancer Biol. 22:361–368.
2012. View Article : Google Scholar : PubMed/NCBI
|
|
44
|
Wang Y, Mu JJ, Liu FQ, Ren KY, Xiao HY,
Yang Z and Yuan ZY: Salt-induced epithelial-to-mesenchymal
transition in Dahl salt-sensitive rats is dependent on elevated
blood pressure. Braz J Med Biol Res. 47:223–230. 2014. View Article : Google Scholar : PubMed/NCBI
|
|
45
|
dos Santos DO, Blefari V, Prado FP, Silva
CA, Fazan R Jr, Salgado HC, Ramos SG and Prado CM: Reduced
expression of adherens and gap junction proteins can have a
fundamental role in the development of heart failure following
cardiac hypertrophy in rats. Exp Mol Pathol. 100:167–176. 2016.
View Article : Google Scholar : PubMed/NCBI
|
|
46
|
Liu G, Liang B, Song X, Bai R, Qin W, Sun
X, Lu Y, Bian Y and Xiao C: P-selectin increases angiotensin
II-induced cardiac inflammation and fibrosis via platelet
activation. Mol Med Rep. 13:5021–5028. 2016. View Article : Google Scholar : PubMed/NCBI
|
|
47
|
Canel M, Serrels A, Anderson KI, Frame MC
and Brunton VG: Use of photoactivation and photobleaching to
monitor the dynamic regulation of E-cadherin at the plasma
membrane. Cell Adh Migr. 4:491–501. 2010. View Article : Google Scholar : PubMed/NCBI
|
|
48
|
Okayama K, Azuma J, Dosaka N, Iekushi K,
Sanada F, Kusunoki H, Iwabayashi M, Rakugi H, Taniyama Y and
Morishita R: Hepatocyte growth factor reduces cardiac fibrosis by
inhibiting endothelial-mesenchymal transition. Hypertension.
59:958–965. 2012. View Article : Google Scholar : PubMed/NCBI
|
|
49
|
Yi X, Li X, Zhou Y, Ren S, Wan W, Feng G
and Jiang X: Hepatocyte growth factor regulates the TGF-β1-induced
proliferation, differentiation and secretory function of cardiac
fibroblasts. Int J Mol Med. 34:381–390. 2014. View Article : Google Scholar : PubMed/NCBI
|
|
50
|
Nieto MA, Huang RY, Jackson RA and Thiery
JP: Emt: 2016. Cell. 166:21–45. 2016. View Article : Google Scholar : PubMed/NCBI
|
|
51
|
Jolly MK, Ward C, Eapen MS, Myers S,
Hallgren O, Levine H and Sohal SS: Epithelial-mesenchymal
transition, a spectrum of states: Role in lung development,
homeostasis, and disease. Dev Dyn. 247:346–358. 2018. View Article : Google Scholar : PubMed/NCBI
|
|
52
|
Jones CN, Tuleuova N, Lee JY, Ramanculov
E, Reddi AH, Zern MA and Revzin A: Cultivating hepatocytes on
printed arrays of HGF and BMP7 to characterize protective effects
of these growth factors during in vitro alcohol injury.
Biomaterials. 31:5936–5944. 2010. View Article : Google Scholar : PubMed/NCBI
|
|
53
|
Xie G and Diehl AM: Evidence for and
against epithelial-to-mesenchymal transition in the liver. Am J
Physiol Gastrointest Liver Physiol. 305:G881–G890. 2013. View Article : Google Scholar : PubMed/NCBI
|


