Introduction
MicroRNAs (miRNAs) are small, single-stranded RNAs
that do not encode proteins. MiRNAs repress the translation of
target mRNAs to regulate gene expression (1) and serve an important role in the
mechanism of age-related changes in the brain (2,3). In
our previous study, it was suggested that certain miRNAs may play
important roles in neurodegenerative diseases, such as inducing the
accumulation of α-synuclein (4) and targeting molecules related to the
autophagy pathway (5).
Aging is one of the major risk factors for
neurodegenerative diseases, including Alzheimer's disease (AD) and
Parkinson's disease (PD) (6).
Pathological changes in the brain associated with AD have been
demonstrated to first occur in the locus coeruleus of the brainstem
before the onset of the disease (7) followed by spread to the hippocampus
and involvement of the cerebral cortex in the terminal stages of
the disease (8). Furthermore,
early pathological changes in the dorsal motor nucleus of the
glossopharyngeal and vagal nerves of the brainstem occur and
progress to the hippocampus and cerebral cortex in an ascending
manner in sporadic PD (9). The
brainstem exhibits pathological changes from an early stage in
certain neurodegenerative diseases such as AD (7,8) and
PD (9); however, the molecular
mechanisms encompassing these changes remain unknown.
Senescence-accelerated mouse prone 8 (SAMP8) mice
are used as animal models of rapid aging and show age-related
deficits in learning and memory (10,11).
Thus, SAMP8 mice may be a useful model for studying
neurodegenerative changes associated with AD (10). There have been numerous reports on
the histopathological brain degeneration of SAMP8 mice at each week
age and the order of the progression (11–13).
SAMP8 mice show spongiform degeneration in the brainstem at 1 month
of age, with maximum spongiosis observed at 4–8 months (14). These histopathological changes
suggest that age-related brain degeneration progresses from the
brainstem in SAMP8 mice, which is similar to that in humans
(7–9). By contrast, senescence-accelerated
mouse resistant 1 (SAMR1) mice demonstrate behaviorally normal
senescence patterns (10).
Furthermore, SAMR1 mice exhibit no spongiform degeneration in any
brain region in early postnatal age (12). As a result of these
characteristics, SAMR1 mice are frequently used as controls for
SAMP8 mice. The present study aimed to assess the early-stage
pathological degeneration in the brainstem of SAMP8 mice and
identify specific miRNAs involved in early-stage brain pathological
degeneration in the brainstem through miRNA profiling of each brain
region in SAMP8 and SAMR1 mice.
Materials and methods
Animals
Twelve 5-month-old male SAMR1 and SAMP8 mice
(n=6/strain; Japan SLC, Inc.) weighing 30–40 g were used in this
study. The present study was approved by the Animal Committee of
the Kagawa University School of Medicine (approval number:
20626-2). The mice were housed under controlled environmental
conditions, including a temperature range of 22–24°C, 40–60%
humidity and 12 h light-dark cycles. All mice had ad libitum
access to water and food and received two daily health
observations. The study employed humane endpoints, including
labored breathing, nasal discharge, lethargy or persistent
recumbency, difficulty with ambulation or an inability to obtain
food or water. The experiment duration was limited to the
acclimation period of the animals to the facility. After
neurobehavioral evaluation, all 12 mice were sacrificed using
intraperitoneal pentobarbital (150 mg/kg). After confirming the
absence of breathing, perfusion with physiological saline solution
was initiated. Euthanasia was confirmed by the absence of cardiac
activity during perfusion, following which perfusion fixation was
performed using paraformaldehyde. Following euthanasia, the brains
of the mice were removed to be used in subsequent analyses. After
perfusion fixation, the samples for miRNA profiling were placed in
RNAlater (cat. no. AMB AM7024; Thermo Fisher Scientific, Inc.) and
stored at −80°C, while those for histological evaluation were
placed in 4% paraformaldehyde and stored in a refrigerator at 4°C.
The brains were divided into the hippocampus, brainstem and
cerebral cortex, and the miRNA expression profiles were evaluated
in these three regions. miRNA profiling was performed using five
mice from each strain. Histological evaluation was performed on the
single remaining mouse from each strain.
Behavioral test
The Y-maze alternation test was performed to assess
short-term working memory in mice. The mice were allowed to enter
the maze for 8 min and the maze arms into which they entered were
recorded. The number of times a mouse entered each maze arm within
the measured time (total number of arms entered) and the number of
combinations that included three different arms entered in
succession (number of alternations) were recorded. The alternation
behavior rate (%) was calculated as follows: Alternation behavior
rate %=number of alternations/(total number of arms entered-2)
×100.
Histopathological analyses
Histopathological analyses were performed to confirm
that histopathological changes in the SAMP8 mouse brains had
occurred, as previously reported (11–13).
Hematoxylin and eosin (H&E) staining and glial fibrillary
acidic protein (GFAP) immunostaining were performed following
paraffin-embedded tissue sectioning (6 µm thick) of the coronal
plane. Paraffin (Merck & Co., Inc.) was utilized for tissue
embedding and two cycles of infiltration at 64°C were carried out
for 30 min, followed by two cycles of infiltration at 64°C for 1 h.
In H&E staining, the hematoxylin staining was conducted for a
duration of 3 min, followed by a 5-min water rinse at 40°C.
Subsequently, eosin staining was performed for 4 min. Following
H&E staining, the brain regions of SAMP8 and SAMR1 mice were
imaged using a light microscope to confirm spongiform degeneration
in the brainstems of SAMP8 mice. The primary antibodies used were
rabbit monoclonal antibodies against GFAP (1:400; cat. no.
TA301159; Cosmo Bio Co., Ltd.). Anti-rabbit IgG goat polyclonal
antibody, included in the Leica® BOND Polymer Refine
Detection kit (cat. no. DS9800; Leica Biosystems, Inc.) was used as
the secondary antibody. Selected sections were immunostained using
the BOND III system (Leica Biosystems, Inc.) according to the
manufacturer's instructions. The reaction of the primary antibody
was conducted at room temperature for 15 min. The secondary
antibody reaction was performed at room temperature for 8 min. The
staining was visualized with 3,3′-diaminobenzidine. Anti-GFAP
antibody-positive astrocytes were assessed in each of the stained
sections.
RNA isolation
The total RNA was extracted from the tissue samples
using the miRNeasy Mini Kit (Qiagen, Inc.) according to the
manufacturer's instructions. RNA integrity was determined using a
NanoDrop™ 2000 spectrophotometer (Thermo Fisher Scientific, Inc.).
Total RNA quality was determined using RNA Nano 6000 chips from an
Agilent 2100 Bioanalyzer (Agilent Technologies, Inc.) according to
the manufacturer's protocol. Briefly, total RNA from all brain
samples was heated at 70°C for 2 min and incubated on ice for 5
min. Subsequently, the samples (1 µl) were loaded into each lane of
the RNA Nano 6000 chips and the bands of 18S and 28S ribosomal RNA
in the gel (RNA6000 Nano Gel Matrix; cat. no. 5067-1511; Agilent
Technologies, Inc.) were detected using the Agilent 2100
Bioanalyzer. The RNA samples were stored at −80°C.
miRNA arrays
The total RNA was labeled with Hy3 dye using the
miRCURY LNA microRNA Array Hi-Power labeling kit (Exiqon A/S;
Qiagen, Inc.). Total RNA (2 µg) was incubated with a spike protein
(spike control for enzymatic labeling; cat. no. TRT-X304; Toray
Industries, Inc.) for 30 min at 37°C and then at 95°C for 5 min.
Hy3 dye and Hi-Power labeling enzymes were added to each sample.
The enzyme was heat inactivated at 16°C for 1 h and 65°C for 15 min
and protected from light. The samples were loaded onto the arrays
by capillary force using 3D-Gene miRNA oligo chips (version 21;
cat. no. CM501; Toray Industries, Inc.). The chips enabled the
examination of the expression of 679 miRNAs printed in duplicate
spots. The arrays were incubated at 32°C for 16 h, briefly washed
at 30°C with washing buffer solution [0.5X saline-sodium citrate
(SSC), 0.1% sodium dodecyl sulfate (SDS)], rinsed with washing
buffer solution (0.2X SSC, 0.1% SDS) and washed again in another
buffer solution (0.05X SSC), according to the manufacturer's
instructions (Toray Industries, Inc.). The arrays were centrifuged
at 600 × g for 1 min at room temperature, followed by immediate
scanning using a 3D-Gene 3000 miRNA microarray scanner (Toray
Industries, Inc.). The relative miRNA expression levels were
calculated by comparing the average signal intensities of the valid
spots with their mean values throughout the microarray experiments,
following normalization to their adjusted median values. The
microarray data obtained in this study have been deposited in
NCBI's Gene Expression Omnibus (GEO) database with accession number
GSE228946 (https://www.ncbi.nlm.nih.gov/geo/query/acc.cgi?acc=GSE228946).
Quantification of miRNA
RNA isolation was performed using the miRNeasy Mini
Kit (Qiagen, Inc.) and spiked with control sno-RNA-202 (Qiagen,
Inc.), according to the manufacturer's protocol (Assay ID: 001232
for sno-RNA-202). Complementary DNA was synthesized for each target
miRNA using the miRNA Reverse Transcription Kit (Thermo Fisher
Scientific, Inc.), according to the manufacturer's protocol. miRNA
expression was detected using reverse transcription-quantitative
polymerase chain reaction (RT-qPCR) with TaqMan miRNA Assay and
TaqMan Universal Master Mix II (Thermo Fisher Scientific, Inc.),
according to the manufacturer's protocol (Assay IDs: 001630 for
miR-491-5p; 002031 for miR-764-5p; 000422 for miR-30e-3p; 002227
for miR-323-3p). Thermocycling conditions were as follows: initial
denaturation at 95°C for 10 min, followed by 40 cycles at 95°C for
15 sec and 60°C for 60 sec. The relative miRNA expression levels
were calculated using the comparative 2−ΔΔCq method
(15) and normalized to
sno-RNA-202 expression. Experiments were performed in
triplicate.
miRNA target gene bioinformatics
analysis
The target genes of the identified miRNAs were
predicted using the miRDB (https://mirdb.org), Targetscan 8.0 (https://www.targetscan.org/mmu_80/) and
miRTarBase version 9.0 (https://mirtarbase.cuhk.edu.cn/~miRTarBase/miRTarBase_2022/php/index.php)
databases. To enhance the reliability of the bioinformatics
analysis, overlapping genes in two or three databases were
identified during the analysis. To explore the relationships among
target genes of identified miRNAs, we employed a Sankey diagram
generated using Power-user software v1.6.1575 (https://www.powerusersoftwares.com).
Statistical analysis
Statistical analyses were performed using SPSS
software (version 26.0; IBM Corp.). P<0.05 was considered to
indicate a statistically significant difference. Alternation
behavior rate, locomotor activity counts, signal intensities and
ΔCq value are expressed as mean ± SD. Significant differences in
the alternation behavior rate and locomotor activity data were
assessed using an unpaired Student's t-test. The signal intensities
of the miRNA probes were log2 transformed and quantile
normalized, and then an unpaired Student's t-test was performed.
Fold change (FC) was calculated from the non-log2 transformed
signal intensities. miRNAs were considered differentially expressed
if P<0.05 and FC>1.5 or FC<1.5−1. Two-way ANOVA
was performed with PORTION (mice: SAMP8 or SAMR1) and STATE (brain
region: brainstem, hippocampus, and cerebral cortex) as factors for
miRNA signal intensities and ΔCq value in each brain region of
SAMP8 and SAMR1. Significances of individual differences were
evaluated using Tukey's post-hoc test if ANOVA results were
significant.
Selection processes of SAMP8 brainstem
specifically regulated miRNAs
The three brain regions of interest, the cerebral
cortex, hippocampus and brainstem, are denoted as C, H and B,
respectively, and SAMP8 and SAMR1 mice are denoted as P or R,
respectively. A set of differentially expressed miRNAs was
represented as {d(B|P>H|P)}, where the expression of
each miRNA of SAMP8 (P) in the brainstem (B) was significantly
higher than that of SAMP8 (P) in the hippocampus (H).
The set (α) of miRNAs whose expression was the
highest in the brainstems of mice P among the three regions was
defined as:
Similarly, the set (β) of miRNAs whose
expression was the highest in the brainstem of mice R among the
three regions was defined as:
The set (γ) of miRNAs whose expression was
the highest exclusively in mice P but not in mice R was defined
as:
However, the members of γ did not guarantee
that the expression of every miRNA was higher in the brainstems of
mice P than in that of mice R. Therefore, from set γ, the
miRNAs whose expression was significantly higher in mice P than in
mice R were selected. These miRNAs were regarded as the SAMP8
brainstem specifically upregulated miRNAs, which were denoted as
set δ and defined as:
A set (δ') of SAMP8 brainstem specifically
downregulated miRNAs were obtained in a similar manner, using the
following equations:
These equations were utilized to ensure the
reproducibility of the data analysis regarding the selection
processes of differentially expressed miRNAs. The equations were
established in the present study and are presented without
referencing any currently published papers, books or established
software.
Results
Behavioral deficits in SAMP8 mice
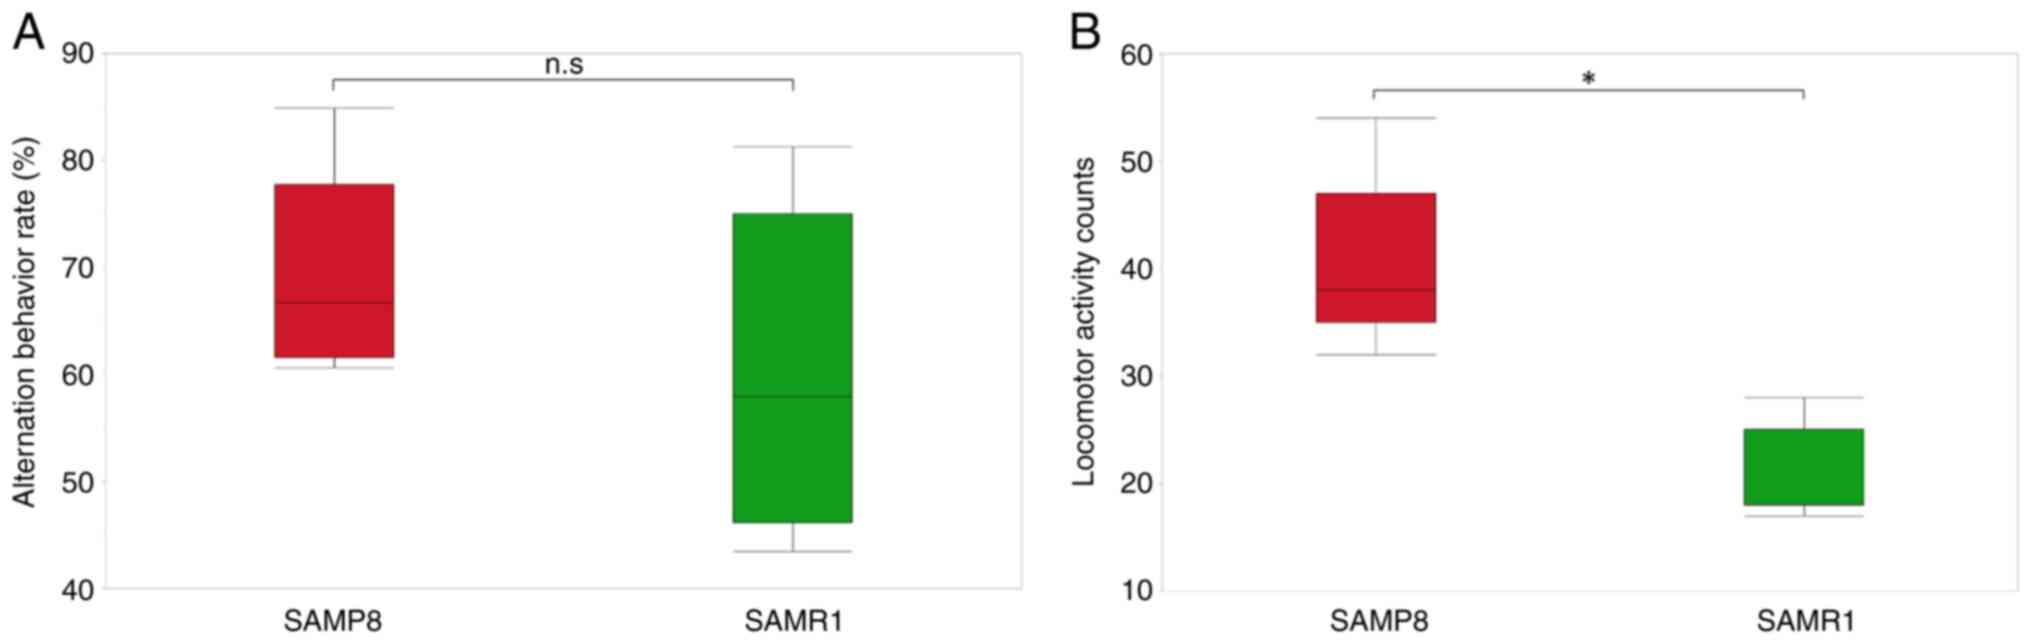
Behavioral deficits were assessed in SAMP8 mice by
comparing their behaviors with those of SAMR1 mice in the Y-maze.
There was no significant difference in the alternation behavior
rate between SAMP8 and SAMR1 mice (Fig. 1A). Locomotor activity counts were
significantly higher in SAMP8 mice compared with those in SAMR1
mice (Fig. 1B). These results
suggested that hyperactivity may occur as a behavioral change in
the early postnatal period when cognitive deficits have not yet
occurred.
Histopathological analysis of SAMP8
brain
Histological evaluation of the brains of SAMP8 and
SAMR1 mice was performed to confirm that the pathological changes
in 5-month-old SAMP8 mice were consistent with previously reports
(8–10). Spongiform degeneration was observed
in the reticular formation of the brainstem in the SAMP8 mouse
(Fig. 2B-a) but not in an
age-matched SAMR1 mouse (Fig.
2A-a). Vacuoles were also observed in the reticular formation
of the SAMP8 brainstem (Fig. 2B-a)
but not in the hippocampus or cortex of the SAMP8 mouse (Fig. 2B-b and c) or any brain region of
the SAMR1 mouse tested (Fig. 2A).
An increase in anti-GFAP antibody-positive astrocyte numbers was
observed in the SAMP8 brainstem (Fig.
3B-a) compared with the SAMR1 brainstem (Fig. 3A-a). However, no noticeable
increase in anti-GFAP antibody-positive astrocyte numbers was
demonstrated in the hippocampus or cortex of the SAMP8 mouse
(Fig. 3B-b, c) or any of the brain
regions of the SAMR1 mouse (Fig.
3A).
Identification of differentially
expressed miRNAs in SAMP8 and SAMR1 brainstems
The miRNA signal intensities were compared across
each brain region (brainstem, hippocampus and cerebral cortex) and
miRNAs that were upregulated or downregulated in the brainstems of
SAMP8 mice were identified. Compared with those in the hippocampus
and cerebral cortex, 72 and 34 miRNAs were upregulated in the
brainstem, respectively. Using Equation
1, 18 miRNAs were identified with a significantly increased
expression in the brainstem compared with the hippocampus and
cerebral cortex of SAMP8 mice (Fig.
4A). In SAMP8 mice, 100 and 56 miRNAs were downregulated in the
brainstem compared with those in the hippocampus and cerebral
cortex, respectively. Additionally, 40 miRNAs were identified with
significantly decreased expression in the brainstem compared with
the hippocampus and cerebral cortex in SAMP8 mice (Fig. 4B, Equation
5).
 | Figure 4.Venn diagrams of differentially
expressed miRNAs in the brainstem compared with those in the
hippocampus and cerebral cortex of SAMP8 and SAMR1 mice. (A) miRNAs
with the highest expression. B>H|P and B>C|P indicate the
upregulated miRNAs in the brainstem compared with those in the
hippocampus and cerebral cortex, respectively, of SAMP8 mice.
B>H|R and B>C|R indicate the upregulated miRNAs in the
brainstem compared with the hippocampus and cerebral cortex,
respectively, in SAMR1 mice. (B) miRNAs with the lowest expression.
B<H|P and B<C|P indicate the downregulated miRNAs in the
brainstem compared with those in the hippocampus and cerebral
cortex, respectively, in SAMP8 mice. B<H|R and B<C|R indicate
the downregulated miRNAs in the brainstem compared with those in
the hippocampus and cerebral cortex, respectively, in SAMR1 mice.
SAMP8 (P), senescence-accelerated mouse prone 8; SAMR1 (R),
senescence-accelerated mouse resistant 1; B, brainstem; H,
hippocampus; C, cerebral cortex; miRNA, micro RNA. |
Similarly, the miRNA signal intensities were
compared across each brain region in SAMR1 mice. Compared with
those in the hippocampus, 27 upregulated and 47 downregulated
miRNAs were identified in the brainstem and 41 upregulated and 49
downregulated miRNAs were identified in the brainstem compared with
those in the cortex. Using Equation 2,
18 miRNAs were demonstrated to have a significantly higher
expression in the brainstem than in the hippocampus and cerebral
cortex in SAMR1 mice (Fig. 4A).
Finally, 28 miRNAs with a significantly lower expression in the
brainstem than in the hippocampus and cerebral cortex in SAMR1 mice
were identified (Fig. 4B, Equation 6).
Identification of
SAMP8-brainstem-specifically regulated miRNAs
Examination of the miRNAs with the highest and
lowest expression in the brainstems of SAMP8 mice was performed.
Using Equation 3, five miRNAs were
identified with the highest expression exclusively found in the
SAMP8 brainstem. These were Mus musculus (mmu)-miR-204-5p,
mmu-miR-3552, mmu-miR-491-5p, mmu-miR-6968-5p and mmu-miR-764-5p
(Fig. 4A). Similarly, 14 miRNAs
with the lowest expression in the brainstem exclusively found in
SAMP8 mice were identified. These were mmu-miR-101a-3p,
mmu-miR-101c, mmu-miR-212-3p, mmu-miR-212-5p, mmu-miR-218-5p,
mmu-miR-30e-3p, mmu-miR-323-3p, mmu-miR-337-3p, mmu-miR-376b-5p,
mmu-miR-3962, mmu-miR-674-3p, mmu-miR-708-3p, mmu-miR-708-5p and
mmu-miR-7a-1-3p (Fig. 4B, Equation 7). It was then assessed whether the
expression intensity of each of the five miRNAs with the highest
expression in SAMP8 brainstems (mmu-miR-204-5p, mmu-miR-3552,
mmu-miR-491-5p, mmu-miR-6968-5p and mmu-miR-764-5p) was higher when
compared with SAMR1 brainstems. The miRNA signal intensities in the
brainstems of SAMR1 and SAMP8 mice were compared and a set of 85
miRNAs were obtained that were significantly upregulated in SAMP8
mice. Thereafter, using Equation 4, two
miRNAs were identified that may be considered as SAMP8 brainstem
specifically upregulated miRNAs: Mmu-miR-491-5p and mmu-764-5p
(Fig. 5A, Table I). Correspondingly, 86 miRNAs were
found to be significantly downregulated in the brainstem of SAMP8
mice compared with those in SAMR1 mice. Two SAMP8 brainstem
specifically downregulated miRNAs were identified: Mmu-30e-3p and
mmu-miR-323-3p (Fig. 5B, Table I, Equation
8). Fig. 6 presents the
upregulated miRNAs, miR-491-5p and miR-764-5p (spots 1 and 2,
respectively), and the downregulated miRNAs, miR-30e-3p and
miR-323-3p (spots 3 and 4, respectively), in the SAMP8 mouse
brainstem analyzed using a miRNA chip.
 | Table I.Statistical analysis of four SAMP8
specifically regulated miRNAs in the brainstem between SAMP8 and
SAMR1 mice. |
Table I.
Statistical analysis of four SAMP8
specifically regulated miRNAs in the brainstem between SAMP8 and
SAMR1 mice.
| miRNA | Fold change
(SAMP8/SAMR1) | P-value |
|---|
| Upregulated |
|
|
|
mmu-miR-491-5p | 1.645 | 0.0413 |
|
mmu-miR-764-5p | 2.044 | 0.0049 |
| Downregulated |
|
|
|
mmu-miR-30e-3p | 0.620 | 0.0098 |
|
mmu-miR-323-3p | 0.342 | 0.0114 |
Quantification of the expression
levels of mmu-miR-491-5p and mmu-miR-764-5p
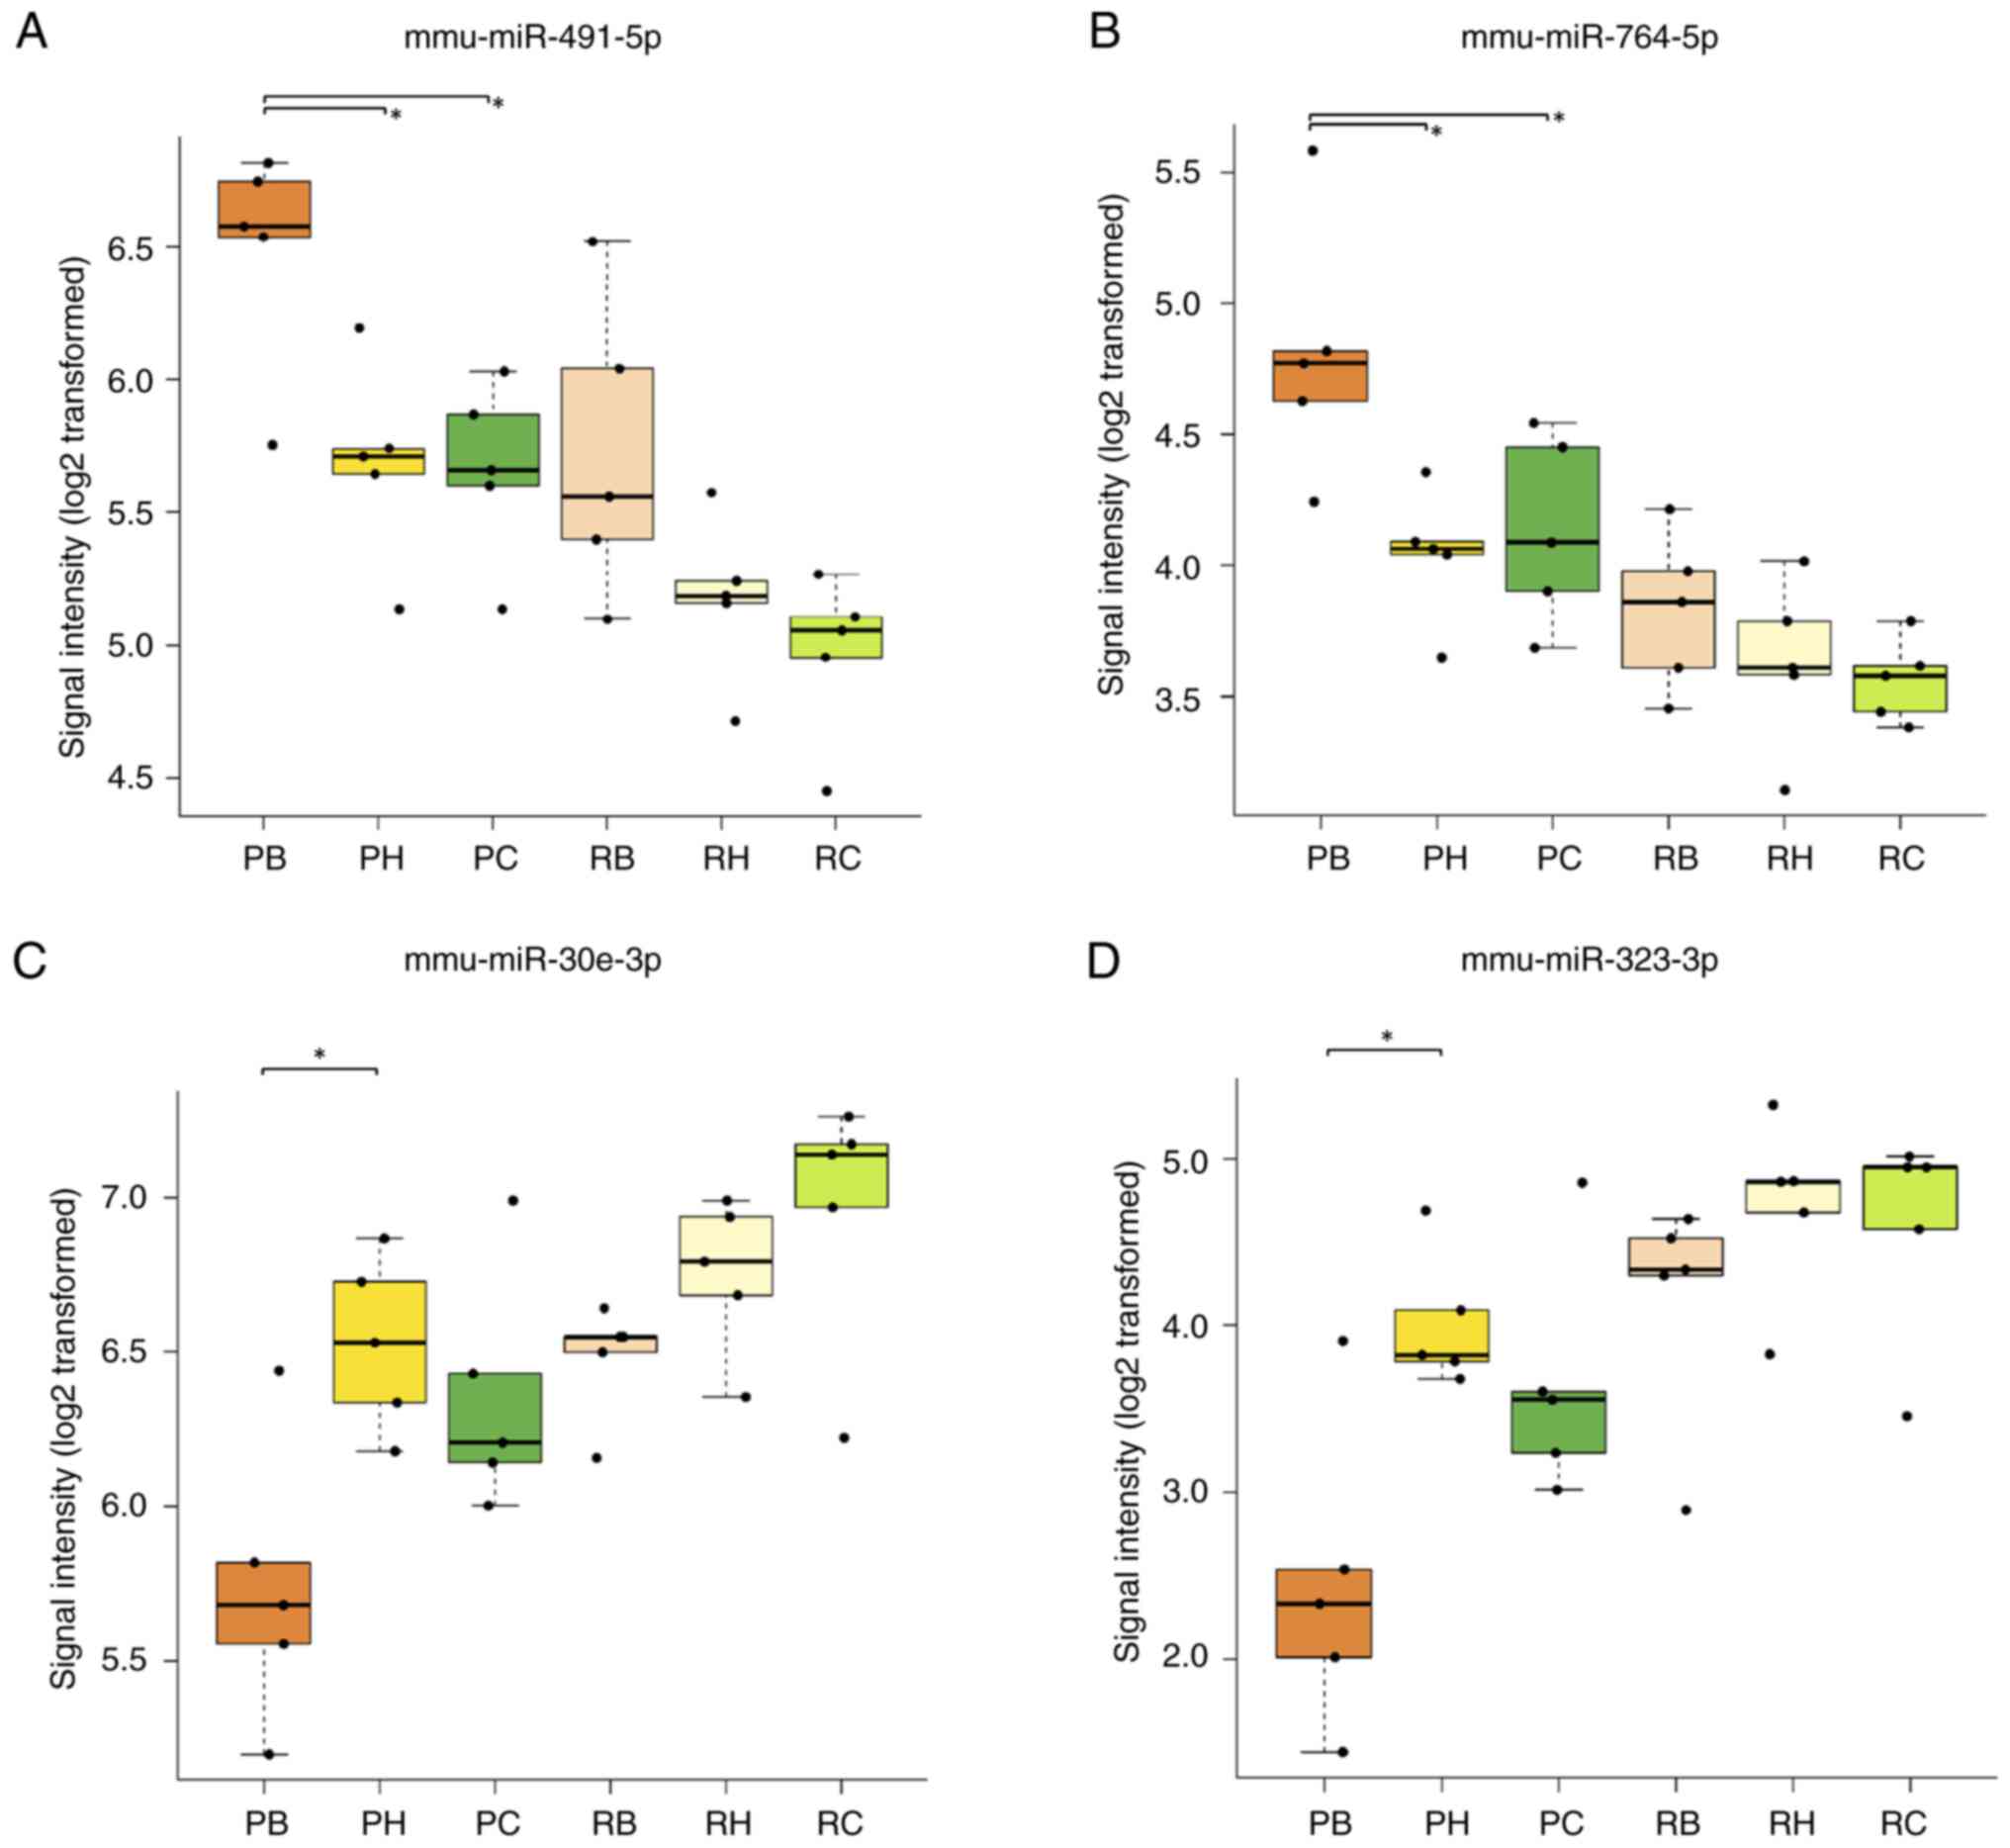
In SAMP8 mice, the mmu-miR-491-5p signal intensity
was significantly higher in the brainstem (6.49±0.42) compared with
that in the hippocampus (5.69±0.38) (P=0.040) or cerebral cortex
(5.66±0.34) (P=0.031) (Fig. 7A,
Table II). Similarly, the
mmu-miR-764-5p signal intensity was significantly higher in the
brainstem (4.81±0.49) compared with that in the hippocampus
(4.04±0.25) (P=0.013) or cerebral cortex (4.13±0.36) (P=0.036) of
SAMP8 mice (Fig. 7B, Table II). However, there was no
significant difference in the signal intensities of mmu-miR-764-5p
in the brainstem (3.82±0.30) compared with that in the hippocampus
(3.63±0.32) (P=0.932) or cortex (3.56±0.16) (P=0.805) of SAMR1 mice
(Fig. 7B, Table II). Additionally, there was no
significant difference in signal intensities of mmu-miR-491-5p in
SAMR1 mice in the brainstem (5.72±0.56) compared with that in the
cortex (4.97±0.31) (P=0.058) and the hippocampus (5.18±0.31)
(P=0.279) (Fig. 7A, Table II).
| Table II.Signal intensity of four SAMP8
brainstem specifically regulated miRNAs among the three brain
regions of interest as investigated by custom microarray platform
analysis. |
Table II.
Signal intensity of four SAMP8
brainstem specifically regulated miRNAs among the three brain
regions of interest as investigated by custom microarray platform
analysis.
| mmu-miR | SAMP8
brainstem | SAMP8
hippocampus | SAMP8 cortex | SAMR1
brainstem | SAMR1
hippocampus | SAMR1 cortex | P-value for brain
region comparisona | P-value for mouse
type comparisona |
P-valueb
(SAMP8 brainstem vs. SAMP8 hippocampus) |
P-valueb
(SAMP8 brainstem vs. SAMP8 cortex) |
|---|
| 491-5p | 6.49±0.42 | 5.69±0.38 | 5.66±0.34 | 5.72±0.56 | 5.18±0.31 | 4.97±0.31 | 0.000291 | 0.000135 | 0.040 | 0.031 |
| 764-5p | 4.81±0.49 | 4.04±0.25 | 4.13±0.36 | 3.82±0.30 | 3.63±0.32 | 3.56±0.16 | 0.000419 | 0.000131 | 0.013 | 0.036 |
| 30e-3p | 5.74±0.45 | 6.53±0.28 | 6.35±0.39 | 6.45±0.19 | 6.75±0.25 | 6.95±0.42 | 0.00199 | 0.000368 | 0.015 | 0.866 |
| 323-3p | 2.44±0.92 | 4.01±0.41 | 3.65±0.71 | 4.14±0.71 | 4.71±0.55 | 4.59±0.66 | 0.00436 | 0.000154 | 0.014 | 0.088 |
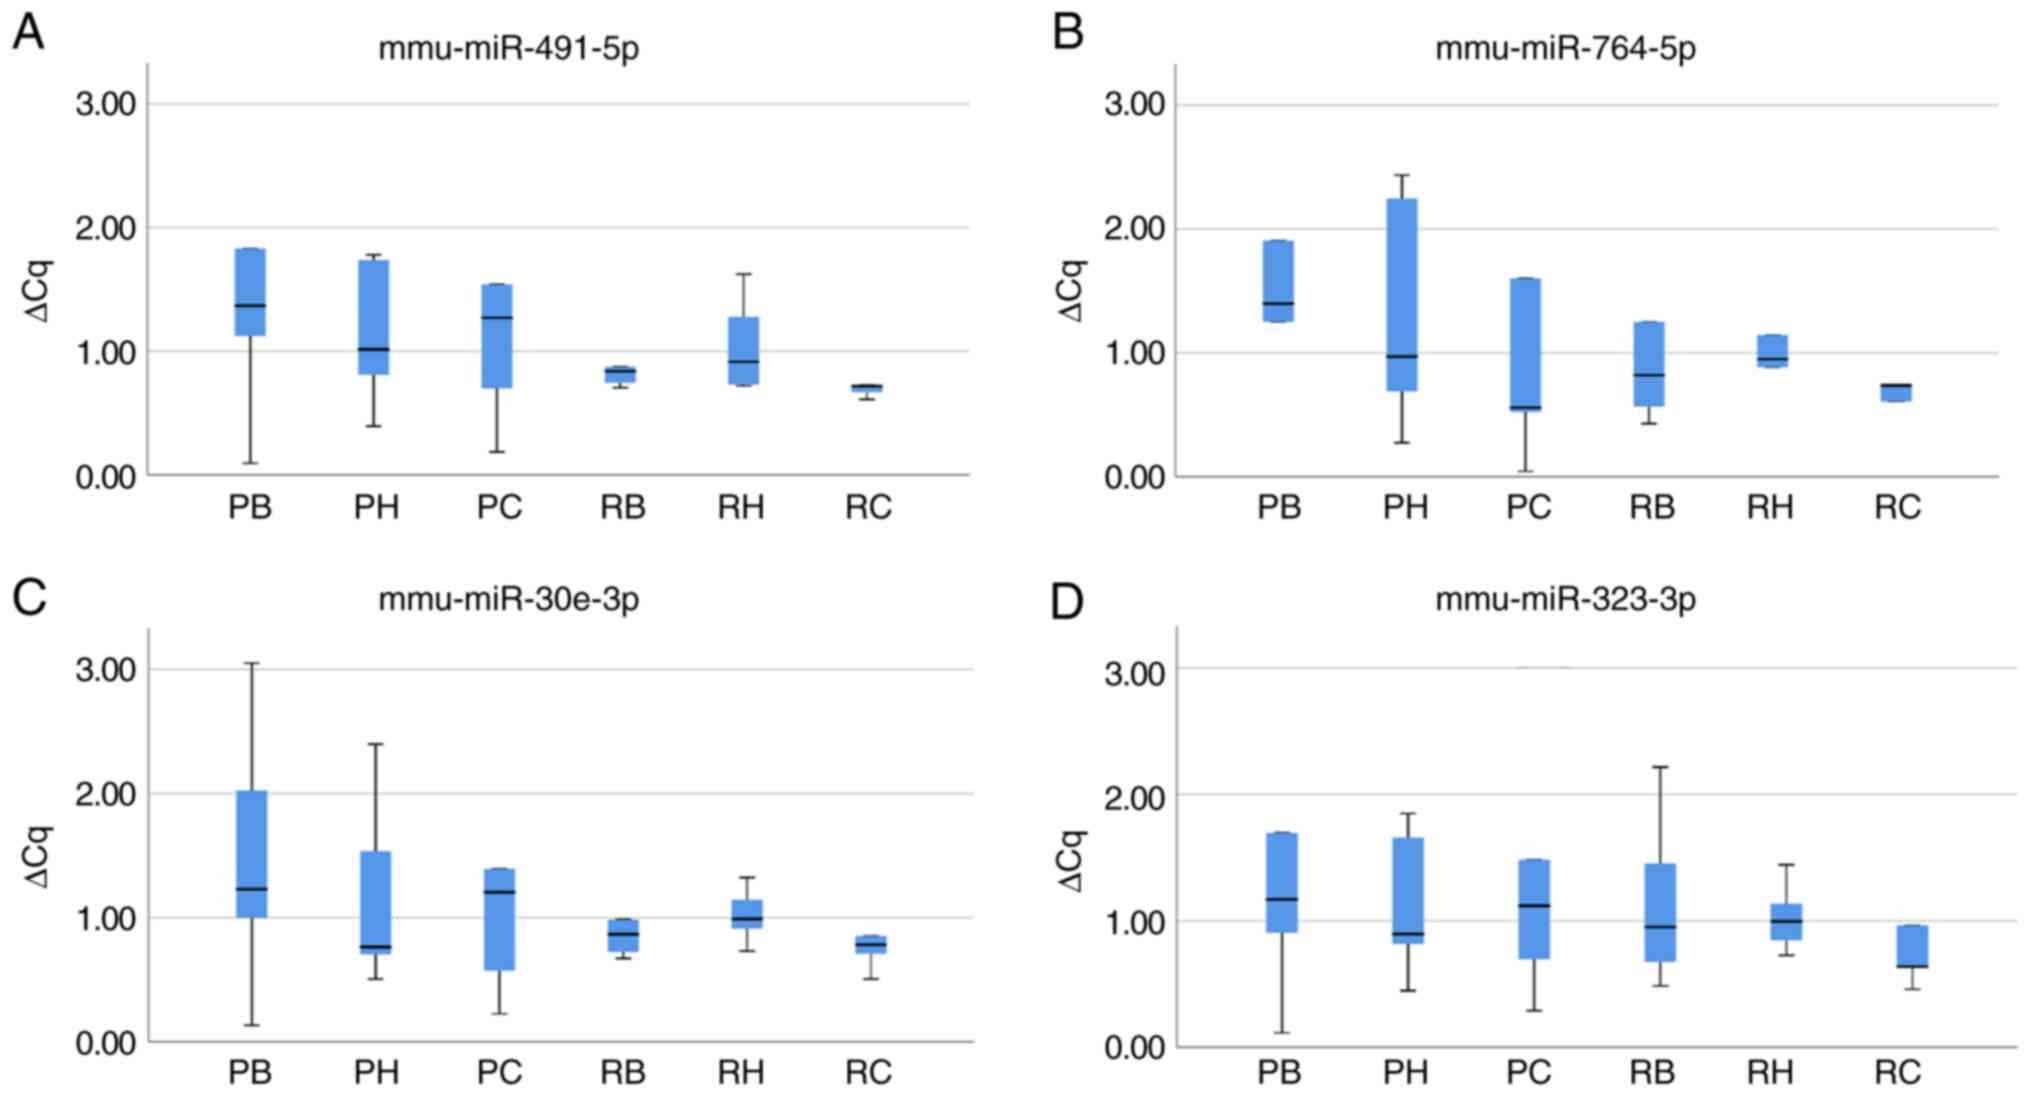
The expression of mmu-miR-491-5p and mmu-miR-764-5p
was determined using RT-qPCR to validate the miRNA array data
(Table III). In SAMP8 mice, the
mean ΔCq ± standard deviation for mmu-miR-491-5p was 1.64±1.35 in
the brainstem, 1.15±0.60 in the hippocampus and 1.53±1.45 in the
cerebral cortex, while the mean ΔCq ± standard deviation for
mmu-miR-764-5p was 2.10±2.23 in the brainstem, 1.32±0.96 in the
hippocampus and 10.51±21.98 in the cerebral cortex (Fig. 8A and B, Table III). In SAMR1 mice, the values
for mmu-miR-491-5p were 1.15±0.81, 1.05±0.39 and 1.48±1.80
(Fig. 8A, Table III) and those for mmu-miR-764-5p
were 1.42±1.49, 1.19±0.83 and 2.17±3.49 in the brainstem,
hippocampus and cerebral cortex, respectively (Fig. 8B, Table III). Overall, there were no
significant differences in the miRNA expression levels, determined
using RT-qPCR, between brain regions of SAMP8 and SAMR1 mice.
| Table III.Expression levels of four SAMP8
brainstem specifically regulated miRNAs determined using RT-qPCR in
expression among the three brain regions of interest compared with
SAMR1 mice. |
Table III.
Expression levels of four SAMP8
brainstem specifically regulated miRNAs determined using RT-qPCR in
expression among the three brain regions of interest compared with
SAMR1 mice.
| mmu-miR | SAMP8
brainstem | SAMP8
hippocampus | SAMP8 cortex | SAMR1
brainstem | SAMR1
hippocampus | SAMR1 cortex | P-value for brain
region comparisona | P-value for mouse
type comparisona |
|---|
| 491-5p | 1.64±1.35 | 1.15±0.60 | 1.53±1.45 | 1.15±0.81 | 1.05±0.39 | 1.48±1.80 | 0.998 | 0.678 |
| 764-5p | 2.10±2.23 | 1.32±0.96 | 10.51±21.98 | 1.42±1.49 | 1.19±0.83 | 2.17±3.49 | 0.496 | 0.472 |
| 30e-3p | 1.49±1.10 | 1.18±0.79 | 1.60±1.75 | 1.13±0.73 | 1.02±0.23 | 1.41±1.56 | 0.975 | 0.860 |
| 323-3p | 1.76±1.86 | 1.13±0.59 | 1.32±1.05 | 1.16±0.70 | 1.03±0.28 | 1.66±2.22 | 0.953 | 0.453 |
Quantifications of mmu-miR-30e-3p and
mmu-miR-323-3p
In SAMP8 mice, the mmu-miR-30e-3p signal intensity
was significantly lower in the brainstem (5.74±0.45) compared with
the hippocampus (6.53±0.28) (P=0.015); however, there was no
significant difference in the signal intensities of mmu-miR-30e-3p
in SAMP8 mice between the brainstem and the cerebral cortex
(6.35±0.39) (P=0.866) (Fig. 7C,
Table II). Similarly, the
mmu-miR-323-3p signal intensity in SAMP8 mice was significantly
lower in the brainstem (2.44±0.92) compared with that in the
hippocampus (4.01±0.41) (P=0.014). Additionally, there was no
significant difference in signal intensities of mmu-miR-323-3p in
the brainstem and the cerebral cortex (3.65±0.71, P=0.088) in SAMP8
mice (Fig. 7D, Table II). In SAMR1 mice, there were no
significant differences in the signal intensities of either miRNA
among the brain regions. These values were 6.45±0.19 in the
brainstem, 6.75±0.25 in the hippocampus (P=0.806) and 6.95±0.42 in
the cortex (P=0.284) for mmu-miR-30e-3p (Fig. 7C, Table II) and 4.14±0.71 in the brainstem,
4.71±0.55 in the hippocampus (P=0.761) and 4.59±0.66 in the cortex
(P=0.894) for mmu-miR-323-3p (Fig.
7D, Table II).
The mean ΔCq ± standard deviation, based on RT-qPCR
analysis, of mmu-miR-30e-3p in SAMP8 mice was 1.49±1.10, 1.18±0.79,
1.60±1.75 and that in SAMR1 mice was 1.13±0.73, 1.02±0.23 and
1.41±1.56 in the brainstem, hippocampus and cerebral cortex,
respectively (Fig. 8C and Table III). Similarly, for
mmu-miR-323-3p, the values in SAMP8 were 1.76±1.86, 1.13±0.59 and
1.32±1.05 and those in SAMR1 were 1.16±0.70, 1.03±0.28 and
1.66±2.22 in the brainstem, hippocampus and cerebral cortex,
respectively (Fig. 8D and Table III). Overall, there were no
significant differences in the miRNA expression levels, determined
using RT-qPCR, among the brain regions of SAMP8 and SAMR1 mice.
miRNA target gene bioinformatics
analysis
The target genes of differentially expressed miRNAs
were predicted using three databases (miRDB, Targetscan and
miRTarBase) and the overlapping genes in two or three databases
were identified to enhance the reliability of the analysis. There
were 5 target genes for mmu-miR-491-5p, 15 for mmu-miR-764-5p, 9
for mmu-miR-30e-3p and 7 for mmu-miR-323-3p. A Sankey diagram was
used to examine whether there were any common target genes for each
miRNA, but none were found (Fig.
9).
Discussion
Previous studies have reported that certain miRNAs
are downregulated in the cerebral cortex and hippocampus of SAMP8
mice compared with SAMR1 mice, which indicates that these miRNAs
may be involved in regulating genes associated with age-related
brain changes (16). In the
present study, two upregulated miRNAs (mmu-miR-491-5p and
mmu-miR-764-5p) and two downregulated miRNAs (mmu-miR-323-3p and
mmu-miR-30e-3p) were identified using 5-month-old SAMP8 mice, which
displayed significant differential expression in the brainstem
compared with the hippocampus and cerebral cortex. Age-related
histopathological degeneration in the human brain occurs first in
the brainstem and subsequently spreads to the hippocampus and
cerebral cortex (8). Therefore,
the observed changes in miRNA expression levels could trigger
age-related brain degeneration. Herein, the cognitive deficits and
brain pathological changes in the 5-month-old SAMP8 mice and the
implications of the differentially expressed miRNAs are
discussed.
In the Y-maze test, spontaneous alternation
indicated short-term memory loss and spatial working memory
impairment, which are classified as hippocampus-dependent memories
(17). There were no significant
differences in the alternation behavior rate between 5-month-old
SAMP8 and SAMR1 mice and spatial working memory was preserved in
SAMP8 mice. SAMP8 mice aged 6–8 months have been reported to
demonstrate significant cognitive impairment compared with
age-matched control SAMR1 mice (18,19).
The data reported in the present study are consistent with these
previous reports. The locomotive activity counts were significantly
higher in SAMP8 mice compared with SAMR1 mice. One-month-old SAMP8
mice were reported to be more hyperactive than age-matched SAMR1
mice in a previous study (20).
The results of the present study confirm that 5-month-old SAMP8
mice are hyperactive and are in a preliminary stage of spatial
working memory impairment.
Spongiform degeneration and vacuoles were observed
solely in the brainstem and astrocytes were found in the reticular
formation of SAMP8 mice, whereas no pathological changes were
reported in the hippocampus or cerebral cortex of SAMP8 mice or the
brain of SAMR1 mice. The results of the present study were
consistent with those of previous studies (11–13).
In SAMP8 mice, spongiform degeneration in the brainstem reportedly
begins at 1 month of age and reaches the maximum extent at 4–8
months of age (14). Moreover,
vacuolization appears at 1 month of age in the brainstem reticular
formation and the vacuoles increase in both size and number up to 8
months of age in SAMP8 mice (13).
In humans, pathological changes in neurodegenerative diseases, such
as AD and PD, occur in the brainstem during the early stages of
disease and progress ascendingly to the other brain areas over time
(9,21). In the present study, 5-month-old
SAMP8 mice demonstrated age-related pathological changes
exclusively in the brainstem, which suggested that the changes
observed in 5-month-old SAMP8 mice correspond to the early stage of
Braak staging in humans (8,21).
Although miRNA expression levels in each brain
region have not been evaluated previously, increased expression of
miR-491 has been reported in the whole brain of amyloid precursor
protein (APP) and presenilin 1 double-transgenic mice at both 3 and
6 months of age (22). miR-491
serves an important role in various cancers, such as non-small cell
lung cancer (23), osteosarcoma
(24) and glioma (25), however only a single report
describes its association with neurodegenerative diseases (22). In SAMP8 mice, the signal
intensities of miR-491-5p were significantly different between the
brainstem and other brain regions. This could indicate that changes
in the levels of miR-491-5p expression precede changes in cognitive
function. In the present study, miR-491-5p was upregulated in the
brainstem of SAMP8 mice, wherein age-related degeneration occurs
early.
Overexpression of miR-764 suppresses the expression
of ninjurin 2 (NINJ2), an adhesion molecule expressed on neurons
and glial cells that promotes the survival of human neurons and
induces a significant decrease in neuronal survival and apoptosis
(26). Thus, miR-764 acts as a
promoter of neuronal growth by modulating NINJ2 expression
(26,27). miR-764-5p was upregulated in the
brainstems of SAMP8 mice, which indicated that neuronal apoptosis
was induced in the brainstem and, consequently, age-related
degeneration is likely to first occur in the brainstem.
Although miR-30e-3p and miR-323-3p were selected as
specifically downregulated miRNAs by selection using the Venn
diagram, post hoc tests of the signal values of each miRNA failed
to detect significant differences between the brainstem and
hippocampus of SAMP8. In the selection process using Venn diagrams,
miRNAs that showed differences in signal intensities in the SAMP8
brainstem and hippocampus (P<0.05 and FC<1.5−1)
were included in the dataset. However, although Tukey's post-hoc
test was performed on the signal intensities in all 6 groups of
each brain region of SAMP8 and SAMR1, no significant differences
were detected among the signal intensities of the brainstem and
hippocampus in SAMP8. Instead, the signal intensity of specifically
downregulated miRNAs tended to be the smallest in the brainstem
compared with that in other brain regions of SAMP8 mice. More
stringent selection criteria of specifically regulated miRNA
candidates could make it difficult to detect miRNAs that may
trigger early brain degeneration.
Analysis of the temporal lobe of the postmortem
brains of patients with AD has previously demonstrated that
miR-30e-3p activity is downregulated compared with that in the
brains of patients without AD (28). In the present study, the expression
of miR-30e-3p was specifically downregulated in the brainstem of
SAMP8 mice. Moreover, target prediction indicated that miR-30e-3p
downregulation may activate phosphatase and tensin homolog (PTEN)
function, which may induce apoptosis in the central nervous system
(29,30). Therefore, it could be inferred that
apoptosis may be more likely occur in the brainstem.
miR-323-3p has been reported to reduce APP
expression in vitro and under intracellular physiological
conditions (31). The accumulation
of APP leads to the overproduction, accumulation and deposition of
amyloid-β, which ultimately leads to neuronal death
(32). Moreover, miR-323-3p binds
to transforming growth factor-β2 (TGF-β2) and
suppresses the TGF-β2/c-Jun N-terminal kinase signaling
pathway, thereby inhibiting cell apoptosis (33). In the present study, miR-323-3p was
specifically downregulated in the brainstem of SAMP8 mice, which
further indicates that apoptosis may occur in the brainstem and
that APP expression is likely to occur in the brainstem, which
leads to amyloidogenesis.
In the present study, the signal intensities of
miR-30e-3p and miR-323-3p in the hippocampus of SAMP8 mice were
generally higher than those in the cortex, which indicated that the
signal intensity did not change according to Braak staging
(8,21). The upregulation of miR-323-3p in
the hippocampus compared with its expression in the cortex of SAMP8
mice may have been affected by the vulnerability of the hippocampus
to various stressors (34).
TGF-β2, regulated by miR-323-3p, suppresses the activation
of neuronal-glial antigen 2 (NG2) glial cells as well as central
nervous system progenitor cells and prevents inflammatory responses
in the brain via TGF-β2-TGFBR2 signaling (35). NG2 glial cells are predicted to be
involved in hippocampal vulnerability because NG2 glial cell
ablation induces hippocampal neuronal cell death in rat models
(36). Thus, the data presented in
the present study suggests that neuroinflammation may be more
likely to occur in the hippocampus and may, therefore, provide
molecular evidence of the vulnerability of the hippocampus to
age-related neurodegeneration.
The target genes of differentially expressed miRNAs
were predicted using three databases (miRDB, Targetscan and
miRTarBase) and the overlapping genes in two or more databases were
identified to enhance the reliability of the analysis. PTEN, NINJ2
and TGF-β2 were not included as they were listed in
individual databases but were not duplicated. Although the
relationship between the identified miRNAs and the target genes
(PTEN, NINJ2 and TGF-β2) involved in age-related brain
changes had been previously reported (37–39),
the present study provides evidence that such miRNAs may be related
to target genes involved in age-related brain changes.
Specifically upregulated or downregulated miRNAs in
the brainstem of SAMP8 mice were identified but no significant
difference was noted in the expression levels of these miRNAs in
the assessed brain regions, as determined using RT-qPCR. The
progression of degeneration in 5-month-old SAMP8 mice was mild,
therefore, it may be difficult to detect the difference in the
expression levels of these miRNAs in the brain regions analyzed.
Although it may be possible to detect significant differences in
the expression levels of these miRNAs in older SAMP8 mice,
identifying specific upregulated or downregulated miRNAs in the
brainstem may be difficult owing to the progression of
neurodegeneration. Furthermore, it is possible that there may be no
noteworthy differences in the identified miRNAs using RT-qPCR.
Nevertheless, the expression levels of these miRNAs were distinct
across various brain regions, as demonstrated by the microarray
analysis conducted in this study. These findings could serve as a
foundational dataset for future SAM experimental studies.
Specifically upregulated miRNAs (mmu-miR-491-5p and
mmu-miR-764-5p) or downregulated miRNAs (mmu-miR-323-3p and
mmu-miR-30e-3p) were identified in the brainstems of early
postnatal SAMP8 mice. Furthermore, the mechanism by which miRNAs
may regulate target proteins in the early stage of pathological
degeneration in the brainstem to induce age-related
neurodegenerative changes was investigated, thereby adding a new
perspective to our understanding of neurodegenerative disease
progression. Additionally, these miRNA changes may provide
molecular evidence for the development of age-related pathological
changes in the brain, as shown by Braak staging (8,21).
Finally, the present study is the first to show that four specific
miRNAs (mmu-miR-491-5p, mmu-miR-764-5p, mmu-miR-323-3p and
mmu-miR-30e-3p) were differentially expressed in the hippocampus
and cortex in a stepwise manner. Furthermore, it was demonstrated
that the expression levels of the same four miRNAs in the brainstem
were specifically different compared with those in the hippocampus
and cortex of SAMP8 mice, and the order of these miRNA expression
levels tended to correspond with the progression order of
age-related brain degeneration. Validation of these results in
SAMP8 mice may reveal specific differences in miRNA expression
levels in each brain region. To conclude, the present study has
provided potential novel targets for future treatment options to
delay the onset or progression of neurodegenerative diseases.
One potential limitation of the present study is
the exclusive use of SAMP8 mice at 5 months old, when behavioral
impairment is mild. It is plausible that utilizing SAMP8 mice of a
more advanced aged could reveal distinct results. To achieve a
comprehensive understanding of the miRNA changes associated with
brain degeneration, further investigation is warranted in the
future.
Acknowledgements
The authors would like to thank Mrs. Kayo Hirose,
Mrs. Keiko Fujikawa, Mrs. Fuyuko Kokado and Mrs. Megumi Okamura
(Kagawa University, Kagawa, Japan) for providing technical
assistance with the experiments. The authors would also like to
thank Mrs. Kayo Hosoi (Shikoku Cytopathological Laboratory, Kagawa,
Japan) for preparing the pathological specimens.
Funding
This work was supported by JSPS KAKENHI (grant no.
22K17828).
Availability of data and materials
The datasets used/and or generated during the
current study are available from the corresponding author upon
reasonable request.
Authors' contributions
RK, TT, HI, TI, KD and TM conceptualized the study.
RK, TT, WN and YH performed the experiments. RK, TT, HI, WN, YH and
TI performed the formal analysis. RK, TT and HI developed the
methodology. TI and TM were involved in project administration. KD
and TM provided materials and funds for the study. HK, KD, OM and
TM supervised the study. RK, TT, WN, YH, HK, KD, OM, TN and TI were
involved in data validation. RK, TT and HI were involved in data
visualization. RK and TT wrote the manuscript. TT, HI, HK, KD, OM,
TN, TI and TM reviewed and edited the manuscript. All authors read
and approved the final version of the manuscript. TT and TI confirm
the authenticity of all the raw data.
Ethics approval and consent to
participate
The present study was approved by the Animal
Committee of the Kagawa University School of Medicine (approval
number: 20626-2).
Patient consent for publication
Not applicable.
Competing interests
The authors declare that they have no competing
interests.
Glossary
Abbreviations
Abbreviations:
|
miRNA
|
microRNA
|
|
AD
|
Alzheimer's disease
|
|
PD
|
Parkinson's disease
|
|
SAMP8
|
senescence-accelerated mouse prone
8
|
|
SAMR1
|
senescence-accelerated mouse
resistant 1
|
|
H&E
|
hematoxylin and eosin
|
|
SSC
|
saline-sodium citrate
|
|
FC
|
fold change
|
|
GFAP
|
glial fibrillary acidic protein
|
|
RT-qPCR
|
reverse transcription-quantitative
polymerase chain reaction
|
|
mmu
|
Mus musculus
|
|
APP
|
amyloid precursor protein
|
|
PTEN
|
phosphatase and tensin homolog
|
|
TGF
|
transforming growth factor
|
|
NG2
|
neuronal-glial antigen 2
|
|
NINJ2
|
ninjurin 2
|
References
|
1
|
Bartel DP: MicroRNAs: Target recognition
and regulatory functions. Cell. 136:215–233. 2009. View Article : Google Scholar : PubMed/NCBI
|
|
2
|
Reddy PH, Williams J, Smith F, Bhatti JS,
Kumar S, Vijayan M, Kandimalla R, Kuruva CS, Wang R, Manczak M, et
al: MicroRNAs, aging, cellular senescence, and Alzheimer's disease.
Prog Mol Biol Transl Sci. 146:127–171. 2017. View Article : Google Scholar : PubMed/NCBI
|
|
3
|
Salta E and De Strooper B: Non-coding RNAs
with essential roles in neurodegenerative disorders. Lancet Neurol.
11:189–200. 2012. View Article : Google Scholar : PubMed/NCBI
|
|
4
|
Kume K, Iwama H, Deguchi K, Ikeda K,
Takata T, Kokudo Y, Kamada M, Fujikawa K, Hirose K, Masugata H, et
al: Serum microRNA expression profiling in patients with multiple
system atrophy. Mol Med Rep. 17:852–860. 2018.PubMed/NCBI
|
|
5
|
Nonaka W, Takata T, Iwama H, Komatsubara
S, Kobara H, Kamada M, Deguchi K, Touge T, Miyamoto O, Nakamura T,
et al: A cerebrospinal fluid microRNA analysis: Progressive
supranuclear palsy. Mol Med Rep. 25:1–9. 2022. View Article : Google Scholar
|
|
6
|
Lees AJ, Hardy J and Revesz T: Parkinson's
disease. Lancet. 373:2055–2066. 2009. View Article : Google Scholar : PubMed/NCBI
|
|
7
|
Braak H and Del Tredici K: The
pathological process underlying Alzheimer's disease in individuals
under thirty. Acta Neuropathol. 121:171–181. 2011. View Article : Google Scholar : PubMed/NCBI
|
|
8
|
Braak H and Del Tredici K: The preclinical
phase of the pathological process underlying sporadic Alzheimer's
disease. Brain. 138:2814–2833. 2015. View Article : Google Scholar : PubMed/NCBI
|
|
9
|
Braak H, Del Tredici K, Rüb U, de Vos RAI,
Jansen Steur ENH and Braak E: Staging of brain pathology related to
sporadic Parkinson's disease. Neurobiol Aging. 24:197–211. 2003.
View Article : Google Scholar : PubMed/NCBI
|
|
10
|
Cheng XR, Zhou WX and Zhang YX: The
behavioral, pathological and therapeutic features of the
senescence-accelerated mouse prone 8 strain as an Alzheimer's
disease animal model. Ageing Res Rev. 13:13–37. 2014. View Article : Google Scholar : PubMed/NCBI
|
|
11
|
Kawamata T, Akiguchi I, Yagi H, Irino M,
Sugiyama H, Akiyama H, Shimada A, Takemura M, Ueno M, Kitabayashi
T, et al: Neuropathological studies on strains of
senescence-accelerated mice (SAM) with age-related deficits in
learning and memory. Exp Gerontol. 32:161–169. 1997. View Article : Google Scholar : PubMed/NCBI
|
|
12
|
Kawamata T, Akiguchi I, Maeda K, Tanaka C,
Higuchi K, Hosokawa M and Takeda T: Age-related changes in the
brains of senescence-accelerated mice (SAM): Association with glial
and endothelial reactions. Microsc Res Tech. 43:59–67. 1998.
View Article : Google Scholar : PubMed/NCBI
|
|
13
|
Yagi H, Akiguchi I, Ohta A, Yagi N,
Hosokawa M and Takeda T: Spontaneous and artificial lesions of
magnocellular reticular formation of brainstem deteriorate
avoidance learning in senescence-accelerated mouse SAM. Brain Res.
791:90–98. 1998. View Article : Google Scholar : PubMed/NCBI
|
|
14
|
Yagi H, Irino M, Matsushita T, Katoh S,
Umezawa M, Tsuboyama T, Hosokawa M, Akiguchi I, Tokunaga R and
Takeda T: Spontaneous spongy degeneration of the brain stem in
SAM-P/8 mice, a newly developed memory-deficient strain. J
Neuropathol Exp Neurol. 48:577–590. 1989. View Article : Google Scholar : PubMed/NCBI
|
|
15
|
Livak KJ and Schmittgen TD: Analysis of
relative gene expression data using real-time quantitative PCR and
the 2(−Delta Delta C(T)) method. Methods. 25:402–408. 2001.
View Article : Google Scholar : PubMed/NCBI
|
|
16
|
Tan YX, Hong Y, Jiang S, Lu MN, Li S,
Chein B, Zhang L, Hu T, Mao R, Mei R and Xiyang YB: MicroRNA-449a
regulates the progression of brain aging by targeting SCN2B in
SAMP8 mice. Int J Mol Med. 45:1091–1102. 2020.PubMed/NCBI
|
|
17
|
Huang SM, Mouri A, Kokubo H, Nakajima R,
Suemoto T, Higuchi M, Staufenbiel M, Noda Y, Yamaguchi H, Nabeshima
T, et al: Neprilysin-sensitive synapse-associated amyloid-β peptide
oligomers impair neuronal plasticity and cognitive function. J Biol
Chem. 281:17941–17951. 2006. View Article : Google Scholar : PubMed/NCBI
|
|
18
|
del Valle J, Bayod S, Camins A,
Beas-Zárate C, Velázquez-Zamora DA, González-Burgos I and Pallàs M:
Dendritic spine abnormalities in hippocampal CA1 pyramidal neurons
underlying memory deficits in the SAMP8 mouse model of Alzheimer's
disease. J Alzheimers Dis. 32:233–240. 2012. View Article : Google Scholar : PubMed/NCBI
|
|
19
|
Miyamoto M: Characteristics of age-related
behavioral changes in senescence-accelerated mouse SAMP8 and
SAMP10. Exp Gerontol. 32:139–148. 1997. View Article : Google Scholar : PubMed/NCBI
|
|
20
|
Markowska AL, Spangler EL and Ingram DK:
Behavioral assessment of the senescence-accelerated mouse (SAM P8
and R1). Physiol Behav. 64:15–26. 1998. View Article : Google Scholar : PubMed/NCBI
|
|
21
|
Braak H and Braak E: Neuropathological
stageing of Alzheimer-related changes. Acta Neuropathol.
82:239–259. 1991. View Article : Google Scholar : PubMed/NCBI
|
|
22
|
Wang LL, Min L, Guo QD, Zhang JX, Jiang
HL, Shao S, Xing JG, Yin LL, Liu JH, Liu R, et al: Profiling
microRNA from brain by microarray in a transgenic mouse model of
Alzheimer's disease. BioMed Res Int. 2017:80303692017.PubMed/NCBI
|
|
23
|
Gong F, Ren P, Zhang Y, Jiang J and Zhang
H: MicroRNAs-491-5p suppresses cell proliferation and invasion by
inhibiting IGF2BP1 in non-small cell lung cancer. Am J Transl Res.
8:485–495. 2016.PubMed/NCBI
|
|
24
|
Wang SN, Luo S, Liu C, Piao Z, Gou W, Wang
Y, Guan W, Li Q, Zou H, Yang ZZ, et al: miR-491 inhibits
osteosarcoma lung metastasis and chemoresistance by targeting
αB-crystallin. Mol Ther. 25:2140–2149. 2017. View Article : Google Scholar : PubMed/NCBI
|
|
25
|
Meng Y, Shang FR and Zhu YL: MiR-491
functions as a tumor suppressor through Wnt3a/β-catenin signaling
in the development of glioma. Eur Rev Med Pharmacol Sci.
23:10899–10907. 2019.PubMed/NCBI
|
|
26
|
Jing D, Yinzhu L, Jinjing P, Lishuang L
and Guozhuan Z: Targeting ninjurin 2 by miR-764 regulates hydrogen
peroxide (H2O2)-induced neuronal cell death. Biochem Biophys Res
Commun. 505:1180–1188. 2018. View Article : Google Scholar : PubMed/NCBI
|
|
27
|
Araki T and Milbrandt J: Ninjurin2, a
novel homophilic adhesion molecule, is expressed in mature sensory
and enteric neurons and promotes neurite outgrowth. J Neurosci.
20:187–195. 2000. View Article : Google Scholar : PubMed/NCBI
|
|
28
|
Henriques AD, Machado-Silva W, Leite REP,
Suemoto CK, Leite KRM, Srougi M, Pereira AC, Jacob-Filho W and
Nóbrega OT; Brazilian Aging Brain Study Group, : Genome-wide
profiling and predicted significance of post-mortem brain microRNA
in Alzheimer's disease. Mech Ageing Dev. 191:1113522020. View Article : Google Scholar : PubMed/NCBI
|
|
29
|
Chow LML and Baker SJ: PTEN function in
normal and neoplastic growth. Cancer Lett. 241:184–196. 2006.
View Article : Google Scholar : PubMed/NCBI
|
|
30
|
Shabanzadeh AP, D'Onofrio PM, Magharious
M, Choi KAB, Monnier PP and Koeberle PD: Modifying PTEN recruitment
promotes neuron survival, regeneration, and functional recovery
after CNS injury. Cell Death Dis. 10:5672019. View Article : Google Scholar : PubMed/NCBI
|
|
31
|
Delay C, Calon F, Mathews P and Hébert SS:
Alzheimer-specific variants in the 3′UTR of Amyloid precursor
protein affect microRNA function. Mol Neurodegener. 6:702011.
View Article : Google Scholar : PubMed/NCBI
|
|
32
|
De Strooper B: Proteases and proteolysis
in Alzheimer disease: A multifactorial view on the disease process.
Physiol Rev. 90:465–494. 2010. View Article : Google Scholar : PubMed/NCBI
|
|
33
|
Shi CC, Pan LY, Zhao YQ, Li Q and Li JG:
MicroRNA-323-3p inhibits oxidative stress and apoptosis after
myocardial infarction by targeting TGF-β2/JNK pathway. Eur Rev Med
Pharmacol Sci. 24:6961–6970. 2020.PubMed/NCBI
|
|
34
|
Bartsch T and Wulff P: The hippocampus in
aging and disease: From plasticity to vulnerability. Neuroscience.
309:1–16. 2015. View Article : Google Scholar : PubMed/NCBI
|
|
35
|
Zhang SZ, Wang QQ, Yang QQ, Gu HY, Yin YQ,
Li YD, Hou JC, Chen R, Sun QQ, Sun YF, et al: NG2 glia regulate
brain innate immunity via TGF-β2/TGFBR2 axis. BMC Med. 17:2042019.
View Article : Google Scholar : PubMed/NCBI
|
|
36
|
Nakano M, Tamura Y, Yamato M, Kume S,
Eguchi A, Takata K, Watanabe Y and Kataoka Y: NG2 glial cells
regulate neuroimmunological responses to maintain neuronal function
and survival. Sci Rep. 7:420412017. View Article : Google Scholar : PubMed/NCBI
|
|
37
|
Knafo S, Sánchez-Puelles C, Palomer E,
Delgado I, Draffin JE, Mingo J, Wahle T, Kaleka K, Mou L,
Pereda-Perez I, et al: PTEN recruitment controls synaptic and
cognitive function in Alzheimer's models. Nat Neurosci. 19:443–453.
2016. View Article : Google Scholar : PubMed/NCBI
|
|
38
|
Lin KP, Chen SY, Lai LC, Huang YL, Chen
JH, Chen TF, Sun Y, Wen LL, Yip PK, Chu YM, et al: Genetic
polymorphisms of a novel vascular susceptibility gene, Ninjurin2
(NINJ2), are associated with a decreased risk of Alzheimer's
disease. PLoS One. 6:e205732011. View Article : Google Scholar : PubMed/NCBI
|
|
39
|
Peress NS and Perillo E: Differential
expression of TGF-β 1, 2 and 3 isotypes in Alzheimer's disease: A
comparative immunohistochemical study with cerebral infarction,
aged human and mouse control brains. J Neuropathol Exp Neurol.
54:802–811. 1995. View Article : Google Scholar : PubMed/NCBI
|