Introduction
Alzheimer's disease (AD) is a neurodegenerative
disease that often develops in individuals over the age of 65
(1,2). AD is closely associated with
progressive brain atrophy, which causes progressive memory loss
(3). Some of the recognized
characteristics of the pathological attention deficit disorder
include the deposition of beta-amyloid (Aβ) and tangles of
neuro-progenitor fibers, which result from the phosphorylation of
tau protein (4). A number of
studies have demonstrated an inextricable link between ferroptosis
due to neuroinflammation and AD. Aβ has been demonstrated to
promote the release of cytokines from microglia, in addition to
driving the aggregation of microglia and inflammatory factors in
areas where Aβ deposition occurs (5,6).
Under neuroinflammatory conditions, microglia can increase the
production of reactive oxygen species by upregulating the gene heme
oxygenase 1, thereby causing the toxic accumulation of iron, which
ultimately leads to the development of memory deficits (7). Although the mechanisms involved in
the pathogenesis of AD have been recognized and demonstrated
through numerous experiments, there has been a paucity of attention
directed towards the molecular role of AD and the derivation of
related mechanisms. Therefore, further research into the
relationship between AD, immunology and ferroptosis could help
develop more effective AD treatments.
Ferroptosis is one of the most recently studied
modes of cell death. It has been revealed that the mechanism of
ferroptosis is closely related to several aspects, mainly iron
metabolism disorders, GSH (glutathione) depletion and lipid
peroxidation (8). The brain
consumes more oxygen compared with other tissues, leading to
enrichment of polyunsaturated fatty acid and iron in brain tissue,
which would be more susceptible to lipid peroxidation and
ferroptosis (9–11). It has been revealed that neuronal
apoptosis, autophagy, necrotic apoptosis and pyroptosis can be
observed in degenerated AD brains (12–15).
Pathological changes such as iron deposition, lipid peroxidation
damage, and reduction of glutathione peroxidase 4 and GSH are
present in the hippocampus and cortex of patients with AD (16,17).
In addition, a brain iron-sensitive MRI method (18), quantitative magneto-schematic
mapping of the brain, combined with Aβ positron emission tomography
(PET), has demonstrated an increase in brain iron load and brain
iron sensitivity in patients with AD. An MRI method, brain
quantitative magnetography combined with Aβ PET, revealed that
patients with AD have an increased brain iron load and that brain
iron load is positively correlated with cognitive decline
associated with Aβ deposition, suggesting that ferroptosis plays a
key role in AD. There is also a potential link between iron and
oxidative stress in the pathogenesis of AD. Overall, iron
alterations are considered a pathological feature of AD and are
closely associated with the course and progression of the disease.
Therefore, the detection of related genes as indicators of
ferroptosis is important for further studies on the pathogenesis of
AD.
The mechanisms of ferroptosis in AD are relatively
poorly understood. Moreover, the biological biomarkers of iron
regulation in AD are still poorly understood. Therefore, the aim of
the present study was the analysis and investigation of the
molecular mechanisms and functions of genes associated with
ferroptosis in the pathogenesis of AD, as well as the construction
of a model for AD prognosis. Ultimately, the present study will
provide biomarkers that are related to ferroptosis in AD.
Materials and methods
Data collection
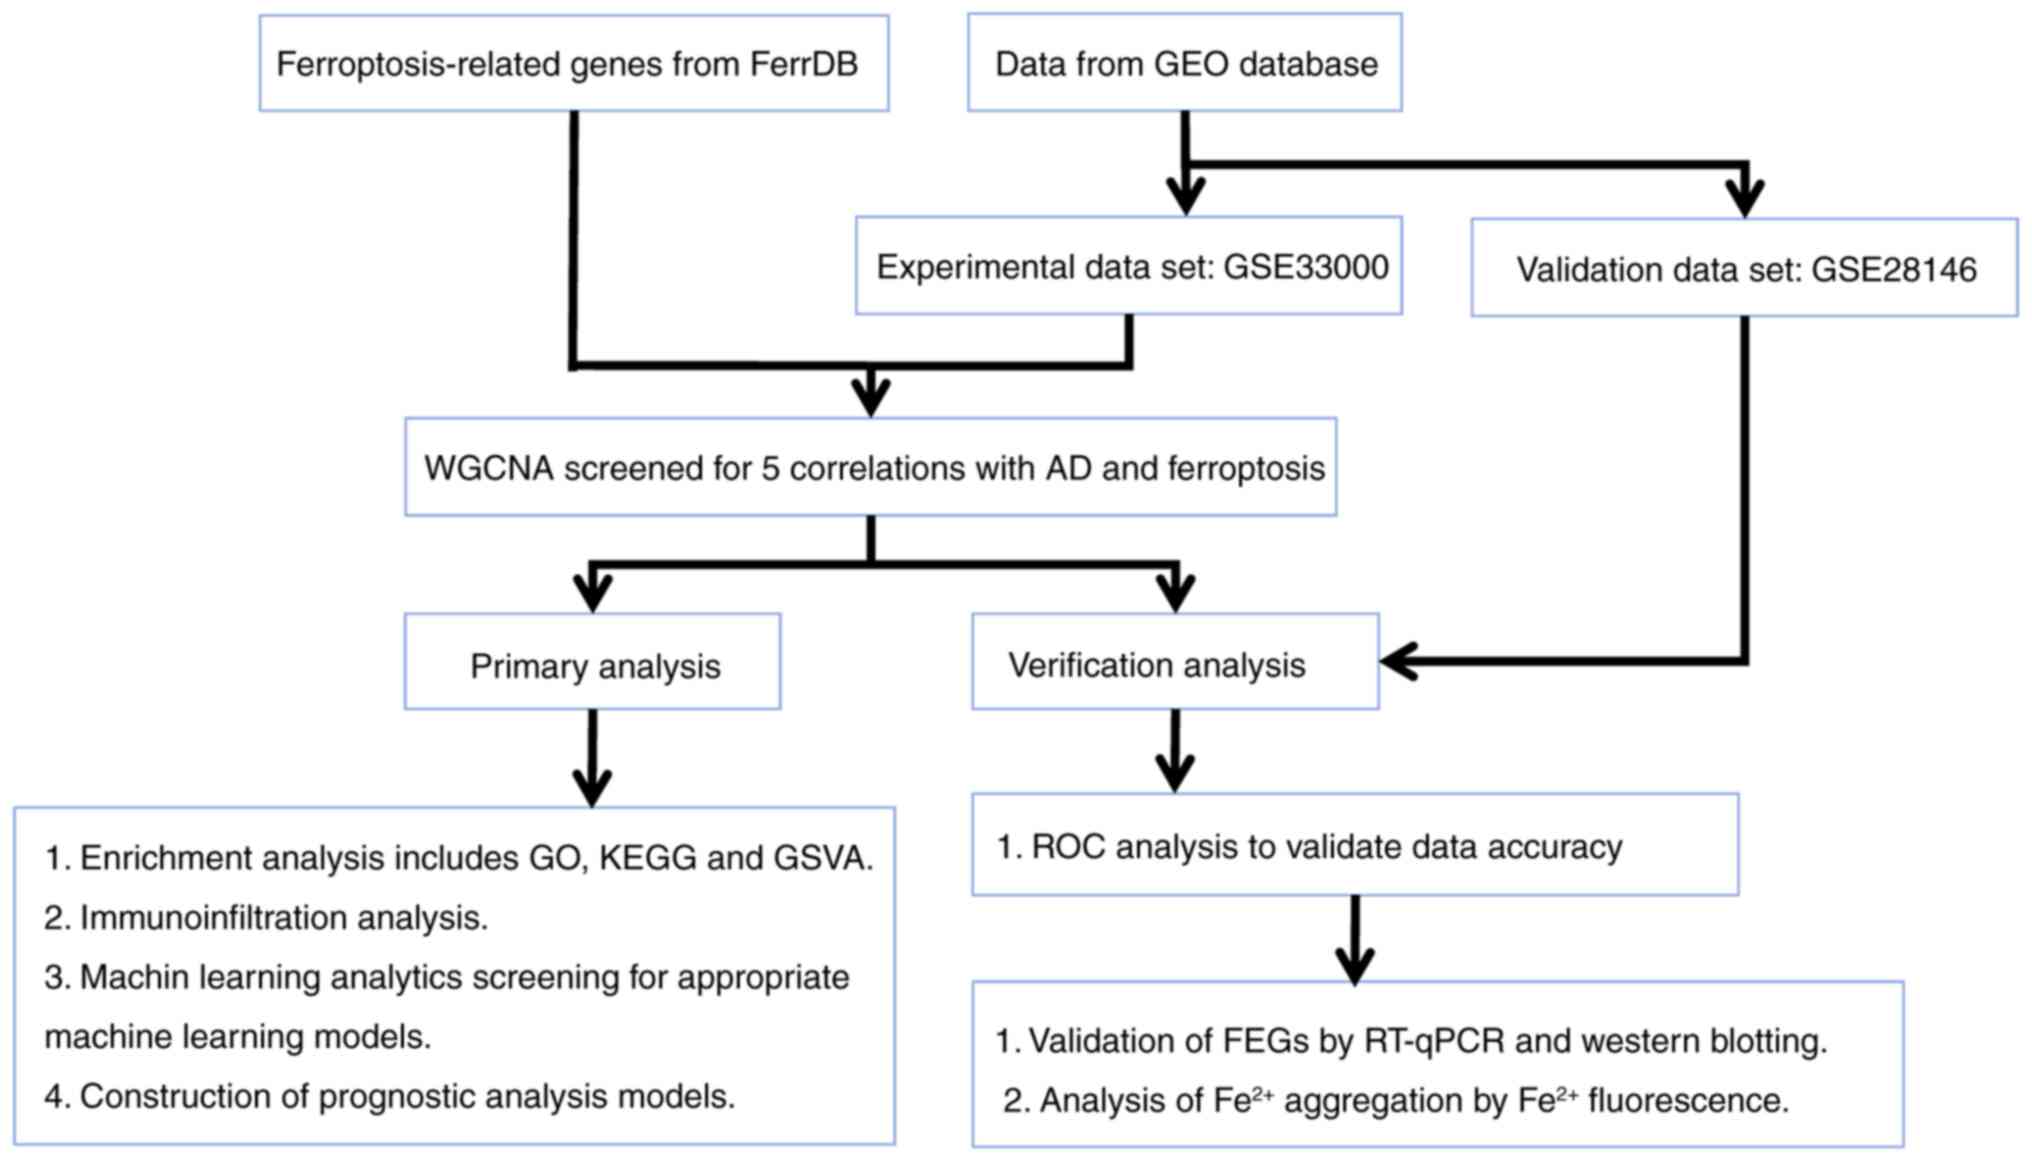
All gene expression datasets in the present study
were derived from the public database Gene Expression Omnibus (GEO)
(https://www.ncbi.nlm.nih.gov/geo/).
Data were derived from the GSE33000 (17) and GSE28146 datasets (18). The GSE33000 data contains a sample
size of n=157 for the normal control group and n=310 for the
Alzheimer's group. The GSE28146 data contains a sample size of n=8
for the normal control group and n=22 for the Alzheimer's group. A
total of 65 ferroptosis-related genes (FEGs) were obtained from the
FerrDB public website (http://www.zhounan.org/ferrdb/current/). The
experimental flow chart is demonstrated in Fig. 1.
Differential expression analysis and
data processing
GSE33000 data were processed using the SVA
(https://www.bioconductor.org/packages/release/bioc/html/sva.html)
and limma packages in R 4.2.1 (https://bioconductor.org/packages/release/bioc/html/limma.html?).
All datasets were normalized using the R package preprocessCore
(https://bioconductor.org/packages/release/bioc/html/preprocessCore.html?),
and differential expression analysis was performed by the R package
limma. The threshold for differential genes was set at |log-fold
change (FC)|>0.3, P<0.05, and the screened differential genes
were plotted using the R packages ggplot2 (https://ggplot2.tidyverse.org/) and pheatmap
(https://cran.rstudio.com/web/packages/pheatmap/index.html),
respectively.
Weighted gene co-expression network
analysis (WGCNA)
Similarly expressed genes were clustered to form
modules in a bid to analyze the gene expression patterns across
multiple samples (17). A
clustering tree diagram was first used to pull out outlier genes
and samples in the dataset. The use of WGCNA was based on 65 FEGs
and the gene expression data from the pre-extracted differential
genes and control samples. Then, an optimal soft power was
selected, and a weighted neighbor-joining matrix was constructed
and transformed into a topological overlap matrix (TOM). When the
minimum module size was set to 100, modules were obtained by a TOM
dissimilarity measure (1-TOM), based on a hierarchical clustering
tree algorithm. Then, hierarchical clustering was performed to
identify the modules and feature genes were calculated as modules
adopting random colors. The module feature genes represented the
global gene expression profiles in each module. By filtering the
appropriate set of genes in each module and intersecting them with
the set of differential genes, finally, the correlation between
each module of the table was assessed and the relevant modules were
identified by Pearson correlation analysis.
Identification of ferroptosis-related
genes
Differential analysis of genes obtained from WGCNA
was performed using the limma package. A receiver operating
characteristic (ROC) analysis was conducted using the pROC package
(https://web.expasy.org/pROC/) to assess
the accuracy of FEGs in the experimental set.
Identification and enrichment analysis
of ferroptosis-related genes
To investigate the biological functions of FEGs, the
Gene ontology (GO; http://geneontology.org/) and Kyoto Encyclopedia of
Genes and Genomes (KEGG; http://www.genome.jp/kegg/) pathways of five FEGs were
analyzed using the R package clusterProfiler. The files
‘c2.cp.kegg.v7.4.symbols’ and ‘c5.go.bp.v7.5.1.symbols’ were
downloaded from the MSigDB website database (http://www.gsea-msigdb.org/gsea/index.jsp) and
analyzed using the R package Gene Set Variation Analysis (GSVA;
http://github.com/rcastelo/GSVA). The
pathways and biological functions involved were assessed using
GSVA.
Assessment of immune cell
infiltration
The immune infiltration of 22 immune cell types was
assessed using the R package CIBERSORT (https://cibersortx.stanford.edu/) from previously
obtained gene expression data. The correlation between FEGs and
immune cells was characterized, using the R package ggplot 2 to
graphically visualize the results from the analysis (18).
Construction and validation of
nomograms
Machine learning residual plots were created using
the DALEX software package (https://modeloriented.github.io/DALEX/). Column plots
were constructed using the rms R package (https://hbiostat.org/r/rms/) based on the Glial
fibrillary acidic protein (GFAP), vimentin (VIM), metallothionein
2A (MT2A), family with sequence similarity 107, member A (FAM107A)
and Alpha 1,4-galactosyltransferase (A4GALT) genes. The results
were presented visually based on Logistic regression model and Cox
regression model. Scoring criteria were developed based on the
magnitude of the model regression coefficients, assigning a score
to each value taken for each independent variable, and revealing
the effect of each gene on the probability of occurrence by means
of a transformation function between the score and the probability
of occurrence of the outcome.
Validation of the accuracy and
precision of the model
The constructed model was assessed using calibration
curves and decision curve analysis (DCA). The area under the ROC
curve (AUC) of the external dataset GSE28146 (containing 22
patients with AD and 8 normal controls) was used to evaluate the
accuracy of model. The aforementioned methods were used to validate
the classification performance of the diagnostic model.
Statement of authentication for
SH-SY5Y cells
SH-SY5Y cells (cat. no. PC-H2022072130; Procell Life
Science & Technology Co., Ltd.) were used to extract DNA using
the Microread Genomic DNA Kit (cat. no. KG203; Tiangen Biotech Co.,
Ltd.), and 20 STR and sex identification sites were amplified using
the Microread™ 21 ID System (Beijing Microread Genetics
Co., Ltd.), and the ABI 3730×l was used to identify the sex of the
cells. The PCR products were detected by ABI 3730×l Genetic
Analyzer (Thermo Fisher Scientific, Inc.), and the results were
analyzed by GeneMapper Software6 (Thermo Fisher Scientific, Inc.)
and compared with American Type Culture Collection, DSMZ, JCRB,
Expasy (https://www.expasy.org/) and other
databases.
Cell culture and construction of AD
models
SH-SY5Y cells were kindly provided by Procell Life
Science & Technology Co., Ltd. (cat. no. CL-0208; cell number:
PC-H2022072130). Okadaic acid (OA; cat. no. HY-N6785;
MedChemExpress) was the drug that that induces phosphorylation of
tau protein in SH-SY5Y cells, resulting in cellular constructs
(19,20). The resuscitated cells were cultured
with 85% Gibco DMEM/F-12 medium (Gibco; Thermo Fisher Scientific,
Inc.), 1% penicillin mixture, and 14% fetal bovine serum (FBS)
(Sigma-Aldrich; Merck KGaA). In one group of the cell experiments,
a mixture of OA and medium with different drug concentrations were
used, while complete medium was used for the other group. The Cell
Counting Kit-8 (CCK-8) kit (cat. no. C6005M; Suzhou Youyi Landi
Biotechnology Co., Ltd.) was used to determine the optimal drug
concentration. SH-SY5Y cells were placed in 96-well plates
(3.0×10⁴ per well) and cultured for 24 h. Complete
medium containing 0, 10, 20, 40, and 80 nM OA solution was then
added to each well, with four replicates for each concentration
(21,22). Incubation lasted for 48 h, and the
liquid was changed every 24 h. After 24 h, in order to compare the
effects of different OA concentrations on the proliferation of
SH-SY5Y cells, CCK-8 reagent (20 µl) was added to each well and
incubated for 3 h at 37°C and 5% CO2. Finally, the
absorbance value at 450 nm was measured using a BIOBASE-EL10A
enzyme labeler [Biobase Biodusty (Shandong), Co., Ltd.] (22). The experiment was repeated three
times with three wells for each round. The optimal drug
concentration was numerically calculated to be 25 nM. The SH-SH5Y
cells were placed in 96-well plates (3.0×10⁴ per well)
again prior to incubation for 24 h. A mixture of OA and complete
medium with 0 and 25 nM drug concentrations was then added, and
incubation was performed for another 48 h at 37°C and 5%
CO2. The liquid was replaced every 24 h. Then, 20 µl of
the CCK-8 reagent were added, after which incubation was performed
at 37°C for 3 h. Finally, the absorbance value at 450 nm was
determined using a BIOBASE-EL10A enzyme marker. The experiment was
repeated three times with five wells in each set of replicates. The
cell viability index at a drug concentration of 25 nM was obtained.
Therefore, it was concluded that 25 nM concentration of OA acting
on SH-SY5Y cells can be constructed as an experimental model of AD
and was regarded as a model group.
RNA extraction and differential
expression of FEGs verified by reverse transcription quantitative
(RT-q) PCR in SH-SH5Y cells
Total RNA samples were extracted with
TRIzol® (Thermo Fisher Scientific, Inc.) reagent.
TRIzol® reagent was added to the model and control
groups, then RNA was extracted and l µg of it was reverse
transcribed to cDNA using the SureScript First Strand cDNA Reverse
Transcription Kit (cat. no. 22107-01; Tolo Biotech Co., Ltd.),
according to the manufacturer's protocol. A total of l µg of
extracted RNA was reverse transcribed to cDNA using the SYBR Green
qPCR mixing kit (cat. no. 22208-01; Tolo Biotech Co., Ltd.). The
SYBR Green qPCR Mix kit was used and mRNA expression of genes
related to ferroptosis was determined in a Light Cycle 96 real-time
fluorescent quantitative PCR instrument (Roche Diagnostics GmbH).
GAPDH was used as an endogenous control. Pre-templating at 94°C for
3 min was conducted to fully denature the template DNA and then
enter the amplification cycle. In each cycle, the template was
first kept at 94°C for 30 sec to denature the template, and then
the temperature was lowered to 50°C and kept for 30 sec to fully
anneal the primer from the template; it was kept at 72°C for 1 min
to complete a cycle. Such cycle was repeated 25–35 times to make a
large accumulation of amplified DNA fragments. Finally, it was held
at 72°C for 5 min to make the product extension complete. The
results were quantified using the 2−ΔΔCq method
(23). Target genes were amplified
using the following sequences: GAPDH forward,
5′-CAGGAGGCATTGCTGATGAT-3′ and reverse, 5′-GAAGGCTGGGGCTCATTT-3′;
A4GALT forward, 5′-TTCCCGAATGTCCAGATGCT-3′ and reverse,
5′-AGTCCGTGTCCAGGTAGATG-3′; VIM forward, 5′-CTGCTGGAAGGCGAGGAGAG-3′
and reverse, 5′-TGGGTATCAACCAGAGGGAGTG-3′; MT2A forward,
5′-CCCGACTCTAGCCGCCTCTT-3′ and reverse, 5′-CACTTGTCCGACGCCCCTTT-3′;
GFAP forward, 5′-TGCAGATTCGAGGGGGCAA-3′ and reverse,
5′-GAGAGGCAGGCAGCTAACCG-3′; and FAM107A forward,
5′-ATCACGCCCCCGAGTTTATT-3′ and reverse,
5′-AGGTGGGAACATCACAGACG-3′.
Protein extraction and western blot
validation of protein differential expression in SH-SY5Y cells
Protein blotting assay was performed to assess
protein expression in different groups of cells, and the endogenous
reference protein was GAPDH. The culture flasks were washed with
pre-cooled PBS, and the cells were collected by using a cell
spatula and put into 15 ml centrifuge tubes to be centrifuged at
1,200 × g for 5 min. Then, the supernatant was discarded, and 200
µl of a 100:1:1 lysate of RIPA tissue/cell lysate, a mixture of
protein phosphatase inhibitors and a protease Inhibitor (both from
Beijing Solarbio Science & Technology Co., Ltd.) was added to
the centrifuge tube and blown to mix, and lysed on ice for 30 min.
The protein concentration was determined by BCA protein assay.
Separation gels were prepared according to the molecular weight of
the target protein. The samples were boiled in 4X protein uploading
buffer for 5 min and protein samples (20 µg/lane) were added to a
10% gel for SDS-PAGE. Electrophoresis conditions were 80 V for the
upper gel and run for 2 Min; the lower gel was run at 120 V for 90
min. During the membrane transfer process, proteins were
transferred to nitrocellulose membranes at 250 mA for 80 min. After
the transfer was completed, the membrane was closed with
protein-free rapid closure solution (1X; Shanghai Epizyme Biotech
Co.) for 20 min at room temperature, washed three times with 20X
TBS-1% Tween-20 (TBST) buffer (50 + 950 ml purified water) for 10
min each time, and incubated overnight at 4°C with the following
primary antibodies: Anti-GAPDH (36 kDa; 1:10,000; cat. no.
10494-1-AP; Proteintech Group, Inc.), anti-FAM107A (17 kDa;
1:2,000; cat. no. bs-6381R; BIOSS), anti-GFAP (45 kDa; 1:1,500;
cat. no. 53-9892-82; Thermo Fisher Scientific, Inc.), anti-VIM (54
kDa; 1:2,000; cat. no. 10366-1-AP; Proteintech Group, Inc.) and
anti-A4GALT (35 kDa; 1:2,000; cat. no. bs-7588R; BIOSS). Then the
membrane was washed three times with TBST for 10 min each time. The
HRP-conjugated secondary antibody (cat. no. SA00001-2; Proteintech
Group, Inc.) was incubated at a dilution ratio of 1:5,000 for 1 h
at room temperature, and then washed three times with TBST for 10
min each time. Then, the ultrasensitive luminescence solution (A:B
formulated at 1:1. cat. no. SQ201; Shanghai Epizyme Biotech Co.)
was prepared, and 200 µl of the color development solution was
added to each membrane, which was placed in a fully automated
chemiluminescence gel imager for color development. Western blot
semi-quantification was performed using Image J (v. 1.54d; National
Institutes of Health).
Fe2+ fluorescence
detection
The control and experimental cells inoculated in
6-well plates were received, the complete culture was discarded and
the cells were washed three times with Hank's balanced salt
solution (HBSS; Dojindo Laboratories, Inc.). FerroOrange working
solution (cat. no. F374; Dojindo Laboratories, Inc.) was added at a
concentration of 1 µmol/l, was diluted in 2 ml per well with HBSS,
was incubated for 30 min at 37°C and 5% CO2, and was
observed directly under the fluorescence microscope (green
excitation light wavelength, 532 nm).
Statistical analysis
All data are presented as the mean ± SEM and
experiments were repeated at least three times. Data processing and
statistical analyses were performed using the R software version
4.2.1 (https://www.r-project.org/), Strawberry
Perl version 5.30.1.1 (https://strawberryperl.com/), SPSS version 25 (IBM
Corp.), and GraphPad Prism version 9.0 (Dotmatics). To determine
whether there were significant differences in the mRNA levels of
the five FEGs between subgroups, samples were analyzed by unpaired
Student's t-test. The Kaplan-Meier and other survival analyses were
validated by log-rank tests. P<0.05 was considered to indicate a
statistically significant difference.
Results
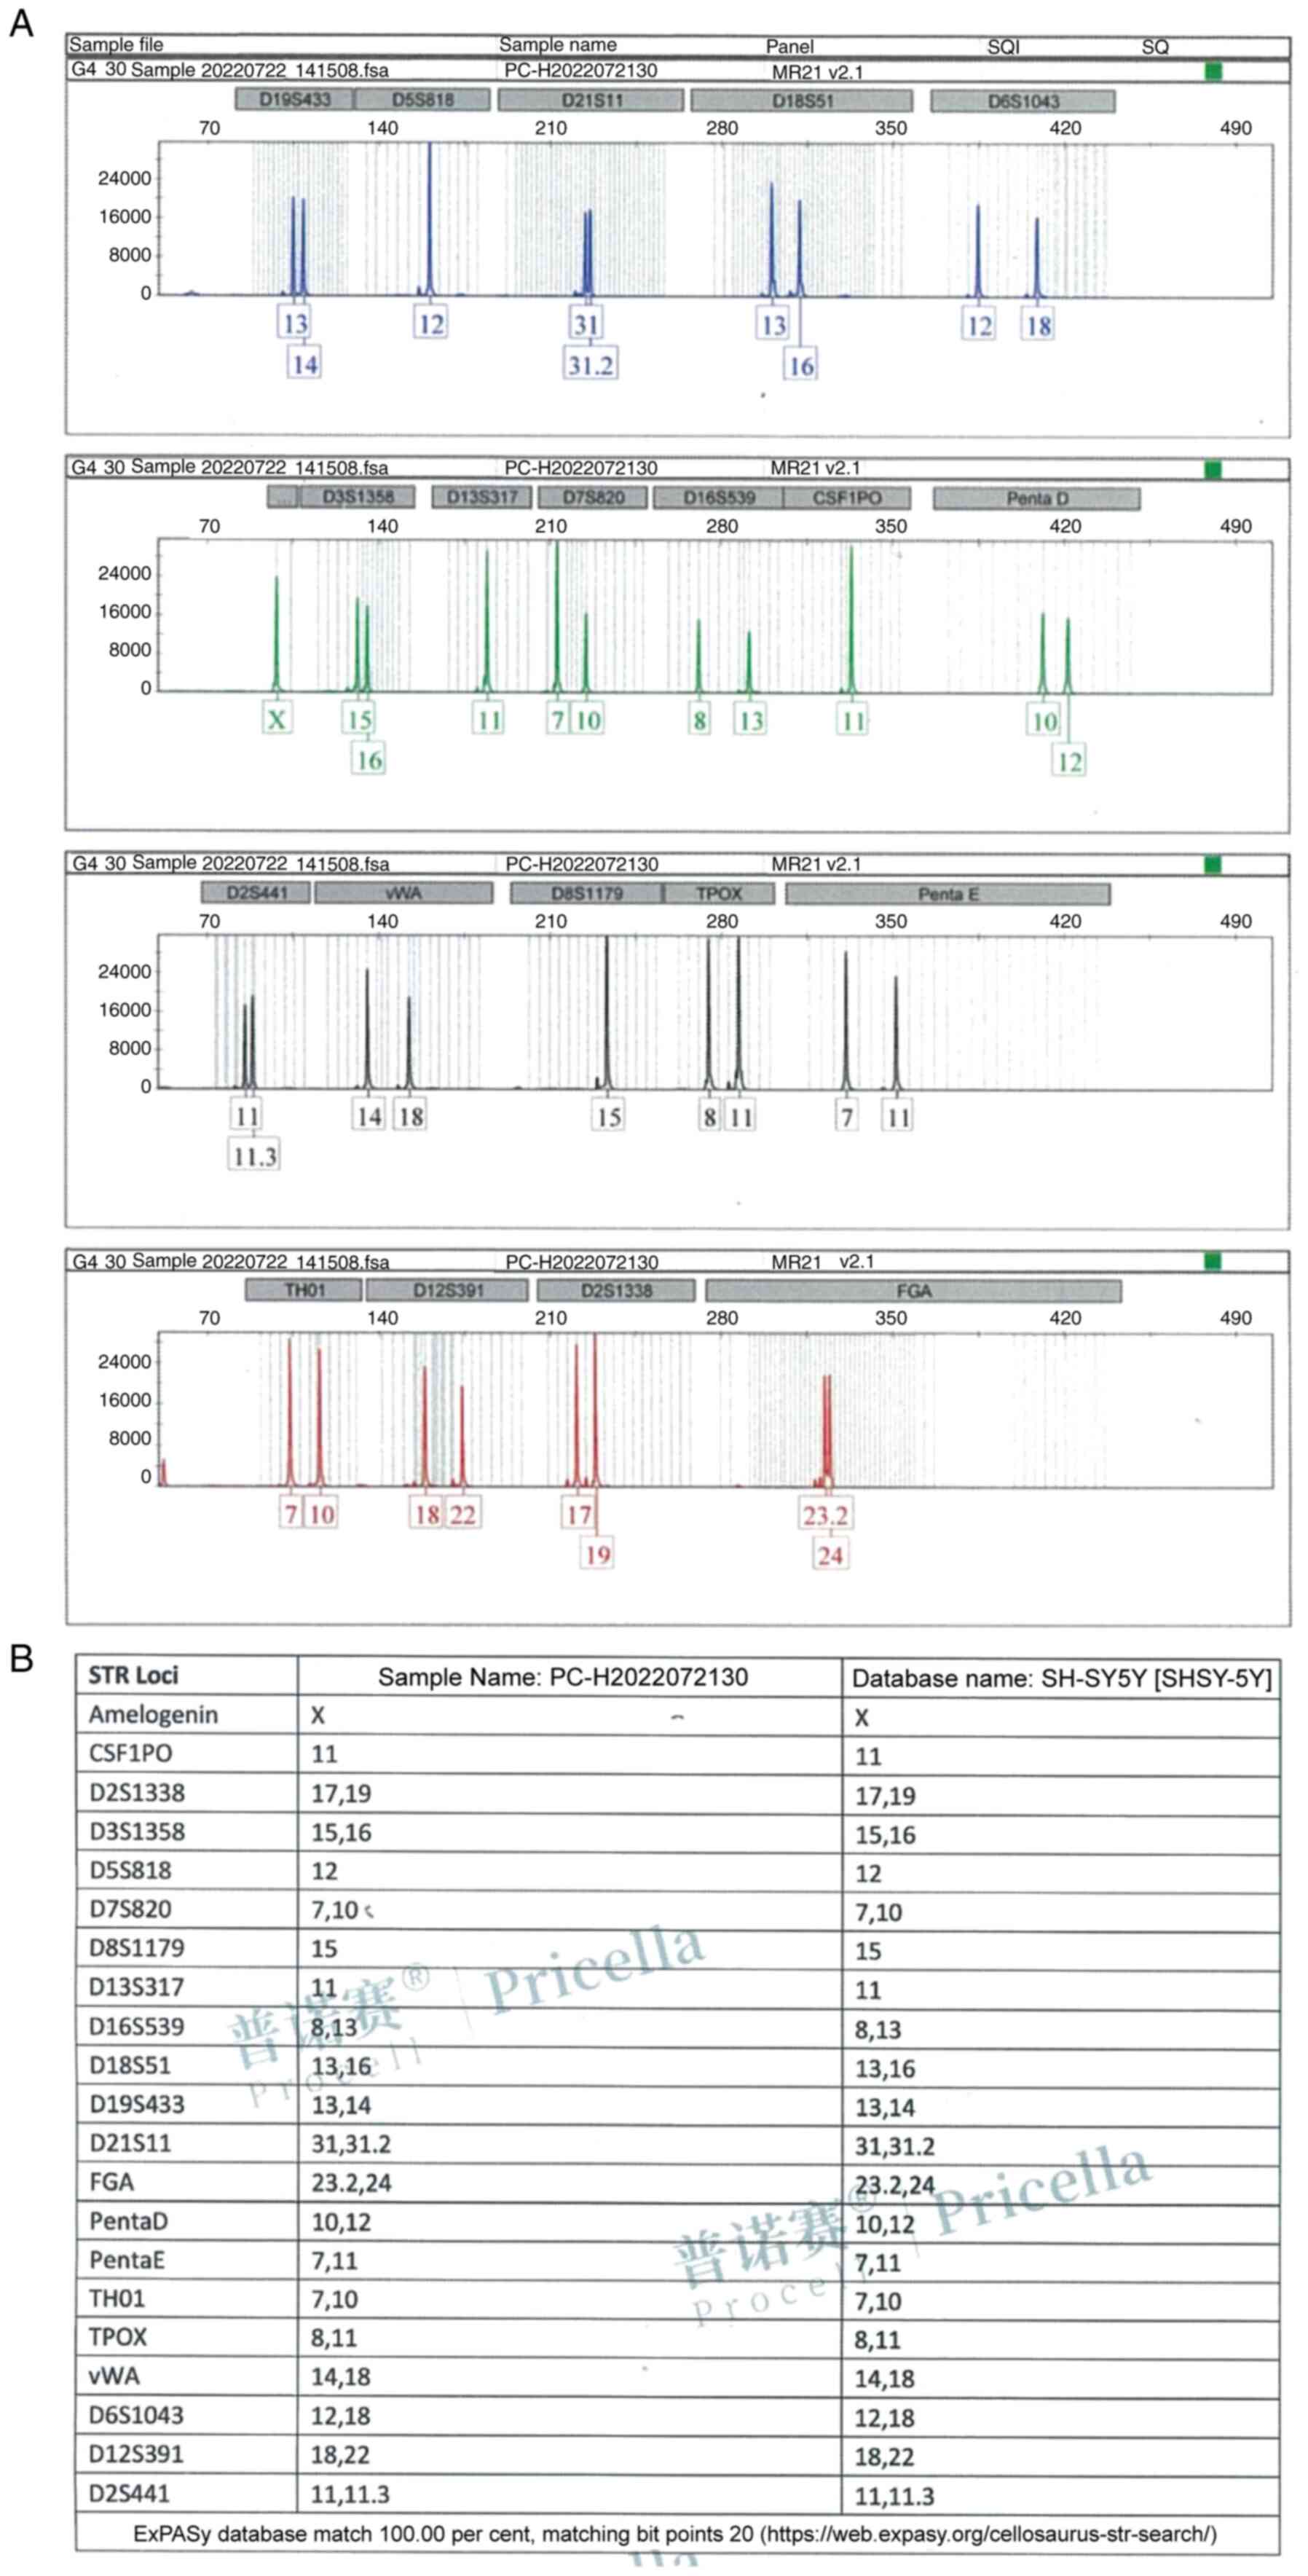
Identification of SH-SY5Y cells
The genomic DNA post-amplification profile of the
SH-SY5Y cell line is revealed in Fig.
2A. As it can be clearly observed from the profile, the STR
typing results demonstrated no cross contamination of human cells
in the cell line. The comparative results of DNA typing of SH-SY5Y
cell line in cell banks are demonstrated in Fig. 2B. The DNA typing of this cell line
found a 100% match with its cell typing in the cell bank, and the
cell line name is SH-SY5Y.
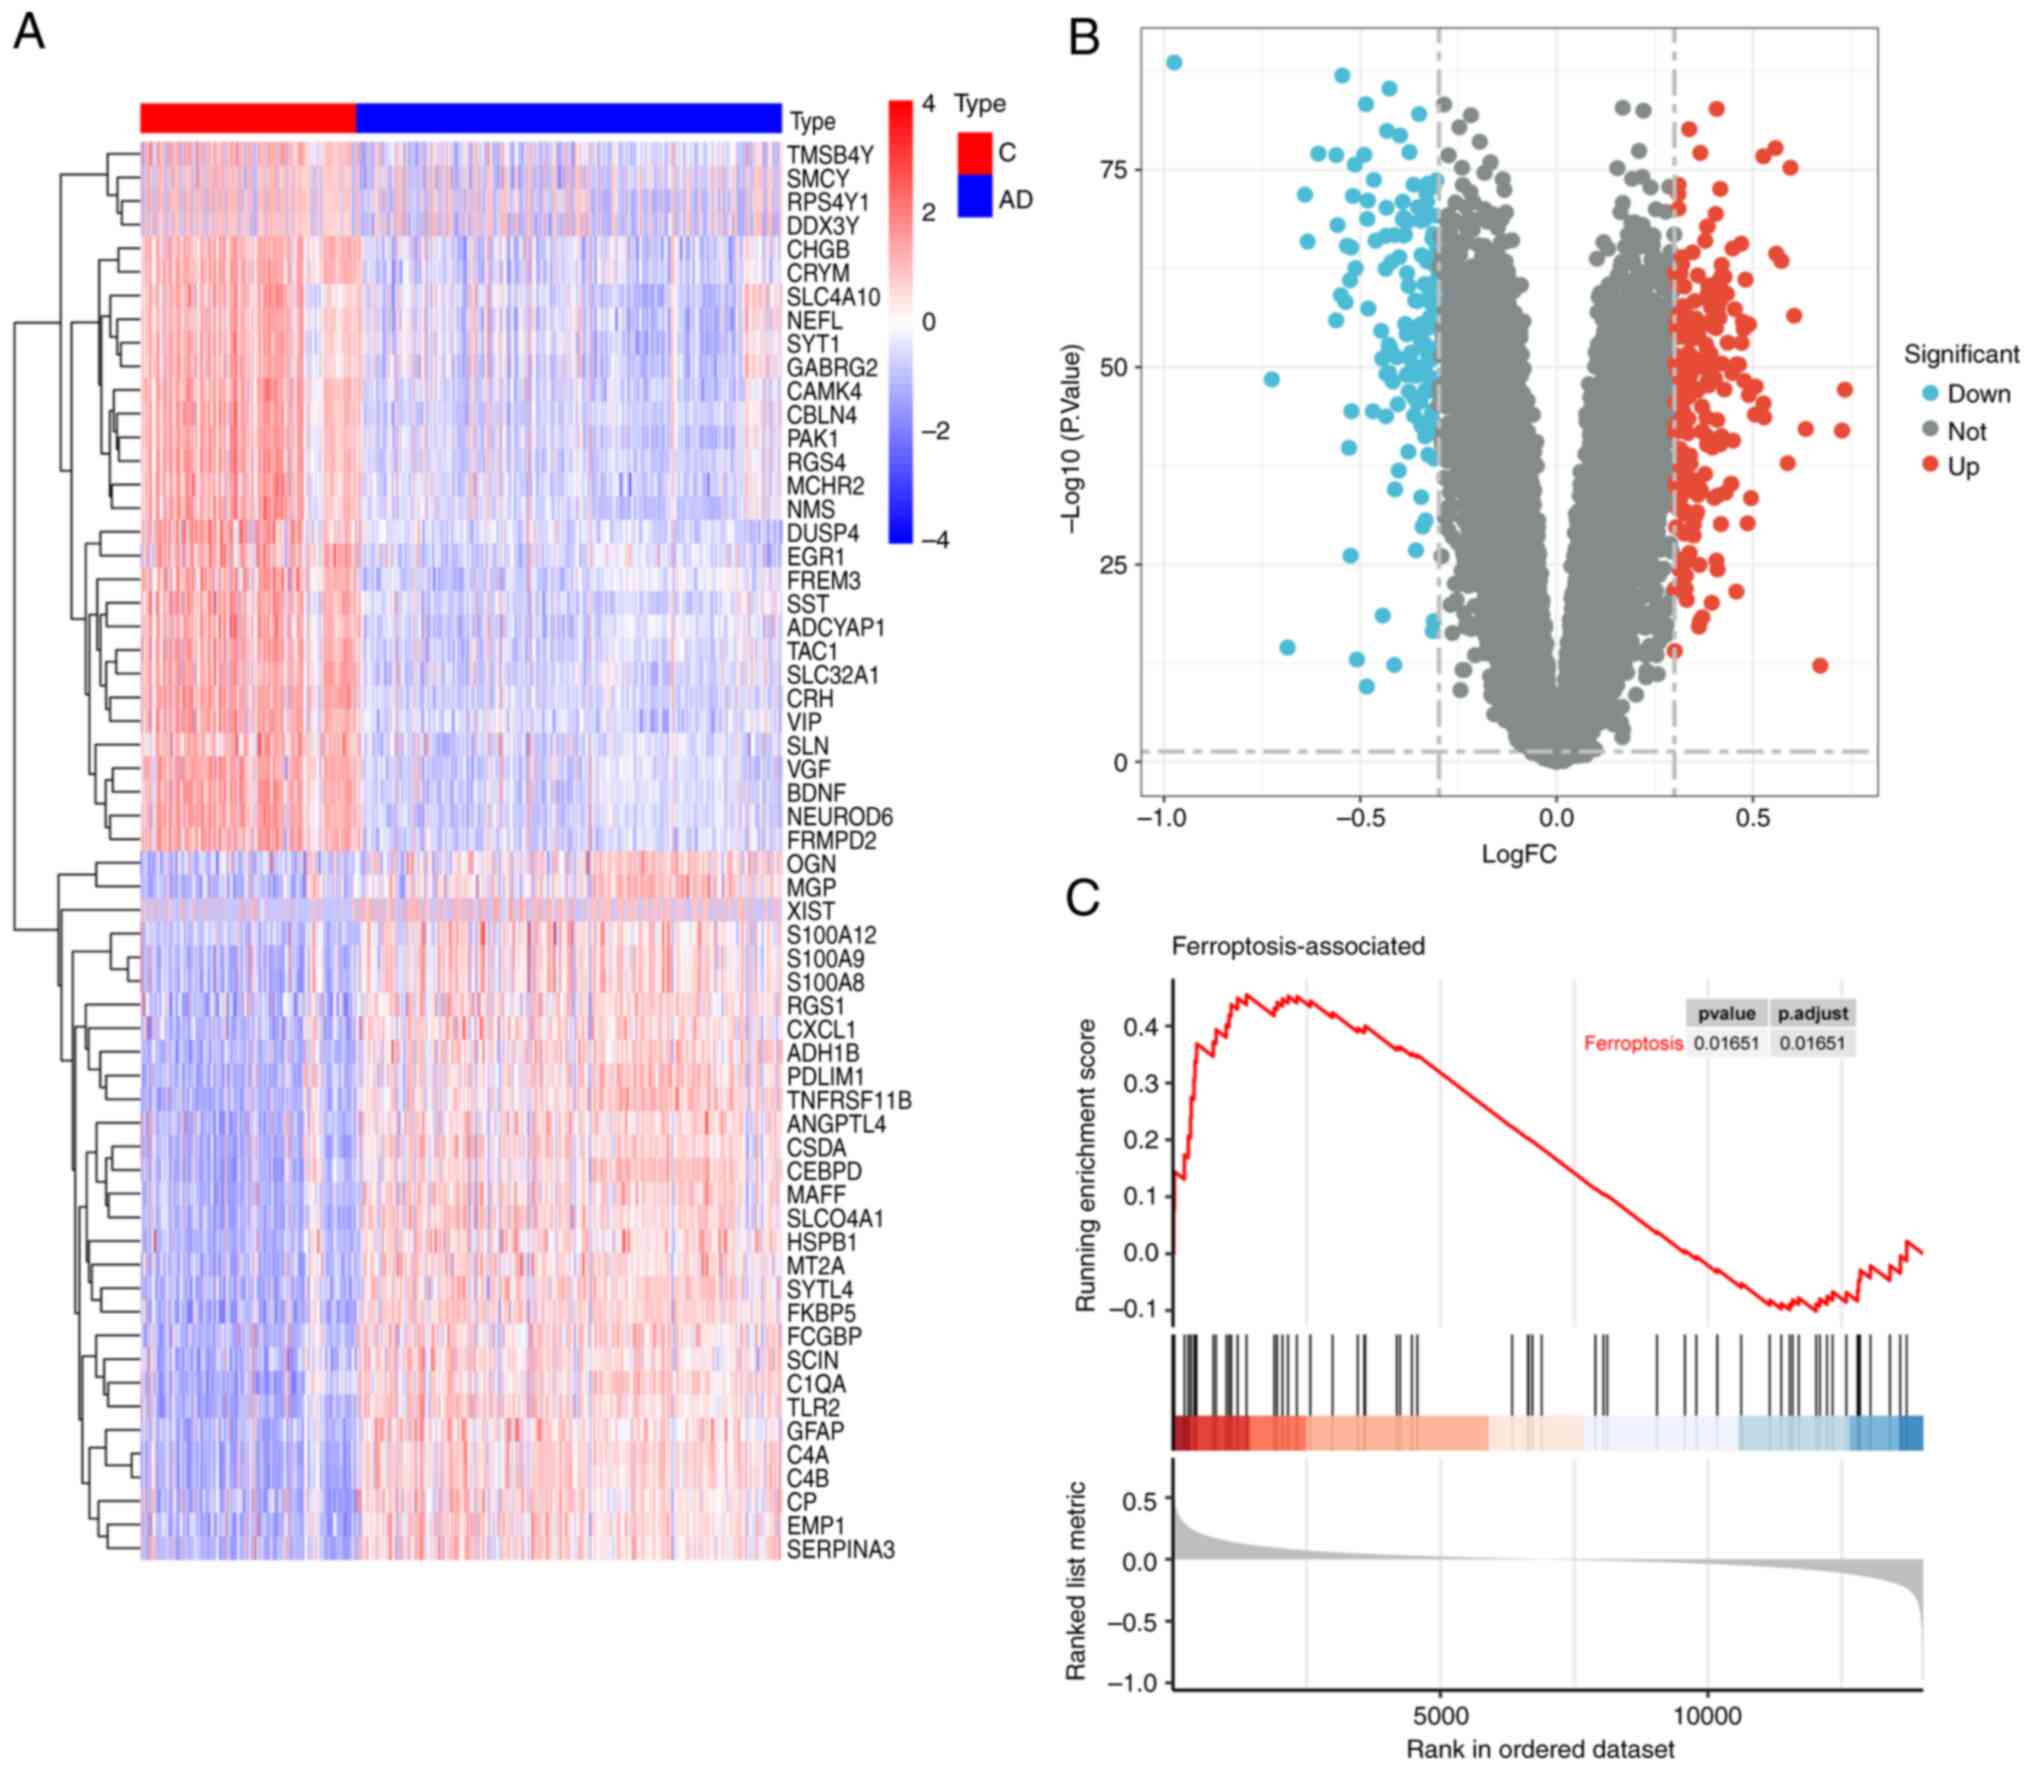
Correlation of differentially
expressed genes and FEGs identified
To identify genes associated with ferroptosis in AD,
differential expression analysis was performed using the GSE33000
dataset, which identified a total of 148 upregulated and 152
downregulated genes (Fig. 3A and
B). The expression profiles of 65 FEGs in the AD and control
groups were then determined. By analyzing the correlation between
the expression profiles, the degree of association between the FEGs
and the dataset was determined (Fig.
3C), with P=0.01651, suggesting that the set of ferroptosis
genes is particularly well correlated with the GSE33000 dataset,
and that there is a strong correlation between ferroptosis and
AD.
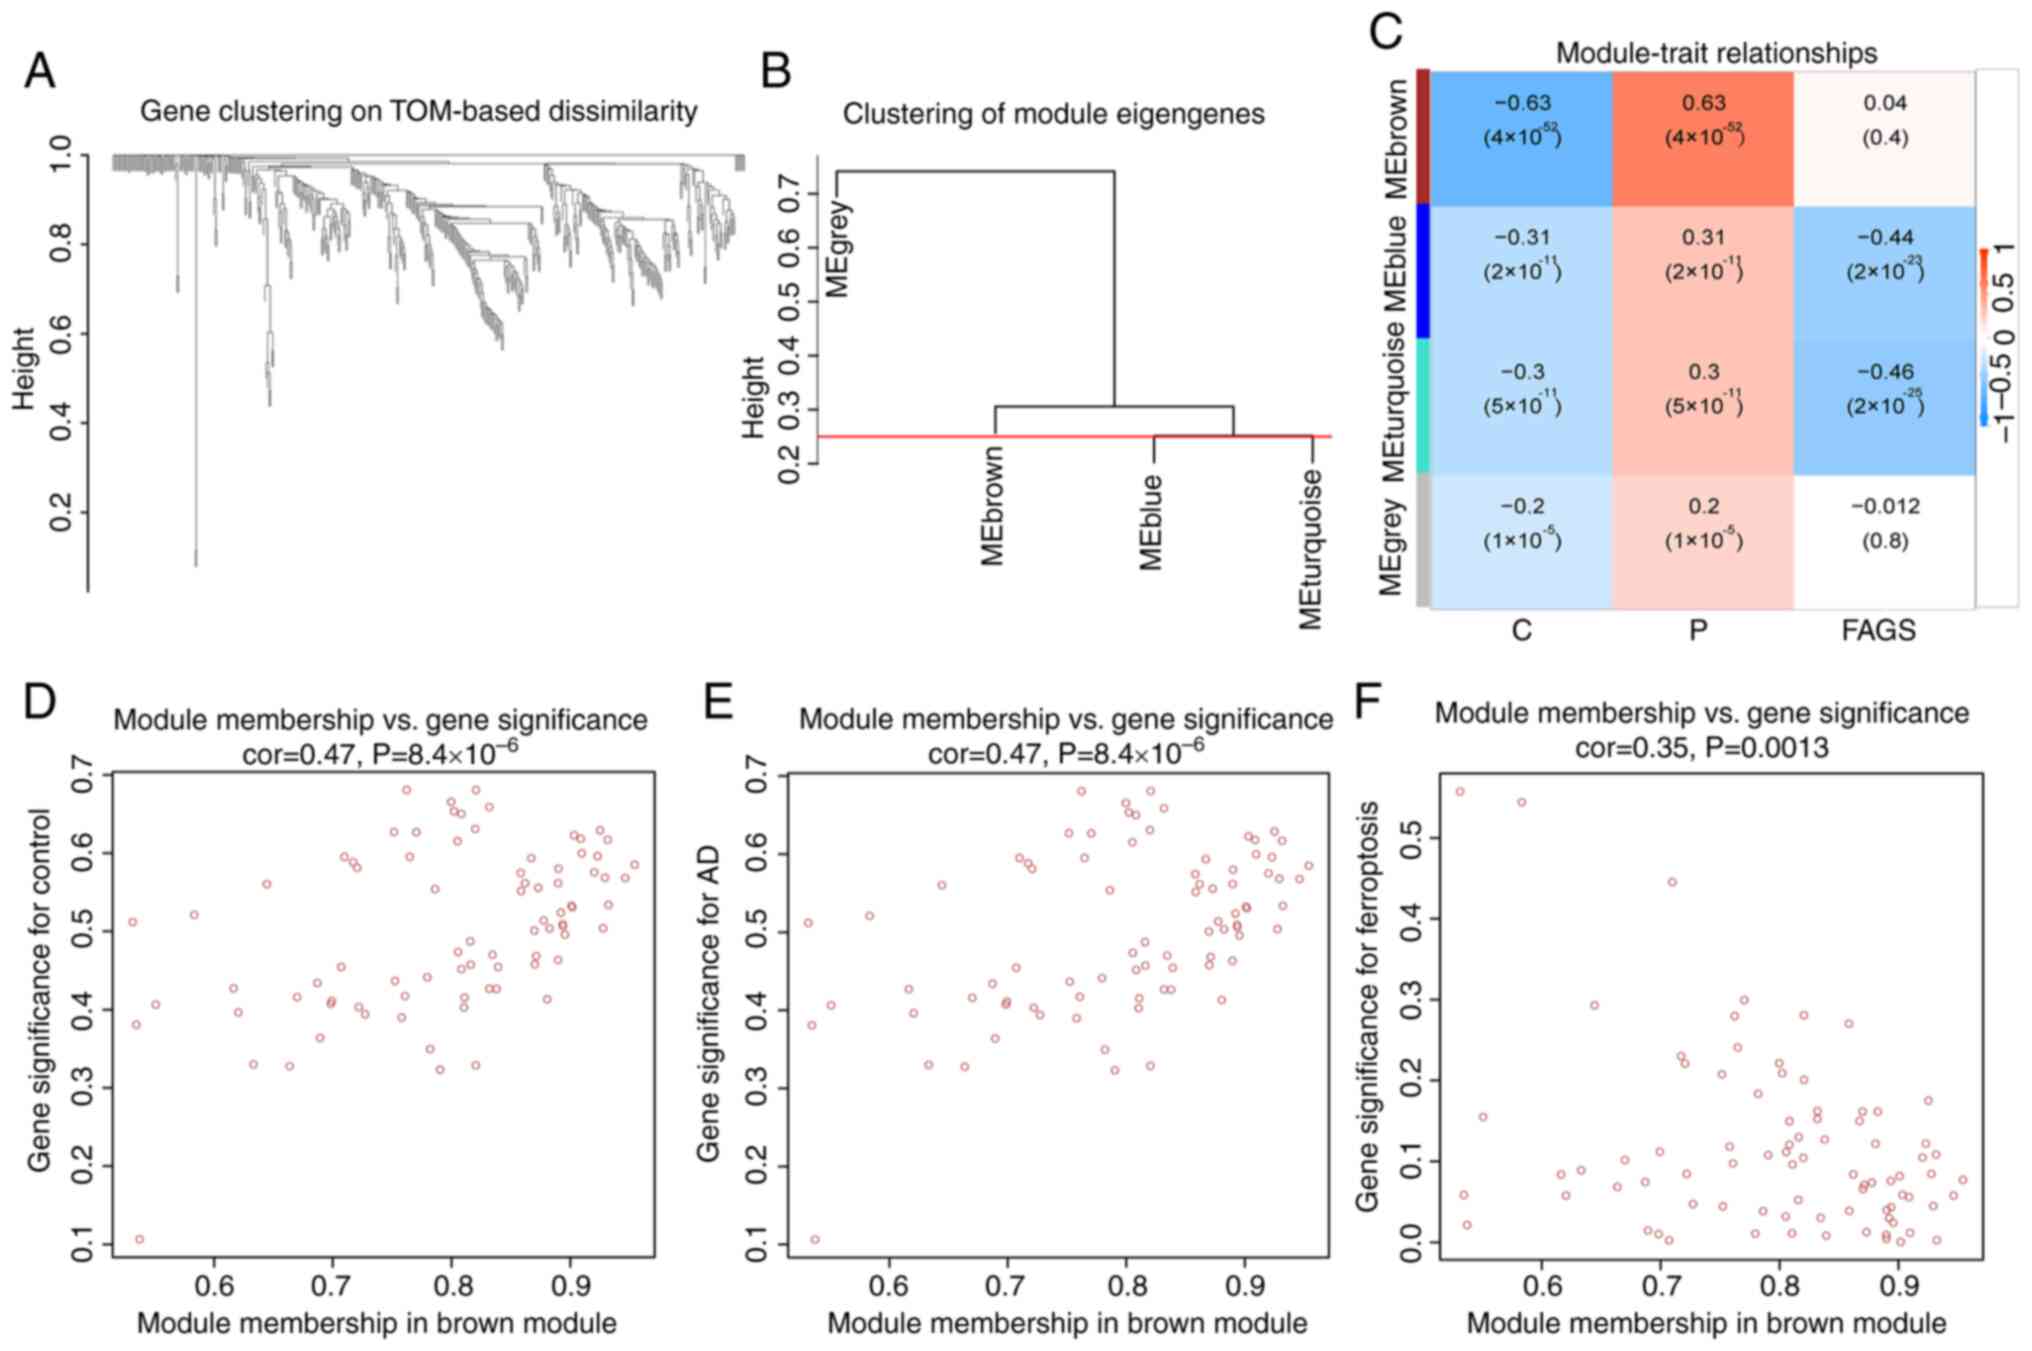
Construction of co-expression
networks
In order to screen the gene modules related to AD
and those related to ferroptosis, co-expression networks and
modules were constructed for the normal, AD and ferroptosis-related
groups using the WGCNA algorithm. Neighbor-joining matrices and
TOMs were established (Fig. 4A and
B). Subsequently, a number of parameters were calculated
representing the overall gene expression level of each module's
signature genes representing the overall gene expression level of
the module; these genes grouped according to its correlations were
clustered and four modules were identified and marked with a unique
color (Fig. 4C). The correlation
of each feature gene was analyzed with clinical traits and a brown
module strongly associated with AD was discovered (Fig. 4D and E). In addition, there was a
strong correlation between brown module-related genes and FEGs
(Fig. 4F).
Characterization of genes associated
with ferroptosis
Through the crossover of the 340 specific DEGs and
WGCNA brown modules that were identified, five FEGs (Fig. 5A) were obtained: GFAP, VIM, MT2A,
FAM107A and A4GALT. Characterization of the five genes revealed
that the expression of the FEGs was significantly upregulated in
the AD group compared with the control group, (Fig. 5B and C).
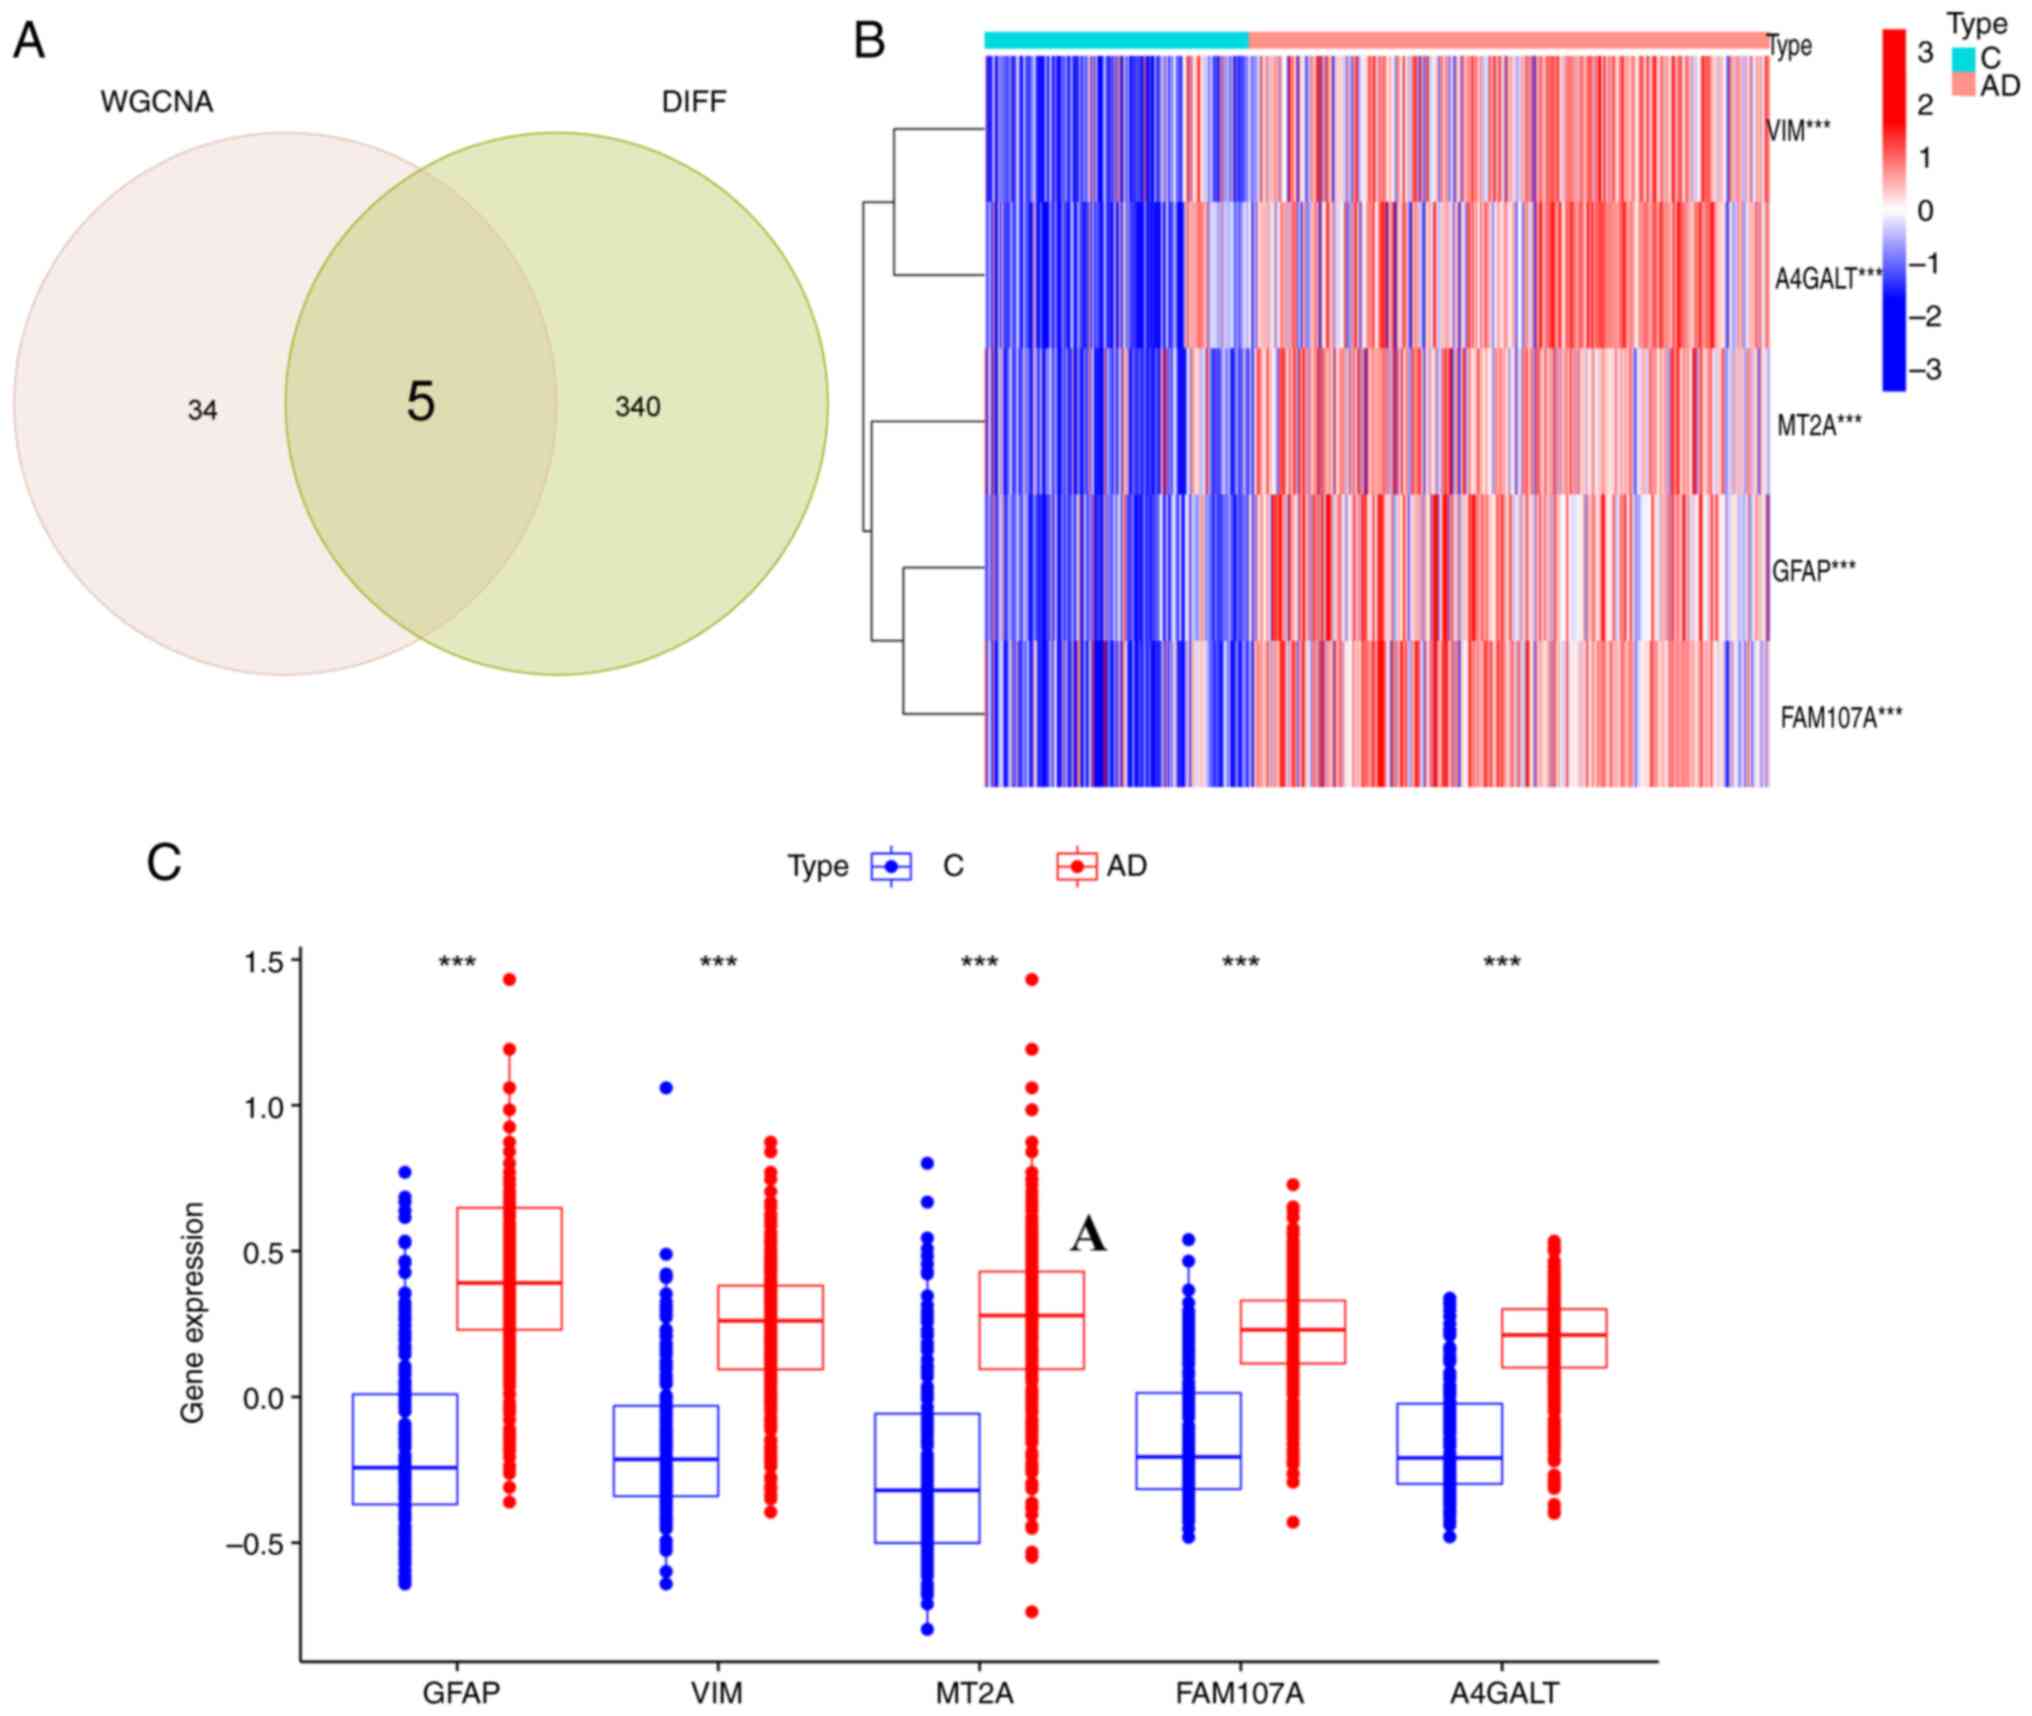 | Figure 5.Differential expression
identification of FEGs. (A) Crosswalk of ferroptosis-related
module-associated genes with module-associated genes in the
GSE33000 dataset. (B) Heatmap demonstrating differential expression
of 5 FEGs. (C) Box plots showing the differential expression of the
5 FEGs. ***P<0.001. FEGs, ferroptosis-related genes; WGCNA,
weighted gene co-expression network analysis; VIM, vimentin;
A4GALT, alpha 1,4-galactosyltransferase; MT2A, metallothionein 2A;
FAM107A, family with sequence similarity 107, member A; GFAP, glial
fibrillary acidic protein; C, control; AD, Alzheimer's disease. |
Biological functional analysis of
genes associated with ferroptosis
The FEGs that were obtained were subjected to
enrichment analyses. The results from the GO enrichment analysis
(Fig. 6A) mainly included Bergman
glial cell differentiation, astrocyte development and
differentiation, long-term synaptic enhancement and negative
regulation of neuronal projection development. It has been revealed
that the balance between quiescence and division of radial
glial-like stem cells (Bergman cells) plays a key role in the
continuation of adult hippocampal neurogenesis throughout the
lifespan and is strongly associated with AD (24). Astrocytes are a key immune cell
type in the central nervous system, and abnormalities in astrocytes
may contribute to a variety of neurodegenerative disorders when
there is a chronic or uncontrolled neuroinflammatory response
(25). The KEGG pathway was
revealed (Fig. 6B) to be a major
contributor to the development of A4GALT, mainly through the
glycosphingolipid biosynthesis-spheres and isohemoglobin family
pathways. GSVA analysis further explored the functional
relationship between AD and FEGs. The outcomes revealed that the
terpene skeleton biosynthesis, protein export, citric acid cycle
TCA cycle and enhanced oxidative phosphorylation were common
manifestations (Fig. 6C-G). In AD,
the TCA cycle is associated with synaptic loss, and there is direct
evidence that several key enzymes of the TCA cycle are associated
with impaired mitochondrial energy in AD (26). It is suggested that these genes are
important for the present study and can be used for further
analysis.
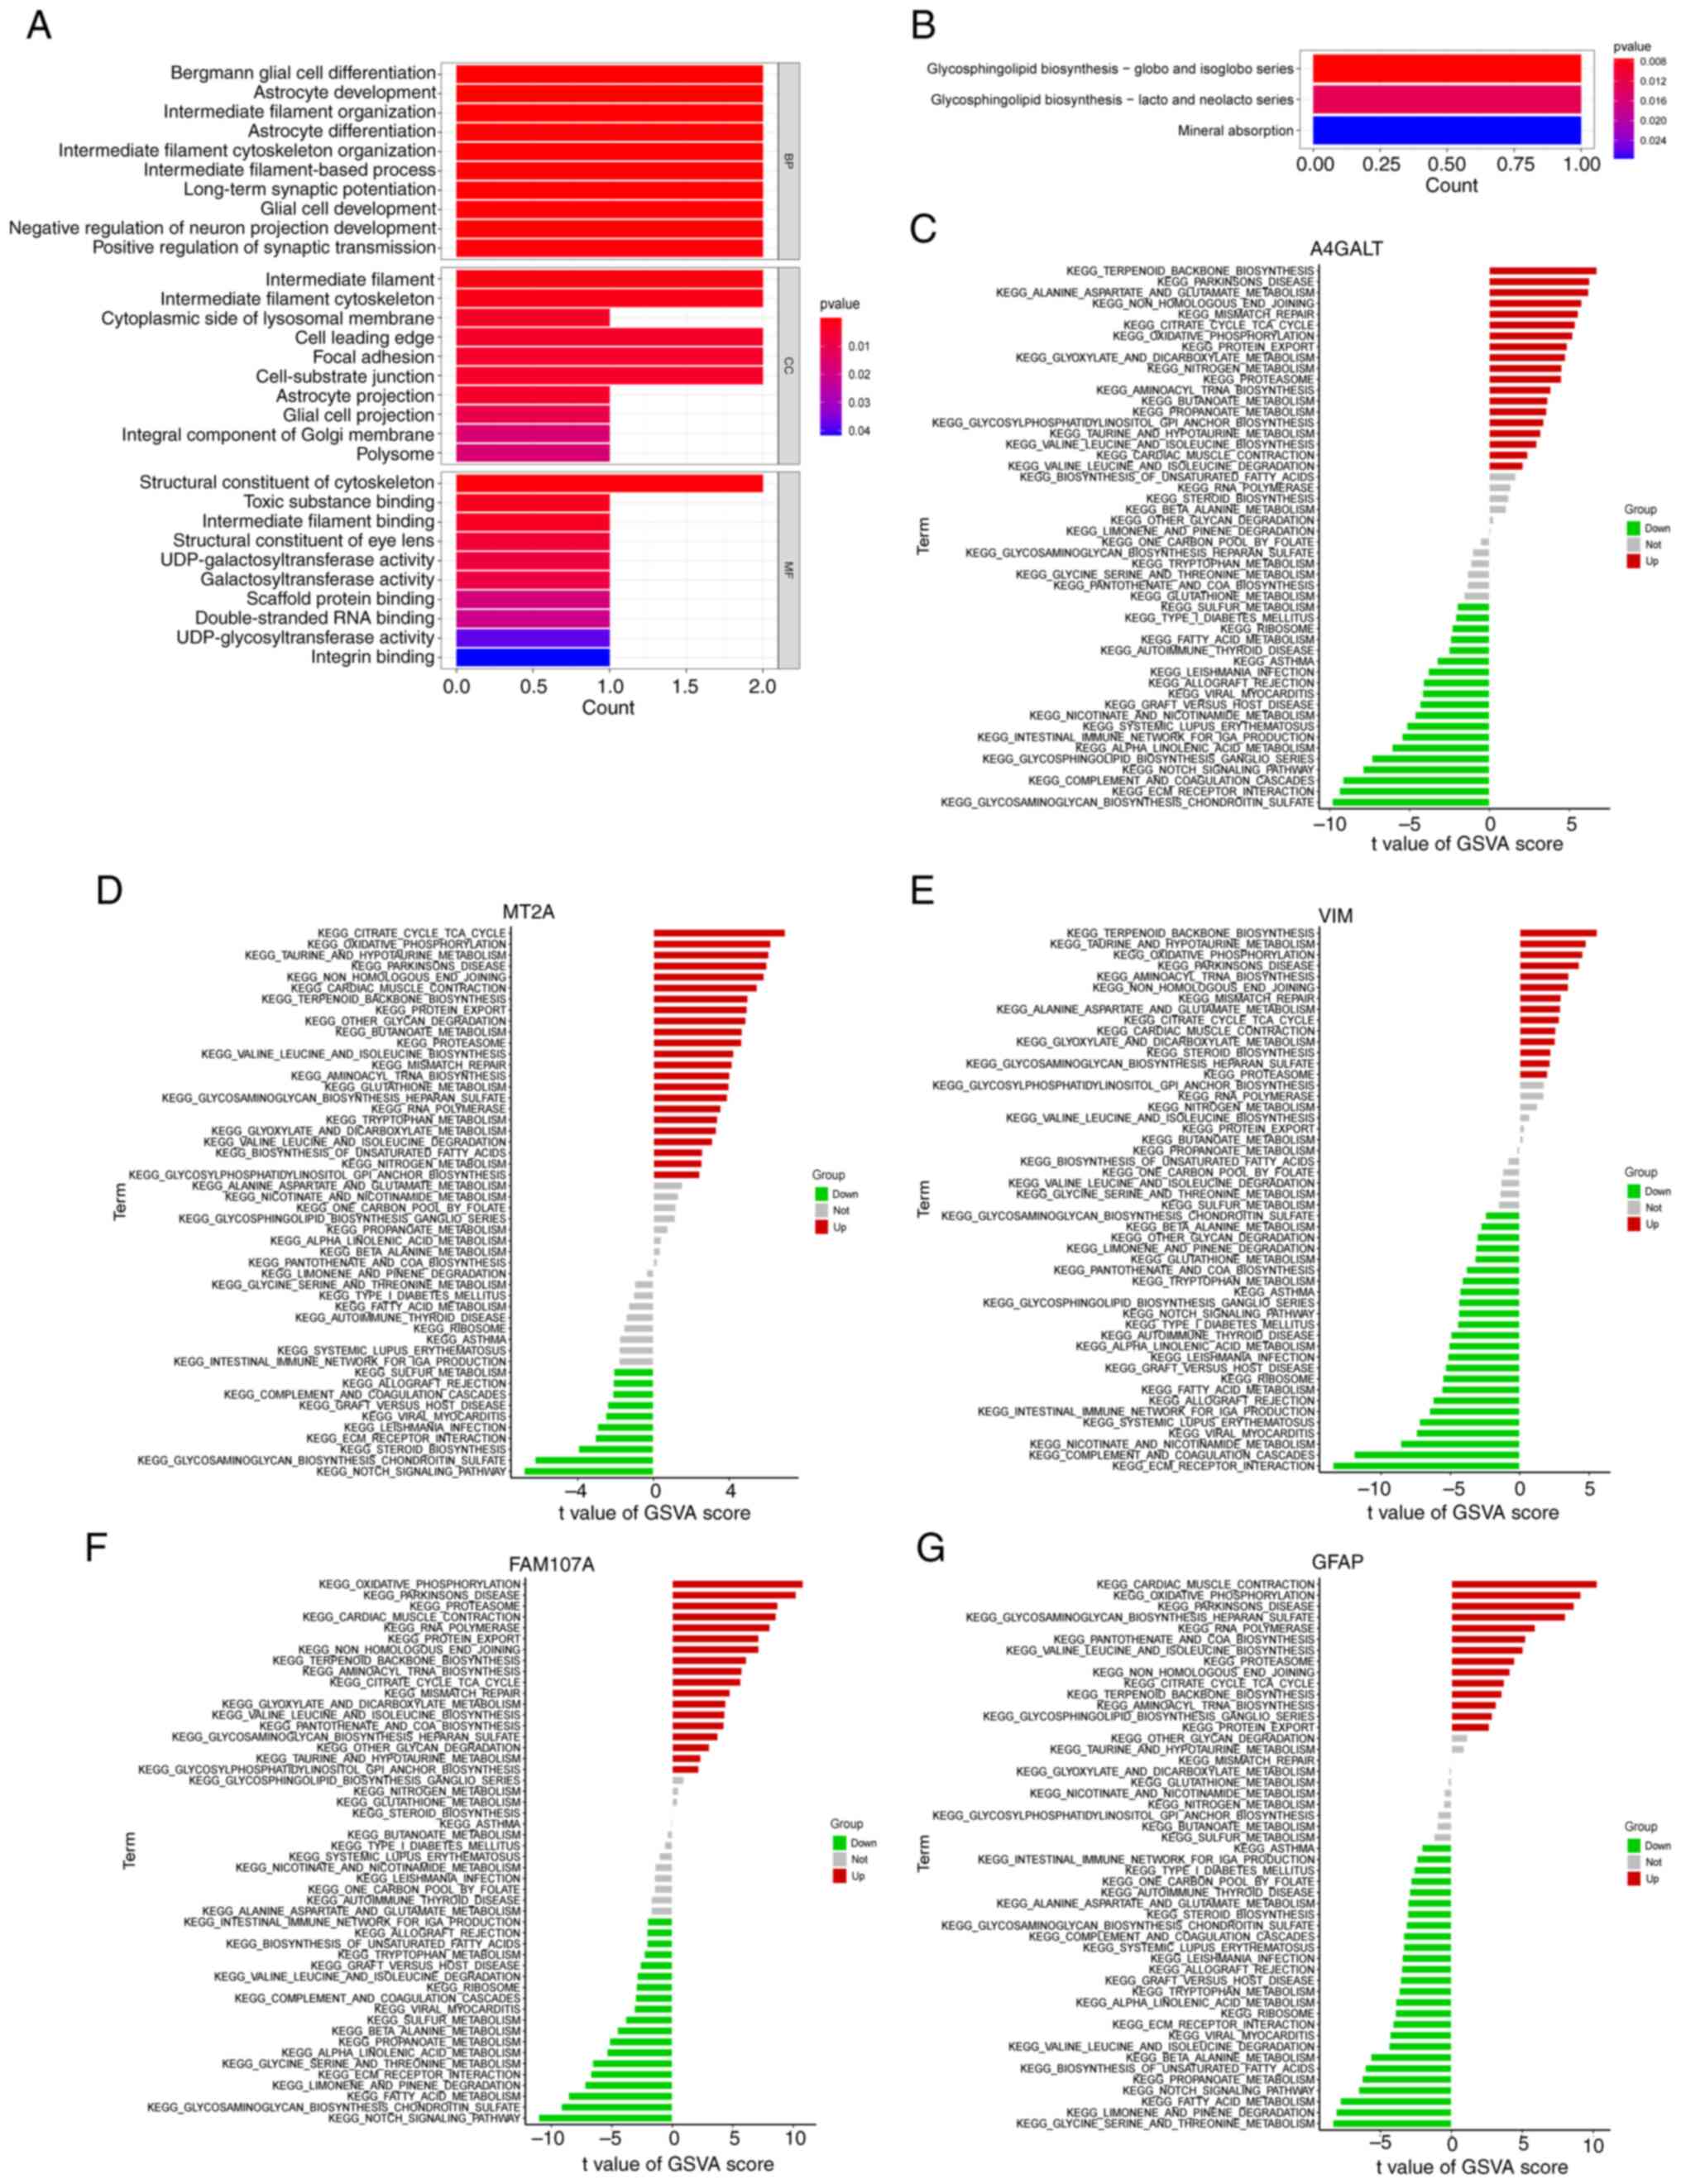 | Figure 6.Functional enrichment of FEGs. (A)
Results of GO analysis of FEGs. (B) Results of KEGG analysis of
FEGs. (C-G) Differences in marker pathway activity of A4GALT, MT2A,
VIM, FAM107A and GFAP genes between AD and normal controls sorted
by t-value of GSVA method. FEGs, ferroptosis-related genes; GO,
Gene Ontology; KEGG, Kyoto Encyclopedia of Genes and Genomes; AD,
Alzheimer's disease; GFAP, glial fibrillary acidic protein; VIM,
vimentin; MT2A, metallothionein 2A; FAM107A, family with sequence
similarity 107, member A; A4GALT, alpha
1,4-galactosyltransferase. |
Characterization of immune
infiltration of ferroptosis-related genes
The differences in immune infiltration between
patients with AD and normal samples were explored. These results
were revealed using the CIBERSORT algorithm (Fig. 7A). The results revealed that
patients with AD exhibited higher infiltration levels of T-cells
CD4 naive, T-cells CD4 memory resting, natural killer (NK) cells
resting, monocyte, macrophages M2 and neutrophil infiltration
levels. In addition, the infiltration levels of the activated
plasma cells, T-cells CD8, T-cells follicular helper and NK cells
were lower than those in the normal sample group (Fig. 7B and C). This suggested that an
alteration in the immune system may have an important relationship
with the occurrence of AD. Correlation analyses revealed that
T-cells CD4 naive significantly and positively correlated with
GFAP, FAM107A and A4GALT (Fig.
7D). NK cells resting also demonstrated significant positive
correlation with MT2A, GFAP, FAM107A and A4GALT, though they
negatively correlated with VIM. Macrophages M1 positively
correlated with VIM, GFAP, and A4GALT. Negative correlation was
noted between T-cells CD8 and VIM, GFAP and A4GALT; and NK cells
activated negatively correlated with MT2A, FAM107A and A4GALT. The
aforementioned outcomes revealed that the changes in the immune
microenvironment as a result of altered immune infiltration in
patients with AD are more likely to be involved with these five
FEGs.
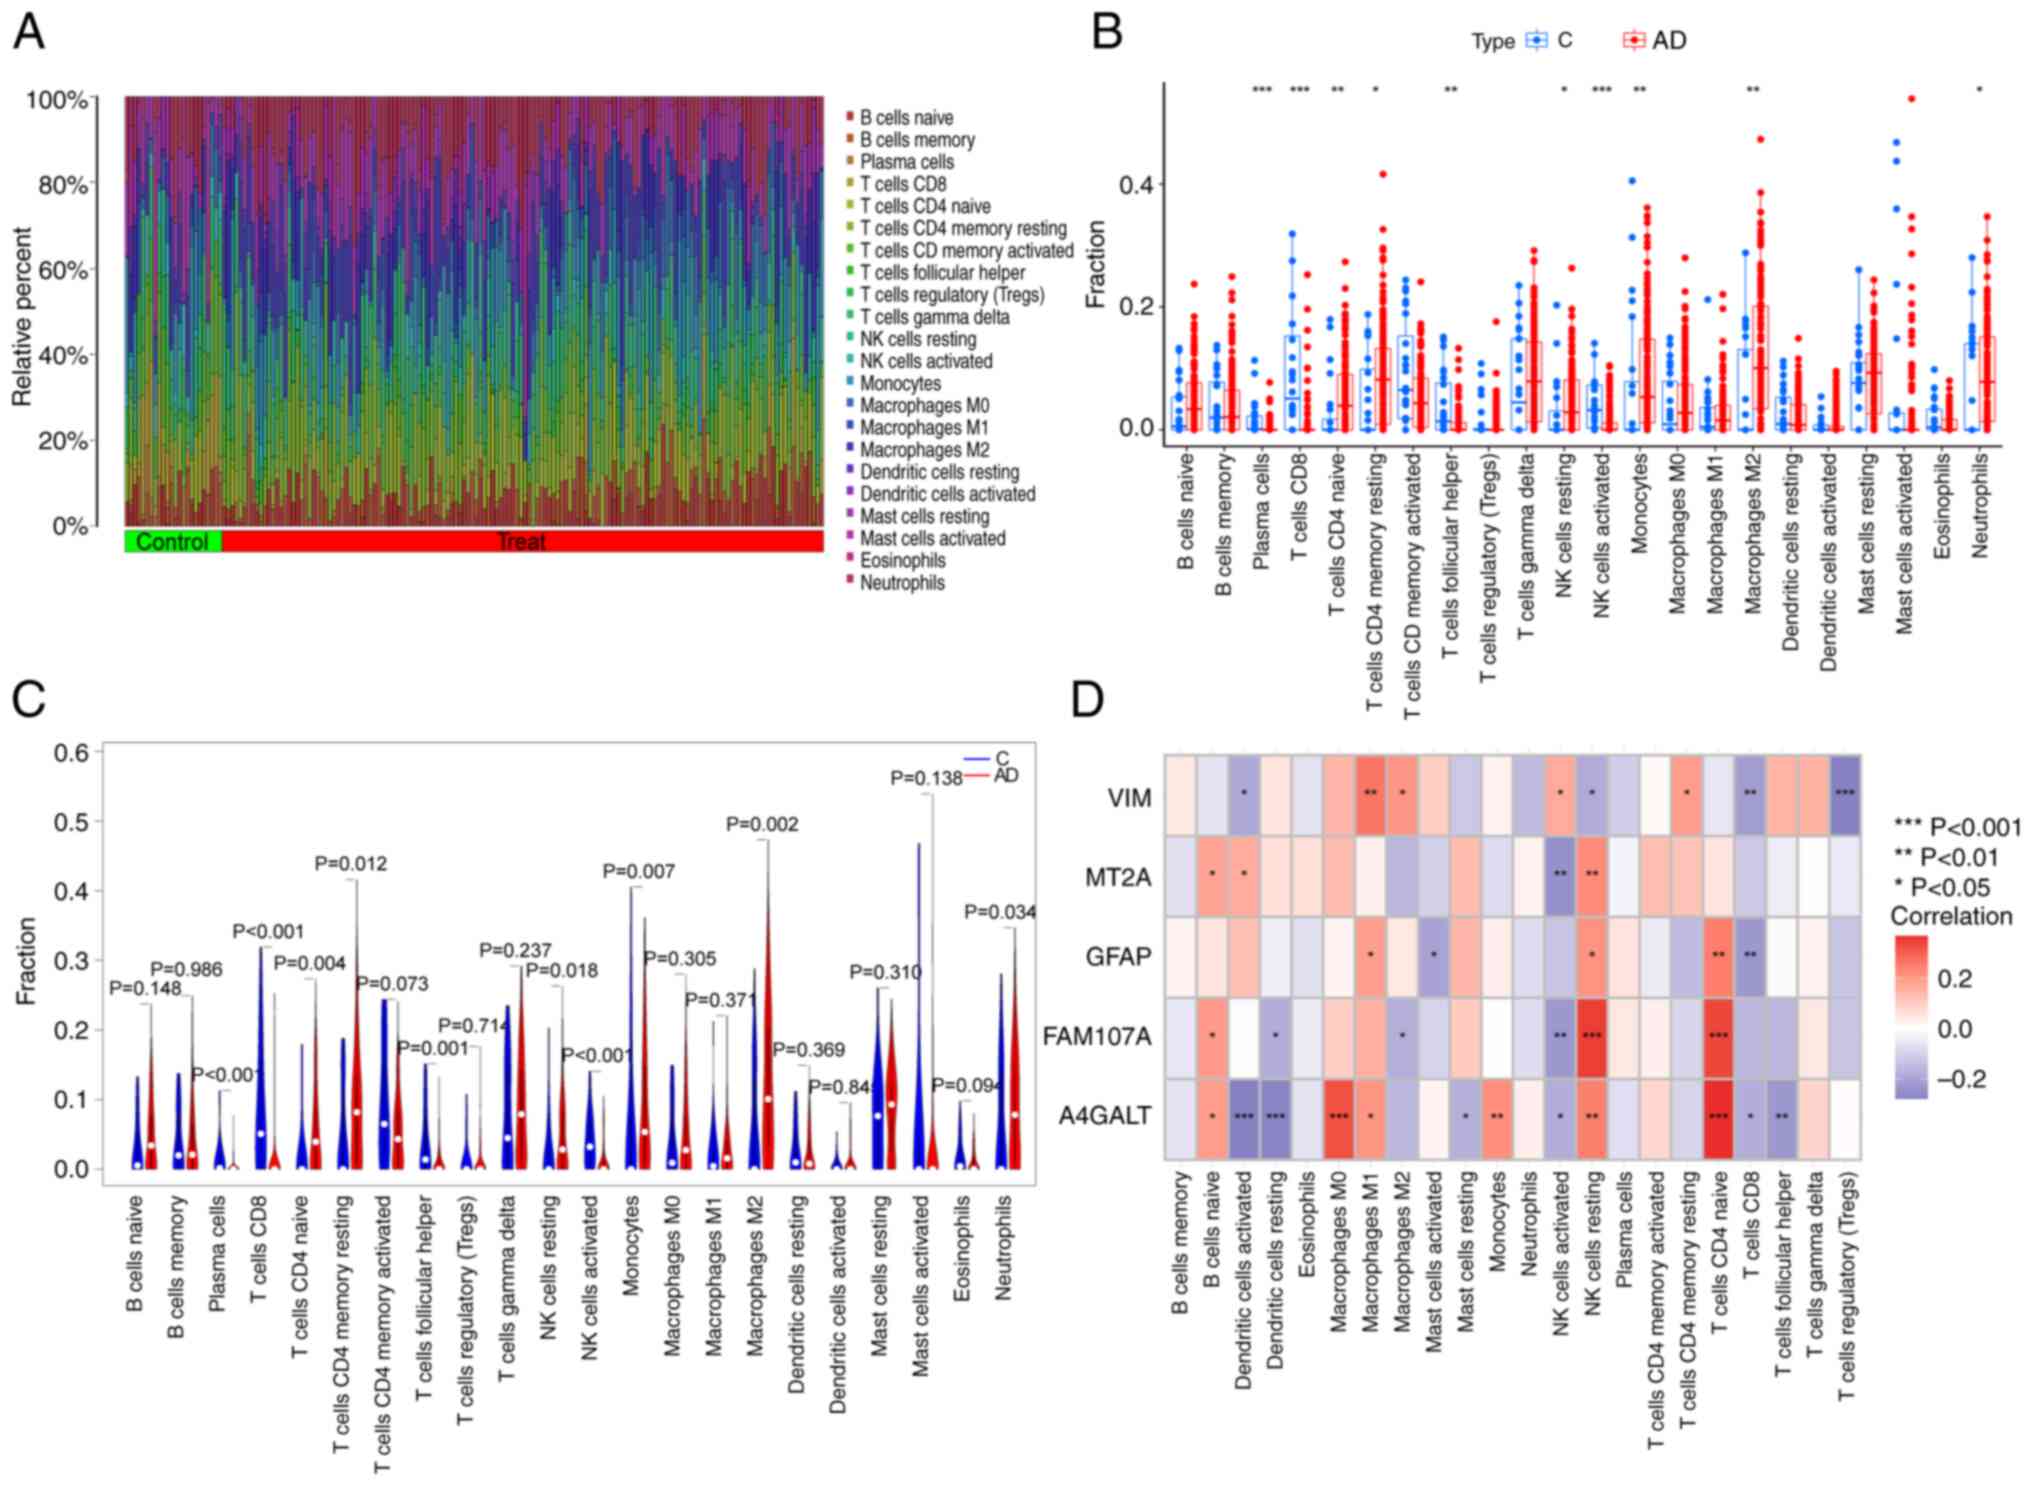 | Figure 7.Immunological characterization of
FEGs. (A) Heatmap demonstrating the relative abundance of 22
infiltrating immune cells. (B) Differences in immune infiltration
between AD and controls. (C) Specific immune infiltration
differences. (D) Correlation between FEGs and 22 types of immune
cells. *P<0.05, **P<0.01 and ***P<0.001. FEGs,
ferroptosis-related genes; C, control; AD, Alzheimer's disease; NK,
natural killer; VIM, vimentin; MT2A, Metallothionein 2A; GFAP,
Glial fibrillary acidic protein; FAM107A, family with sequence
similarity 107, member A; A4GALT, Alpha
1,4-galactosyltransferase. |
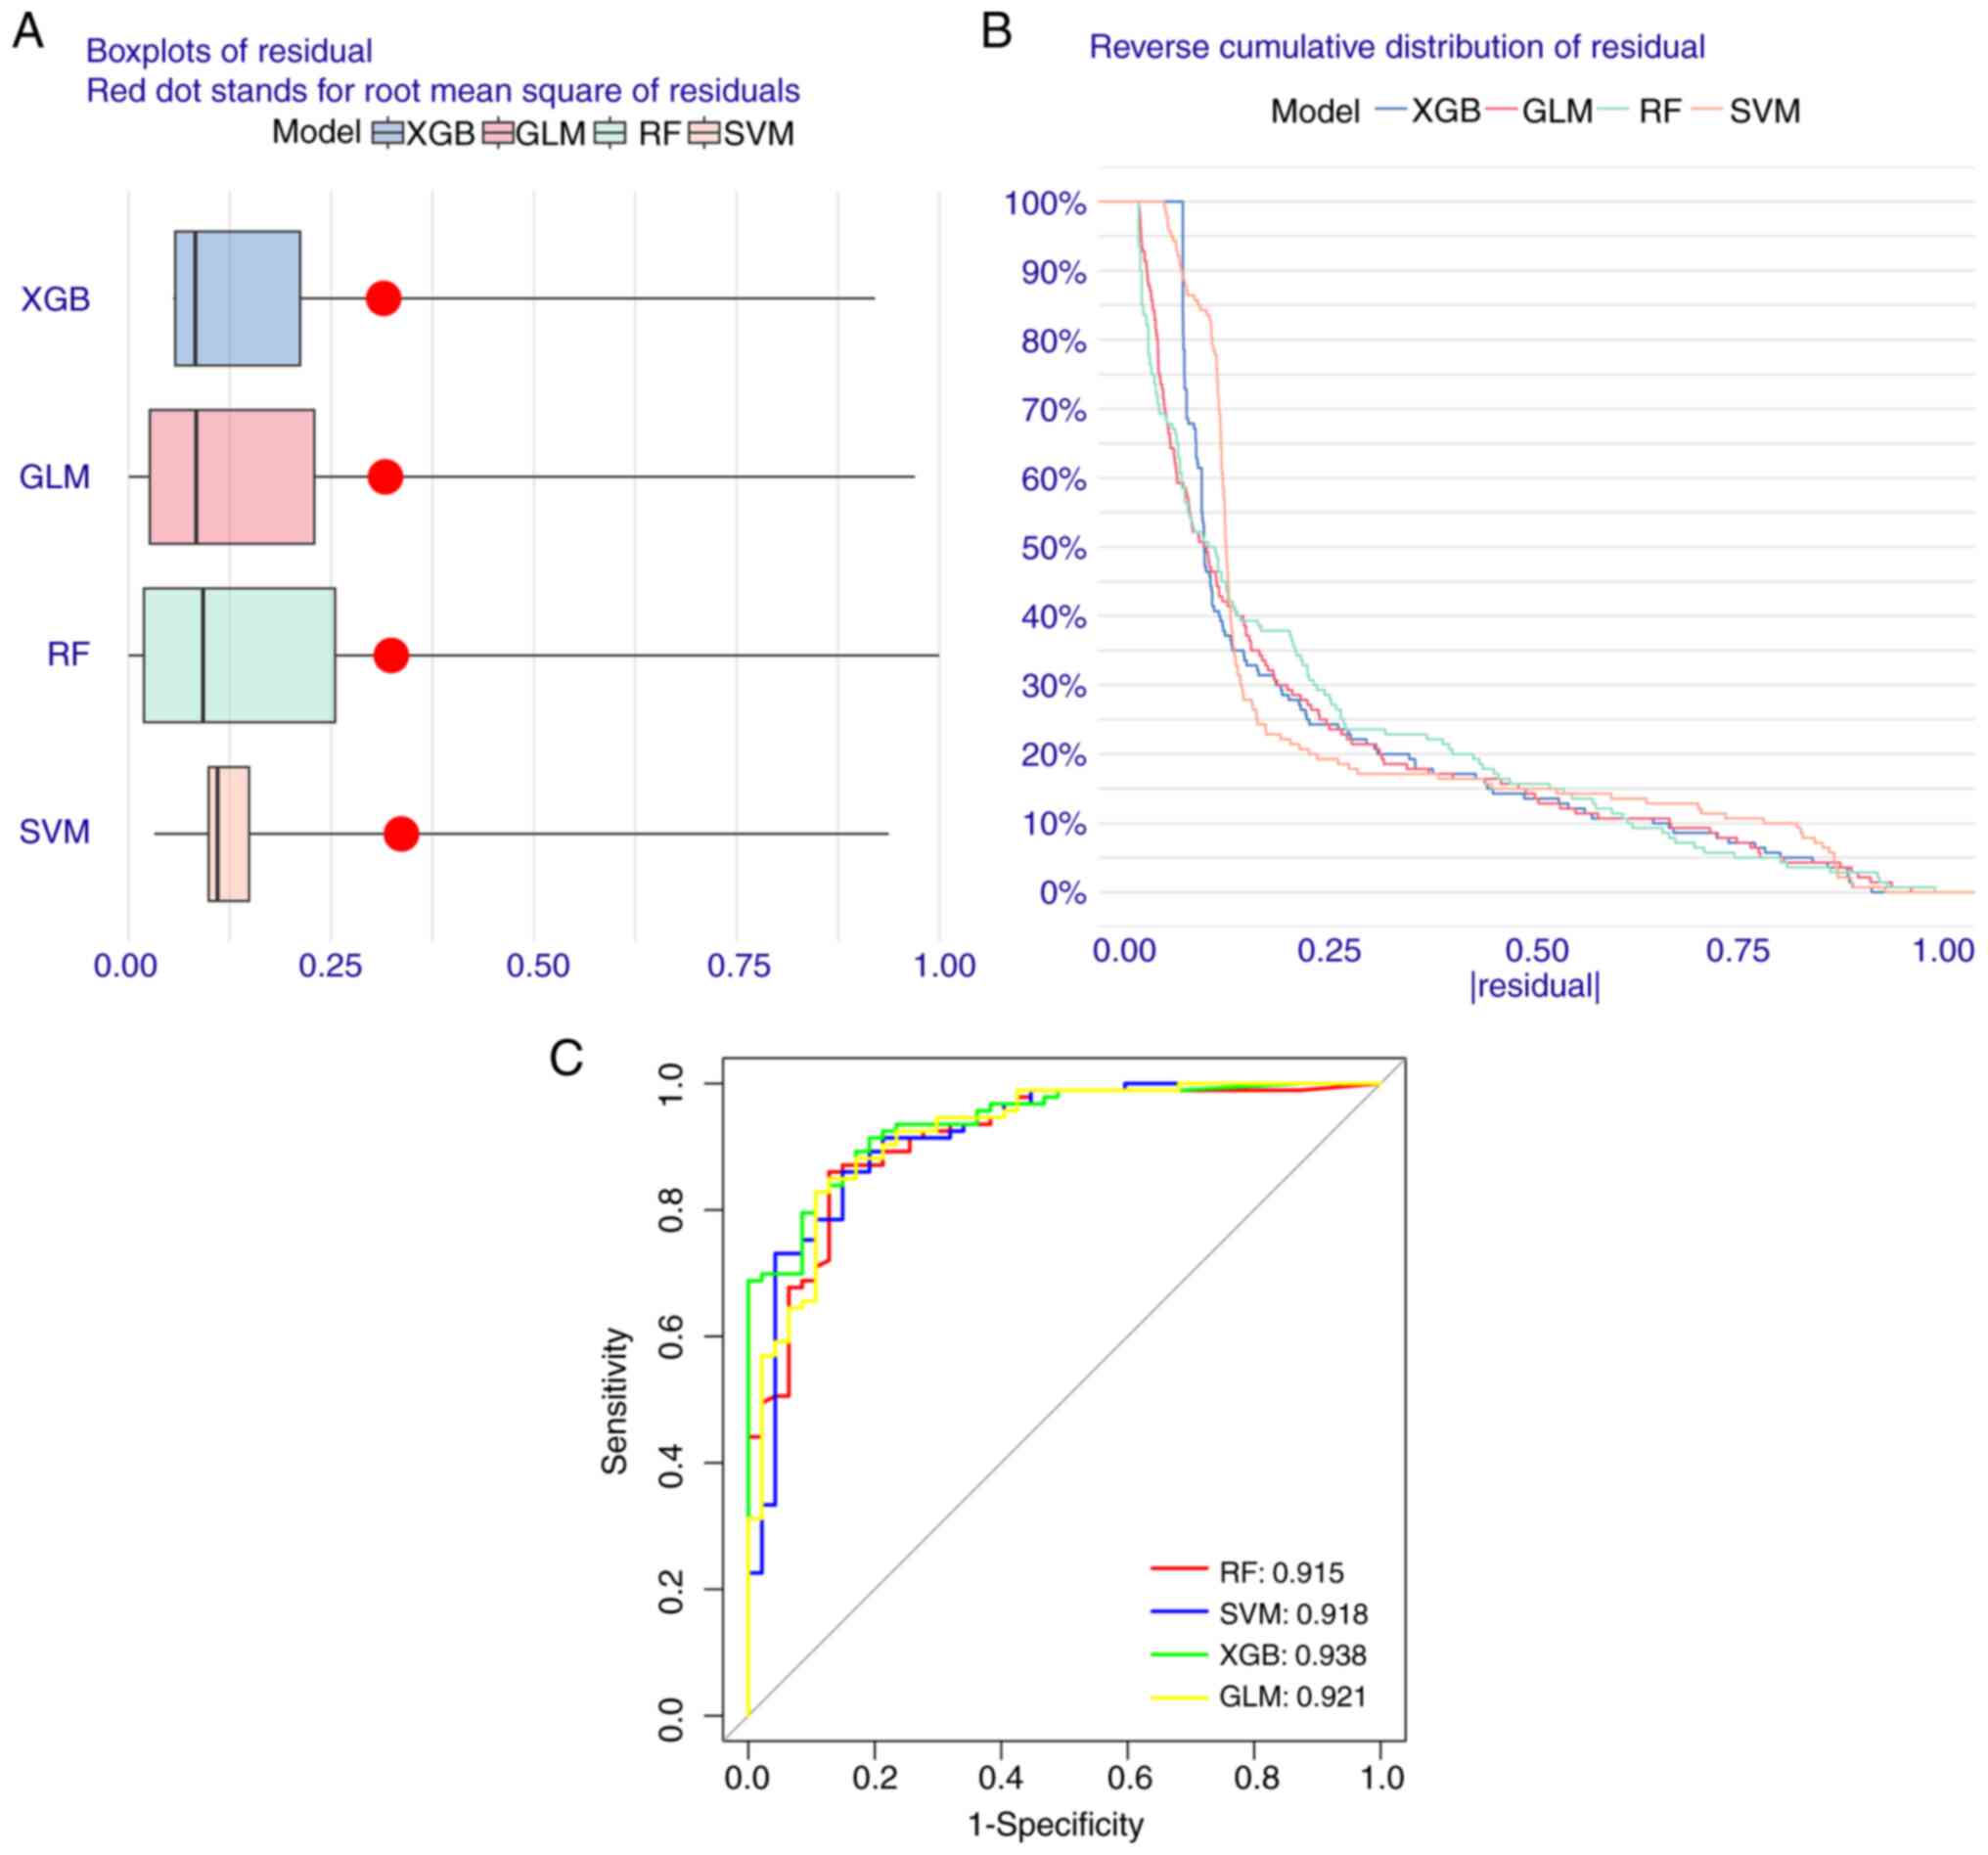
Construction of machine learning
models
To evaluate the diagnostic value of the five FEGs,
four machine learning models were constructed. The residual
distributions of each model were interpreted using the DALEX
software package. The results revealed that the residuals of all
the models were not high (Fig. 8A and
B). Moreover, the most suitable model was identified by
evaluating the discriminative performance of the four machine
learning algorithms in the test set. This was performed by
calculating the Run-of-Subjects Characterization Curve based on
five-fold cross-validation. The results were as follows: GLM,
AUC=0.921; SVM, AUC=0.918; RF, AUC=0.915; XGB, AUC=0.938 (Fig. 8C). Based on the aforementioned
results, the XGB model is more capable of further analyzing the
experiment accurately for both AD and normal group samples compared
with the rest of the modeling algorithms.
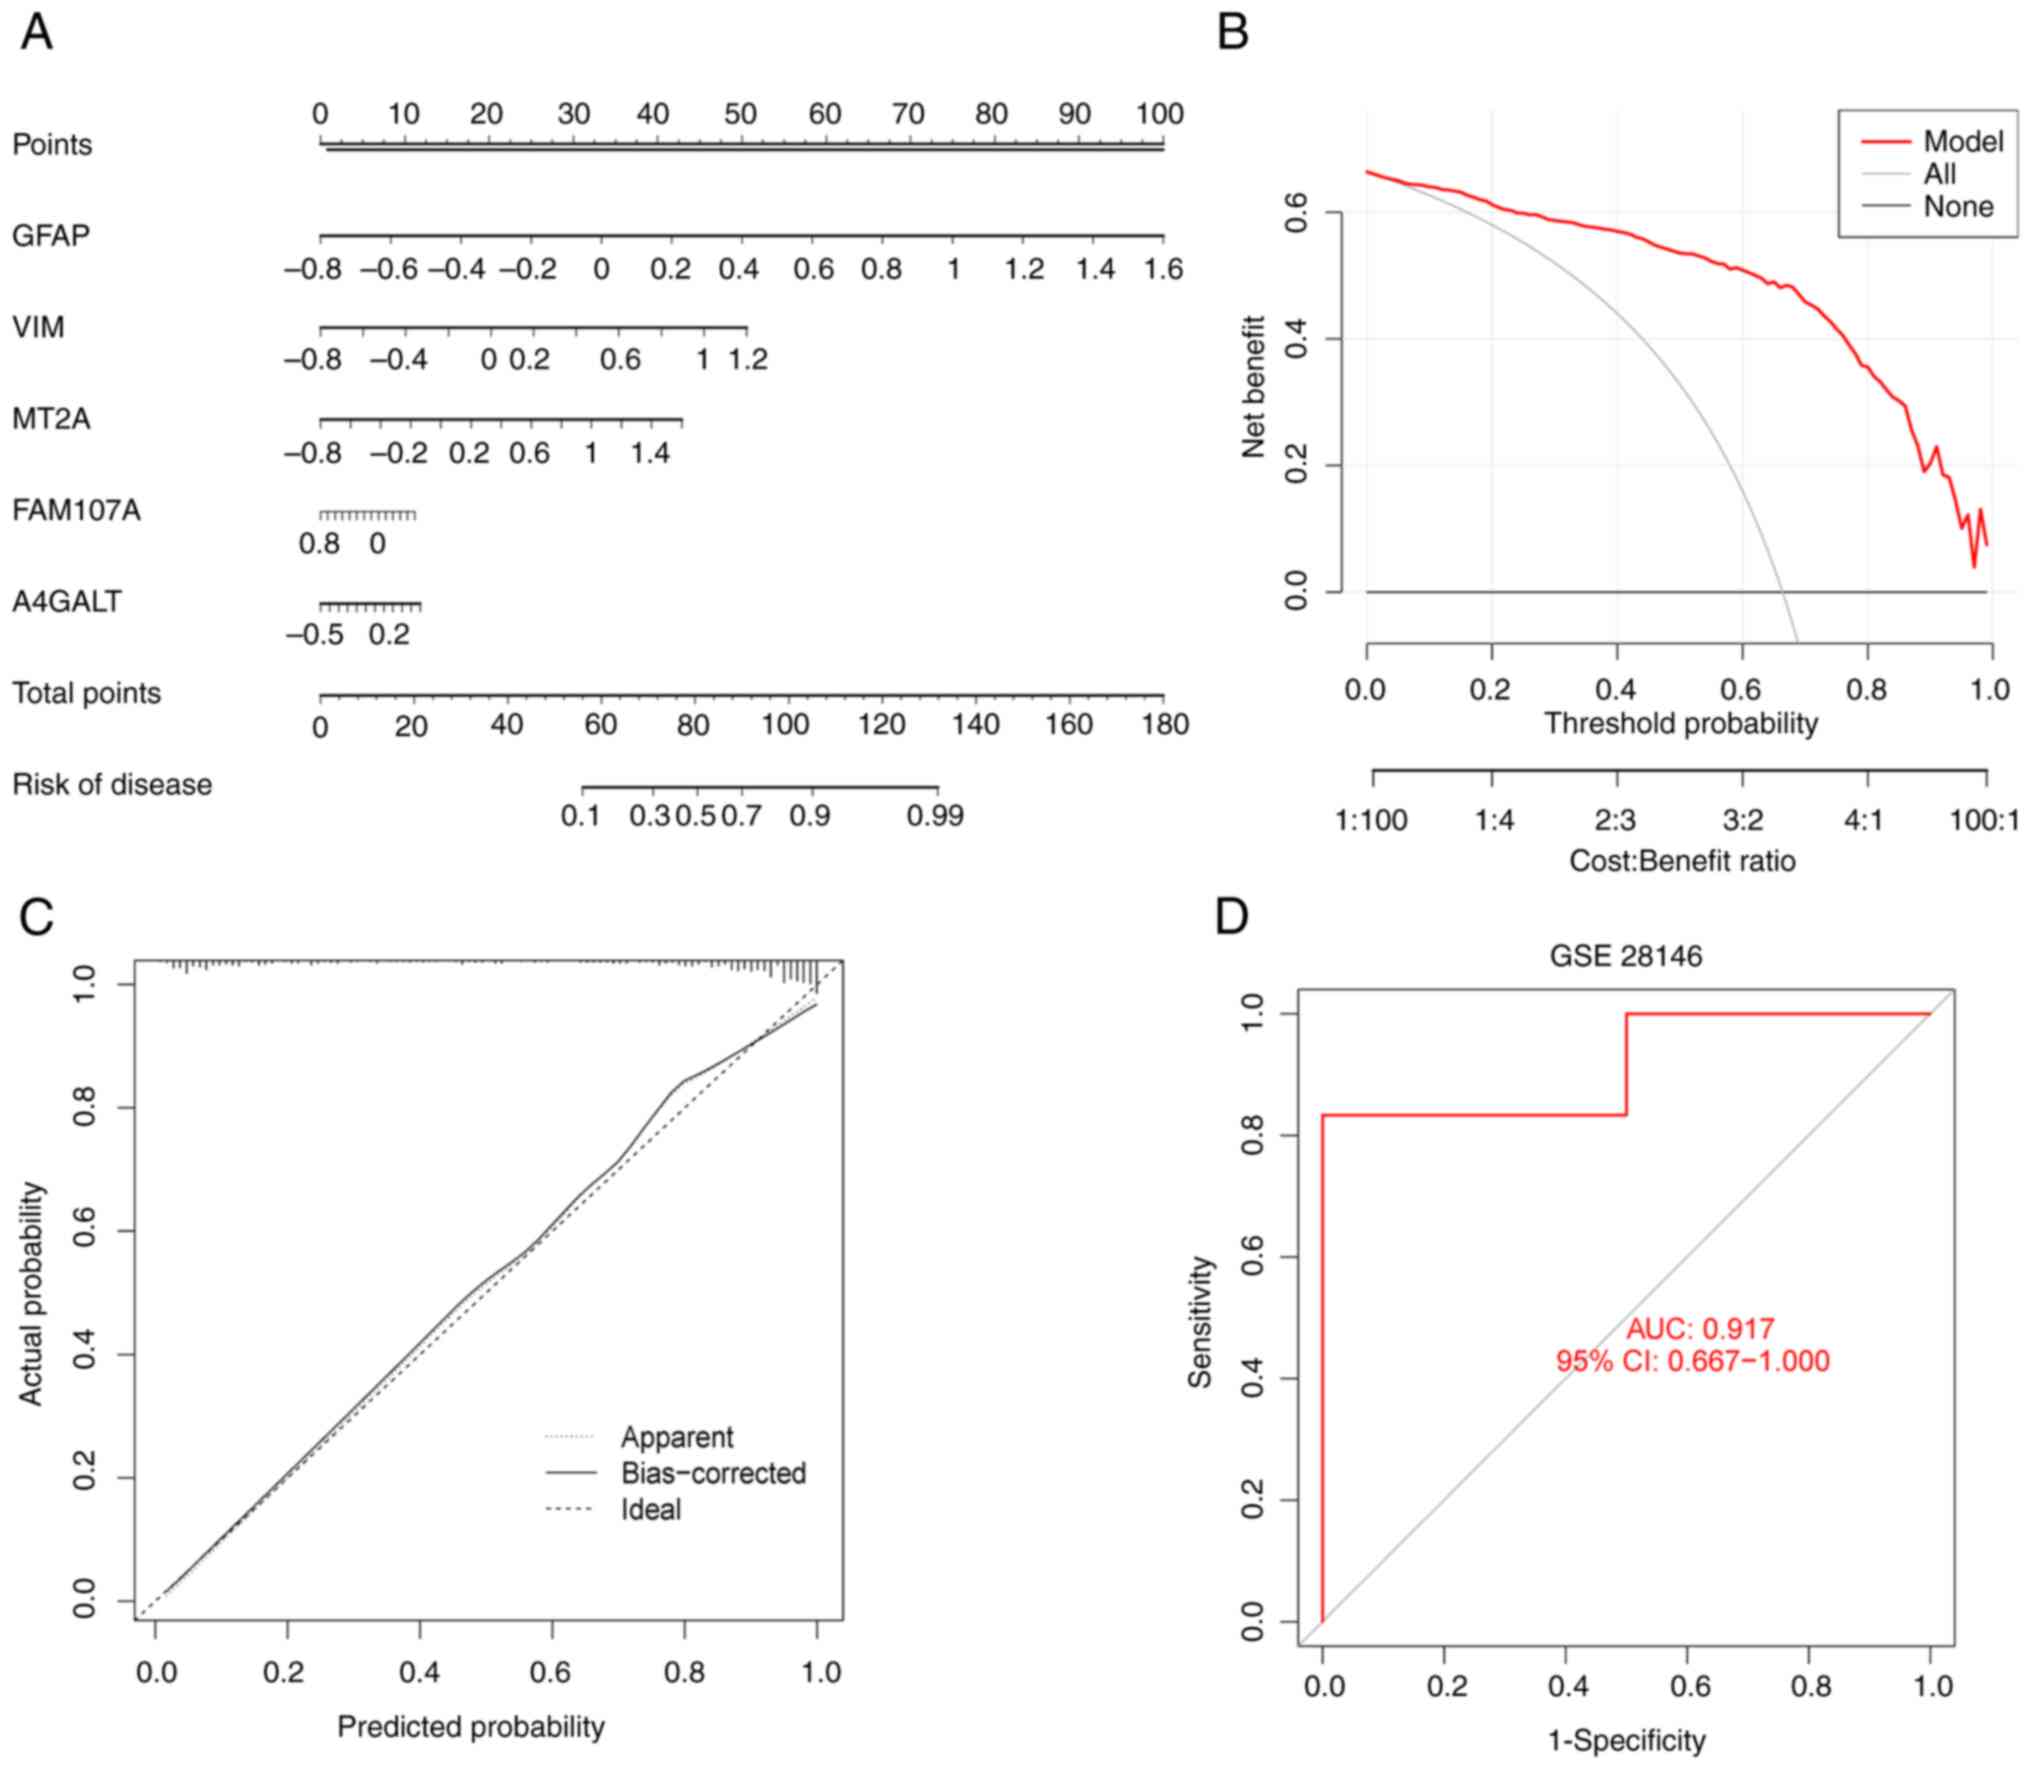
Modeling and validating the accuracy
of predictive models
To further assess the predictive power of the XGB
model, nomograms were constructed (Fig. 9A) in which each FEG has a
scale-based score to risk-score AD. The outcomes of the decision
curve (Fig. 9B) presented a higher
clinical benefit of nomograms that were established by XGB for
patients with AD, through the FEGs composite score. The calibration
curve of the nomogram (Fig. 9C)
confirmed that the error between predicted and actual risk for the
nomograms constructed using GFAP, VIM, MT2A, FAM107A and A4GALT is
very low. Finally, the accuracy of the model was validated using
the independent dataset GSE28146. The model was further validated
by the external dataset GSE28146, which is demonstrated in Fig. 9D with AUC=0.917, proving the
accuracy of our model.
Identification of CCK-8 modeling basis
and expression of 5 FEGs in the drug group and normal control
group
Observations on SH-SY5Y cells at 0, 10, 20, 40 and
80 nM OA concentrations revealed an appreciable trend, through
which the modeling drug concentration was determined to be 25 nM,
based on IC50 calculations (Fig. 10A). To further confirm the trend
of drug action, the 25 nM OA concentration was allowed to act on
the cells, and cell viability was calculated. This drug
concentration was then used to construct the AD model (Fig. 10B). Based on the results from
RT-qPCR, the expression of FEGs in the cells of the experimental
group was noted to be higher than that of the normal group
(Fig. 10C). The calculated
P-values were 0.000153 for VIM; 0.0006 for MT2A; 0.000565 for
A4GALT; 0.0004 for GFAP; and 0.000448 for FAM107A.
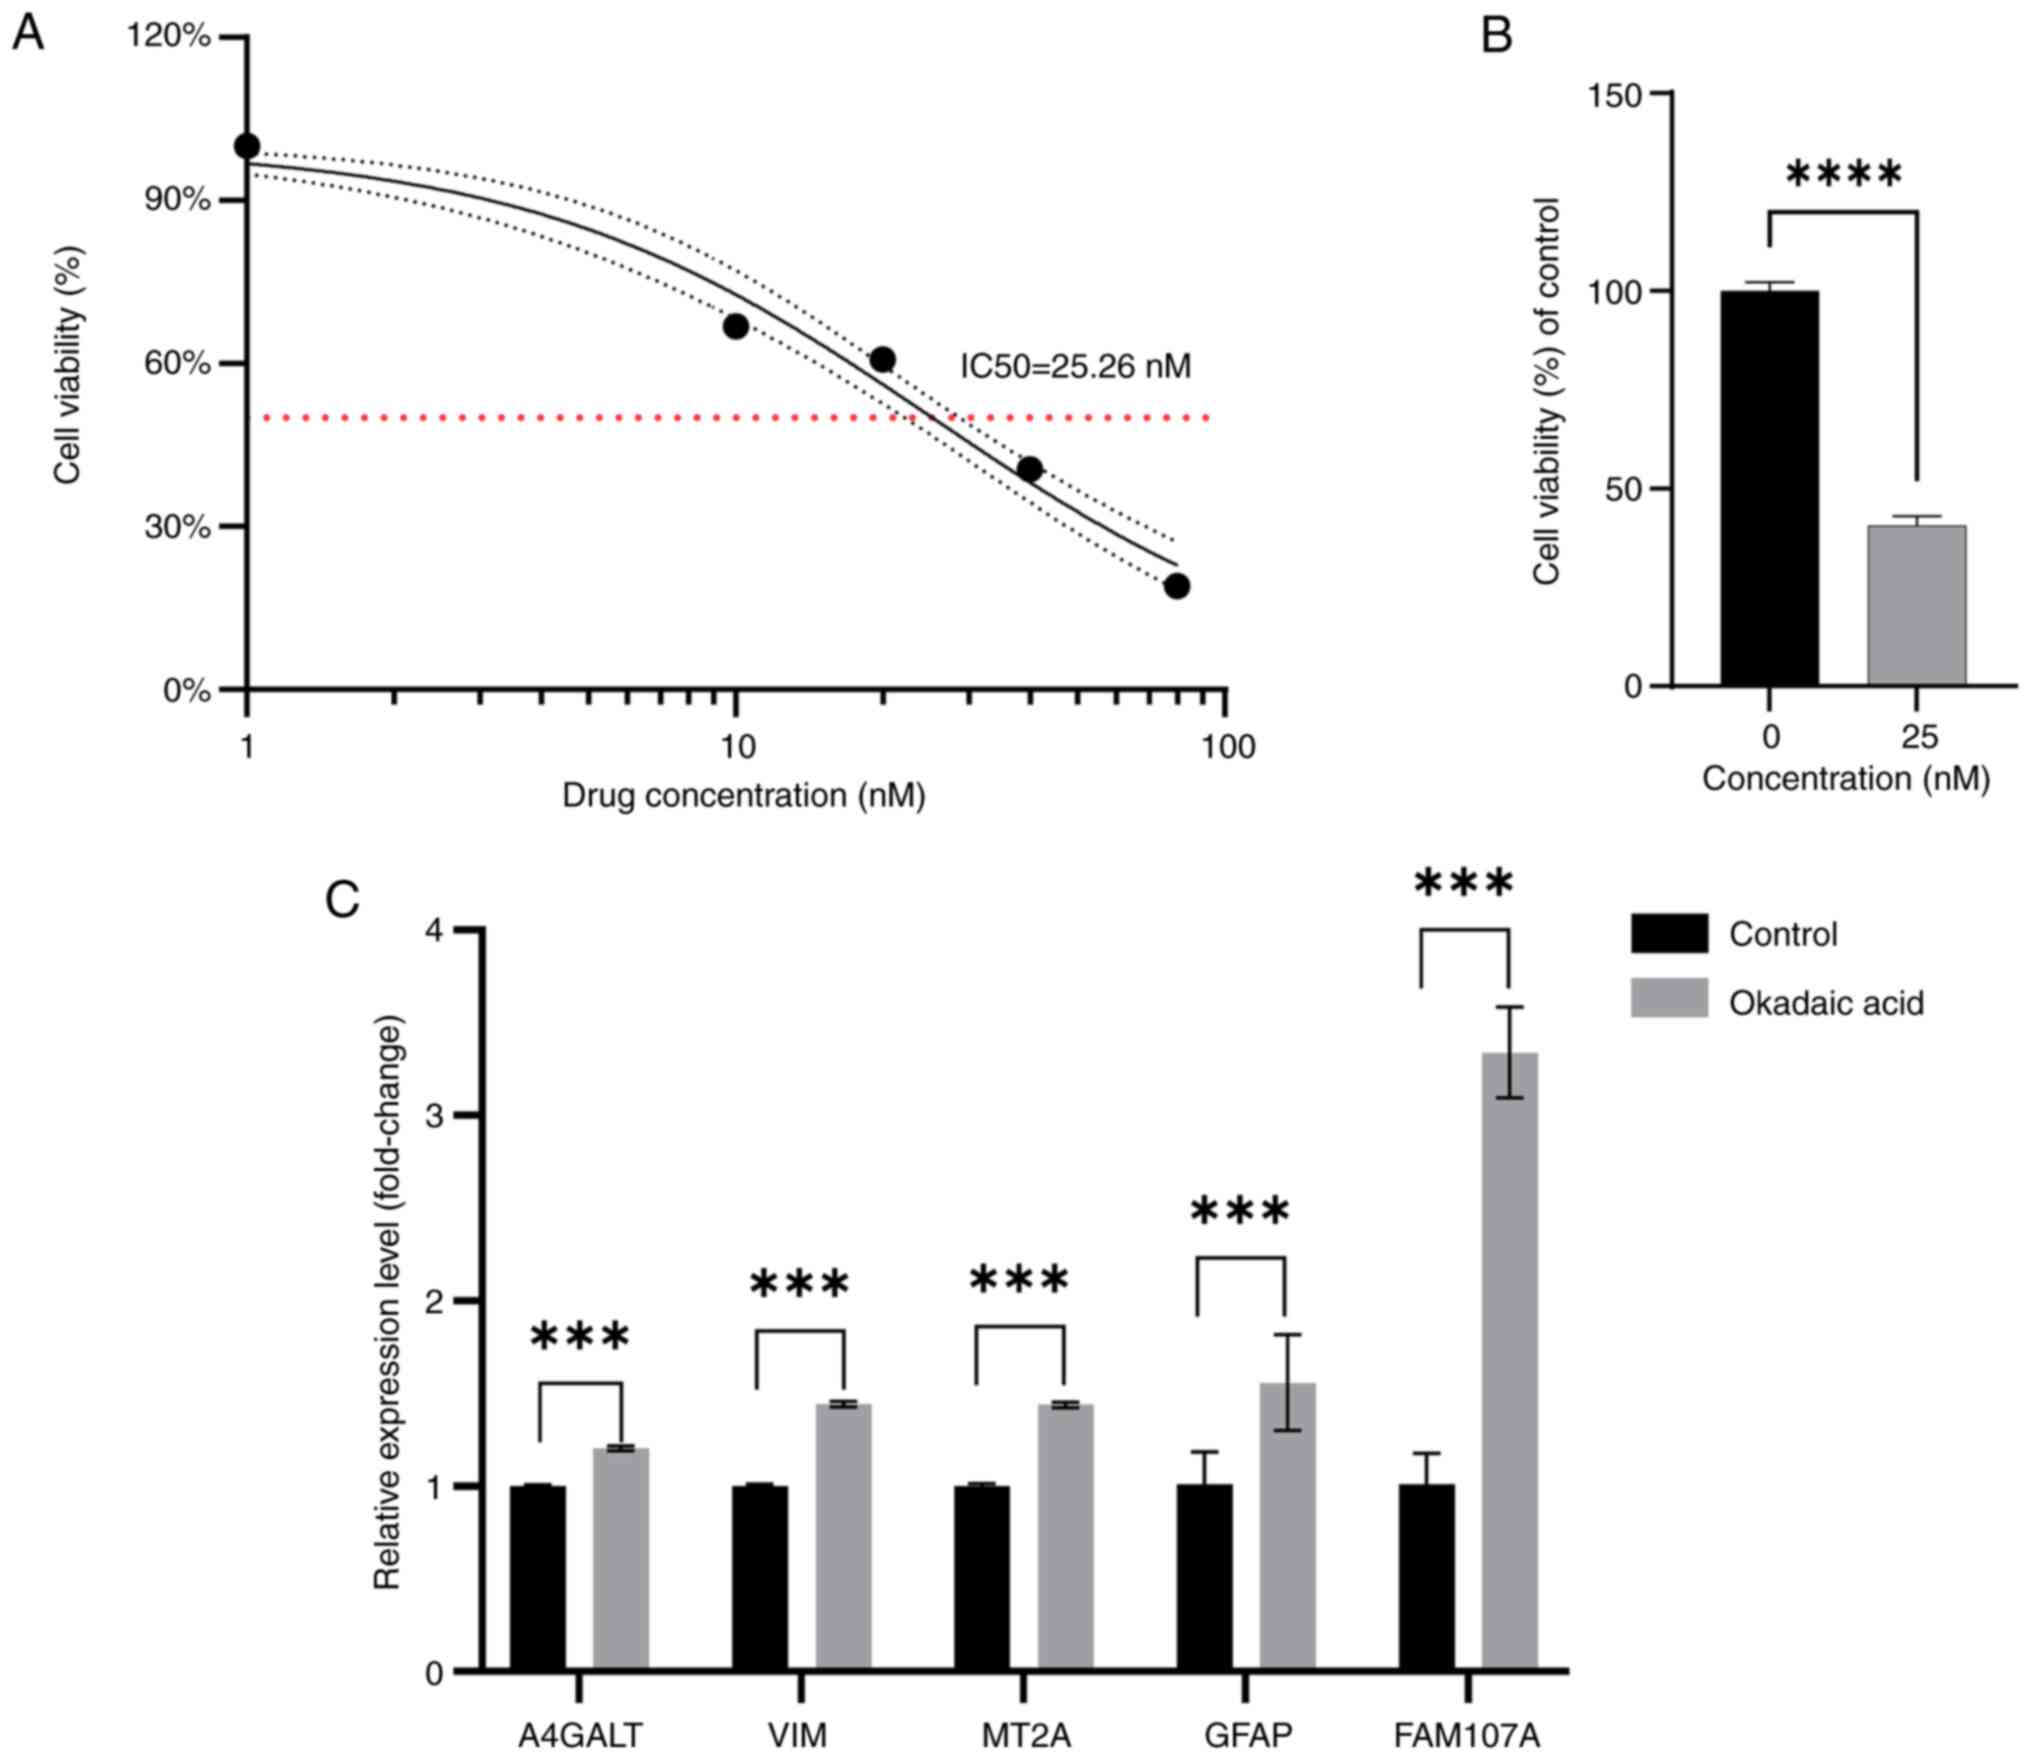 | Figure 10.Cell Counting Kit-8 and reverse
transcription-quantitative PCR. (A) Changes in cell viability after
0, 10, 20, 40 and 80 nM concentrations of OA acting on SH-SY5Y
cells. (B) Comparison of the viability of SH-SY5Y cells after the
action of 25 nM concentration of OA with the control. (C) Relative
expression levels of the mRNA of ferroptosis-related genes after 25
nM concentration of OA acting on SH-SY5Y cells compared with
control. ***P<0.001 and ****P<0.0001. OA, okadaic acid;
A4GALT, alpha 1,4-galactosyltransferase; VIM, vimentin; MT2A,
metallothionein 2A; GFAP, glial fibrillary acidic protein; FAM107A,
family with sequence similarity 107, member A. |
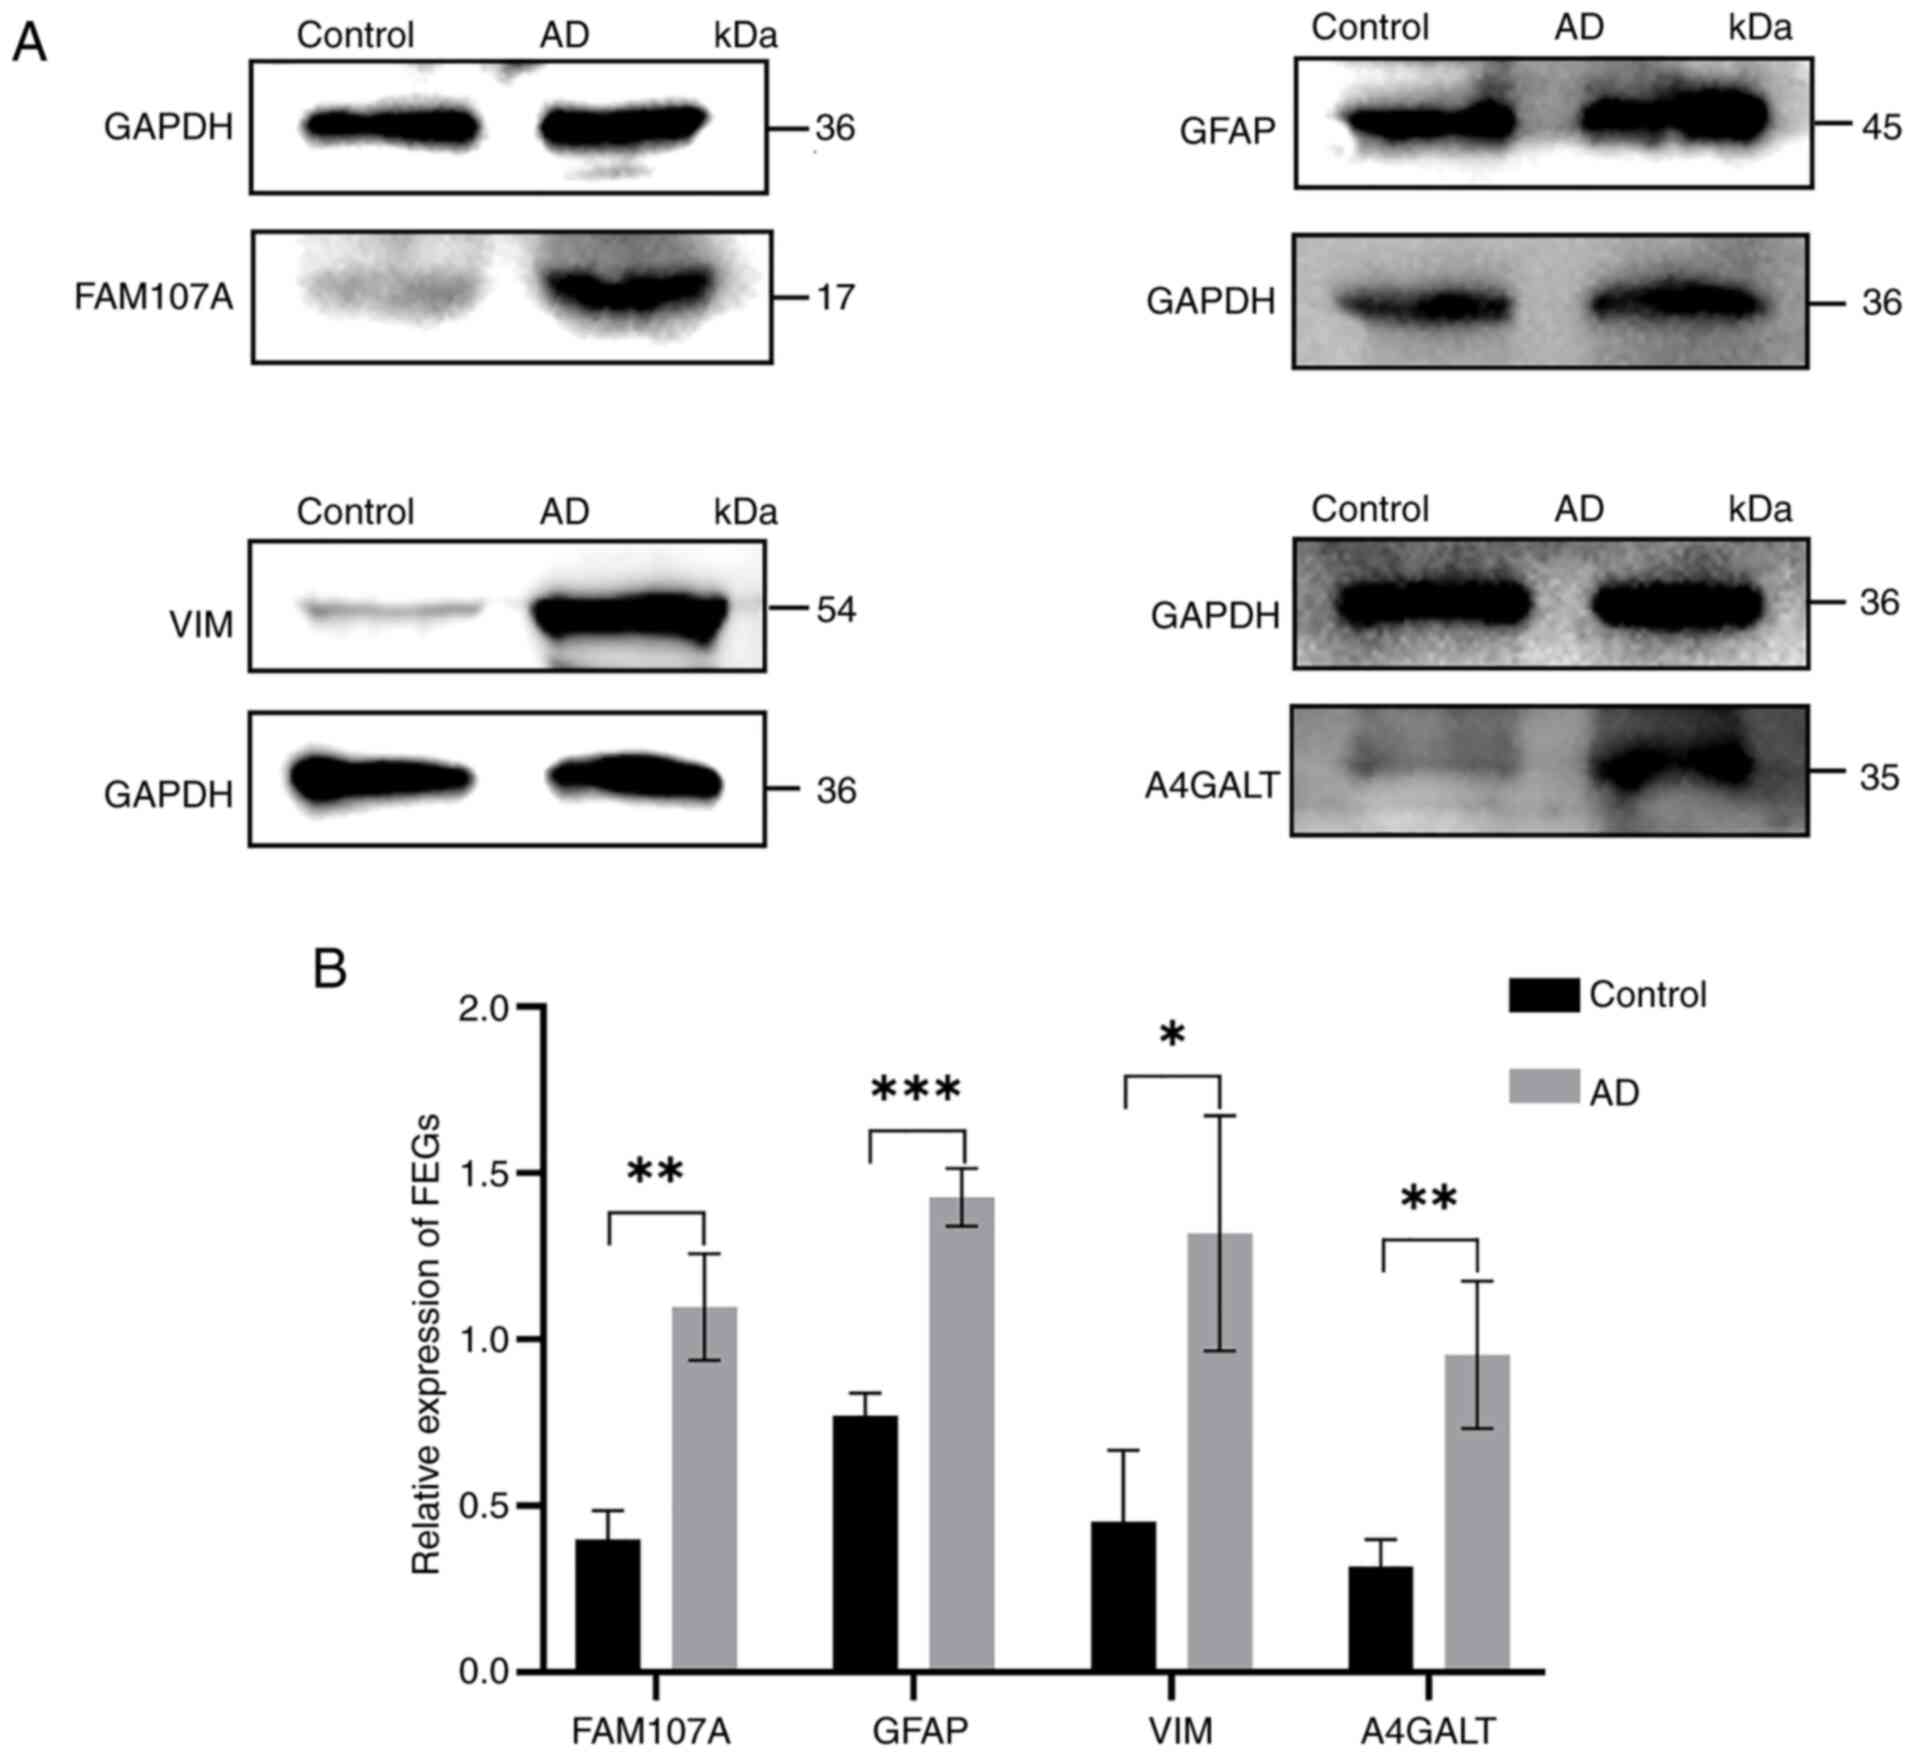
Western blot results of FEGs
Western blot results of the control and experimental
groups revealed that the protein expression of FEGs in the
experimental group was upregulated, which was consistent with the
bioinformatics prediction (Fig. 11A
and B).
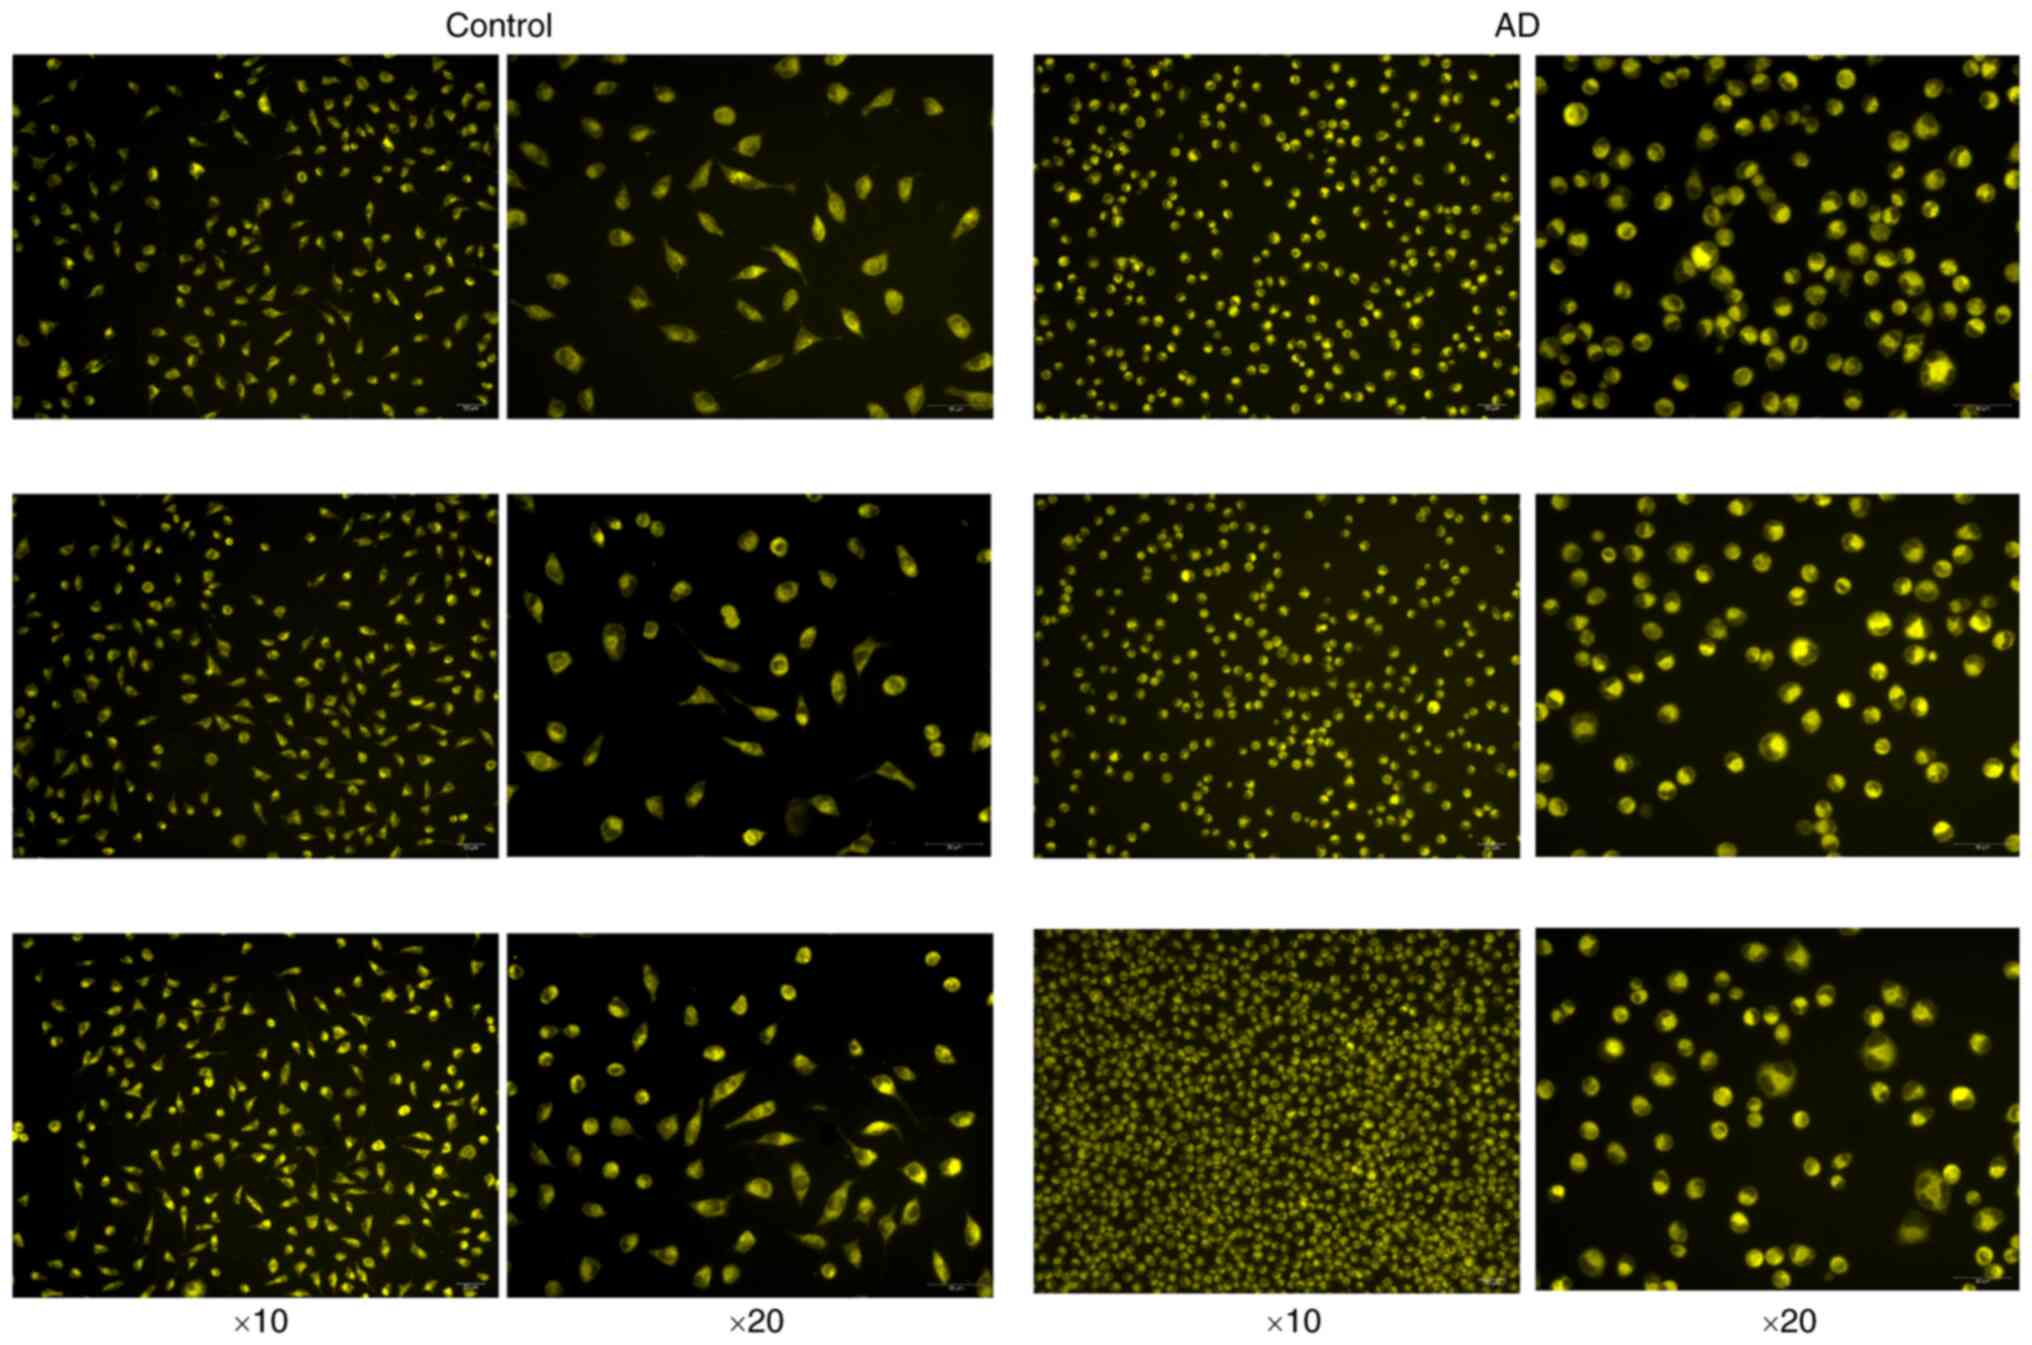
Fe2+ fluorescence
results
The fluorescence of the control group and the
experimental group is demonstrated in Fig. 12, from which it can be observed
that the cell morphology of the experimental group was changed into
an oval shape and shrunken; the fluorescence staining of the
control group was uniform and light, while the fluorescence
staining of the experimental group was aggregated and high in
brightness. It was inferred from this that the cells in the
experimental group were well modeled and had abundant
Fe2+ aggregation.
Discussion
The aggregation and deposition of iron are strongly
associated with the significant decline in memory function in
patients with the attention deficit disorder (27–29).
Previous studies have indicated that ferroptosis mechanisms may be
a potential pathogenetic mechanism for AD (30). There is evidence that the relevant
molecular patterns that are produced during iron intoxication
release inflammatory factors by inducing microglia activation,
ultimately leading to neuroinflammation (31,32).
Based on this, the abnormal accumulation of iron causes the
development of a neuroimmune response, which plays a pivotal role
in the pathogenesis of AD. Therefore, it is imperative that further
characterization of the molecular mechanisms and immunological
features of AD that correlate with ferroptosis be performed.
In a further analysis of FEGs, a correlation
analysis of FEGs and immune cells was conducted using the CIBERSORT
algorithm. The development of AD is highly associated with
activated neurons or peripheral immune inflammation in patients.
Immune cell categories infiltrated in the AD hippocampus compared
with controls demonstrated reduced plasma cells, T-cells CD8,
T-cells follicular helper, activated NK cells, T-cells CD4 naïve,
resting T-cells CD4 memory, resting NK cells, monocytes,
macrophages M2 and neutrophils increased. It was observed that
T-cells CD4 naive, resting T-cells CD4 memory, resting NK cells,
monocytes, and neutrophils were abnormally infiltrated in the AD
brain. Studies have revealed that CD4+ T-cells,
CD8+ T-cells, resting NK cells, NK cells,
monocytes-macrophages and activated dendritic cells are abnormally
infiltrated in an AD brain (33).
In addition, the inhibition of immune cells may result in the
attenuation of AD immune dysregulation and cognitive dysfunction.
Therefore, an investigation into the roles of immune cells and
inflammatory cells in AD may reveal anti-inflammatory and
immunomodulatory targets that can be used in AD therapy.
The present study obtained 65 FEGs through the KEGG
database. The five genes that highly correlated with AD were
ultimately identified through WGCNA analysis were the FEGs: GFAP,
VIM, MT2A, FAM107A and A4GALT. A4GALT, GFAP and FAM107A have been
studied in the development of AD, but little research has been
conducted on VIM and MT2A. Apparently, only a few studies have
confirmed the association of VIM and MT2A with AD (34,35).
The results of the investigation suggested that polymorphisms in
A4GALT modulate the abundance of the substrate di-hexosyl-ceramide
d18:1/24:0, and other related variants of A4GALT that are
associated with Parkinson's disease (36). Defective insulin-like growth factor
1 (IGF-1) signaling is a key factor in AD. A previous study
suggested that GFAP may have an important influence in IGF-1
signaling in AD disease (37).
Nevertheless, the precise nature of the relationship between AD and
other factors remains unclear, and further research is required to
elucidate these associations. In conjunction with algorithmic
analysis, the function of FEGs was further analyzed. It was
observed that almost all the genes were involved in glial cell
differentiation, as well as astrocyte development and
differentiation. Results from Gene Set Enrichment Analysis revealed
that GFAP, VIM, MT2A, FAM107A and A4GALT are involved in regulating
oxidative phosphorylation and citric acid cycle pathways through
some complex mechanisms.
Finally, a diagnostic model for AD was constructed
using the FEGs and its accuracy was validated in an external
dataset. In addition, a nomogram was created to assess the risk of
AD using FEGs scores. The calibration curve revealed excellent
concordance between predicted and actual observations. The DCA
revealed that nomogram will result in higher benefits for patients
with AD, suggesting improved application results. FEGs by SH-SY5Y
cells were validated using RT-qPCR and western blotting and the
validation results were consistent with the results of difference
analysis.
However, there are some limitations to the present
study. First, the findings revealed a relevant link between
ferroptosis and AD; however the mechanism of action of the FEGs
that lead to AD still needs further investigation. Moreover, the
mechanisms associated with AD treatment also require further
research. For example, whether manipulating specific iron apoptosis
genes can preserve neurodegeneration in patients with AD or not,
remains unknown. Understanding the possible mechanisms behind AD,
ferroptosis, and their interrelationships provides new insights
into the prevention and treatment of AD.
In summary, the relationship between five FEGs and
AD was investigated using bioinformatics techniques. Immune cells
were more strongly expressed in AD, suggesting that they may be
critical for the immune microenvironment. However, further studies
are needed to explore their specific effects. In addition, based on
regression analysis, a prognostic model was constructed that can be
used to analyze the development of AD by detecting the expression
of FEGs.
Acknowledgements
Not applicable.
Funding
The present study was supported (grant no. 81860709) by the
National Natural Science Foundation of China Regional Fund Project
‘Intervention Mechanism of Stilbene Glycosides on Abnormal
Phosphorylation of tau Proteins in Alzheimer's Disease’.
Availability of data and materials
The data generated in the present study may be
requested from the corresponding author. Information on all
specimens analyzed was obtained from the GEO public database
(ascension nos. GSE33000 and GSE28146), and all information in this
database is publicly available.
Authors' contributions
ZX and WLL contributed to the concept and design of
the present study and wrote the first draft of the manuscript. ZX,
RH and WLL were involved in designing the study, acquisition and
analysis of the experimental data, in addition they contributed to
the drafting and editorial revision process of the manuscript. ZX,
RH and WLL confirm the authenticity of all the raw data. RH and XXH
organized the experimental procedures and participated in the
revisions. ZX, WLL and XXH performed the statistical analyses. MYD
performed data acquisition, organization and supervision of all
experimental procedures, participated in the preparation of the
original manuscript, revised the manuscript, and ultimately
approved the manuscript for publication and editing. ZSH designed
the study, participated in the acquisition, organization and
critical review of the data, edited and revised the intellectual
content of the manuscript, provided general supervision, and
ultimately approved the manuscript for publication and editing. All
authors participated in the revision of the manuscript, and read
and approved the final manuscript.
Ethics approval and consent to
participate
Not applicable.
Patient consent for publication
Not applicable.
Competing interests
The authors declare that they have no competing
interests.
Glossary
Abbreviations
Abbreviations:
|
AD
|
Alzheimer's disease
|
|
GEO
|
Gene Expression Omnibus
|
|
WGCNA
|
weighted gene co-expression network
analysis
|
|
FEGs
|
ferroptosis-related genes
|
|
GSH
|
glutathione
|
|
PET
|
positron emission tomography
|
|
TOM
|
topological overlap matrix
|
|
ROC
|
receiver operating characteristic
|
|
GSVA
|
gene set variation analysis
|
|
GFAP
|
glial fibrillary acidic protein
|
|
VIM
|
vimentin
|
|
MT2A
|
metallothionein 2A
|
|
FAM107A
|
family with sequence similarity 107,
member A
|
|
A4GALT
|
alpha 1,4-galactosyltransferase
|
|
DCA
|
decision curve analysis
|
|
AUC
|
area under the curve
|
|
OA
|
okadaic acid
|
|
HBSS
|
Hank's balanced salt solution
|
|
TCA
|
tricarboxylic acid
|
|
NK
|
natural killer
|
|
IGF-1
|
insulin-like growth factor 1
|
References
|
1
|
Yu Q and Zhong C: Membrane aging as the
real culprit of Alzheimer's disease: Modification of a hypothesis.
Neurosci Bull. 34:369–381. 2018. View Article : Google Scholar : PubMed/NCBI
|
|
2
|
Scheltens P, De Strooper B, Kivipelto M,
Holstege H, Chételat G, Teunissen CE, Cummings J and van der Flier
WM: Alzheimer's disease. Lancet. 397:1577–1590. 2021. View Article : Google Scholar : PubMed/NCBI
|
|
3
|
Lane CA, Hardy J and Schott JM:
Alzheimer's disease. Eur J Neurol. 25:59–70. 2018. View Article : Google Scholar : PubMed/NCBI
|
|
4
|
Schneider AR and Sari Y: Therapeutic
perspectives of drugs targeting toll-like receptors based on immune
physiopathology theory of Alzheimer's disease. CNS Neurol Disord
Drug Targets. 13:909–920. 2014. View Article : Google Scholar : PubMed/NCBI
|
|
5
|
Simard AR, Soulet D, Gowing G, Julien JP
and Rivest S: Bone marrow-derived microglia play a critical role in
restricting senile plaque formation in Alzheimer's disease. Neuron.
49:489–502. 2006. View Article : Google Scholar : PubMed/NCBI
|
|
6
|
McKhann GM, Knopman DS, Chertkow H, Hyman
BT, Jack CR Jr, Kawas CH, Klunk WE, Koroshetz WJ, Manly JJ, Mayeux
R, et al: The diagnosis of dementia due to Alzheimer's disease:
Recommendations from the National Institute on Aging-Alzheimer's
Association workgroups on diagnostic guidelines for Alzheimer's
disease. Alzheimers Dement. 7:263–269. 2011. View Article : Google Scholar : PubMed/NCBI
|
|
7
|
Fernández-Mendívil C, Arreola MA,
Hohsfield LA, Green KN and Lopez MG: Aging and progression of
beta-amyloid pathology in Alzheimer's disease correlates with
microglial heme-oxygenase-1 overexpression. Antioxidants (Basel).
9:6442020. View Article : Google Scholar : PubMed/NCBI
|
|
8
|
Zhang XD, Liu ZY, Wang MS, Guo YX, Wang
XK, Luo K, Huang S and Li RF: Ferroptosis, iron metabolism, lipid
metabolism, Alzheimer ferroptosis. Front Immunol. 14:12694512023.
View Article : Google Scholar : PubMed/NCBI
|
|
9
|
Stockwell BR, Friedmann Angeli JP, Bayir
H, Bush AI, Conrad M, Dixon SJ, Fulda S, Gascón S, Hatzios SK,
Kagan VE, et al: Ferroptosis: A regulated cell death nexus linking
metabolism, redox biology, and disease. Cell. 171:273–285. 2017.
View Article : Google Scholar : PubMed/NCBI
|
|
10
|
Ma H, Dong Y, Chu Y, Guo Y and Li L: The
mechanisms of ferroptosis and its role in alzheimer's disease.
Front Mol Biosci. 9:9650642022. View Article : Google Scholar : PubMed/NCBI
|
|
11
|
Smith MA, Zhu X, Tabaton M, Liu G, McKeel
DW Jr, Cohen ML, Wang X, Siedlak SL, Dwyer BE, Hayashi T, et al:
Increased iron and free radical generation in preclinical Alzheimer
disease and mild cognitive impairment. J Alzheimers Dis.
19:363–372. 2010. View Article : Google Scholar : PubMed/NCBI
|
|
12
|
Shimohama S: Apoptosis in Alzheimer's
disease-an update. Apoptosis. 5:9–16. 2000. View Article : Google Scholar : PubMed/NCBI
|
|
13
|
Nixon RA and Yang DS: Autophagy failure in
Alzheimer's disease-locating the primary defect. Neurobiol Dis.
43:38–45. 2011. View Article : Google Scholar : PubMed/NCBI
|
|
14
|
Caccamo A, Branca C, Piras IS, Ferreira E,
Huentelman MJ, Liang WS, Readhead B, Dudley JT, Spangenberg EE,
Green KN, et al: Necroptosis activation in Alzheimer's disease. Nat
Neurosci. 20:1236–1246. 2017. View
Article : Google Scholar : PubMed/NCBI
|
|
15
|
Tan MS, Tan L, Jiang T, Zhu XC, Wang HF,
Jia CD and Yu JT: Amyloid-β induces NLRP1-dependent neuronal
pyroptosis in models of Alzheimer's disease. Cell Death Dis.
5:e13822014. View Article : Google Scholar : PubMed/NCBI
|
|
16
|
Yang L and Nao J: Ferroptosis: A potential
therapeutic target for Alzheimer's disease. Rev Neurosci.
34:573–598. 2022. View Article : Google Scholar : PubMed/NCBI
|
|
17
|
Narayanan M, Huynh JL, Wang K, Yang X, Yoo
S, McElwee J, Zhang B, Zhang C, Lamb JR, Xie T, et al: Common
dysregulation network in the human prefrontal cortex underlies two
neurodegenerative diseases. ol Syst Biol. 10:7432014.PubMed/NCBI
|
|
18
|
Blalock EM, Buechel HM, Popovic J, Geddes
JW and Landfield PW: Microarray analyses of laser-captured
hippocampus reveal distinct gray and white matter signatures
associated with incipient Alzheimer's disease. J Chem Neuroanat.
42:118–126. 2011. View Article : Google Scholar : PubMed/NCBI
|
|
19
|
Langfelder P and Horvath S: WGCNA: An R
package for weighted correlation network analysis. BMC
Bioinformatics. 9:5592008. View Article : Google Scholar : PubMed/NCBI
|
|
20
|
Newman AM, Liu CL, Green MR, Gentles AJ,
Feng W, Xu Y, Hoang CD, Diehn M and Alizadeh AA: Robust enumeration
of cell subsets from tissue expression profiles. Nat Methods.
12:453–457. 2015. View Article : Google Scholar : PubMed/NCBI
|
|
21
|
Amonruttanapun P, Chongthammakun S and
Chamniansawat S: The effects of okadaic acid-treated SH-SY5Y cells
on microglia activation and phagocytosis. Cell Biol Int.
46:234–242. 2022. View Article : Google Scholar : PubMed/NCBI
|
|
22
|
de Medeiros LM, De Bastiani MA, Rico EP,
Schonhofen P, Pfaffenseller B, Wollenhaupt-Aguiar B, Grun L,
Barbé-Tuana F, Zimmer ER, Castro MAA, et al: Cholinergic
differentiation of human neuroblastoma SH-SY5Y cell line and its
potential use as an in vitro model for Alzheimer's disease studies.
Mol Neurobiol. 56:7355–7367. 2019. View Article : Google Scholar : PubMed/NCBI
|
|
23
|
Livak KJ and Schmittgen TD: Analysis of
relative gene expression data using real-time quantitative PCR and
the 2(-Delta Delta C(T)) method. Methods. 25:402–408. 2001.
View Article : Google Scholar : PubMed/NCBI
|
|
24
|
Wang F, Jia Y, Liu J, Zhai J, Cao N, Yue
W, He H and Pei X: Dental pulp stem cells promote regeneration of
damaged neuron cells on the cellular model of Alzheimer's disease.
Cell Biol Int. 41:639–650. 2017. View Article : Google Scholar : PubMed/NCBI
|
|
25
|
Kamat PK, Rai S, Swarnkar S, Shukla R and
Nath C: Molecular and cellular mechanism of okadaic acid
(OKA)-induced neurotoxicity: A novel tool for Alzheimer's disease
therapeutic application. Mol Neurobiol. 50:852–865. 2014.
View Article : Google Scholar : PubMed/NCBI
|
|
26
|
Maltsev DI, Aniol VA, Golden MA, Petrina
AD, Belousov VV, Gulyaeva NV and Podgorny OV: Aging modulates the
ability of quiescent radial glia-like stem cells in the hippocampal
dentate gyrus to be recruited into division by pro-neurogenic
stimuli. Mol Neurobiol. 61:3461–3476. 2024. View Article : Google Scholar : PubMed/NCBI
|
|
27
|
Singh D: Astrocytic and microglial cells
as the modulators of neuroinflammation in Alzheimer's disease. J
Neuroinflammation. 19:2062022. View Article : Google Scholar : PubMed/NCBI
|
|
28
|
Good PF, Perl DP, Bierer LM and Schmeidler
J: Selective accumulation of aluminum and iron in the
neurofibrillary tangles of Alzheimer's disease: A laser microprobe
(LAMMA) study. Ann Neurol. 31:286–292. 1992. View Article : Google Scholar : PubMed/NCBI
|
|
29
|
Ayton S, Wang Y, Diouf I, Schneider JA,
Brockman J, Morris MC and Bush AI: Brain iron is associated with
accelerated cognitive decline in people with Alzheimer pathology.
Mol Psychiatry. 25:2932–2941. 2020. View Article : Google Scholar : PubMed/NCBI
|
|
30
|
Derry PJ, Hegde ML, Jackson GR, Kayed R,
Tour JM, Tsai AL and Kent TA: Revisiting the intersection of
amyloid, pathologically modified tau and iron in Alzheimer's
disease from a ferroptosis perspective. Prog Neurobiol.
184:1017162020. View Article : Google Scholar : PubMed/NCBI
|
|
31
|
Tsatsanis A, McCorkindale AN, Wong BX,
Patrick E, Ryan TM, Evans RW, Bush AI, Sutherland GT,
Sivaprasadarao A, Guennewig B and Duce JA: The acute phase protein
lactoferrin is a key feature of Alzheimer's disease and predictor
of Aβ burden through induction of APP amyloidogenic processing. Mol
Psychiatry. 26:5516–5531. 2021. View Article : Google Scholar : PubMed/NCBI
|
|
32
|
Mi Y, Gao X, Xu H, Cui Y, Zhang Y and Gou
X: The emerging roles of ferroptosis in Huntington's disease.
Neuromolecular Med. 21:110–119. 2019. View Article : Google Scholar : PubMed/NCBI
|
|
33
|
Wu J, Yang JJ, Cao Y, Li H, Zhao H, Yang S
and Li K: Iron overload contributes to general anaesthesia-induced
neurotoxicity and cognitive deficits. J Neuroinflammation.
17:1102020. View Article : Google Scholar : PubMed/NCBI
|
|
34
|
Wu Y, Liang S, Zhu H and Zhu Y: Analysis
of immune-related key genes in Alzheimer's disease. Bioengineered.
12:9610–9624. 2021. View Article : Google Scholar : PubMed/NCBI
|
|
35
|
Chai JF, Raichur S, Khor IW, Torta F, Chew
WS, Herr DR, Ching J, Kovalik JP, Khoo CM, Wenk MR, et al:
Associations with metabolites in Chinese suggest new metabolic
roles in Alzheimer's and Parkinson's diseases. Hum Mol Genet.
29:189–201. 2020.PubMed/NCBI
|
|
36
|
Wang Z and Tan L, Zong Y, Ma YH, Wang ZB;
Alzheimer's Disease Neuroimaging Initiative, ; Wang HF and Tan L:
sTREM2 and GFAP mediated the association of IGF-1 signaling
biomarkers with Alzheimer's disease pathology. J Alzheimers Dis.
92:791–797. 2023. View Article : Google Scholar : PubMed/NCBI
|
|
37
|
Sun T, Zeng L, Cai Z, Liu Q, Li Z and Liu
R: Comprehensive analysis of dysregulated circular RNAs and
construction of a ceRNA network involved in the pathology of
Alzheimer's disease in a 5 × FAD mouse model. Front Aging Neurosci.
14:10206992022. View Article : Google Scholar : PubMed/NCBI
|