Introduction
Cholangiocarcinoma (CCA) is an aggressive cancer
originating from the epithelial cells lining the biliary duct. Risk
factors for CCA vary geographically, with primary sclerosing
cholangitis identified as a prominent risk factor in western
countries, while liver fluke infection predominates in Asian
countries (1). The highest
incidence rates, ranging from 40–100 cases/100,000 individuals, are
found in areas endemic to liver fluke infection (2). In Europe and America, incidence rates
range from 0.4–2 cases/100,000 individuals (3). Globally, mortality rates are 0.2–2
deaths/100,000 person-years and are increasing in most countries
(4). In the early stages, CCA
often presents asymptomatically, leading to late-stage diagnosis,
which results in a poor prognosis and limited treatment options.
Consequently, most patients are not suitable candidates for
curative surgery and advanced cases necessitate palliative
treatments combined with radiotherapy or chemotherapy (5,6).
However, these treatments marginally extend survival, with rates
typically below one year (7–9).
Drug resistance in cancer cells significantly contributes to
treatment ineffectiveness and recurrence (10), underscoring the urgent need for
novel prognostic biomarkers or therapeutic targets to overcome drug
resistance in CCA.
Cullin proteins serve as molecular scaffolds within
Cullin-RING ubiquitin ligase (CRL) complexes (11), which are crucial for the
post-translational modification of cellular proteins through
ubiquitination. They can undergo a post-translational modification
called neddylation, which involves the covalent attachment of a
protein called neural precursor cell expressed developmentally
downregulated protein 8 (NEDD8) to a lysine residue of a protein
substrate. Cullins are the best-characterized physiological
substrates of neddylation. This modification is catalyzed by an
enzyme cascade consisting of the NEDD8 activating enzyme, NEDD8
conjugating enzyme (E2) and NEDD8 ligase [ubiquitin protein ligase
1 (E3)] (12). Neddylation of
cullins leads to the activation of CRLs, thereby controlling the
ubiquitination of cellular proteins (13). Cullin 3 (Cul3), encoded by the
CUL3 gene, acts as a scaffold protein within CUL3-RING
ubiquitin ligase (CRL3) complexes, pivotal for various cellular
processes, including protein degradation, cell cycle regulation,
DNA damage repair and epigenetic modulation (14). Emerging evidence implicates Cul3 in
tumorigenesis and tumor progression through the degradation of
oncoproteins or tumor suppressor proteins (15). For instance, Cul3 may play a direct
role in the proteasomal degradation of adhesion-associated
cytoskeletal proteins and metastasis suppressor proteins,
potentially regulating metastasis in both breast (16) and bladder cancer (17). In addition, Cul3 expression in
bladder cancer positively correlates with tumor stages and
disease-free survival. In prostate cancer, hypoxia plays a critical
role in advancing the disease and fostering resistance to
treatments. Cul3, along with its substrate adaptor protein
Kelch-Like Family Member 20, facilitates the breakdown of
Promyelocytic Leukemia Protein. This affects the hypoxia-inducible
factor 1 signaling pathway, which in turn drives tumor progression
and resistance to chemotherapy (18). Conversely, Cul3 is a good
prognostic marker in lung adenocarcinoma, where it seems to act as
a tumor suppressor. Forced overexpression of Cul3 attenuates tumor
progression through its interaction with Kelch-like ECH-associated
protein 1 and the subsequent regulation of the Nrf2/RhoA axis
(19). While the involvement of
Cul3 in tumorigenesis, either as an oncogene or tumor suppressor
gene, has been proposed in various cancers, its role in tumor
progression and drug resistance in CCA is largely unexplored.
Previously, our research group established
5-fluorouracil- and gemcitabine-resistant CCA cell lines,
designated KKU-213A-FR and KKU-213A-GR, respectively (20). Subsequent proteomic analysis
revealed the upregulation of numerous proteins, including Cul3, in
drug-resistant cells. The present study confirmed elevated Cul3
expression at both mRNA and protein levels in these drug-resistant
CCA cell lines. Furthermore, it investigated the effect of short
interfering (si)RNA-mediated Cul3 knockdown on cell proliferation,
colony formation, cell motility and drug sensitivity. The clinical
relevance of Cul3 was explored through online databases and
bioinformatics analyses.
Materials and methods
Cell culture
The human CCA cell line, KKU-213A, was obtained from
the Japanese Collection of Research Bioresources Cell Bank in
Osaka, Japan. The drug-resistant cell lines were previously
established by our research group. High-glucose Dulbecco's Modified
Eagle's Medium (DMEM) supplemented with 10% fetal bovine serum
(FBS) (Gibco; Thermo Fisher Scientific, Inc.) and 1%
antibiotic-antimycotic mixture (Gibco; Thermo Fisher Scientific,
Inc.) was used as the culture medium for maintaining all cell lines
throughout the present study. All cell lines were cultured at 37°C
with 5% CO2 and saturated humidity.
Drug-resistant CCA cell lines
The drug-resistant CCA cell lines designated
KKU-213A-FR and KKU-213A-GR, were established by exposing the
parental cell line KKU-213A to gradually increasing concentrations
of the commonly used chemotherapeutic drugs 5-fluorouracil (5-FU)
and gemcitabine, as previously described (21,22).
In brief, KKU-213A was cultured in DMEM containing the
IC25 concentrations of each chemotherapeutic drug. The
drug concentration was then gradually increased until the cell
lines could grow exponentially in the presence of the desired
chemotherapeutic drug, 7 µM 5-FU or 3 µM gemcitabine.
Proteomics analysis using liquid
chromatography with tandem mass spectrometry (LC-MS/MS)
Previously, proteomic analysis was performed using
LC-MS/MS to compare KKU-213A, KKU-213A-FR and KKU-213A-GR cell
lines. In brief, cell pellets were lysed with 0.5% sodium dodecyl
sulfate (SDS) and then centrifuged at 10,000 × g for 15 min at 4°C
to collect the protein supernatant. The protein was precipitated
with two volumes of cold acetone and incubated at −20°C overnight.
The mixture was then thawed, centrifuged and the supernatant was
discarded. The pellet was dried and preserved at −80°C. For
LC-MS/MS, all protein samples were digested with trypsin at a 1:20
ratio for 16 h at 37°C before being introduced into an Ultimate3000
Nano/Capillary LC System (Thermo Fisher Scientific, Inc.),
connected to an HCTUltra LC-MS system (Bruker Daltonics; Bruker
Corporation), equipped with a nano-captive spray ion source. The
data obtained from LC-MS were analyzed using DecyderMS 2.0
Differential Analysis software (23,24)
with the human protein database from UniProt (version 2021_03;
http://www.uniprot.org/). The search parameters
allowed for a maximum of three missed cleavages. The MS proteomics
data were deposited in the ProteomeXchange Consortium via the jPOST
partner repository with the dataset identifier JPST002506 and
PXD049309 (https://proteomecentral.proteomexchange.org/cgi/GetDataset?ID=PXD049309).
Proteins that demonstrated >3-fold variation in KKU-213A-FR and
KKU-213A-GR expression compared with the parental cell line, with a
False Discovery Rate (FDR) of <0.05, were identified as
differentially expressed proteins (DEPs).
siRNAs and transfection
To knock down Cul3 expression in drug-resistant CCA
cells, KKU-213A-FR and KKU-213A-GR were plated at 2×10⁵
cells/well in a 6-well plate and incubated for 24 h. siRNAs
targeting Cul3 mRNA (siCul3#1 and siCul3#2) and a negative control
siRNA (siNC) were obtained from Gene Universal (Gene Universal
Inc.). The sequences were: siCul3#1, 5′-ACCUGAUGAUUCUUGGAUATT-3′;
siCul3#2, 5′-GUGUAAUUCUCUGCCUUCATT-3′; siNC,
5′-UUCUCCGAACGUGUCACGUTT-3′. The siRNAs, at a final concentration
of 100 µM, were transfected into the cells using
Lipofectamine® 2000 (Invitrogen; Thermo Fisher
Scientific, Inc.) as the transfection reagent, following the
manufacturer's instructions. The cells were incubated with the
transfection complex for 6 h at 37°C in a CO2 incubator,
then switched to complete medium and further incubated for 24–48 h,
depending on the subsequent experiments. Cells for RNA and protein
extractions were harvested after a 48-h incubation, while for other
phenotypic studies, the transfected cells were harvested after 24 h
of incubation.
Reverse transcription-quantitative
(RT-q) PCR
Total RNA was extracted from the cells using TRIzol™
Reagent (Thermo Fisher Scientific, Inc.) and subsequently converted
into cDNA using the RevertAid First Strand cDNA Synthesis Kit
(Thermo Fisher Scientific, Inc.). Quantitative real-time PCR
analysis was performed with the PanGreen Universal SYBR Green
Master Mix (2X) (Bio-Helix Co., Ltd.). RNA extraction, cDNA
synthesis and qPCR were carried out according to the manufacturer's
protocols. β-actin was used as the internal control and the primer
sequences are provided in Table I.
The thermal cycling conditions were as follows: Initial
denaturation at 95°C for 15 min, denaturation at 95°C for 20 sec,
annealing at 60°C for 1 min, and extension at 72°C for 2 min,
followed by 35 cycles of denaturation and annealing. The relative
expression levels were calculated using the 2−ΔΔCq
method (25).
 | Table I.List of primers. |
Table I.
List of primers.
| Gene |
| Sequence
(5′→3′) |
|---|
| CUL3 | Forward: |
GTTCGATCGCTTCCTCCTGG |
|
| Reverse: |
AGGAGACCTGGAGTTGAGGTT |
| ARIH1 | Forward: |
TGCGCCTGATCACAGATTCA |
|
| Reverse: |
CACATTTGCAGCGAACAGGT |
| COMMD3 | Forward: |
TAGAGGCAGGAAAGCACCGA |
|
| Reverse: |
AAGCGCCAAGAAACATCCGT |
| DHX9 | Forward: |
GTACGGCCTGGATTCTGCTT |
|
| Reverse: |
ATCACAGCATCCAAAGGGGG |
| EGLN1 | Forward: |
GAGAAGGCGAACCTGTACCC |
|
| Reverse: |
CACAGATGCCGTGCTTGTTC |
| PSMD13 | Forward: |
ACCTTCCTGGTGTGACATCG |
|
| Reverse: |
CCCAAAAACCGCAGAGCATC |
| SNRPG | Forward: |
GGTGGCAGACATGTCCAAGG |
|
| Reverse: |
CCATTCCAATATTGTTCTGTTG |
| β-actin | Forward: |
GGATTCCTATGTGGGCGACG |
|
| Reverse: |
TTGTAGAAGGTGTGGTGCCAG |
Cell proliferation assay
Cell proliferation was examined using the
3-[4,5-dimethyl thiazole-2-yl]-2,5-diphenyl-tetrazolium bromide
(MTT) assay. MTT was purchased from MilliporeSigma. The KKU-213A-FR
and KKU-213A-GR cell lines, transfected with siNC, siCul3#1, or
siCul3#2, were seeded at 1.5×10³ cells/well in a 96-well
plate and incubated for 12, 24, 48 and 72 h. Then, 0.5 mg/ml MTT
was added to each well and incubated for 2 h at 37°C. After
discarding the excess MTT solution, 100 µl DMSO was added to
dissolve the formazan crystals. The intensity of solubilized
formazan was recorded as absorbance at 540 nm using a microplate
reader (Spark multimode microplate reader; Tecan Group, Ltd.). The
cell growth rate was calculated as a fold change of absorbance
compared with the 12-h time point. The difference in growth rate
was then compared between the siNC and siCul3#1 groups and between
the siNC and siCul3#2 groups at each time point.
Chemotherapeutic drug sensitivity
assay
To confirm the drug-resistant phenotype of the
established cell line and to assess whether knockdown of Cul3 in
the KKU-213A-FR and KKU-213A-GR cells can reverse this phenotype, a
chemotherapeutic drug sensitivity assay was performed. The parental
and drug-resistant cells, as well as the siNC transfected and
siCul3 transfected cells, were seeded at 1.5×10³ cells
per well into each well of a 96-well plate and incubated overnight.
The next day, the culture medium was replaced with various
concentrations of 5-FU (0, 3.125, 6.25, 12.5 and 25 µM;
MilliporeSigma) or gemcitabine (0, 1.25, 2.5, 5 and 10 µM;
MilliporeSigma) and incubated for another 72 h. The remaining cells
were estimated using an MTT assay as aforementioned. The percentage
of remaining cells for each treatment was calculated by comparing
to the untreated control, considered as 100% cell viability. The
percentage of remaining cells at each drug concentration was then
compared between KKU-213A and KKU-213A-FR, KKU-213A and
KKU-213A-GR, the siNC and siCul3#1 groups and the siNC and siCul3#2
groups.
Colony formation assay
To evaluate the effect of Cul3 knockdown on the
ability of cells to grow from a single cell, a colony formation
assay was performed. Briefly, transfected cells were harvested via
trypsinization, counted and dispersed into single cells. A low
concentration of cells (500 cells/ml) was then seeded into a 6-well
plate and incubated for 14 days, with the medium changed every 3–4
days. Upon completion, the colonies were fixed with 4%
paraformaldehyde at room temperature for 15 min and stained with
0.4% sulforhodamine B (SRB) solution at room temperature for 10
min. After the excess dye was removed, the plate was washed, dried
and the number of colonies was counted. Colonies were defined as
cell clusters with a diameter of at least 0.5 mm. Colony numbers
were compared between the siCul3 and siNC groups.
Cell migration and invasion
assays
The cell migration and invasion capabilities were
investigated using a modified Boyden chamber technique. After
transfection with siRNAs, cells were trypsinized and resuspended in
serum-free medium. Then, 200 µl of the cell suspension containing
4×10⁴ cells was seeded onto the Transwell insert with an
8-µm porous polycarbonate membrane (Corning Life Sciences) and the
lower chamber was filled with complete medium. For cell invasion
assays, the membrane was pre-coated with 0.5 mg/ml Matrigel
(Corning Life Sciences) for 2 h at 37°C prior to cell seeding.
Cells were allowed to migrate or invade through the porous membrane
for 11 h. After that, the non-migrated and non-invaded cells on the
upper part of the Transwell insert were removed with a cotton swab.
The membrane was then fixed with 4% paraformaldehyde at room
temperature for 15 min and stained with 0.4% SRB solution at room
temperature for 10 min. Images were captured at 100× magnification
using an inverted light microscope (Olympus CKX53; Olympus
Corporation), and cells from five randomly selected low-power
fields were counted using ImageJ software (version 1.53t; National
Institutes of Health).
Cell cycle analysis
The effect of Cul3 suppression on cell cycle
distribution was analyzed through flow cytometric analysis.
Briefly, the transfected cells were harvested and fixed with 70%
ethanol and incubated on ice for 30 min. The cells were washed
twice with phosphate-buffered saline (PBS) and then stained with a
DNA staining solution containing propidium iodide (PI; 50 µg/ml),
RNase A (100 µg/ml), Triton X-100 (0.1%) and EDTA (0.1 mM) for 15
min. The cell cycle analysis was carried out using the Attune NxT
Flow Cytometer (Thermo Fisher Scientific, Inc.) and the results
obtained from three independent experiments were analyzed with FCS
Express 7 (De Novo Software).
Western blotting
Proteins were extracted from parental,
drug-resistant CCA cell lines and siRNA-transfected cells using
RIPA lysis buffer (Visual Protein) with a protease inhibitor
cocktail (Merck KGaA). Protein concentration was determined using a
bicinchoninic acid (BCA) protein assay kit (Bio Basic Inc.)
according to the manufacturer's instructions. Equal amounts of
protein (30 µg) from different samples were separated on 12%
SDS-PAGE via electrophoresis and transferred to Hybond-PVDF
membranes (Cytiva). After blocking the membranes with 5% skimmed
milk at room temperature for 1 h, the membranes were incubated at
4°C overnight with primary antibodies against Cul3, cyclin D,
cyclin-dependent kinase (CDK)4, CDK6, or β-actin. The membranes
were washed three times and subsequently incubated with a
horseradish peroxidase (HRP)-linked secondary antibody at room
temperature for 1 h. Detailed information and dilutions of the
antibodies are presented in Table
II. Finally, the signal of protein bands was developed using
SuperSignal West Pico PLUS Chemiluminescent Substrate (Thermo
Fisher Scientific, Inc.) and captured by an Alliance Q9-ATOM
Chemiluminescent Imaging System (Uvitec Ltd.). Relative band
intensity was analyzed using ImageJ software (version 1.53t;
National Institutes of Health).
| Table II.List of antibodies. |
Table II.
List of antibodies.
| Antibody | Host | Catalogue
number | Dilution | Manufacturer |
|---|
| Anti-Cul3 | Rabbit | 2759 | 1:5,000 | Cell Signaling
Technology, Inc. |
| Anti-β-actin | Mouse | A5411 | 1:10,000 | MilliporeSigma |
| Anti-cyclin D | Mouse | 2936 | 1:2,500 | Cell Signaling
Technology, Inc. |
| Anti-CDK4 | Rabbit | 12790 | 1:2,500 | Cell Signaling
Technology, Inc. |
| Anti-CDK6 | Mouse | 3136 | 1:2,500 | Cell Signaling
Technology, Inc. |
| HPR-linked
anti-Rabbit IgG | Goat | ab6721 | 1:10,000 | Abcam |
| HPR-linked
anti-Mouse IgG | Goat | ab6789 | 1:10,000 | Abcam |
Bioinformatics analysis
To assess the aberrant mRNA expression of Cul3 in
the tissues of patients with CCA based on sample types and tumor
metastasis status, the University of Alabama at Birmingham Cancer
(UALCAN) web portal (https://ualcan.path.uab.edu/) (26) was used. This platform obtained data
from The Cancer Genome Atlas (TCGA) project, allowing users to
evaluate protein-coding gene expression and its clinical
significance across 33 types of cancer.
To evaluate the prognostic potential of Cul3 in CCA,
overall survival (OS) and disease-free survival (DFS) analyses was
performed using the Gene Expression Profiling Interactive Analysis
2 (GEPIA2) tool (http://gepia2.cancer-pku.cn/) (27). Kaplan-Meier survival plots were
generated to illustrate the association between Cul3 expression and
OS or DFS, with P-values from the log-rank test considered
statistically significant if less than 0.05. In addition, GEPIA2
was employed to assess the correlation between Cul3 and its
associated genes (ARIH1, COMMD3, EGLN1, PSMD13, DHX9 and
SNRPG). The correlations were computed using Pearson
correlation coefficients and presented in scatter plots. P<0.05
was considered to indicate a statistically significant
difference.
Protein expression levels of Cul3 in CCA and normal
bile duct tissues were obtained from The Human Protein Atlas (HPA;
http://proteinatlas.org/). The HPA is a
comprehensive database containing immunohistochemistry (IHC)-based
protein expression profiles in cancer tissues, normal tissues and
cell lines (28). IHC images from
six tumor tissues and three normal tissues were downloaded from the
HPA. The staining intensity of these IHC images was analyzed using
ImageJ software (version 1.53t; National Institutes of Health). The
Search Tool for the Retrieval of Interacting Genes/Proteins
(STRING) database (https://string-db.org/) (29) was used to perform a comprehensive
analysis of the protein-protein interactions (PPI) involving
Cul3-associated proteins.
Cul3 and its correlated genes were classified using
the Protein Analysis Through Evolutionary Relationships (PANTHER)
classification system (version 19.0; http://www.pantherdb.org/) based on Gene Ontology (GO)
annotations (30), with Homo
sapiens as the reference organism. The organizational chart for
proteins, classified based on their gene IDs and functional
classification hits, is depicted graphically. Subsequently, these
proteins were categorized according to molecular function,
biological process, cellular component and protein class, with
unclassified proteins filtered out. The Kyoto Encyclopedia of Genes
and Genomes (KEGG) serves as a predictive tool for molecular
networks between Cul3 and its correlated genes in various pathways.
The present study used ShinyGO 0.80 (http://bioinformatics.sdstate.edu/go/), which is based
on the KEGG pathways (31), to
analyze the relationships between these genes. Parameters such as
an FDR cutoff of 0.05 and a minimum pathway size of two genes were
selected. The maximum pathway size was set at seven genes and
redundant and abbreviated pathways were removed to show a total of
100 pathways.
Statistical analysis
Results are presented as mean ± standard deviation
(SD). For comparisons between two groups, paired two-tailed
Student's t-tests were conducted. For comparisons among three
groups, one-way ANOVA was used; if significant differences were
found, a Scheffe post hoc test was then applied. Correlations
between Cul3 and other genes were analyzed using the Pearson
correlation coefficient (R). Patient survival analysis was
performed using Kaplan-Meier plots and the significance of survival
differences was assessed with the log-rank test. Welch's t-test was
used to evaluate the significance of differences in expression
levels between normal and tumor tissues. For comparisons among
three groups [normal, tumor subgroup without nodule metastasis (N0)
and tumor subgroup with metastases in 1–3 axillary lymph nodes
(N1)], Welch's ANOVA was applied followed by Dunnett's T3 test.
Each experiment was conducted with at least three replicates.
P<0.05 was considered to indicate a statistically significant
difference.
Results
Cul3 is highly expressed in
drug-resistant CCA cell lines
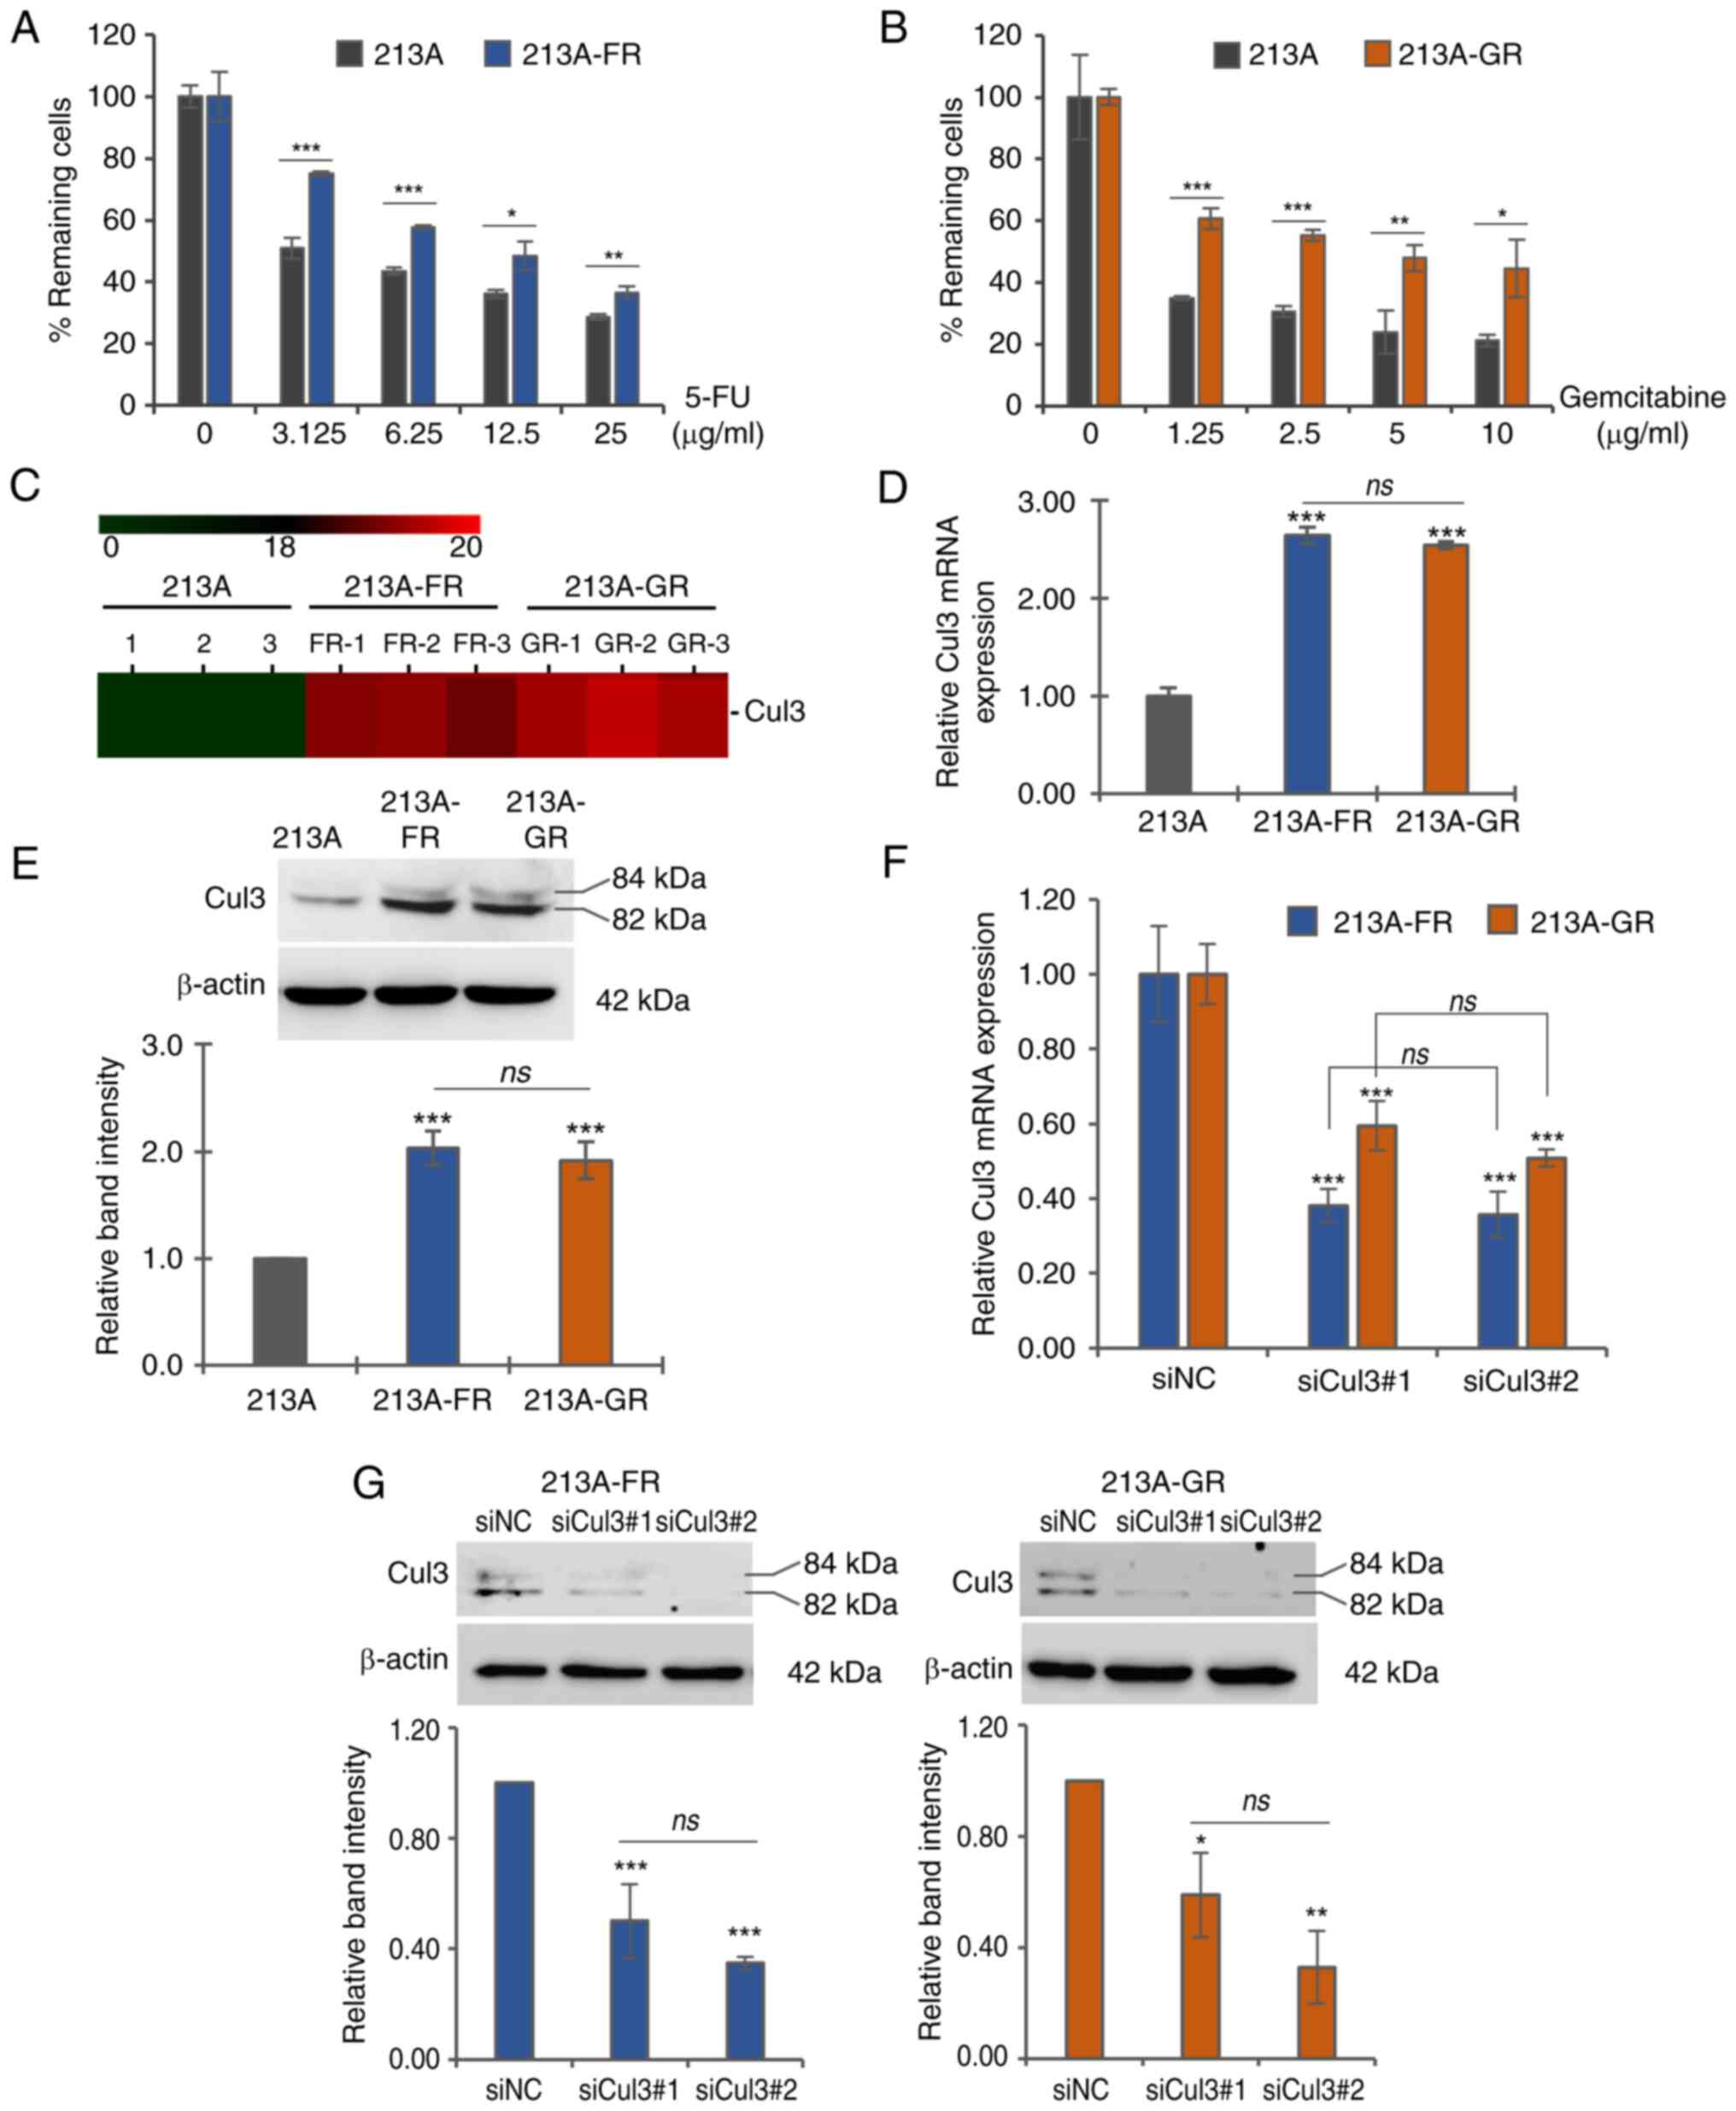
The drug-resistant phenotypes of the previously
established drug-resistant CCA cell lines were confirmed using the
MTT assay. The results showed that at various concentrations of the
chemotherapeutic drugs used, the cell viability of the
drug-resistant cells was significantly higher than that of their
parental counterparts in both KKU-213A-FR (Fig. 1A and Table SI) and KKU-213A-GR (Fig. 1B and Table SI). Previously, our research group
conducted proteomics analysis on drug-resistant CCA cell lines
(KKU-213A-FR and KKU-213A-GR) compared with their parental cell
line (KKU-213A). Cul3 is one of the differentially expressed
proteins highly expressed in both drug-resistant cell lines
compared with parental control cells (Fig. 1C). The present study first
confirmed the expression of Cul3 mRNA and protein using RT-qPCR and
western blotting, respectively, in KKU-213A-FR and KKU-213A-GR,
along with the parental cell line KKU-213A. The results showed that
mRNA expression in both drug-resistant cell lines was more than
2-fold higher than in the parental cells (Fig. 1D and Table SI). Similarly, western blotting
results demonstrated a ~2-fold higher expression of Cul3 protein in
both drug-resistant cells compared with the parental control
(Fig. 1E and Table SI). There are two bands of Cul3 at
~82 and 84 kDa, representing the non-neddylated and neddylated
forms of Cul3, respectively.
siRNA-mediated knockdown of Cul3
To explore the significant role of Cul3 in CCA
progression, specific siRNAs targeting Cul3 mRNA were transfected
into KKU-213A-FR and KKU-213A-GR cells. Cells transfected with siNC
were used as controls in all experiments. At 24 h
post-transfection, the knockdown efficiency was assessed by RT-qPCR
and western blotting. The results indicated that both siRNA strands
effectively suppressed Cul3 expression. Cul3 mRNA was suppressed by
siCul3#1 to 38 and 59% and by siCul3#2 to 35 and 50% in KKU-213A-FR
and KKU-213A-GR, respectively (Fig.
1F and Table SI). Western
blotting results showed that siCul3#1 suppressed Cul3 protein
levels to 50 and 59% and siCul3#2 to 35 and 33% in KKU-213A-FR and
KKU-213A-GR, respectively (Fig. 1G
and Table SI).
Cul3 silencing enhances
chemosensitivity
As Cul3 was observed to be elevated in
drug-resistant CCA cells, it was hypothesized that suppressing Cul3
expression might render KKU-213A-FR and KKU-213A-GR cells more
sensitive to chemotherapeutic drugs. MTT assay demonstrated that
the cell viability of siCul3#1- and siCul3#2-transfected
KKU-213A-FR and KKU-213A-GR cells significantly decreased upon
treatment with 5-FU and gemcitabine, respectively, compared with
cells transfected with siNC (Fig.
2A and Table SII), suggesting
that Cul3 knockdown increased the chemosensitivity of
drug-resistant cells. In addition, it was observed that siCul3#1
was more efficient than siCul3#2 in suppressing the drug-resistant
phenotype of CCA cells.
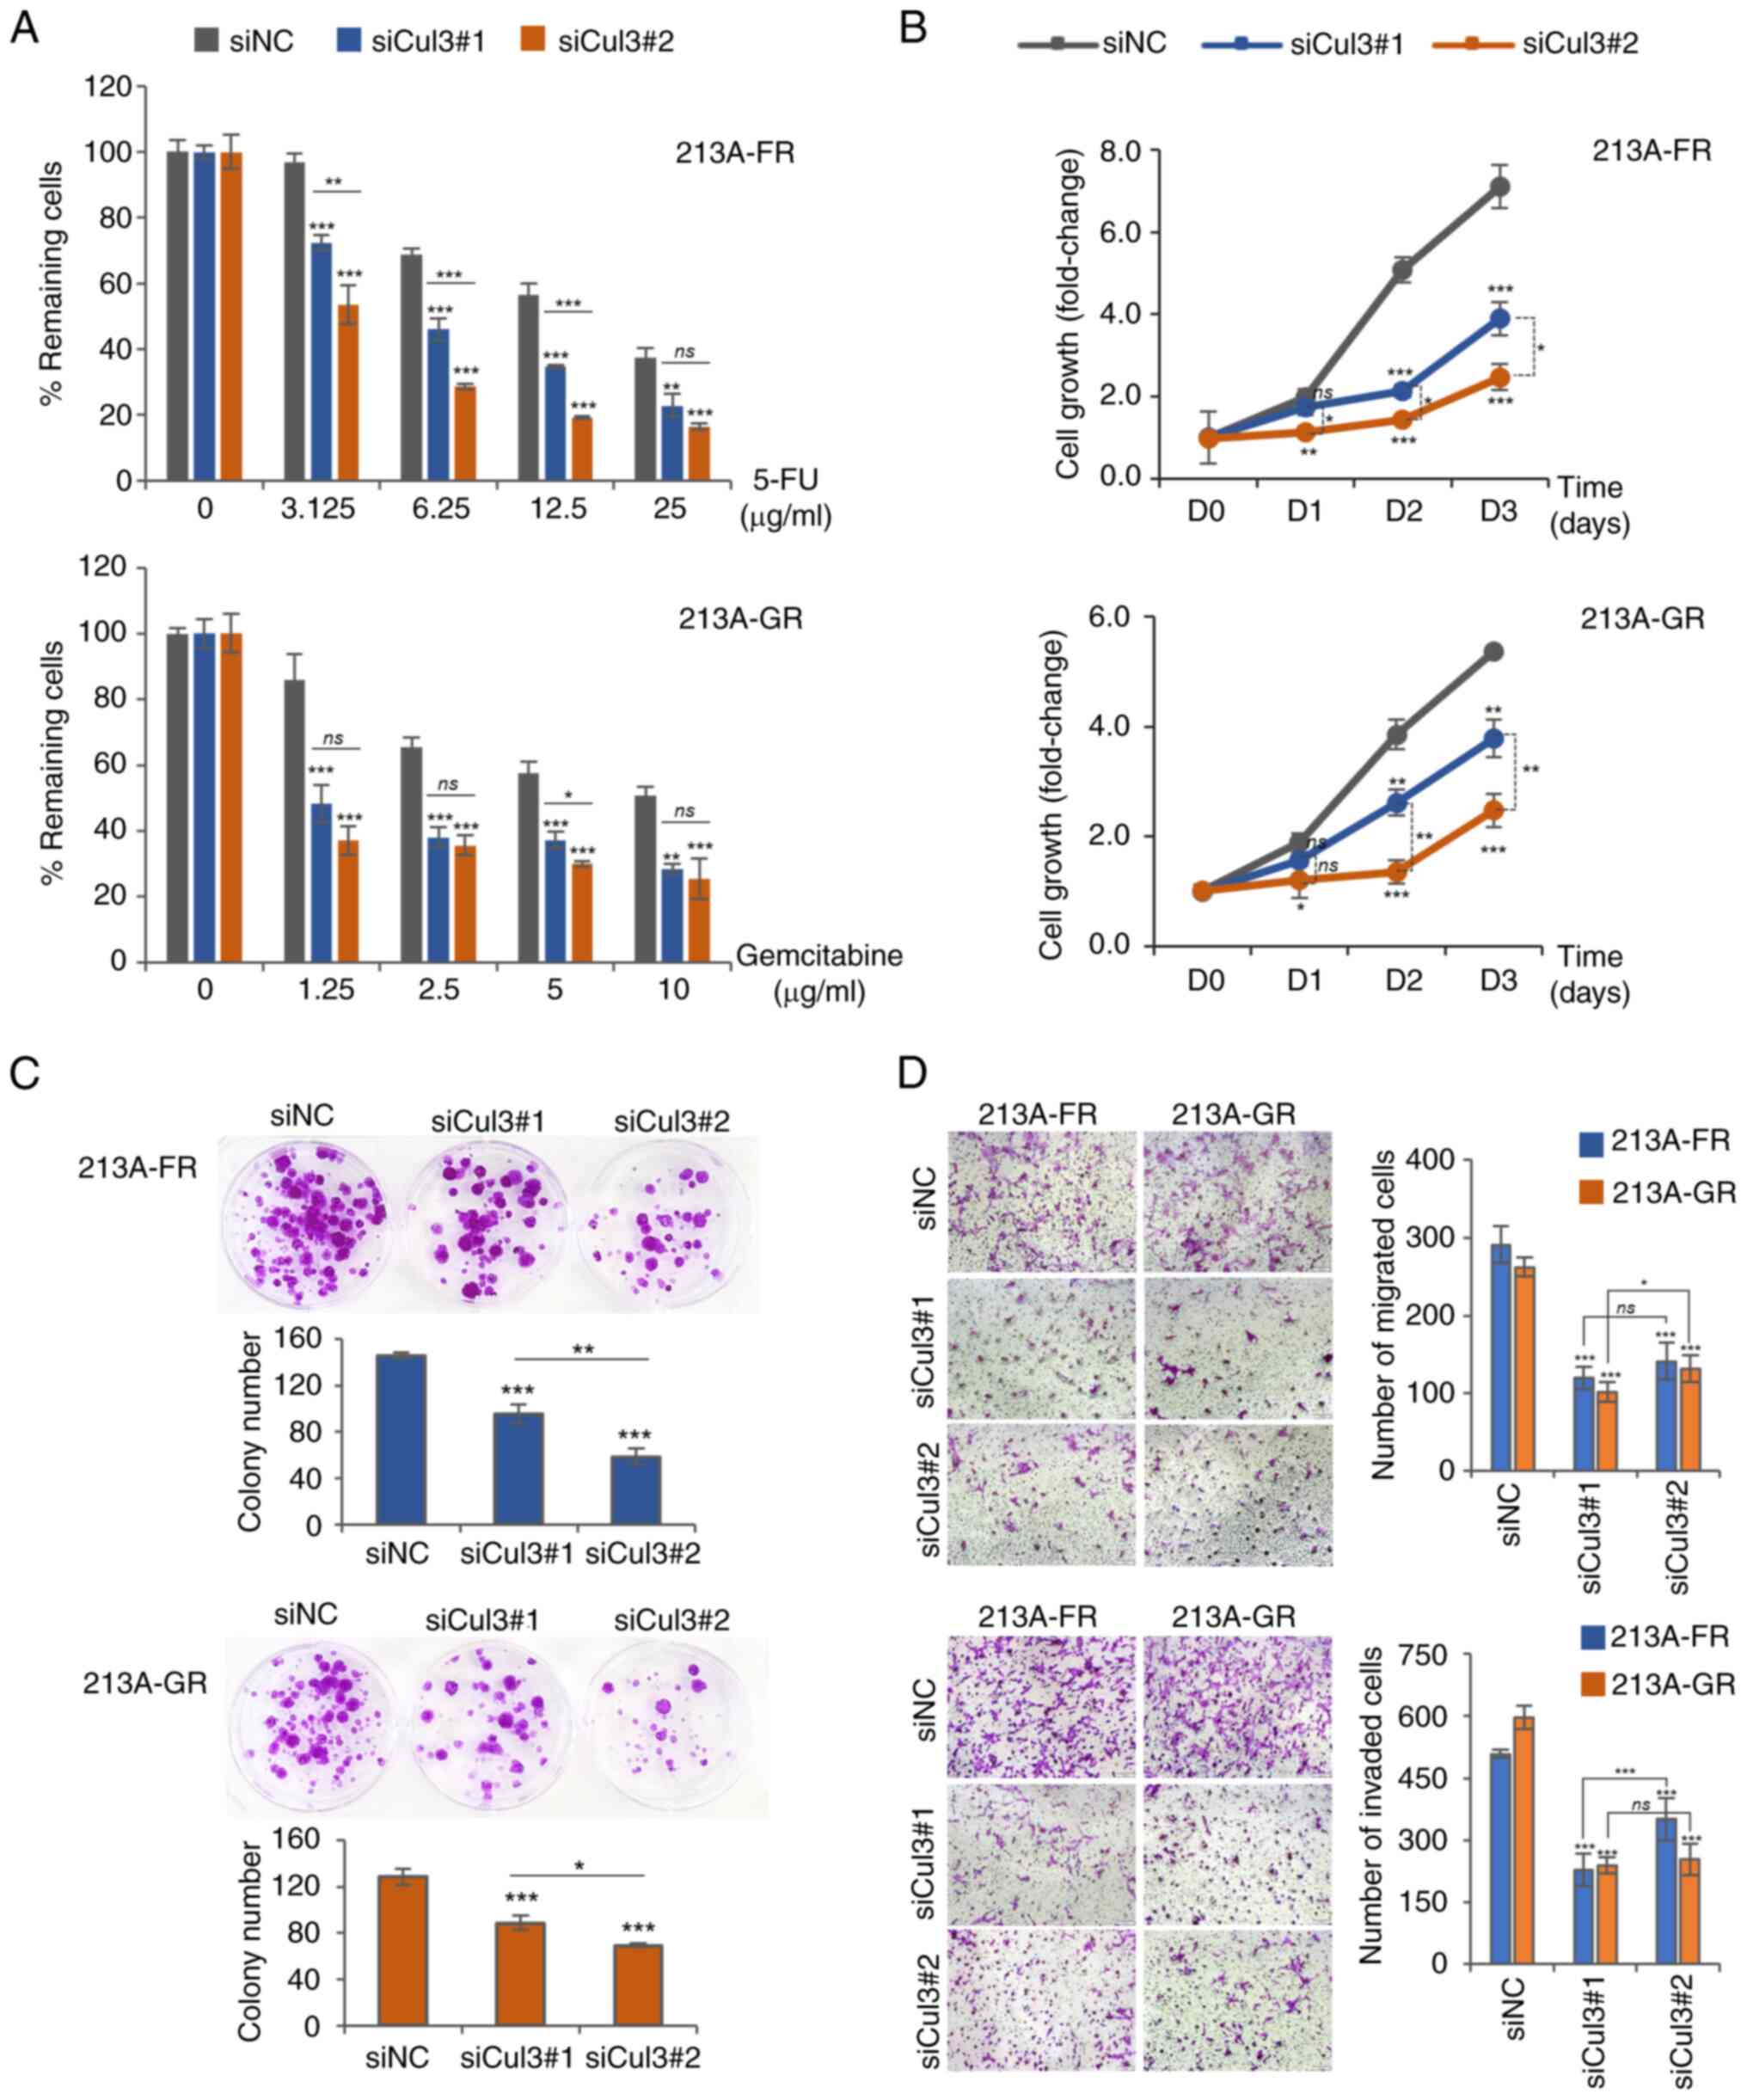 | Figure 2.Cul3 knockdown attenuates
drug-resistant and progressive phenotypes of CCA cells. (A) Drug
sensitivity assay using MTT. (B) Cell growth assay using MTT. (C)
Colony formation assay. (D) Cell migration and invasion assay using
the modified Boyden chamber method (magnification, 100×). Data are
presented as mean ± standard deviation from three replicates.
Significant differences between siNC- and siCul3-transfected groups
are indicated by *P<0.05, **P<0.01 and ***P<0.001. Cul3,
cullin 3; CCA, cholangiocarcinoma; MTT, 3-[4,5-dimethyl
thiazole-2-yl]-2,5-diphenyl-tetrazolium bromide; si, short
interfering; NC, negative control; ns, not significant. |
Cul3 knockdown inhibits aggressive
phenotypes of drug-resistant CCA cells
The aggressive phenotypes of the cells, including
cell growth rate, ability to grow from a single cell to form a
colony and cell motility, were assessed after Cul3 knockdown using
MTT, colony formation and modified Boyden chamber assays,
respectively. The MTT results showed that the growth rate of
KKU-213A-FR and KKU-213A-GR cells following Cul3 silencing with
both strands of siRNA significantly decreased at 48 and 72 h
compared with controls (Fig. 2B
and Table SII). The colony
formation assay results demonstrated that the downregulation of
Cul3 significantly reduced the number of colonies in KKU-213A-FR
and KKU-213A-GR cells (Fig. 2C and
Table SII). Furthermore, cell
migration and invasion assays using the modified Boyden chamber
revealed that suppression of Cul3 expression attenuated cell
motility in both drug-resistant CCA cell lines (Fig. 2D and Table SII). Taken together, these results
indicated that knockdown of Cul3 suppressed the aggressive
phenotypes of drug-resistant CCA cell lines. It was observed that
siCul3#1 was more efficient than siCul3#2 in suppressing cell
growth and colony formation of CCA cells. However, the same
phenomenon was not observed in cell migration and cell invasion.
This may be caused by several factors, such as the duration of the
experiments. For the cell migration and invasion assays, the cells
were allowed to migrate and invade for only 11 h, whereas other
experiments, such as drug sensitivity and cell growth assays, were
conducted over a longer period (e.g., 72 h for drug sensitivity and
cell growth assays and 2 weeks for the colony formation assay). In
addition, when statistical analyses were performed comparing
siCul3#1 and siCul3#2 on the suppression of cell migration and
invasion, it found the following: for KKU-213A-FR, cell migration
(ns, P=0.299) and cell invasion (***P=0.008); and for KKU-213A-GR,
cell migration (*P=0.017) and cell invasion (ns, P=0.711). These
differences are not substantial and may be due to the short
duration of the assays and small variations during the
experiments.
Silencing of Cul3 induces
G0/G1 cell cycle arrest
As Cul3 knockdown negatively affected cell growth
(Fig. 2B), the effect of
suppressing Cul3 expression on cell cycle distribution was further
investigated. siRNA- and siNC-transfected cells were subjected to
DNA staining with propidium iodide followed by flow cytometric
analysis. The cell cycle distribution results showed that the
percentage of cells in the G0/G1 phase
significantly increased, while the number of cells in the
G2/M phases significantly decreased in Cul3 knockdown
cells in both KKU-213A-FR (Fig. 3A
and Table SIII) and KKU-213A-GR
(Fig. 3B and Table SIII) cell lines. In addition, the
proportion of cells in the S phase significantly decreased in
KKU-213A-FR cells, whereas only a slight change was observed in
KKU-213A-GR cells, following Cul3 knockdown. Next, the expression
of key cell cycle regulatory proteins of the G1 phase
was determined using western blotting. The results demonstrated
that cyclin D, CDK4 and CDK6 were significantly decreased in Cul3
knockdown KKU-213A-FR (Fig. 3C and
Table SIII) and KKU-213A-GR
(Fig. 3D and Table SIII) cells. The expression level
of CDK4 protein was significantly suppressed by siCul3#2 in both
cell lines but was only slightly suppressed by siCul3#1, with the
reduction in KKU-213A-FR not being significant. These results
suggested that Cul3 silencing suppresses cell growth partly by
reducing cyclin D, CDK4 and CDK6 expression, resulting in cell
cycle arrest at the G0/G1 phases.
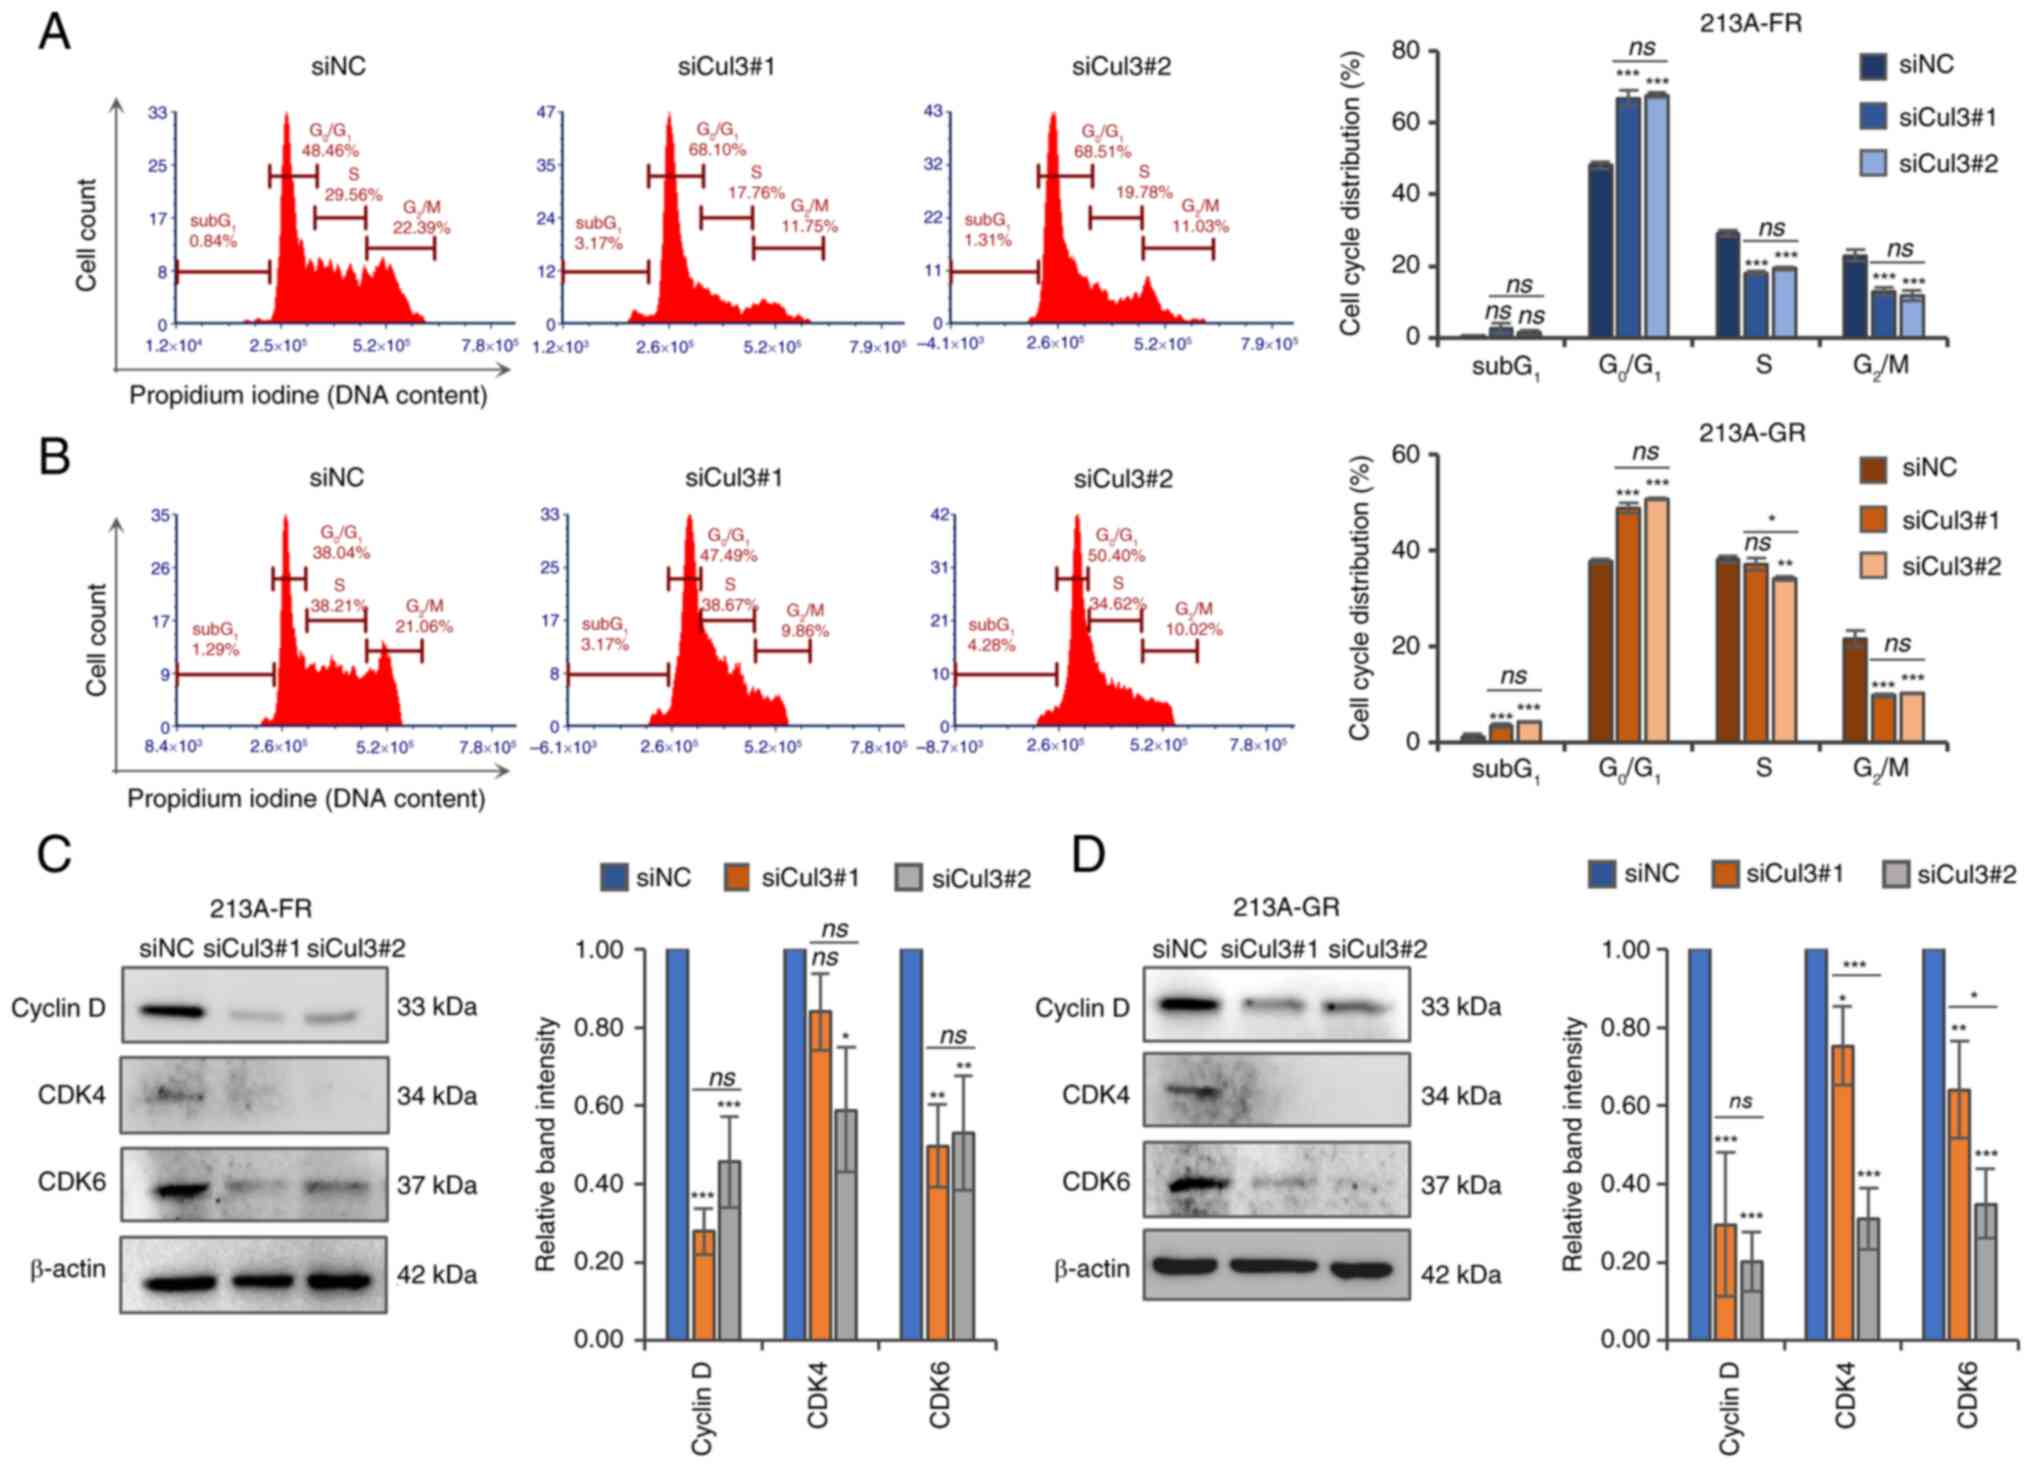 | Figure 3.Knockdown of Cul3 induces
G0/G1 cell cycle arrest in drug-resistant CCA
cells. Cell cycle distribution was analyzed using propidium iodide
staining and flow cytometric analysis in (A) KKU-213A-FR and (B)
KKU-213A-GR cells. Cell cycle regulatory proteins, cyclin D, CDK4
and CDK6, were determined using western blotting in (C) KKU-213A-FR
and (D) KKU-213A-GR cells. Representative blots and bar graphs show
relative band intensity analyzed by ImageJ software. Data are
presented as mean ± standard deviation from three replicates.
Significant differences between parental vs. drug-resistant cells
or between siNC-vs. siCul3-transfected groups are indicated by
*P<0.05, **P<0.01 and ***P<0.001. Cul3, cullin 3; CCA,
cholangiocarcinoma; CDK, cyclin-dependent kinase; si, short
interfering; NC, negative control; ns, not significant. |
Cul3 is upregulated in CCA tissues of
patients
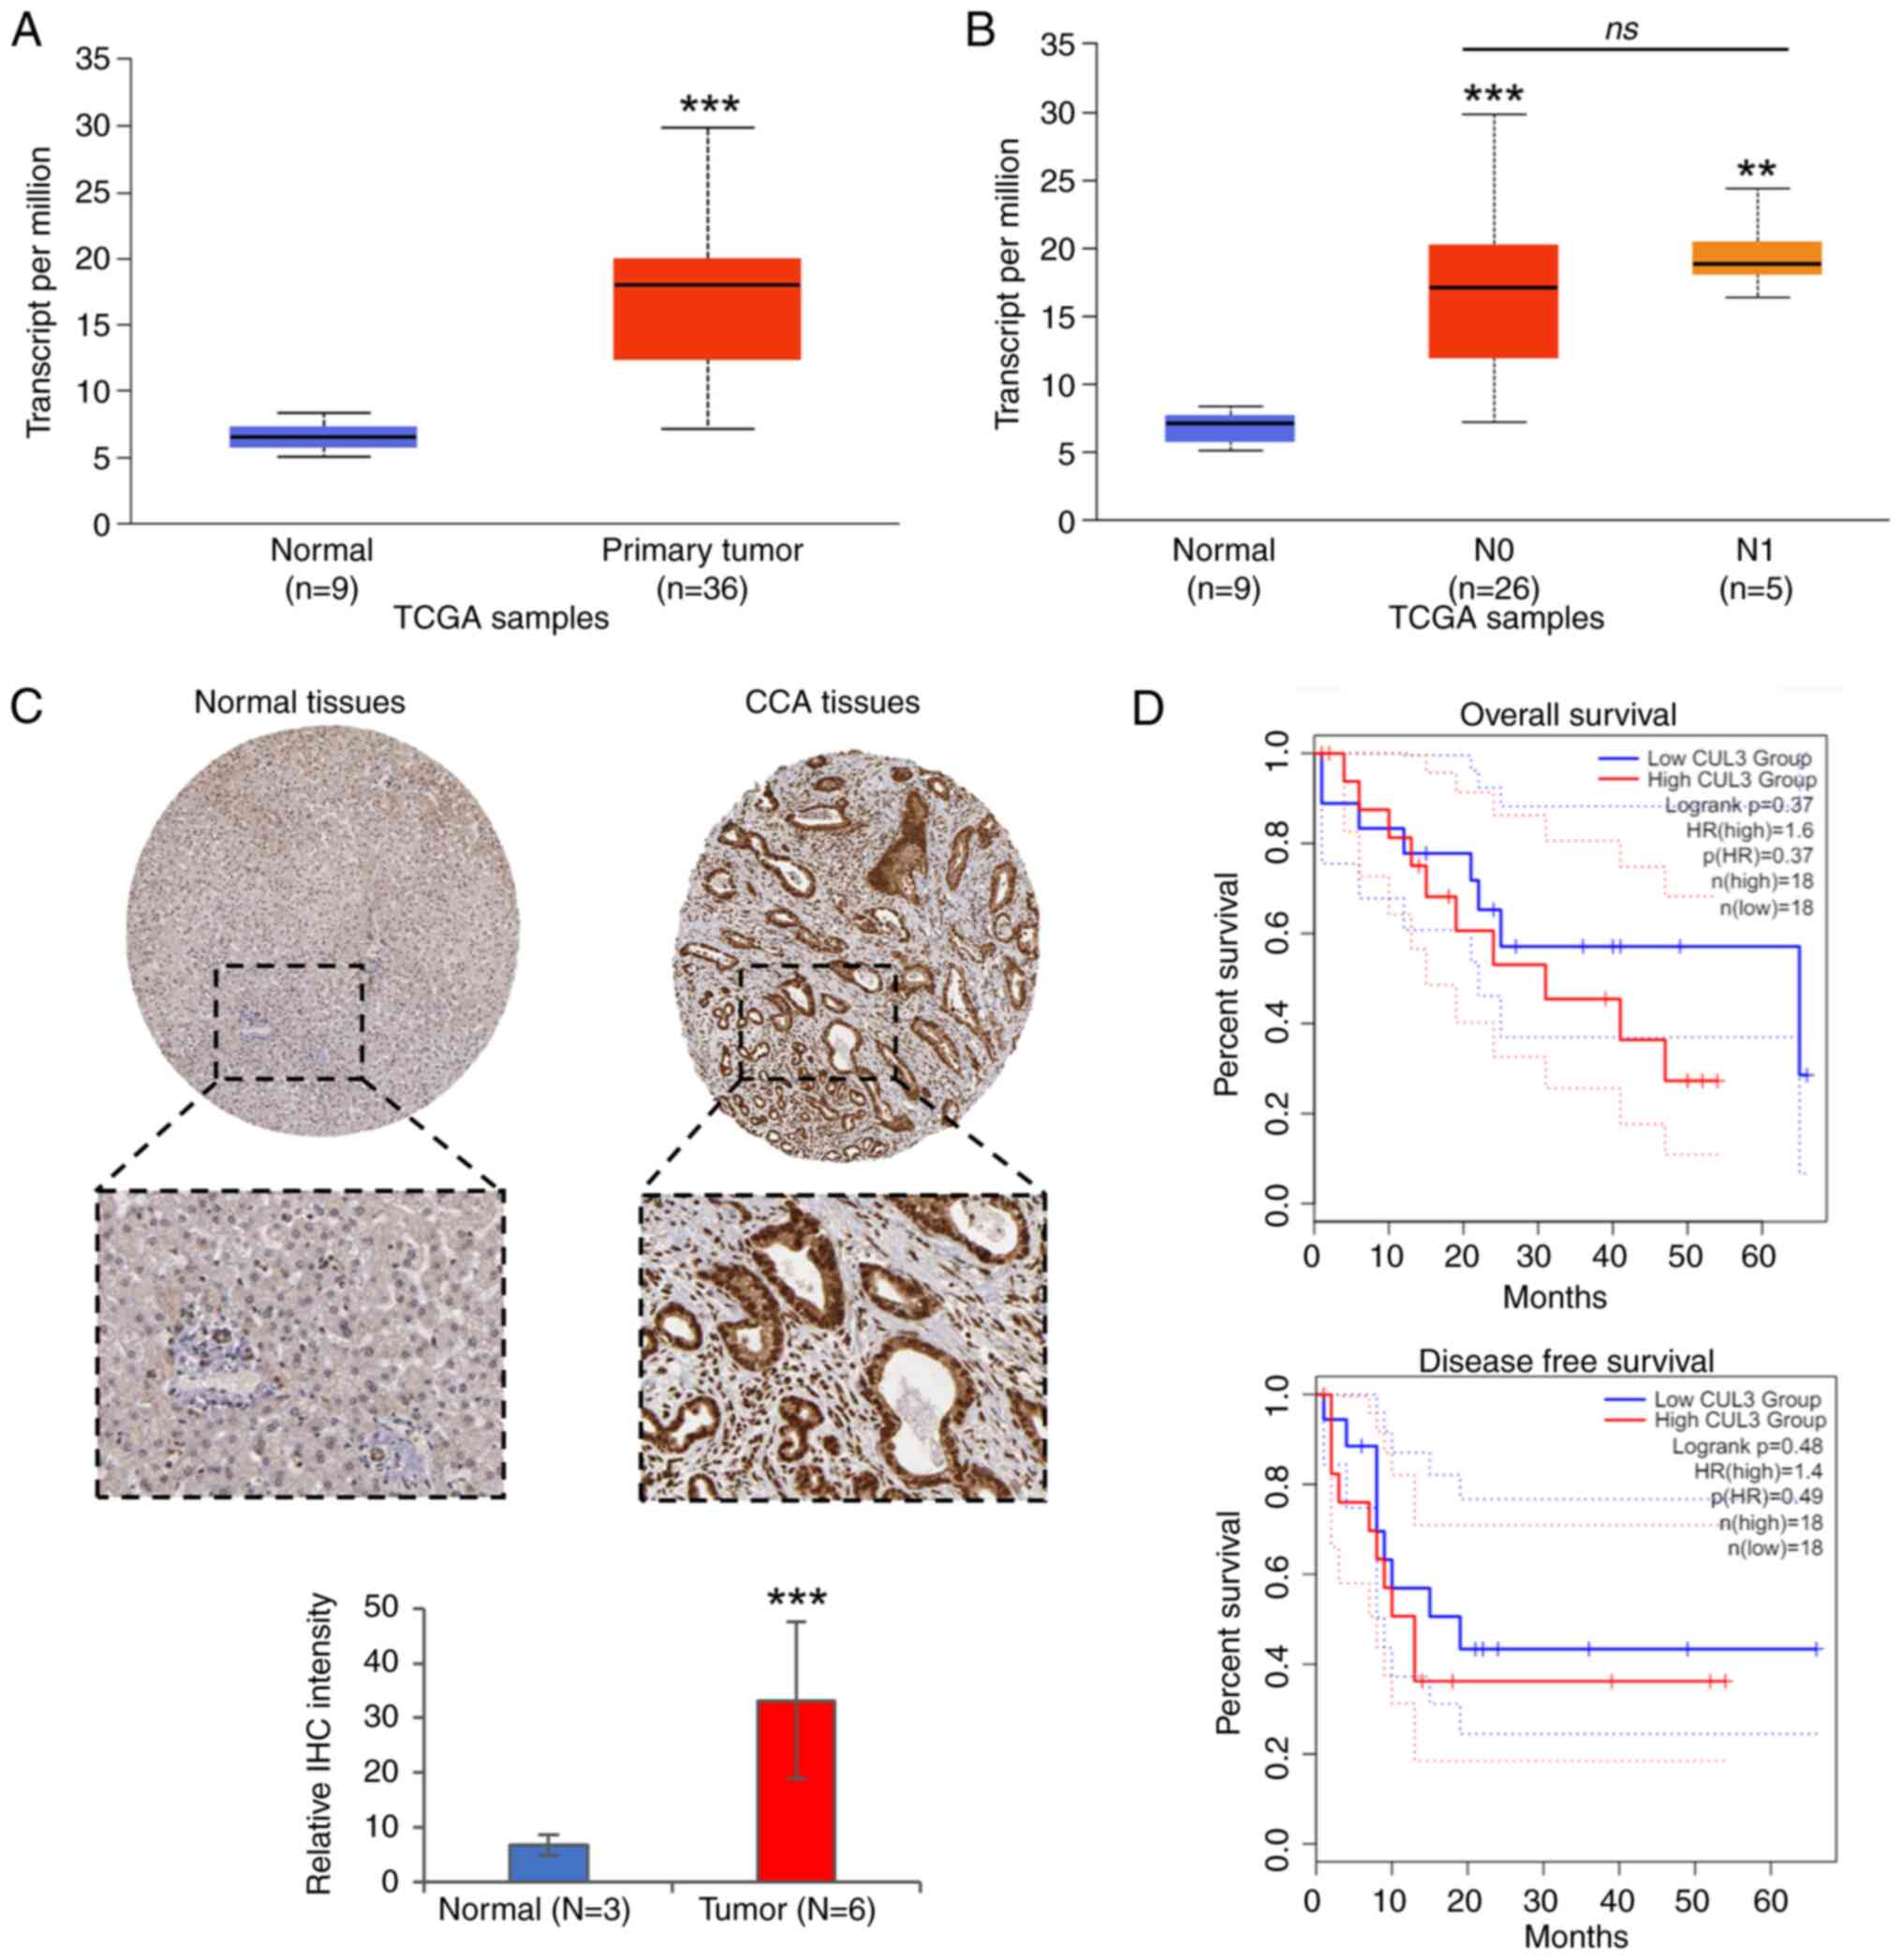
To investigate the clinical relevance of Cul3, the
correlation between Cul3 mRNA expression and data of patients with
CCA from the TCGA database was analyzed using the UALCAN web
portal. The results revealed that Cul3 mRNA was highly expressed in
tumor tissues, while its expression level was low in normal bile
duct tissues (Fig. 4A). Since
lymph node metastasis is one of the most important prognostic
factors in numerous cancers, TCGA data based on lymph node
metastasis status (N) was analyzed. The N category, part of the
Tumor, Node, Metastasis (TNM) system, refers to the lymph node
status: N0, no regional lymph node metastasis; N1, metastases in 1
to 3 axillary lymph nodes; N2, metastases in 4 to 9 axillary lymph
nodes; and N3, metastases in 10 or more axillary lymph nodes. When
analyzed based on lymph node metastasis status, Cul3 expression was
slightly higher in the metastasis group (N1) compared with the
non-lymph node metastasis group (N0); however, this difference was
not significant (Fig. 4B). In this
dataset, N2, N3 and N4 groups were not available for analysis. The
protein expression of Cul3, determined by immunohistochemistry
staining, was obtained from The Human Protein Atlas website. The
images were analyzed using ImageJ software. The results showed that
Cul3 was elevated in tumor tissues compared with normal bile duct
tissues (Fig. 4C). Moreover,
survival analysis was performed to evaluate the correlation between
Cul3 expression and overall as well as disease-free survival time
of the patients. However, no significant correlation was found
(Fig. 4D).
Cul3 and its correlated genes in
CCA
To identify genes correlated with Cul3, a list of
upregulated proteins in KKU-213A-FR and KKU-213A-GR cell lines was
obtained from the ProteomeXchange Consortium via the jPOST partner
repository with the data set identifier JPST002506 and PXD049309
(https://proteomecentral.proteomexchange.org/cgi/GetDataset?ID=PXD049309)
and uploaded into the STRING analysis platform version 12.0. The
results showed that six proteins, including COMMD3, ARIH1, EGLN1,
PSMD13, DHX9 and SNRPG, form a highly interactive network with Cul3
(Fig. 5A). In addition, the
correlation between these genes and Cul3 in the tissues of patients
with CCA was further explored using TCGA data through the GEPIA2
web portal. The correlation analysis revealed that the mRNA
expression of these genes positively correlated with Cul3
expression (Fig. 5B). Furthermore,
the mRNA expression of six genes was measured in Cul3 knockdown
cells. The RT-qPCR results showed that Cul3 knockdown significantly
suppressed the expression of ARIH1, COMMD3, DHX9 and SNRPG
(Fig. 5C and Table SIV). In KKU-213A-GR cells, both
EGLN1 and PSMD13 were significantly suppressed by
either siCul3#1 or siCul3#2. In KKU-213A-FR cells, EGLN1 was
significantly suppressed only by siCul3#2, while PSMD13 was
significantly suppressed only by siCul3#1.
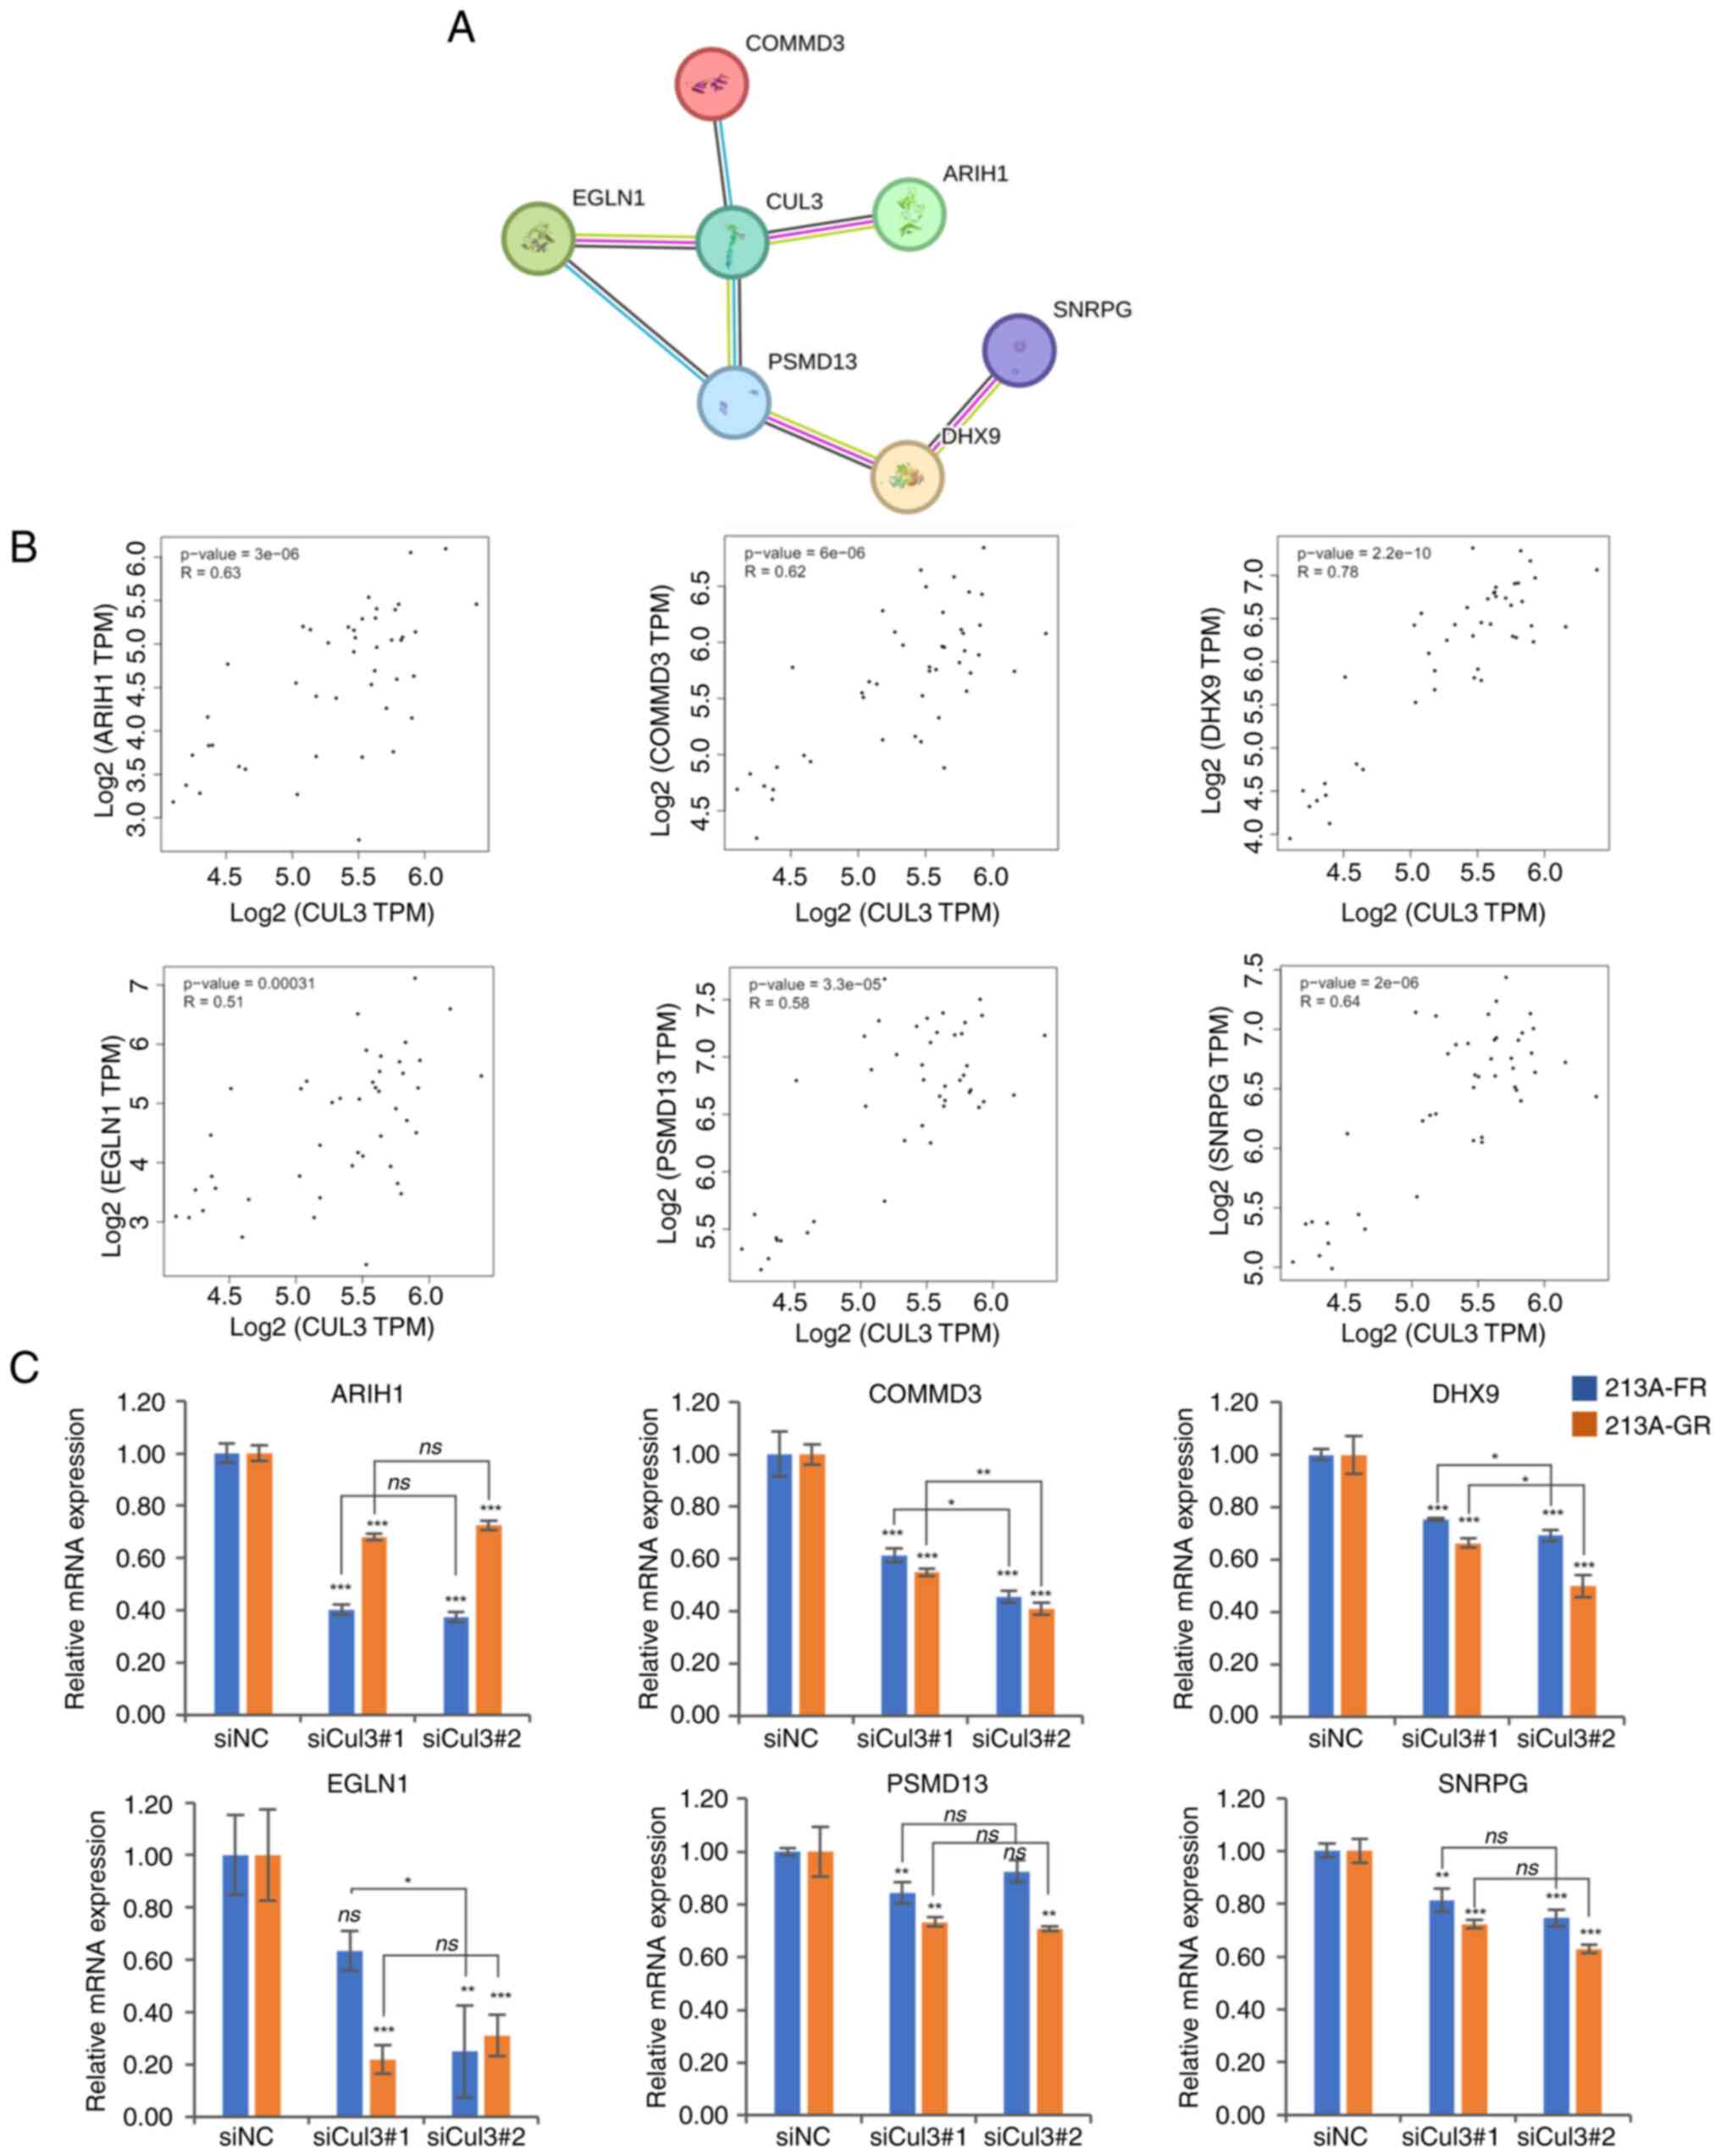 | Figure 5.Cul3 correlated genes. (A) STRING
analysis of proteins upregulated in drug-resistant CCA cells
revealed the Cul3 protein-protein interaction network. (B)
Correlation analyses between Cul3 and potential Cul3 correlated
genes in tissues of patients with CCA based on TCGA data. (C) mRNA
expression of six potential Cul3 partners, namely ARIH1, COMMD3,
DHX9, EGLN1, PSM13 and SNRPG analyzed in Cul3 knockdown
cells. *P<0.05, **P<0.01 and ***P<0.001 siNC- vs.
siCul3-transfected groups. Cul3, cullin 3; CCA, cholangiocarcinoma;
STRING, The Search Tool for the Retrieval of Interacting
Genes/Proteins; TCGA, The Cancer Genome Atlas; si, short
interfering; NC, negative control; ns, not significant. |
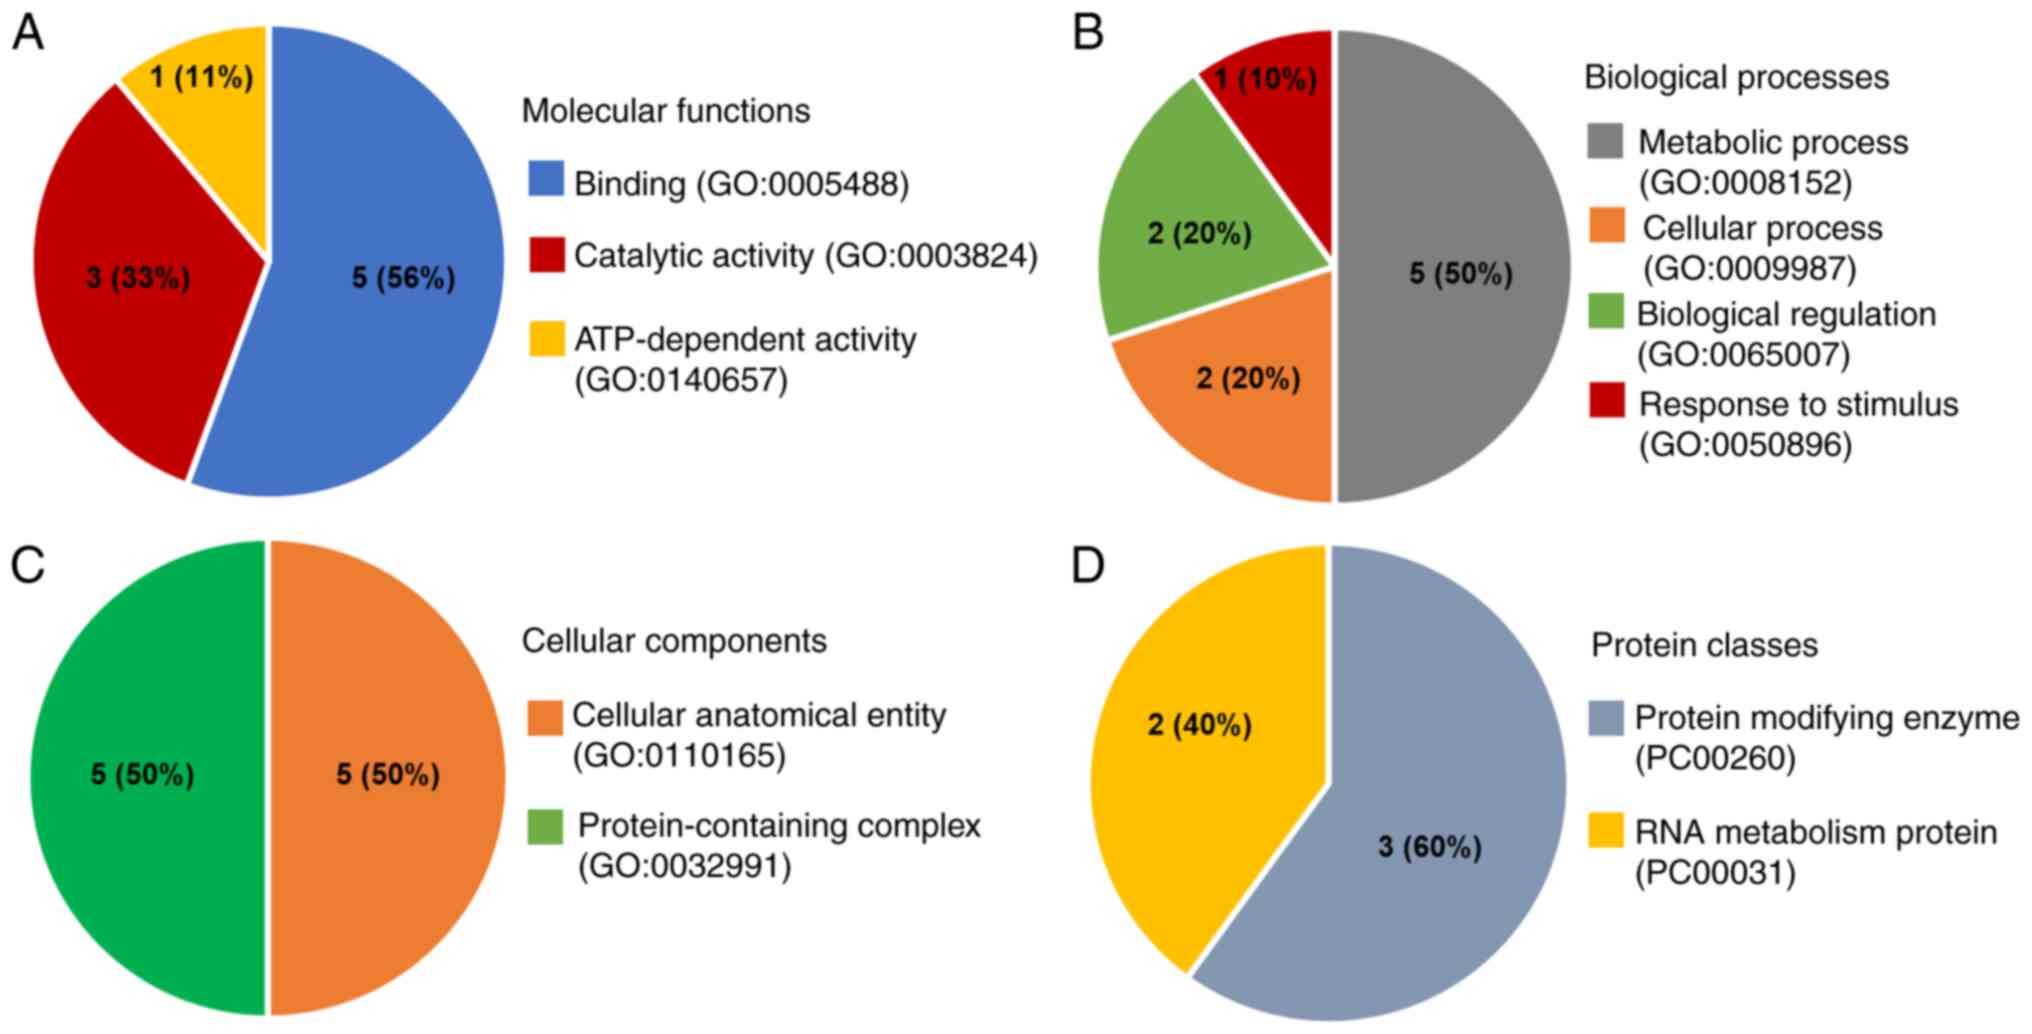
GO analysis
Cul3 and its correlated genes were further
categorized based on their molecular functions, biological
processes, cellular components and protein classes using the GO
database through the PANTHER classification system. When
categorized by molecular function, the largest fraction (56%)
belonged to the binding category, including Cul3, ARIH1, DHX9,
EGLN1 and SNRPG, followed by catalytic activity (33%) and
ATP-dependent activity (11%; Fig.
6A). Biological process ontology indicated that the majority of
the proteins were involved in metabolic processes (50%), including
Cul3, ARIH1, EGLN1, PSMD13 and SNRPG, followed by cellular
processes (20%), biological regulation (20%) and response to
stimuli (10%; Fig. 6B). Proteins
were classified based on cellular components into two groups:
Cellular anatomical entities (50%), including ARIH1, DHX9, EGLN1,
PSMD13 and SNRPG and protein-containing complexes (50%), including
Cul3, ARIH1, DHX9, PSMD13 and SNRPG (Fig. 6C). Lastly, protein classes showed
two groups: Protein-modifying enzymes (60%; including Cul3, ARIH1,
PSMD13) and RNA metabolism proteins (40%; including DHX9 and SNRPG)
(Fig. 6D). The findings of the
KEGG pathway analysis indicated that no significant enrichment was
identified in the KEGG pathway (Table
SV). The observed outcome was influenced by the limited number
of input genes.
Discussion
Due to late diagnosis and limited treatment options,
the median survival rate for patients with advanced CCA is <1
year, even when treated with a combination of chemotherapeutic
drugs (7–9). Tumor recurrence due to drug
resistance remains a major challenge in CCA treatment. Our research
group previously identified DEPs in drug-resistant cell lines
(KKU-213A-FR and KKU-213A-GR) compared with the parental cell line
(KKU-213A), among which Cul3 was one of the most upregulated
proteins identified.
Cul3 is a component of the CRL3 complex, essential
for the protein ubiquitination process. CRLs consist of four main
components: A Cullin protein (Cul), a RING-finger protein, an
adaptor protein and a substrate receptor protein (15). The C-terminal end of the Cul
protein connects to the RING-finger protein, which recruits the E2
enzyme with ubiquitin. The N-terminal end of the Cul protein binds
with the adaptor protein, which in turn binds to the specific
target protein. Once the target protein binds with the adaptor, the
E2 enzyme transfers ubiquitin to the target protein, leading to its
degradation by the proteasome (32).
Specific substrate adapters influence various
biochemical and cellular functions, including protein degradation,
cell cycle regulation, cell division, DNA damage repair and
epigenetic regulation (33–35).
Cul3 plays a dual role in cancer development, both supporting and
suppressing cancer progression. For instance, high Cul3 expression
is associated with late-stage breast cancer (36), where it ubiquitinates the breast
cancer metastasis suppressor 1 protein, which is implicated in
suppressing metastasis (16).
Similarly, Cul3 upregulation has been observed in aggressive
metastatic bladder cancer (17).
Conversely, Cul3 expression suppresses tumor
progression in ovarian cancer (37) and lung adenocarcinoma (19,38).
Some studies have shown that increased Cul3 expression enhances
chemosensitivity both in vitro and in vivo (37), leading to a favorable prognosis for
patients (19). Dorr et al
(38) demonstrated that Cul3
upregulation inhibits cell proliferation, colony formation and
migration of lung adenocarcinoma cell lines.
The role of Cul3 in CCA is limited and multifaceted.
A study by Feng et al (39)
found that Cul3 mutations primarily promote cancer progression by
modifying the immune microenvironment. CCA with low Cul3 expression
shows increased sensitivity to chemotherapy and targeted therapies,
suggesting new treatment approaches for CCA. This finding aligns
with our study, which discovered that Cul3 is elevated in
drug-resistant CCA cells and upregulated in CCA tumor tissues.
In vitro suppression of Cul3 expression attenuated the
aggressive phenotypes of CCA cells. Conversely, another study
revealed that Cul3 acts as a tumor suppressor gene. Cul3 deficiency
increases Nrf2 and Cyclin D1 protein levels, leading to
cholangiocyte expansion and CCA initiation. It also boosts Cxcl9
secretion in stromal cells, attracting T cells and raises
Amphiregulin (Areg) production via Nrf2, causing liver
inflammation. This inflammation promotes the accumulation of
exhausted PD1high CD8 T cells, reducing their cytotoxic
activity and enabling CCA progression (40). These discrepancies suggest a
complex role for Cul3 in CCA and indicate the need for further
validation.
The present proteomics study revealed that Cul3 was
upregulated in both 5-FU and gemcitabine-resistant cell lines. The
present study, confirmed Cul3 upregulation at both mRNA and protein
levels in KKU-213A-FR and KKU-213A-GR compared with their parental
cell line. In addition, results from the UALCAN web portal and The
Human Protein Atlas indicated high Cul3 expression in CCA patient
tissues. The limitation of the present study is the lack of
comparison between Cul3 expression in chemosensitive and
chemoresistant CCA patient samples. Future research analyzing Cul3
expression in these samples will help to emphasize the clinical
relevance of Cul3 in CCA.
The present study performed in vitro
loss-of-function studies using siRNAs to investigate the role of
Cul3 in drug-resistant cell lines. The results confirmed the
involvement of Cul3 in drug resistance development, showing that
suppressing Cul3 expression enhanced chemosensitivity in
drug-resistant cell lines. Furthermore, Cul3 knockdown reduced the
growth rate and induced cell cycle arrest at the
G0/G1 phases by reducing cyclin D, CDK4 and
CDK6, which are G1 phase regulatory proteins. The
results underscored the oncogenic role of Cul3 in CCA, aligning
with previous research in bladder cancer, breast cancer and
nasopharyngeal carcinoma, where silencing Cul3 decreased cell
proliferation and induced cell cycle arrest (17,41,42).
The present study also showed that Cul3 silencing reduced the
number of migrated and invaded cells in drug-resistant CCA cells,
indicating that Cul3 plays a significant role in supporting cancer
cell motility. The findings of the present study are consistent
with those in bladder cancer (17)
and nasopharyngeal carcinoma (42), where suppressing Cul3 reduced
metastasis abilities.
STRING analysis using a list of DEPs in KKU-213A-FR
and KKU-213A-GR from proteomics results revealed a protein network
including Cul3 and six other proteins: ARIH1, COMMD3, DHX9, EGLN1,
PSMD13 and SNRPG. These proteins have been shown in previous
studies to act as oncogenic factors in human cancers. ARIH1
promotes metastasis through epithelial-mesenchymal transition (EMT)
in breast cancer by binding to cullin-RBX1 complexes, leading to
the degradation of Poly(rC)-binding protein 1 (PCBP1) (43). COMMD3 regulates CRL by preventing
the binding of Cullin-associated Nedd8-dissociated protein 1,
promoting ubiquitination of various targets and has been linked to
poor prognosis in metastatic prostate cancer (44,45).
PSMD13, a regulator subunit of the 26S proteasome, has been linked
to the maintenance of stemness and EMT processes in hepatocellular
carcinoma (46). EGLN1, a cellular
oxygen sensor, promotes tumor development and radiotherapy
resistance in nasopharyngeal carcinoma by facilitating p53
ubiquitination (47). DHX9
regulates RNA and DNA processes and its dysregulation can
contribute to tumorigenesis by mediating the binding of the EGFR to
target gene promoters, stimulating cyclin D1 transcription and
promoting proliferation (48).
SNRPG is a component of the spliceosome and its dysregulation can
lead to aberrant splice variants contributing to oncogenesis and
tumor progression (49).
The protein-protein interaction network from STRING
analysis revealed potential key novel proteins involved in the
development and drug resistance of CCA. Gene expression analysis
using GEPIA2 also showed a positive correlation between Cul3 and
all six genes in the network. In addition, RT-qPCR revealed that
Cul3 knockdown significantly suppressed the mRNA expression of
these six genes, suggesting that Cul3 may regulate the expression
or function of these downstream target genes.
GO analysis of Cul3 and its correlated genes
revealed a multifaceted role of these proteins in CCA cells. The
categorization by molecular function indicated that a significant
portion of these proteins were involved in binding activities,
followed by those involved in catalytic activity and ATP-dependent
activity. This finding underscored the diverse interactions and
functional roles these proteins play in cellular processes,
particularly in cancer cell metabolism and signaling pathways
(50). Furthermore, the biological
process ontology highlighted that the majority of these proteins
participated in metabolic processes, a critical aspect of cancer
cell proliferation and survival, with the remaining involved in
cellular processes, biological regulation and response to stimuli.
This was consistent with existing literature suggesting that
metabolic reprogramming is a hallmark of cancer (51). The classification by cellular
components divided these proteins into two equal groups: Cellular
anatomical entities and protein-containing complexes, indicating
their structural and functional diversity within the cellular
environment (52). Lastly, the
protein class categorization revealed a split between
protein-modifying enzymes and RNA metabolism proteins. This is
particularly relevant in the context of cancer, where protein
modification and RNA metabolism are crucial for the regulation of
gene expression and cellular adaptation to stress (53–55).
Overall, these GO analyses provide a broader understanding of the
functional landscape of Cul3 and its correlated genes in CCA,
highlighting potential targets for therapeutic intervention. The
involvement of these proteins in key cellular processes and their
diverse molecular functions underline the complexity of cancer
biology and the necessity for targeted therapeutic strategies.
In conclusion, the present study demonstrated the
aberrant expression of Cul3 in both drug-resistant CCA cells and
CCA patient tissues. Suppression of Cul3 expression sensitizes CCA
cells to chemotherapeutic drugs, slows cancer cell growth, reduces
colony formation, induces cell cycle arrest and decreases cell
motility. However, the present study lacked functional rescue
experiments. Future research should include the overexpression of
Cul3 in Cul3-low expressing cell lines using overexpression
plasmids to further elucidate its role. In addition, the present
study did not investigate the role of Cul3 in animal models. Future
research should use Cul3-stable knockdown or Cul3-stable
overexpressing cell lines to study tumor growth through a xenograft
model and to investigate the role of Cul3 in metastasis through
experimental metastasis models using NOD/SCID mice. Further
investigations into the function and association between Cul3 and
its correlated genes may help identify novel therapeutic targets
for drug-resistant CCA in the future.
Supplementary Material
Supporting Data
Supporting Data
Supporting Data
Supporting Data
Supporting Data
Acknowledgements
Not applicable.
Funding
The present study was supported by the National Science,
Research and Innovation Fund (NSRF) and Prince of Songkla
University (grant no. SCI6801097S) to SO. KP was supported by a
Graduate Fellowship (Research Assistant), Faculty of Science,
Prince of Songkla University, contract no. 1-2565-02-023. PT was
supported by a Prince of Songkla University-Ph.D. Scholarship
(grant no. PSU_PHD2565-002).
Availability of data and materials
The data generated in the present study are included
in the figures and/or tables of this article.
Authors' contributions
SO, KP, SR, PR and SS conceived and designed the
study. KP, KK and PT performed the experiments collected and
analyzed the data, produced the figures and wrote the manuscript.
SO, KK, KP, SR, PR and SS performed bioinformatics and statistical
analysis. SO, SR, PR and SS confirm the authenticity of all the raw
data and revised the manuscript. All authors read and approved the
final manuscript.
Ethics approval and consent to
participate
Not applicable.
Patient consent for publication
Not applicable.
Competing interests
The authors declare that they have no competing
interests.
Glossary
Abbreviations
Abbreviations:
|
ARIH1
|
Ariadne RBR E3 ubiquitin protein
ligase 1
|
|
CDK4/6
|
cyclin-dependent kinase 4/6
|
|
COMMD3
|
COMM Domain Containing 3
|
|
CRL3
|
CUL3-RING ubiquitin ligase
|
|
Cul3
|
cullin 3
|
|
DHX9
|
DExH-box helicase 9
|
|
DEPs
|
differentially expressed proteins
|
|
EGLN1
|
Egl nine homolog 1
|
|
EMT
|
epithelial-mesenchymal transition
|
|
LC-MS/MS
|
liquid chromatography with tandem mass
spectrometry
|
|
PSMD13
|
Proteasome 26S Subunit Non-ATPase
13
|
|
SNRPG
|
small nuclear ribonucleoprotein
polypeptide G
|
References
|
1
|
Kirstein MM and Vogel A: Epidemiology and
risk factors of cholangiocarcinoma. Visc Med. 32:395–400. 2016.
View Article : Google Scholar : PubMed/NCBI
|
|
2
|
Blechacz B: Cholangiocarcinoma: Current
knowledge and new developments. Gut Liver. 11:13–26. 2017.
View Article : Google Scholar : PubMed/NCBI
|
|
3
|
Kodali S, Connor AA, Brombosz EW and
Ghobrial RM: Update on the screening, diagnosis, and management of
cholangiocarcinoma. Gastroenterol Hepatol (N Y). 20:151–158.
2024.PubMed/NCBI
|
|
4
|
Bertuccio P, Malvezzi M, Carioli G, Hashim
D, Boffetta P, El-Serag HB, La Vecchia C and Negri E: Global trends
in mortality from intrahepatic and extrahepatic cholangiocarcinoma.
J Hepatol. 71:104–114. 2019. View Article : Google Scholar : PubMed/NCBI
|
|
5
|
Adeva J, Sangro B, Salati M, Edeline J, La
Casta A, Bittoni A, Berardi R, Bruix J and Valle JW: Medical
treatment for cholangiocarcinoma. Liver Int. 39 (Suppl
1):S123–S142. 2019. View Article : Google Scholar
|
|
6
|
Rizvi S and Gores GJ: Pathogenesis,
diagnosis and management of cholangiocarcinoma. Gastroenterology.
145:1215–1229. 2013. View Article : Google Scholar
|
|
7
|
Neoptolemos JP, Moore MJ, Cox TF, Valle
JW, Palmer DH, McDonald AC, Carter R, Tebbutt NC, Dervenis C, Smith
D, et al: Effect of adjuvant chemotherapy with fluorouracil plus
folinic acid or gemcitabine vs observation on survival in patients
with resected periampullary adenocarcinoma: The ESPAC-3
periampullary cancer randomized trial. JAMA. 308:147–156. 2012.
View Article : Google Scholar : PubMed/NCBI
|
|
8
|
Okusaka T, Nakachi K, Fukutomi A, Mizuno
N, Ohkawa S, Funakoshi A, Nagino M, Kondo S, Nagaoka S, Funai J, et
al: Gemcitabine alone or in combination with cisplatin in patients
with biliary tract cancer: A comparative multicentre study in
Japan. Br J Cancer. 103:469–474. 2010. View Article : Google Scholar : PubMed/NCBI
|
|
9
|
Valle J, Wasan H, Palmer DH, Cunningham D,
Anthoney A, Maraveyas A, Madhusudan S, Iveson T, Hughes S, Pereira
SP, et al: Cisplatin plus gemcitabine versus gemcitabine for
biliary tract cancer. N Engl J Med. 362:1273–1281. 2010. View Article : Google Scholar : PubMed/NCBI
|
|
10
|
Fouassier L, Marzioni M, Afonso MB, Dooley
S, Gaston K, Giannelli G, Rodrigues CMP, Lozano E, Mancarella S,
Segatto O, et al: Signalling networks in cholangiocarcinoma:
Molecular pathogenesis, targeted therapies and drug resistance.
Liver Int. 39:43–62. 2019. View Article : Google Scholar : PubMed/NCBI
|
|
11
|
Sarikas A, Hartmann T and Pan ZQ: The
cullin protein family. Genome Biol. 12:2202011. View Article : Google Scholar : PubMed/NCBI
|
|
12
|
Kamitani T, Kito K, Nguyen HP and Yeh ET:
Characterization of NEDD8, a developmentally down-regulated
ubiquitin-like protein. J Biol Chem. 272:28557–28562. 1997.
View Article : Google Scholar : PubMed/NCBI
|
|
13
|
Zhang S, Yu Q, Li Z, Zhao Y and Sun Y:
Protein neddylation and its role in health and diseases. Signal
Transduct Target Ther. 9:852024. View Article : Google Scholar : PubMed/NCBI
|
|
14
|
Wang P, Song J and Ye D: CRL3s: The
BTB-CUL3-RING E3 ubiquitin ligases. Adv Exp Med Biol. 1217:211–223.
2020. View Article : Google Scholar : PubMed/NCBI
|
|
15
|
Cheng J, Guo J, Wang Z, North BJ, Tao K,
Dai X and Wei W: Functional analysis of Cullin 3 E3 ligases in
tumorigenesis. Biochim Biophys Acta Rev Cancer. 1869:11–28. 2018.
View Article : Google Scholar : PubMed/NCBI
|
|
16
|
Kim B, Nam HJ, Pyo KE, Jang MJ, Kim IS,
Kim D, Boo K, Lee SH, Yoon JB, Baek SH and Kim JH: Breast cancer
metastasis suppressor 1 (BRMS1) is destabilized by the Cul3-SPOP E3
ubiquitin ligase complex. Biochem Biophys Res Commun. 415:720–726.
2011. View Article : Google Scholar : PubMed/NCBI
|
|
17
|
Grau L, Luque-Garcia JL, González-Peramato
P, Theodorescu D, Palou J, Fernandez-Gomez JM and Sánchez-Carbayo
M: A quantitative proteomic analysis uncovers the relevance of CUL3
in bladder cancer aggressiveness. PLoS One. 8:e533282013.
View Article : Google Scholar : PubMed/NCBI
|
|
18
|
Yuan WC, Lee YR, Huang SF, Lin YM, Chen
TY, Chung HC, Tsai CH, Chen HY, Chiang CT, Lai CK, et al: A
Cullin3-KLHL20 ubiquitin ligase-dependent pathway targets PML to
potentiate HIF-1 signaling and prostate cancer progression. Cancer
Cell. 20:214–228. 2011. View Article : Google Scholar : PubMed/NCBI
|
|
19
|
Zhou J, Zhang S, Xu Y, Ye W, Li Z, Chen Z
and He Z: Cullin 3 overexpression inhibits lung cancer metastasis
and is associated with survival of lung adenocarcinoma. Clin Exp
Metastasis. 37:115–124. 2020. View Article : Google Scholar : PubMed/NCBI
|
|
20
|
Kerdkumthong K, Roytrakul S, Songsurin K,
Pratummanee K, Runsaeng P and Obchoei S: Proteomics and
bioinformatics identify drug-resistant-related genes with
prognostic potential in cholangiocarcinoma. Biomolecules.
14:9692024. View Article : Google Scholar : PubMed/NCBI
|
|
21
|
Wattanawongdon W, Hahnvajanawong C, Namwat
N, Kanchanawat S, Boonmars T, Jearanaikoon P, Leelayuwat C,
Techasen A and Seubwai W: Establishment and characterization of
gemcitabine-resistant human cholangiocarcinoma cell lines with
multidrug resistance and enhanced invasiveness. Int J Oncol.
47:398–410. 2015. View Article : Google Scholar : PubMed/NCBI
|
|
22
|
Kerdkumthong K, Chanket W, Runsaeng P,
Nanarong S, Songsurin K, Tantimetta P, Angsuthanasombat C,
Aroonkesorn A and Obchoei S: Two recombinant bacteriocins,
rhamnosin and lysostaphin, show synergistic anticancer activity
against gemcitabine-resistant cholangiocarcinoma cell lines.
Probiotics Antimicrob Proteins. 16:713–725. 2024. View Article : Google Scholar : PubMed/NCBI
|
|
23
|
Johansson C, Samskog J, Sundström L,
Wadensten H, Björkesten L and Flensburg J: Differential expression
analysis of Escherichia coli proteins using a novel software
for relative quantitation of LC-MS/MS data. Proteomics.
6:4475–4485. 2006. View Article : Google Scholar : PubMed/NCBI
|
|
24
|
Thorsell A, Portelius E, Blennow K and
Westman-Brinkmalm A: Evaluation of sample fractionation using
micro-scale liquid-phase isoelectric focusing on mass spectrometric
identification and quantitation of proteins in a SILAC experiment.
Rapid Commun Mass Spectrom. 21:771–778. 2007. View Article : Google Scholar : PubMed/NCBI
|
|
25
|
Livak KJ and Schmittgen TD: Analysis of
relative gene expression data using real-time quantitative PCR and
the 2(−delta delta C(T)) method. Methods. 25:402–408. 2001.
View Article : Google Scholar : PubMed/NCBI
|
|
26
|
Chandrashekar DS, Karthikeyan SK, Korla
PK, Patel H, Shovon AR, Athar M, Netto GJ, Qin ZS, Kumar S, Manne
U, et al: UALCAN: An update to the integrated cancer data analysis
platform. Neoplasia. 25:18–27. 2022. View Article : Google Scholar : PubMed/NCBI
|
|
27
|
Tang Z, Kang B, Li C, Chen T and Zhang Z:
GEPIA2: An enhanced web server for large-scale expression profiling
and interactive analysis. Nucleic Acids Res. 47:W556–W560. 2019.
View Article : Google Scholar : PubMed/NCBI
|
|
28
|
Pontén F, Jirström K and Uhlen M: The
Human Protein Atlas-a tool for pathology. J Pathol. 216:387–393.
2008. View Article : Google Scholar : PubMed/NCBI
|
|
29
|
Szklarczyk D, Gable AL, Nastou KC, Lyon D,
Kirsch R, Pyysalo S, Doncheva NT, Legeay M, Fang T, Bork P, et al:
The STRING database in 2021: Customizable protein-protein networks
and functional characterization of user-uploaded gene/measurement
sets. Nucleic Acids Res. 49:D605–D612. 2021. View Article : Google Scholar : PubMed/NCBI
|
|
30
|
Mi H, Muruganujan A, Ebert D, Huang X and
Thomas PD: PANTHER version 14: More genomes, a new PANTHER GO-slim
and improvements in enrichment analysis tools. Nucleic Acids Res.
47:D419–D426. 2019. View Article : Google Scholar : PubMed/NCBI
|
|
31
|
Ge SX, Jung D and Yao R: ShinyGO: A
graphical gene-set enrichment tool for animals and plants.
Bioinform. 36:2628–2629. 2020. View Article : Google Scholar
|
|
32
|
Bulatov E and Ciulli A: Targeting
Cullin-RING E3 ubiquitin ligases for drug discovery: Structure,
assembly and small-molecule modulation. Biochem J. 467:365–386.
2015. View Article : Google Scholar : PubMed/NCBI
|
|
33
|
Chen RH: Cullin 3 and its role in
tumorigenesis. Adv Exp Med Biol. 1217:187–210. 2020. View Article : Google Scholar : PubMed/NCBI
|
|
34
|
Genschik P, Sumara I and Lechner E: The
emerging family of CULLIN3-RING ubiquitin ligases (CRL3s): Cellular
functions and disease implications. EMBO J. 32:2307–2320. 2013.
View Article : Google Scholar : PubMed/NCBI
|
|
35
|
Chen HY and Chen RH: Cullin 3 ubiquitin
ligases in cancer biology: Functions and therapeutic implications.
Front Oncol. 6:1132016. View Article : Google Scholar : PubMed/NCBI
|
|
36
|
Haagenson KK, Tait L, Wang J, Shekhar MP,
Polin L, Chen W and Wu GS: Cullin-3 protein expression levels
correlate with breast cancer progression. Cancer Biol Ther.
13:1042–1046. 2012. View Article : Google Scholar : PubMed/NCBI
|
|
37
|
Dong M, Qian M and Ruan Z: CUL3/SPOP
complex prevents immune escape and enhances chemotherapy
sensitivity of ovarian cancer cells through degradation of PD-L1
protein. J Immunother Cancer. 10:e0052702022. View Article : Google Scholar : PubMed/NCBI
|
|
38
|
Dorr C, Janik C, Weg M, Been RA, Bader J,
Kang R, Ng B, Foran L, Landman SR, O'Sullivan MG, et al: Transposon
mutagenesis screen identifies potential lung cancer drivers and
CUL3 as a tumor suppressor. Mol Cancer Res. 13:1238–1247. 2015.
View Article : Google Scholar : PubMed/NCBI
|
|
39
|
Feng Y, Zhao M, Wang L, Li L, Lei JH, Zhou
J, Chen J, Wu Y, Miao K and Deng CX: The heterogeneity of signaling
pathways and drug responses in intrahepatic cholangiocarcinoma with
distinct genetic mutations. Cell Death Dis. 15:342024. View Article : Google Scholar : PubMed/NCBI
|
|
40
|
Zhao M, Quan Y, Zeng J, Lyu X, Wang H, Lei
JH, Feng Y, Xu J, Chen Q, Sun H, et al: Cullin3 deficiency shapes
tumor microenvironment and promotes cholangiocarcinoma in
liver-specific Smad4/Pten mutant mice. Int J Biol Sci.
17:4176–4191. 2021. View Article : Google Scholar : PubMed/NCBI
|
|
41
|
Li X, Yang KB, Chen W, Mai J, Wu XQ, Sun
T, Wu RY, Jiao L, Li DD, Ji J, et al: CUL3 (cullin 3)-mediated
ubiquitination and degradation of BECN1 (beclin 1) inhibit
autophagy and promote tumor progression. Autophagy. 17:4323–4340.
2021. View Article : Google Scholar : PubMed/NCBI
|
|
42
|
Zeng R, Tan G, Li W and Ma Y: Increased
expression of cullin 3 in nasopharyngeal carcinoma and knockdown
inhibits proliferation and invasion. Oncol Res. 26:111–122. 2018.
View Article : Google Scholar : PubMed/NCBI
|
|
43
|
Howley BV, Mohanty B, Dalton A, Grelet S,
Karam J, Dincman T and Howe PH: The ubiquitin E3 ligase ARIH1
regulates hnRNP E1 protein stability, EMT and breast cancer
progression. Oncogene. 41:1679–1690. 2022. View Article : Google Scholar : PubMed/NCBI
|
|
44
|
Mao X, Gluck N, Chen B, Starokadomskyy P,
Li H, Maine GN and Burstein E: COMMD1 (copper metabolism MURR1
domain-containing protein 1) regulates Cullin RING ligases by
preventing CAND1 (Cullin-associated Nedd8-dissociated protein 1)
binding. J Biol Chem. 286:32355–32365. 2011. View Article : Google Scholar : PubMed/NCBI
|
|
45
|
Zhu T, Peng X, Cheng Z, Gong X, Xing D,
Cheng W and Zhang M: COMMD3 expression affects angiogenesis through
the HIF1α/VEGF/NF-κB signaling pathway in
hepatocellular carcinoma in vitro and in vivo. Oxid
Med Cell Longev. 2022:16555022022. View Article : Google Scholar : PubMed/NCBI
|
|
46
|
Huang W, Mei J, Liu YJ, Li JP, Zou X, Qian
XP and Zhang Y: An analysis regarding the association between
proteasome (PSM) and hepatocellular carcinoma (HCC). J Hepatocell
Carcinoma. 10:497–515. 2023. View Article : Google Scholar : PubMed/NCBI
|
|
47
|
Sun L, Wu C, Ming J, Guo E, Zhang W, Li L
and Hu G: EGLN1 induces tumorigenesis and radioresistance in
nasopharyngeal carcinoma by promoting ubiquitination of p53 in a
hydroxylase-dependent manner. J Cancer. 13:2061–2073. 2022.
View Article : Google Scholar : PubMed/NCBI
|
|
48
|
Gulliver C, Hoffmann R and Baillie G: The
enigmatic helicase DHX9 and its association with the hallmarks of
cancer. Future Sci OA. 7:FSO6502020. View Article : Google Scholar : PubMed/NCBI
|
|
49
|
Bielli P, Pagliarini V, Pieraccioli M,
Caggiano C and Sette C: Splicing dysregulation as oncogenic driver
and passenger factor in brain tumors. Cells. 9:102019. View Article : Google Scholar : PubMed/NCBI
|
|
50
|
Mi H, Muruganujan A, Casagrande JT and
Thomas PD: Large-scale gene function analysis with the PANTHER
classification system. Nat Protoc. 8:1551–1566. 2013. View Article : Google Scholar : PubMed/NCBI
|
|
51
|
Hanahan D and Weinberg RA: Hallmarks of
cancer: The next generation. Cell. 144:646–674. 2011. View Article : Google Scholar : PubMed/NCBI
|
|
52
|
Thomas PD: The Gene Ontology and the
meaning of biological function. Methods Mol Biol. 1446:15–24. 2017.
View Article : Google Scholar : PubMed/NCBI
|
|
53
|
Esteve-Puig R, Bueno-Costa A and Esteller
M: Writers, readers and erasers of RNA modifications in cancer.
Cancer lett. 474:127–137. 2020. View Article : Google Scholar : PubMed/NCBI
|
|
54
|
Hu H, Hu W, Guo AD, Zhai L, Ma S, Nie HJ,
Zhou BS, Liu T, Jia X, Liu X, et al: Spatiotemporal and direct
capturing global substrates of lysine-modifying enzymes in living
cells. Nat Commun. 15:14652024. View Article : Google Scholar : PubMed/NCBI
|
|
55
|
Wilkinson E, Cui YH and He YY:
Context-dependent roles of RNA modifications in stress responses
and diseases. Int J Mol Sci. 22:19492021. View Article : Google Scholar : PubMed/NCBI
|