Introduction
Acute myeloid leukemia (AML) is the most common
hematopoietic tumor and mainly affects older adults (1). In 2020, worldwide statistics
indicated that AML was the thirteenth most common type of cancer in
terms of incidence and had the tenth highest mortality rate
(2). Men are more susceptible to
AML than women (6.4 vs. 4.3%) (2),
and the overall survival rate is ~50% in young patients (18–50
years) but only 10% in adults >65 years old (3).
AML is characterized by accelerated and autonomous
growth of immature myeloid cells, leading to the dysregulation of
hematological components (4–6).
Some mutations are relevant for cell survival and proliferation,
such as tyrosine-protein kinase (c-Kit) and FMS-like
tyrosine kinase 3 (Flt3) mutations, which are directly
related to AML progression (7,8).
Notably, 25–35% of patients with AML have mutations that result in
the upregulation of expression of the FLT3 receptor, which is
related to high malignancy and poor prognosis (9).
FLT3 is part of the class III receptor tyrosine
kinase (RTK) family. It is typically expressed in early myeloid and
lymphoid CD34+ precursors, and its expression gradually
decreases during cell differentiation (10). The FLT3 receptor consists of five
domains: An immunoglobulin-like extracellular domain, which is the
site of ligand binding and FLT3 activation (which is activated in
synergy with IL-3 and granulocyte-macrophage colony-stimulating
factor), a transmembrane domain, a juxtamembrane domain (JMD) and
two cytoplasmic tyrosine kinase-like domains (TKDs; TKD1 and TKD2),
which constitute the catalytic domain of FLT3 and are critical for
receptor activation (10–12). Upon ligand binding, FLT3 activity
is mediated by the JMD through phosphorylation of Tyr589 and Tyr591
amino acid residues. This phosphorylation promotes conformational
changes that free the activation loop (A-loop) present in TKD1 and
the phenylalanine residue of the aspartic
acid-phenylalanine-glycine motif (DFG motif) (13).
The DFG motif, which is part of the ATP-binding
site, is highly conserved and essential for the function of RTKs
such as FLT3 (14). Depending on
the type of ligand, the DFG motif can change between its inactive
DFG motif (DFG-out) or active DFG motif (DFG-in) form (13,15).
The DFG-out conformation occurs when Asp flips the ATP binding site
outward and Phe moves out of the hydrophobic site (14,16,17).
Conversely, the DFG-in conformation occurs when Phe is packed in a
hydrophobic pocket and Asp moves toward the ATP binding site to
interact with Mg2+ (18). FLT3/DFG-in activation stimulates
proliferation and survival signaling pathways via Janus kinase
(JAK)/STAT5, AKT/ERK and PI3K (10–13,19).
In patients with AML, common activating mutations in
FLT3 include the Asp835Tyr (D835Y) point mutation in TKD1 and the
internal tandem duplication (ITD) in JMD or TKD1 (3,20).
ITD mutations in JMD and TKD1 affect 5–16% of pediatric patients
(<10 years old) and 25–35% of adult patients (3,20).
Patients with ITD-FLT3 mutations exhibit poor prognosis associated
with the upregulation of this receptor, which leads to high
proliferation and survival of leukemic cells, resistance to
treatment, increased risk of relapse and decreased survival
(3,20). Therefore, the ITD-FLT3 receptor
requires special consideration as a drug target (21).
The ITD insertion (3–400 base pairs) occurs between
exons 14 and 15 of the Flt3 gene, corresponding to the JMD
or TKD1 domains of FLT3. At the protein level, the new amino acids
are commonly inserted within a sequence of one to seven amino acids
[F(Y)DFREYE/YDLK], corresponding to codons 591–597 of the original
open reading frame (3,8,22).
The length of ITD insertion changes the size of FLT3 and may
influence its activity and the effects of its inhibitors (3,8,22).
Drugs that inhibit tyrosine kinase activity are
widely used as AML treatments, alone or in combination with
chemotherapy (23,24). FLT3 inhibitors have improved the
overall survival of patients with leukemia. Due to their efficacy
and being associated with fewer adverse effects compared with
chemotherapy, they represent a major improvement in AML treatment.
However, first-generation tyrosine kinase inhibitors (TKIs;
including midostaurin and sorafenib) lack specificity for FLT3 as
they bind to several RTKs (C-KIT, platelet-derived growth factor
receptor, RAS, RAF, JAK2 and VEGFR), contributing to strong side
effects, such as diarrhea, fatigue, nausea, cardiovascular problems
and myelosuppression (25).
Additionally, some patients with AML may develop resistance to TKIs
(24,26,27).
Conversely, second-generation TKIs, including quizartinib and
gilteritinib, have a more specific effect, both for wild-type (WT)
and ITD-mutated forms of the FLT3 receptor. Therefore, they can be
used in lower concentrations than first-generation TKIs, resulting
in lower toxicity and fewer side effects (11,23,24).
TKIs can also be classified based on their selective binding to the
DFG-out or DFG-in conformations of the FLT3 receptor. Type I
inhibitors (midostaurin and gilteritinib) bind preferably to the
ATP pocket of the DFG-in conformation (active motif), while type II
inhibitors (sorafenib and quizartinib) bind preferably to the
hydrophobic region of FLT3 adjacent to the ATP pocket of the
DFG-out conformation (inactive motif) (23).
Over the past 15 years, the efficiency of several
TKIs has been evaluated in patients with AML. Midostaurin,
gilteritinib and quizartinib have been approved by the Food and
Drug Administration (FDA) for AML treatment (24). However, little is known about the
effects of ITD mutations on the molecular interactions and affinity
forces of these inhibitors. Therefore, it is crucial to carefully
investigate these parameters and their impact on the inhibitory
activity of TKIs in AML cells.
Bioinformatics provides valuable tools to assess
molecular interactions and predict the theoretical potential of
specific inhibitors for a particular target. Examples of these
tools include homology modeling of protein structure (HMP) and
molecular docking. HMP helps approximate the atomic structure of a
specific protein based on the known structure of a related protein
available from databases such as the Protein Data Base (PDB)
(28–30). HMP is achieved using two
phylogenetically close protein structures with a high percentage of
similarity, one serving as a template and the other as a target
(30). Once a good quality model
of the protein of interest is obtained, molecular docking
facilitates the prediction of the molecular interactions between a
ligand and a protein, calculating their affinity force through
polar (H-bonds) and non-polar bonds (31).
Several AML cell lines expressing WT or ITD-mutated
FLT3 receptors have been established for experimental evaluation of
inhibitors. These are useful for obtaining an in vitro model
to study the disease and validate the predictions of in
silico approaches. Previous studies have used WT-FLT3
homozygous cell lines (HL60, THP1, OCI-AML3 and MUTZ-2 cell lines),
while other studies have used WT/ITD-FLT3 heterozygous cell lines
(MOLM-13, MOLM-14 and PL21 cell lines) or the MV4-11 and MULT-11
ITD-FLT3 cell lines with loss of heterozygosity (LOH) of FLT3
(15,32–35).
The present study was designed to assess the
molecular interactions and affinity forces of four TKIs (sorafenib,
midostaurin, gilteritinib and quizartinib) with the WT-FLT3 and
ITD-FLT3 receptors in their DFG-out and DFG-in conformations in
silico. Furthermore, the present study evaluated the effect of
the second-generation inhibitors gilteritinib and quizartinib on
MV4-11 (ITD-FLT3) and HL60 (WT-FLT3) AML cell lines, and peripheral
blood mononuclear cells (PBMCs; FLT3-negative) from a healthy
volunteer in vitro.
Materials and methods
In silico assay
Homology modeling of proteins
The in silico models of WT-FLT3 and ITD-FLT3
in their DFG-in and DFG-out conformations were prepared using the
modeling assay algorithm proposed by Ke et al (13), Zorn et al (36), and Todde and Friedman (37).
WT-FLT3 modeling
A four-step strategy was applied. For WT-FLT3
modeling, the NP_004110.2 National Center for Biotechnology
Information (NCBI) reference sequence was chosen in addition to the
1RJB (autoinhibited; 2.1 Å resolution) and 6IL3 (inactive; 2.5 Å
resolution) protein templates (38,39).
Sequence identities of 1RJB and 6IL3 were calculated and compared
with the reference sequence using the NCBI protein-Basic Local
Alignment Search Tool v.2.15.0 (https://blast.ncbi.nlm.nih.gov/Blast.cgi) (40). Paired global alignment of the
sequences was also carried out to identify their extension and
similarity. Sequence identity was calculated for the 1RJB and 6IL3
structures of WT-FLT3. The best quality WT-FLT3 model of the
DFG-out (WT-FLT3/DFG-out) conformation was selected using the
SWISS-MODEL tool (http://swissmodel.expasy.org) from the Expasy: Swiss
Institute of Bioinformatics server (41). The WT-FLT3/DFG-in model was then
obtained, considering the c-Kit protein in DFG-in conformation as a
template (1PKG; 2.9 Å resolution) and our WT-FLT3/DFG-out model
using the SWISS-MODEL server as the target (41,42).
The identity between sequences was calculated using the Clustal W
tool v.1.81 (43) from the MEGA X
v.11.0.13 software (41).
Insertion of the ITD sequence in the
FLT3 model
The ITD sequence [H(L)VDFREYEYD/LKWE], previously
described by Reiter et al (44) in the Z region of JMD (JMD-Z), was
incorporated using the MODELLER v. 9.25 program (45,46).
The best ITD-FLT3 model was selected based on the normalized
Discrete Optimized Protein Energy score (47). Finally, the 3Drefine (https://3drefine.mu.hekademeia.org/) server was
used to refine the structures and relax or correct errors of
interactions between amino acid residues (48).
Structure validation and obtention of
quality scores
Structural evaluation of the 3D models of WT-FLT3
and ITD-FLT3 in DFG-out and DFG-in conformations was performed with
the ERRAT (49), VERIFY3D
(50) and PROCHECK (51) programs, available from the SAVE
v.6.0 (https://saves.mbi.ucla.edu/) server
(2020). The quality of the formed structures was assessed using the
QMEAN (https://swissmodel.expasy.org/qmean/) (52), Molprobity v.4.5.2 (http://molprobity.biochem.duke.edu/)
(53), ProSA (https://prosa.services.came.sbg.ac.at/prosa.php)
(54) and ProQ v.1.2 (https://proq.bioinfo.se/cgi-bin/ProQ/ProQ.cgi) servers
(55).
Molecular docking
Identification of the binding site of FLT3
The identification of the parameters of the FLT3
binding site was based on the coordinates and co-crystallized
ligands available from Protein Data Bank (PDB, http://www.rcsb.org/) (6IL3 and 1PGK) using the
University of California, San Francisco (UCSF)-Chimera v.1.16
software, AutoDock Tools v.1.5.6 and ProQ v.1.2 servers (39,42,46,56).
For the DFG-out conformation of FLT3, a box size of 24×24×24 Å,
with a center localization in x=74.64, y=50.01 and z=24.46, was
considered. For DFG-in, the box size was 24×24×24 Å, and the center
was x=25, y=27.5 and z=26.8. The parameters of the binding site
were validated by redocking assays using 6IL3 and 1PGK structures
and their co-crystallized ligands (Fig. S1).
Molecular docking of sorafenib,
midostaurin, gilteritinib and quizartinib with the FLT3 receptor
models
The structures of the four TKIs were obtained from
the ZINC 15 database (Table I)
(57). Before docking, the ligands
and FLT3 models were conditioned by removing water molecules and
extra ligands from the protein and ligand surfaces, and by adding
polar hydrogen atoms and atomic charges, such as semi-empirical
with bond charge correction charges for FLT3 receptors and
Gasteiger charges for ligands. Finally, all structures were
minimized using the UCSF-Chimera v.1.16 and Autodock tools v.1.5.6
(46,58).
 | Table I.Classification and ZINC ID of the
four TKIs included in the study. |
Table I.
Classification and ZINC ID of the
four TKIs included in the study.
| TKI | Generation | Type | ZINC ID
(ZINC15) |
|---|
| Sorafenib | First | II | ZINC100013130 |
| Midostaurin |
| I | ZINC1493878 |
| Gilteritinib | Second | I | ZINC113476229 |
| Quizartinib |
| II | ZINC43204002 |
Based on the established parameter sets, 100 models
of molecular docking were run for each of the four FLT3 models and
each of the four TKIs using Autodock-Vina software v.1.1.2
(59). The best ligand-protein
complexes were selected based on the lowest ΔG free energy
(kcal/mol), root-mean-square deviation ≤3.0, and the number of
covalent and non-covalent bonds, considering true contact when
polar bonds presented a length ≤5 Å (58). The most stable complexes were
visualized with PyMOL v.2.5.4 (60) and Discovery Studio v.21.1.0.20298
(BIOVIA).
In vitro assays
Cell culture
Two AML cell lines were selected to study leukemia
in vitro. The MV4-11 cell line (ITD-FLT3) was acquired from
American Type Culture Collection (CRL-9591). According to Human
Genome Variation Society nomenclature, the MV4-11 cells present the
NP_004110.2:p.(Leu601His_Lys602insVDFREYEYD) variant (61). The HL60 cell line (WT-FLT3) was
obtained from the Cell Bank of the Western Biomedical Research
Center of Mexican Social Security Institute (Guadalajara, México).
According to the French-American-British classification, which
classifies AML cells into eight groups (M0 to M7) based on
morphological and cytochemical characteristics, the MV4-11 cell
line is classified as M5 and the HL60 cell line as M2 (32,62,63).
The PBMCs (FLT3-negative) used as a negative control were obtained
with the written informed consent of a healthy volunteer (30 years;
female; Zapopan, Mexico; April-August 2023). The samples were
collected at the Biomedicine and Ecology Molecular Markers
Laboratory of Biological and Agricultural Sciences Campus,
University of Guadalajara (Zapopan, Mexico) using ethical criteria
for collecting biological samples. All cell cultures were performed
at 37°C in a CO2 incubator (Binder CO2
incubator CB-S 170; BINDER GmbH) with 5% CO2 and 95%
humidity in Iscove's Modified Dulbecco's medium (cat. no.
I7633-10X1L; Sigma-Aldrich; Merck KGaA) supplemented with 10% FBS
(cat. no. BIO-S1650-500; Biowest) and 1% penicillin/streptomycin
(cat. no. P4333-100ML; Sigma-Aldrich; Merck KGaA).
Validation of the ITD mutation in FLT3
in the MV4-11 cell line
The presence/absence of the ITD mutation in FLT3 was
validated by end-point PCR using genomic DNA (gDNA) isolated from
the cell lines and PBMCs using the rapid isolation of mammalian DNA
extraction protocol by Sambrook and Russell (64). The primer pair sequences were: FLT3
forward, 5′-GCAATTTAGGTATGAAAGCCAGC-3′ and reverse,
5′-CTTTCAGCATTTTGACGGCAACC-3′ (65). The primers were synthetized by
Integrated DNA Technologies, Inc. The PCR reaction contained 50 ng
gDNA, 1X PCR buffer, 1.5 mM MgCl2, 0.4 mM dNTPs, 0.4 µM
forward and reverse primers, and 0.5 U Taq Polymerase (cat.
no. 10342053; Invitrogen; Thermo Fisher Scientific, Inc.). The
amplification program was as follows: Initial denaturation cycle at
94°C for 5 min, followed by 35 cycles of denaturation (94°C for 30
sec), hybridization (58°C for 40 sec) and elongation (72°C for 1
min), and a final elongation step at 72°C for 7 min. The
amplification products were separated on a 1.2% agarose gel (cat.
no. 16500-500; Invitrogen; Thermo Fisher Scientific, Inc.) stained
with GelRed (1:10,000; cat. no. 41003; Biotium, Inc.) and images
were captured with the D-DiGit image acquisition system (LI-COR
Biosciences).
FLT3 expression in the in vitro AML
model
To validate the presence of the FLT3 receptor, its
expression was measured by flow cytometry after labeling cell
surfaces with phycoerythrin (PE)-coupled anti-FLT3 (cat. no.
558996; BD Biosciences). The PE-coupled anti-IgG1 antibody (cat.
no. 555749; BD Biosciences) was used as an isotype control.
Parameter analysis was based on the intensity of the emitted
fluorescence signal and the percentage of the cell population
passing through the flow cell. A total of 10,000 events were
acquired using the BD Accuri C6 cytometer (BD Biosciences) and
analyzed using the statistical estimator super enhanced DMAX of the
FlowJo v.10 data analysis software (BD Life Sciences) (66).
Evaluation of cell viability
The in vitro assays focused on the
second-generation inhibitors gilteritinib (type I) and quizartinib
(type II) because they showed the best molecular interactions and
affinity forces with WT-FLT3 and ITD-FLT3 in both DFG-out and
DFG-in conformations. Notably, the FDA has recently approved both
inhibitors for clinical use in patients with AML (67,68).
Their cytotoxic effect on MV4-11 and HL60 cells, as
wells as PBMCs, was evaluated using the MTT assay. The cells were
seeded in 96-well plates (MV4-11 cells and PBMCs, 70,000 cells per
well; HL60 cells, 20,000 cells per well), preincubated for 48 h at
37°C, and exposed to increasing concentrations of gilteritinib
(cat. no. 21503; Cayman Chemical Company), or quizartinib (cat. no.
17986; Cayman Chemical Company) dissolved in DMSO (cat. no. D4540;
Sigma-Aldrich; Merck KGaA). For MV4-11 cells the 20, 10, 5, 2.5 and
1.25 nM range was used, and for HL60 cells the 800, 400, 20, 10, 5,
2.5 and 1.25 nM concentrations were applied based on a previous
report by Hu et al (69).
PBMCs were treated with the calculated IC50 of both
compounds in MV4-11 cells (7.99 nM gilteritinib or 4.76 nM
quizartinib). In addition, 3% DMSO (cat. no. D4540; Sigma-Aldrich;
Merck KGaA) was used as a death control, 100 nM etoposide (cat. no.
E1383; Sigma-Aldrich; Merck KGaA) as an apoptosis control and 0.1%
DMSO as a vehicle control. Cells without treatment were used as a
negative control. The exposure time to each inhibitor was 48 h at
37°C, which coincides approximately with the half-life of these
compounds (gilteritinib, 113 h; quizartinib, 73 h) (70,71).
MTT (5 mg/ml in 1X phosphate buffered saline) was added at the end
of the incubation period, and cell viability was evaluated
according to the manufacturer's instructions (cat. no. M2003;
Sigma-Aldrich; Merck KGaA). To dissolve the formazan crystals, half
of the culture medium (100 µl) was removed and
acidified-isopropanol was added (100 µl; 0.1 M HCl; cat. nos.
190764 and 320331; Sigma-Aldrich; Merck KGaA). Absorbance was
measured at 570/690 nm on a plate reader (XMARK; Bio-Rad
Laboratories, Inc.), and the absorbance values were converted to
viability percentages for analysis. All assays were performed in
triplicate and repeated three times. The IC50 (72) was calculated using the nonlinear
regression method with Rstudio v.2022.12.0+353 (http://www.rstudio.com/) (73) and GraphPad Prism v. 9
(Dotmatics).
Evaluation of apoptosis
To determine the effect of drugs on the level of
cell death, apoptosis was assessed by flow cytometry. First, the
cells were placed in 24-well plates (100,000 MV4-11 cells or PBMCs
per well; 40,000 HL60 cells per well) and incubated for 48 h at
37°C. The treatments (7.99 nM gilteritinib or 4.76 nM quizartinib)
were applied for 48 h in the same conditions as aforementioned.
These concentrations correspond to the IC50 of these
compounds for MV4-11 cells as determined in the present study.
Cells were also treated with the vehicle control (0.1% DMSO), death
control (3% DMSO) and apoptosis control (100 nM etoposide).
Finally, Annexin-V-FITC (cat. no. A13199; Invitrogen; Thermo Fisher
Scientific, Inc.) and PI (cat. no. P4170; Sigma-Aldrich; Merck
KGaA) were added to label the cells according to the manufacturer's
instructions. Three independent experiments were carried out for
each condition, and 10,000 events were acquired using the BD Accuri
C6 Plus cytometer (BD Biosciences). The data were analyzed with
FlowJo version 8 (BD Life Sciences) (66).
Evaluation of cell proliferation
The cells were plated in 24-well plates as
aforementioned, preincubated for 48 h at 37°C and labeled with
carboxyfluorescein succinimidyl ester (CFSE; 5 mM; cat. no. C1157;
Invitrogen; Thermo Fisher Scientific, Inc.) for 5 min at room
temperature. CFSE provides relevant information to monitor distinct
cell generations across a given time-period. Subsequently, the
cells were exposed to 7.99 nM gilteritinib or 4.76 nM quizartinib,
as well as vehicle (0.1% DMSO), death (3% DMSO) and apoptosis (100
nM etoposide) controls for 48 h at 37°C and collected for flow
cytometry (BD Accuri C6 Plus cytometer; BD Biosciences) analysis
considering 10,000 events per sample. In addition, the basal
proliferation indexes of untreated leukemia cells (MV4-11 and HL60)
and PBMCs were evaluated at 0 and 48 h at 37°C and compared with
the vehicle control. Three independent experiments were carried out
for each condition. The data were analyzed with FCS Express 7 (De
Novo Software).
Statistical analysis
One-way ANOVA was used to analyze the percentage of
FLT3 expression positivity in cell lines and PBMCs and determine
the effect of gilteritinib and quizartinib on viability. Tukey's
and Dunnett's post hoc tests were then performed, respectively.
Additionally, one-way ANOVA and two-way ANOVA, followed by
Dunnett's and Bonferroni's post hoc tests, respectively, were used
to determine the effect of gilteritinib and quizartinib on the
proliferation index and the induction of apoptosis of each cell
type and across cell types. Finally, the IC50 was
determined by nonlinear regression analysis with transformed
viability data. All data (triplicates repeated three times) are
presented as the mean ± SD. All data analyzed passed the
Shapiro-Wilk normality test and were analyzed with GraphPad Prism
version 9 for Windows (Dotmatics) and R Studio v.2022.12.0+353
software (http://www.rstudio.com/) (73). P<0.05 was considered to indicate
a statistically significant difference.
Results
In silico phase
Homology of the sequences used for WT-FLT3 and
ITD-FLT3 model construction
The sequences used for HMP allowed the construction
of high-quality models of WT-FLT3 and ITD-FLT3 in their DFG-out and
DFG-in conformations. First, the three FLT3 sequences (NP_004110.2,
1RJB and 6IL3) used for the construction of the WT-FLT3/DFG-out
model presented high amino acid homologies, reaching 96.1% between
1RJB and 6IL3, 87.09% between NP_004110.2 and 1RJB, and 86.90%
between NP_004110.2 and 6IL3, indicating that these sequences were
adequate for HMP (Fig. S2A;
Table II). Second, the addition
of the DFG-in motif of c-Kit (1PKG) was considered appropriate for
WT-FLT3/DFG-in construction because its sequence presented 57.45
and 58.66% homology with 1RJB and 6IL3, respectively (Fig. S2B; Table II). Third, the ITD sequence
VDFREYEYD (44) was successfully
inserted into the JMD-Z region of WT-FLT3/DFG-out to obtain the
ITD-mutated model of FLT3 (ITD-FLT3/DFG-out) (Fig. S2C). Fourth, the DFG-in motif of
c-Kit (1PKG) was added to the ITD-FLT3/DFG-out model to obtain
ITD-FLT3/DFG-in (Fig. S2D).
| Table II.Sequence homology presented as the
percentage of identity of the three sequences used for the homology
modeling of FMS-like tyrosine kinase 3. |
Table II.
Sequence homology presented as the
percentage of identity of the three sequences used for the homology
modeling of FMS-like tyrosine kinase 3.
| Sequence 1 | Sequence 2 | Identity (%) |
|---|
| (NP_004110.2) | 1RJB | 87.09 |
| (NP_004110.2) | 6IL3 | 86.90 |
| 1RJB | 6IL3 | 96.10 |
| 1RJB | 1PKG | 57.45 |
| 6IL3 | 1PKG | 58.66 |
Quality evaluation of WT-FLT3 and
ITD-FLT3 modeled structures in their DFG-out and DFG-in
conformations
Several bioinformatics tools were used to confirm
the quality of the four FLT3 models. These tools confirmed that the
WT-FLT3 and ITD-FLT3 structural models were appropriate and of high
quality in their DFG-out and DFG-in conformations (Table III).
| Table III.Quality scores of the in
silico models of FLT3 evaluated using ERRAT, VERIFY3D, QMEAN,
Molprobity, ProSA and ProQ. |
Table III.
Quality scores of the in
silico models of FLT3 evaluated using ERRAT, VERIFY3D, QMEAN,
Molprobity, ProSA and ProQ.
| Receptor | Conformation | ERRAT, % | Verify 3D, % | QMEAN quality
score | Molprobity | ProSA Z-score | ProQ LG-score |
|---|
| WT-FLT3 | DFG-out | 95.61 | 82.32 | 0.17 | 1.92 | −7.35 | 6.99 |
|
| DFG-in | 95.96 | 66.56 | −1.03 | 2.34 | −6.71 | 8.19 |
| ITD-FLT3 | DFG-out | 90.27 | 75.67 | −0.48 | 2.63 | −7.40 | 8.62 |
|
| DFG-in | 95.75 | 71.60 | −1.01 | 2.42 | −6.37 | 8.39 |
The ERRAT program verifies the quality structure of
proteins through the error function of the non-interactions of
reported structures compared with the high-resolution structure
database. Values of 95% or higher are considered to indicate good
high-resolution structures (1.5–2 A), while lower values (91% or
lower) correspond to lower resolution (2.5–3 A) (49). Thus, the WT-FLT3 in DFG-out and
DFG-in conformations, as well as ITD-FLT3/DFG-in, modeled
structures had high resolutions (95.61, 95.96 and 95.75%,
respectively), while the resolution of ITD-FLT3/DFG-out was lower
(90.27%) (Fig. S3; Table III).
The Verify 3D program determines the compatibility
of an atomic model (3D) with its own amino acid sequence (1D)
(50). The scores indicated that
the WT-FLT3/DFG-out model presented the best quality, followed by
the ITD-FLT3 models in DFG-out and DFG-in conformations and the
WT-FLT3/DFG-in model (Table
III).
The quality of the four models was confirmed using
the QMEAN, Molprobity, Z-score, and LG-score (Table III). The QMEAN quantifies the
accuracy of the model based on individual residual errors as well
as at the overall structural level (52). Molprobity determines the quality of
the structure based on the geometric scores of the Ramachandran
plots and sidechain rotamer (53).
The Z-score measures the deviation of the total energy of the
structure with respect to an energy distribution derived from
random conformations (54). The
LG-score calculates the frequency of atom-atom contacts and
predicts the quality of a model (55).
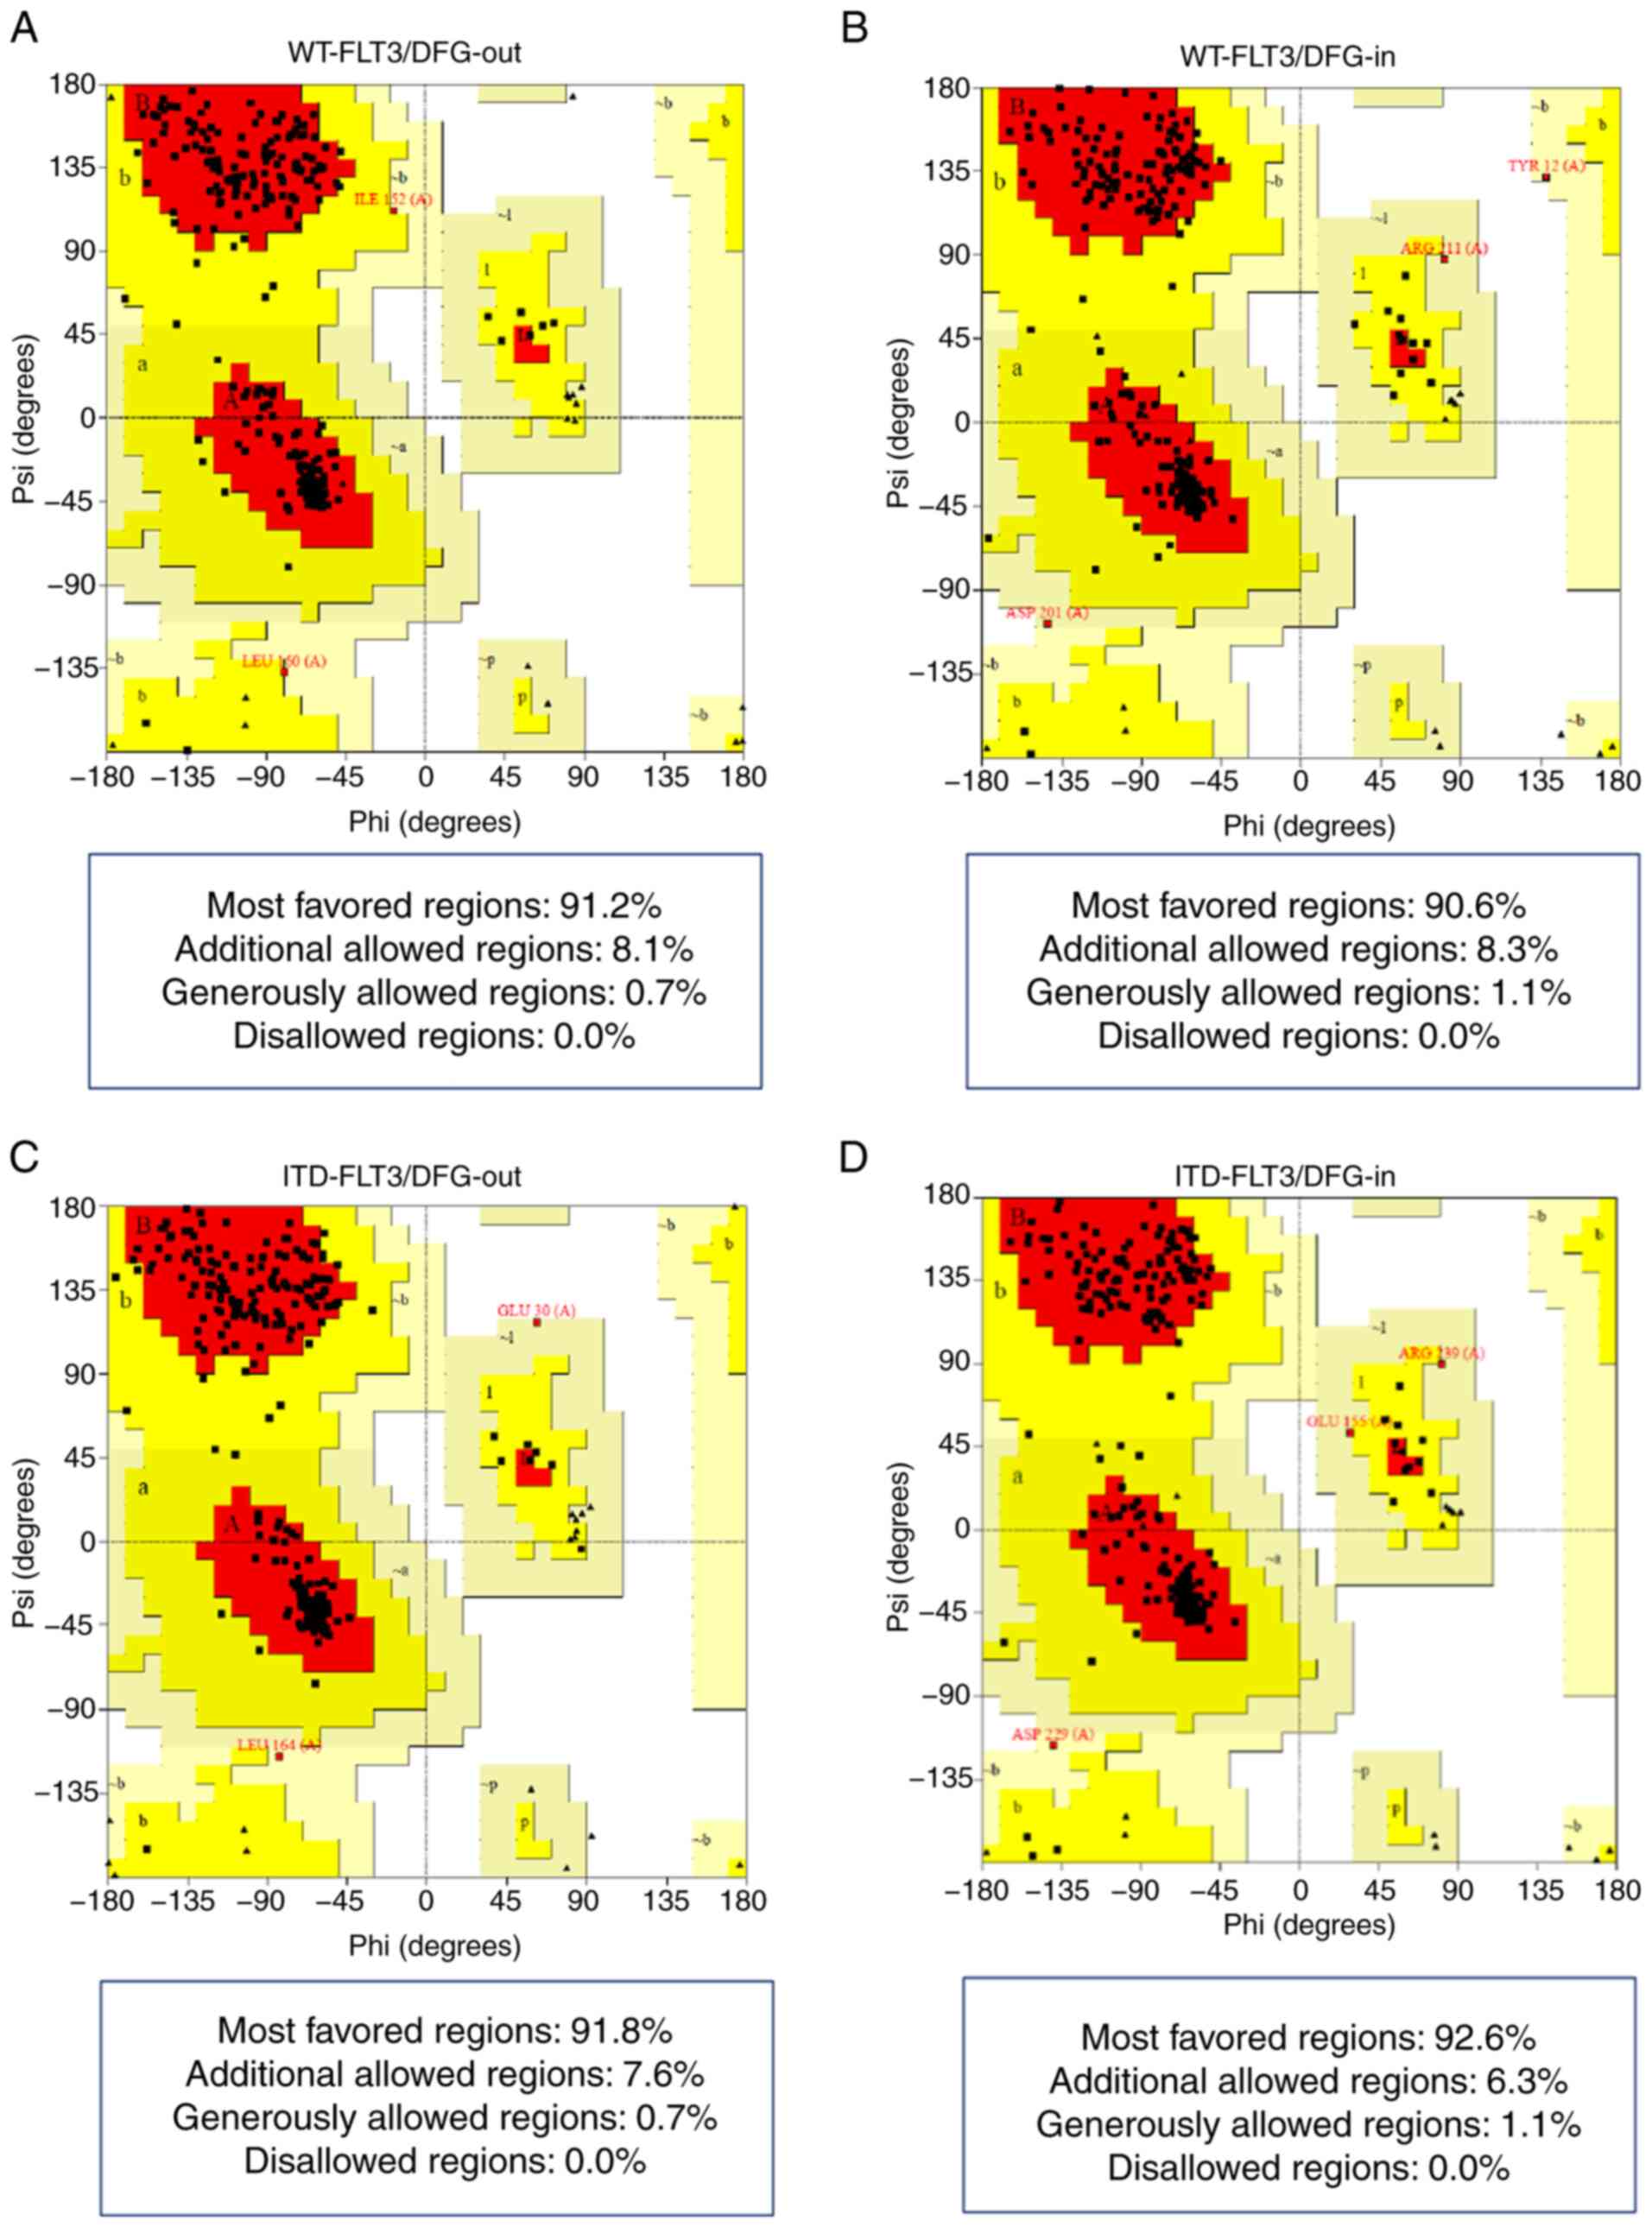
The Ramachandran plots showed that all four models
presented >90% of their amino acid residues within the most
favored regions according to the ψ and φ angles and none in
non-favorable regions (Fig. 1;
Table IV).
| Table IV.Ramachandran and G-factor values of
FLT3 in silico models determined using PROCHECK from the
SAVE 6.0 server. |
Table IV.
Ramachandran and G-factor values of
FLT3 in silico models determined using PROCHECK from the
SAVE 6.0 server.
|
|
| PROCHECK |
|---|
|
|
|
|
|---|
|
|
| Ramachandran
plot |
|
|
|
|---|
|
|
|
| G-factor |
|---|
|
|
| Most favored,
% | Additional allowed,
% | Generously allowed,
% | Disallowed, % |
|
|---|
| Receptor | Conformation | Dihedral | Covalent | Overall |
|---|
| WT-FLT3 | DFG-out | 91.2 | 8.1 | 0.7 | 0.0 | 0.10 | −1.00 | −0.40 |
|
| DFG-in | 90.6 | 8.3 | 1.1 | 0.0 | 0.01 | −1.39 | −0.62 |
| ITD-FLT3 | DFG-out | 91.8 | 7.6 | 0.7 | 0.0 | 0.11 | −1.16 | −0.47 |
|
| DFG-in | 92.6 | 6.3 | 1.1 | 0.0 | 0.04 | −1.26 | −0.55 |
Finally, the G-factor values obtained with PROCHECK
confirmed that each residue of the four structures lay in normal
stereochemical distribution, resulting in ordered and favorable
structures (Fig. 2; Table IV).
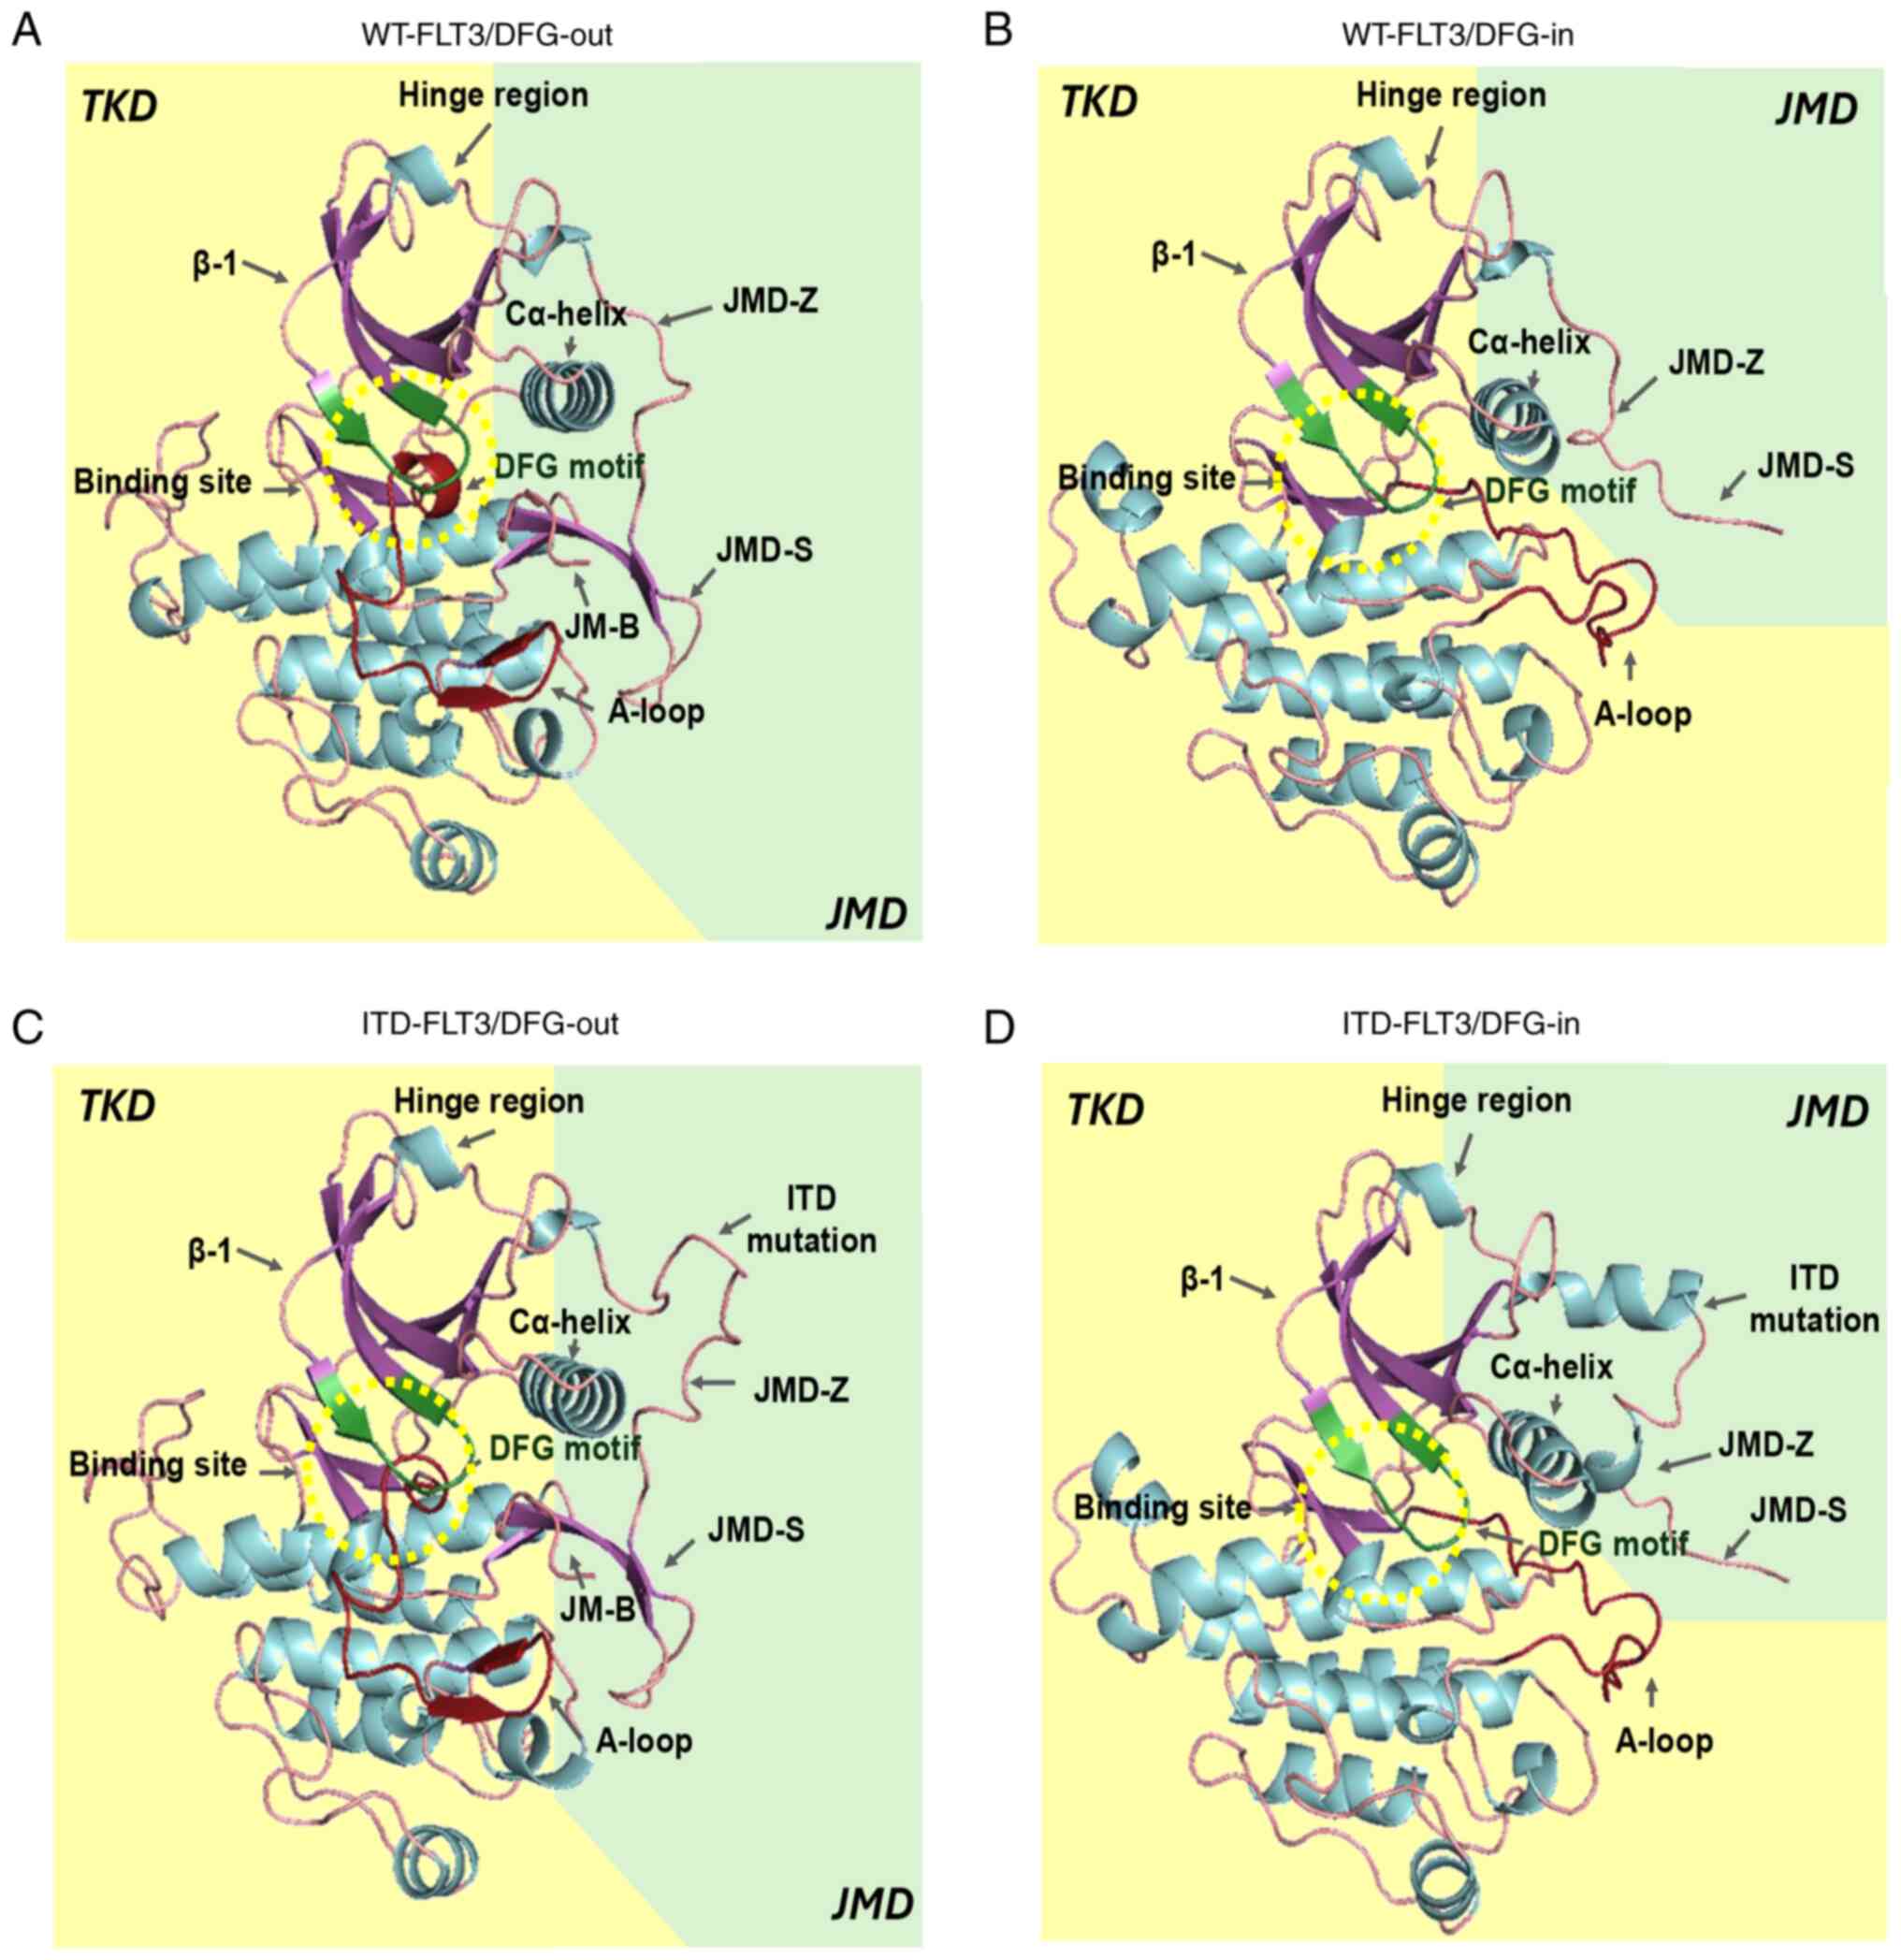 | Figure 2.In silico models of FLT3. (A)
WT-FLT3/DFG-out. (B) WT-FLT3/DFG-in. (C) ITD-FLT3/DFG-out. (D)
ITD-FLT3/DFG-in. The arrows show the JMD-Z, JMD-S and JMD-B regions
of the JMD and the ITD mutation of the ITD-FLT3 models. The
catalytic site (green β-sheets) and DFG motif (red β-sheets) are
found within the yellow dotted circle. A-loop, activation loop;
DFG-in, active aspartic acid-phenylalanine-glycine motif; DFG-out,
inactive aspartic acid-phenylalanine-glycine motif; FLT3, FMS-like
tyrosine kinase 3; ITD, internal tandem duplication; JM-B, JM
binding motif; JMD, juxtamembrane domain; JMD-Z, Z region of JMD;
TKD, tyrosine kinase-like domain; WT, wild-type. |
Altogether, these indexes confirmed the good quality
scores applied using bioinformatics tools to all synthetic receptor
3D models of FLT3, guaranteeing that all were suitable for the
following analysis.
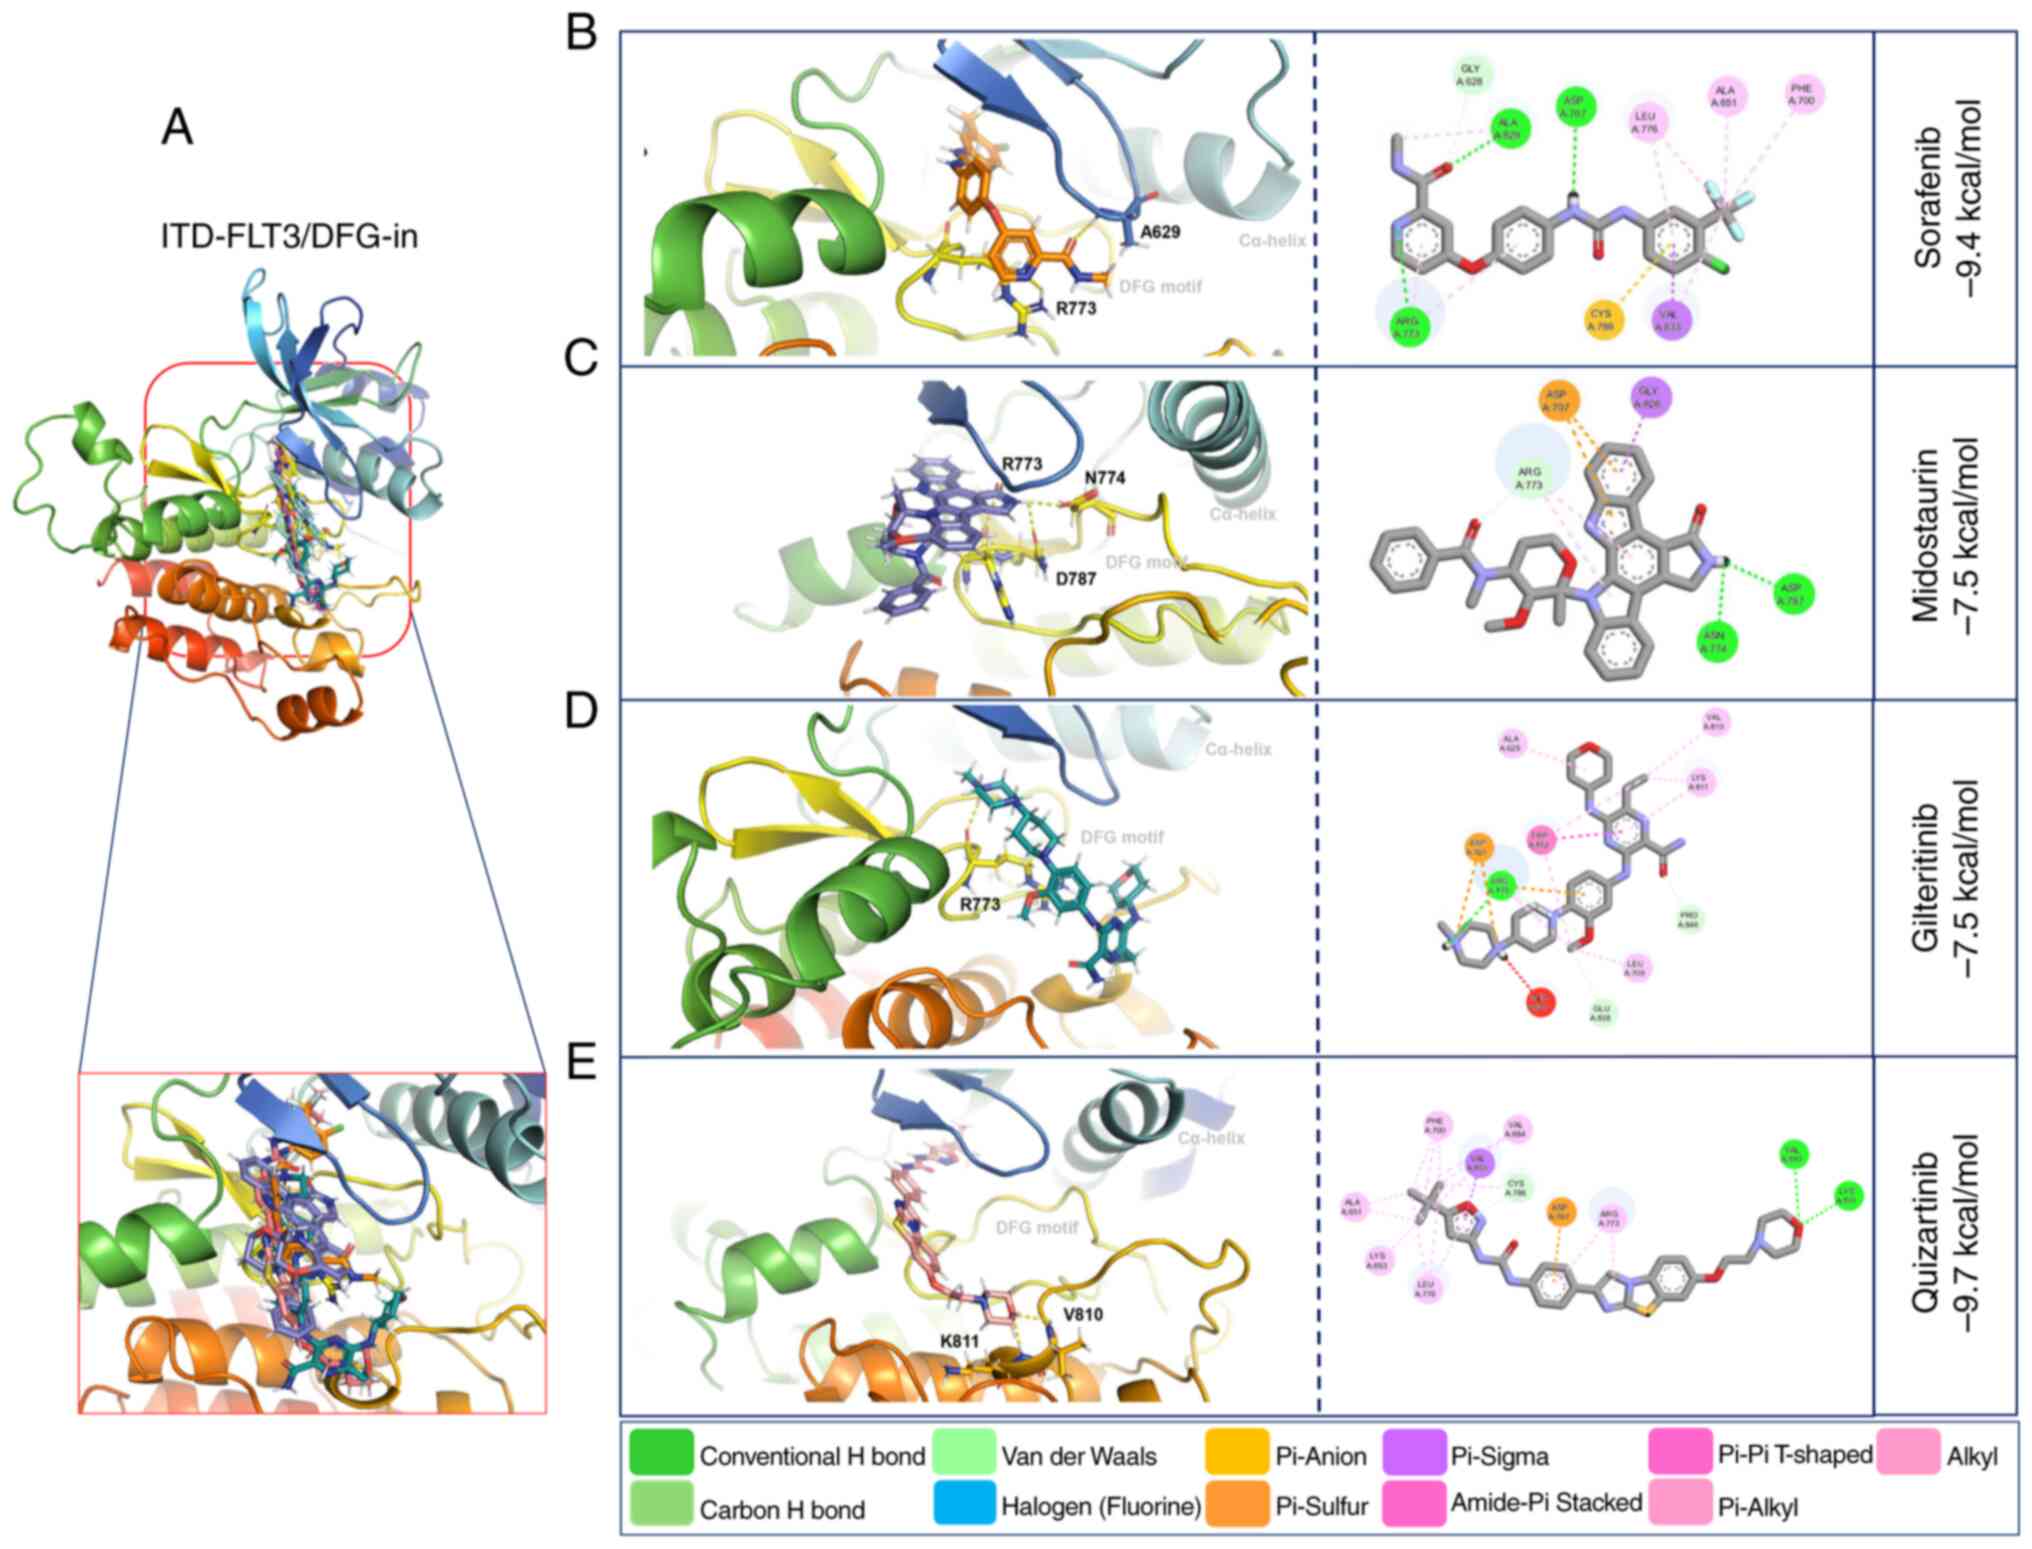
Molecular docking of TKIs with
WT-FLT3
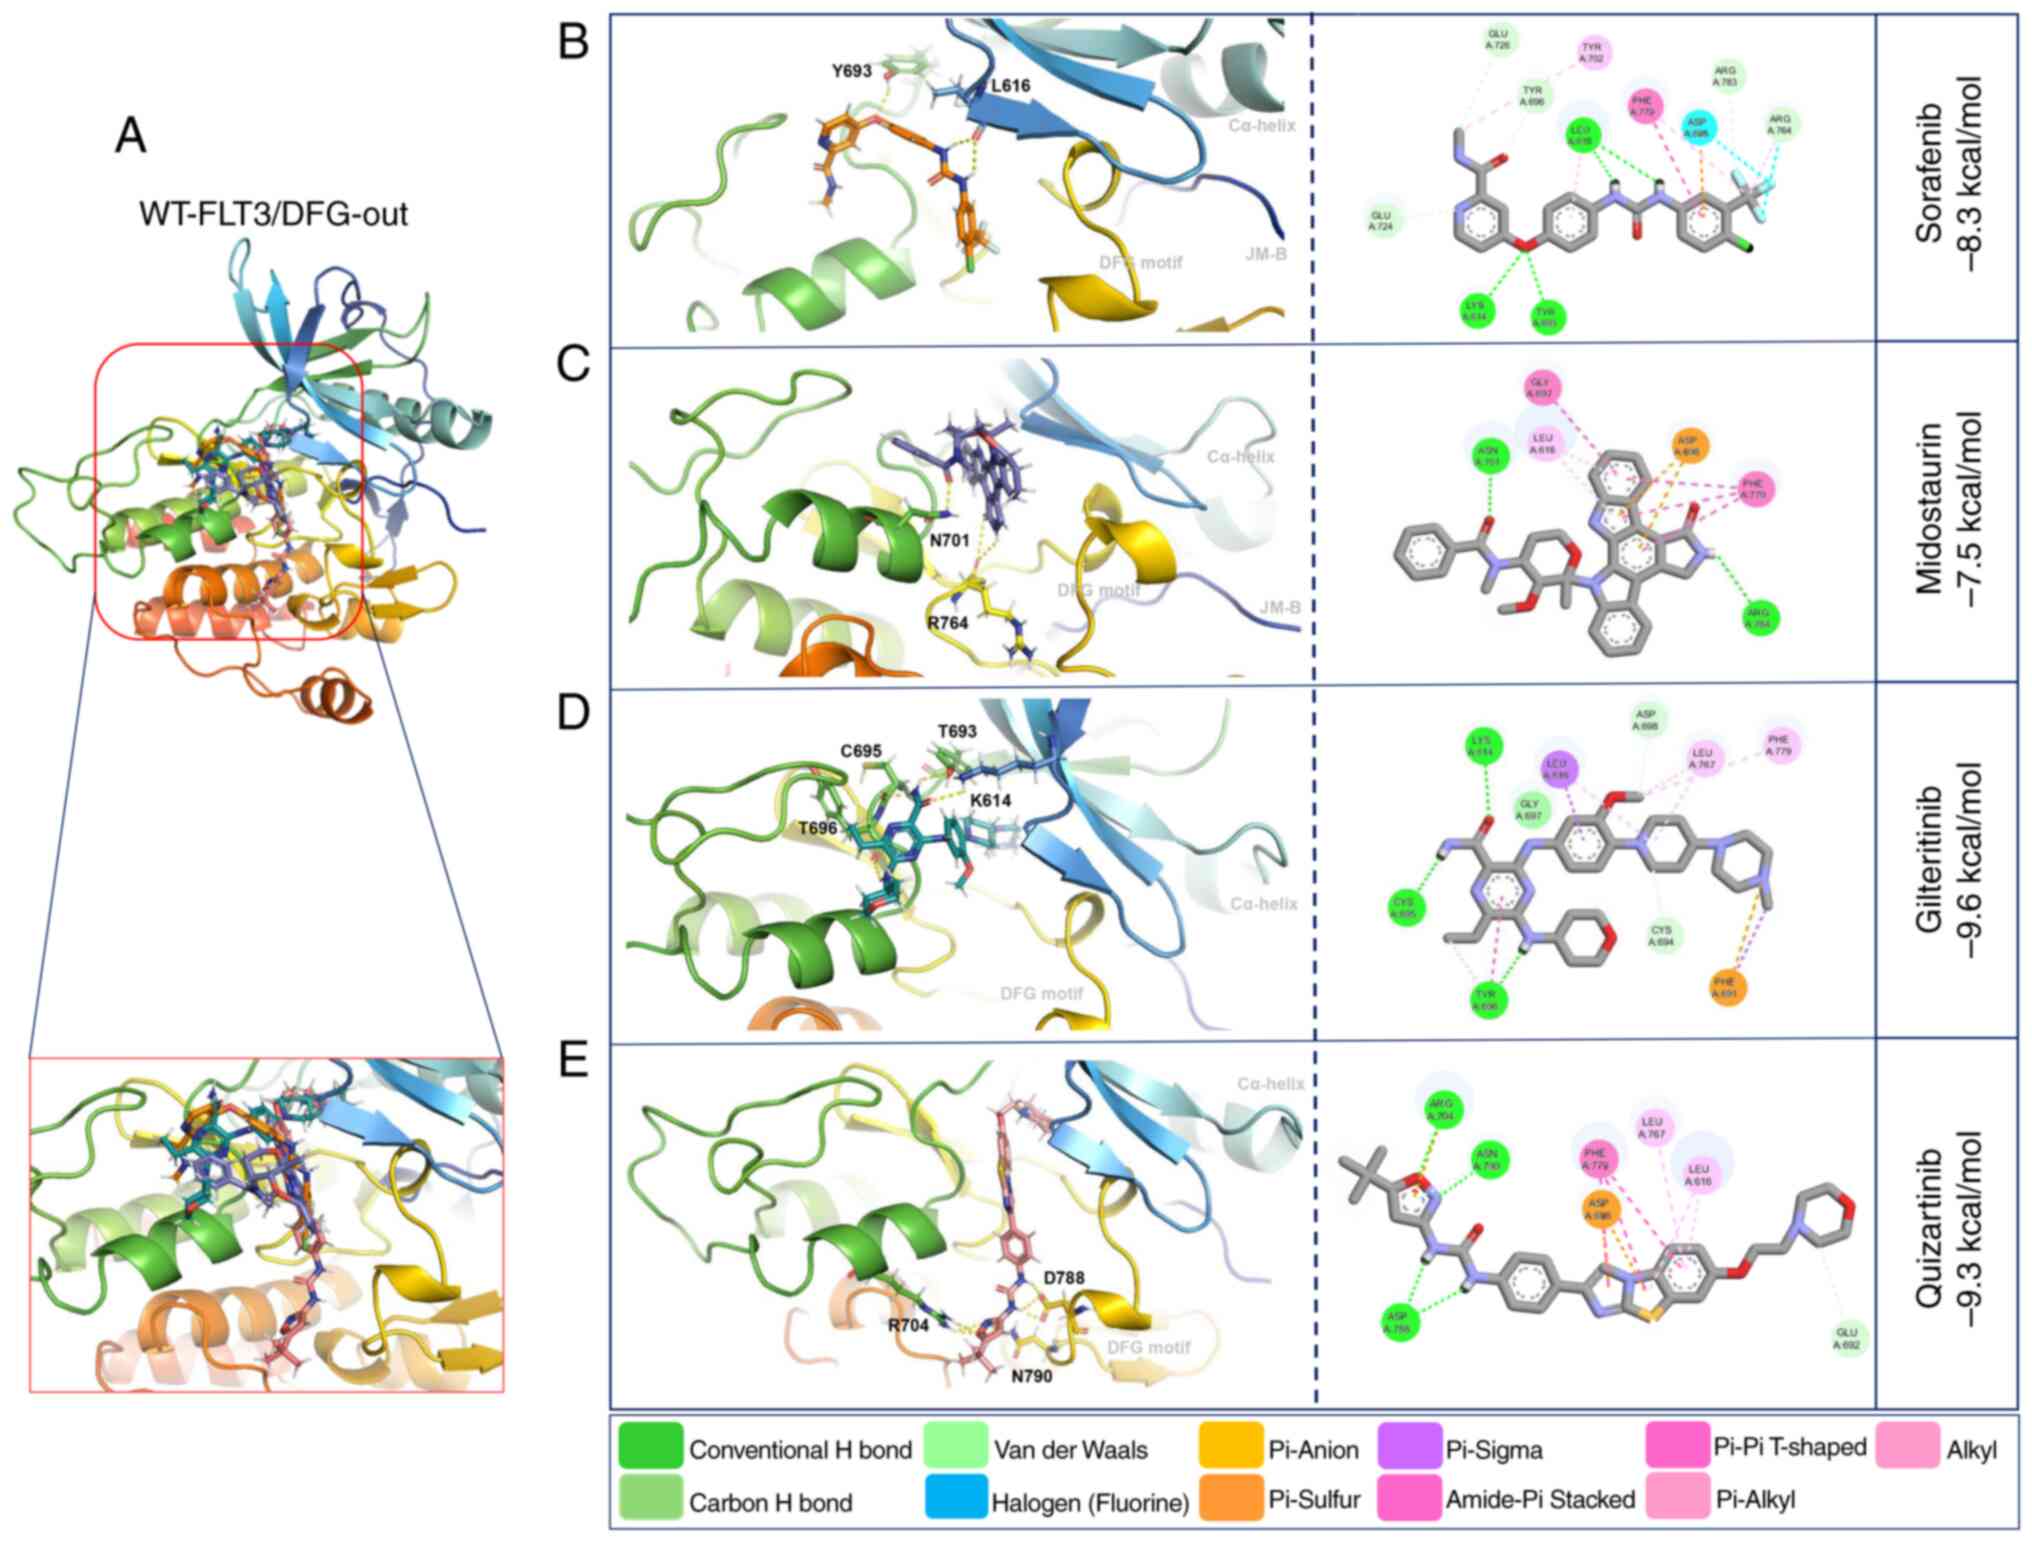
Molecular docking with WT-FLT3/DFG-out showed that
the second-generation inhibitors gilteritinib and quizartinib
presented higher affinity forces (−9.6 and −9.3 kcal/mol,
respectively) than the first-generation inhibitors sorafenib and
midostaurin (−8.3 and −7.5 kcal/mol, respectively) (Fig. 3; Table
V).
| Table V.Characteristics of the affinity
forces of the tyrosine kinase inhibitors towards the DFG-out and
DFG-in conformations of WT-FLT3. |
Table V.
Characteristics of the affinity
forces of the tyrosine kinase inhibitors towards the DFG-out and
DFG-in conformations of WT-FLT3.
| Receptor | Inhibitor | Affinity,
kcal/mol | Polar bonds | Non-covalent
interactions |
|---|
| WT-FLT3
DFG-out | Sorafenib | −8.3 | Leu616-H;
Leu616-H; | Tyr696, Glu724,
Asp698, |
|
|
|
| Tyr693-O | Phe779, Arg783,
Arg764 |
|
| Midostaurin | −7.5 | Arg764-H;
Arg764-O; | Gly697, Leu616,
Asp698, |
|
|
|
| Asn701-O | Phe779 |
|
| Gilteritinib | −9.6 | Tyr696-H;
Lys614-O; | Cys694, Phe691,
Leu767, Asp698, |
|
|
|
| Tyr693-H;
Cys695-H | Phe779, Leu616,
Gly697, Tyr696 |
|
| Quizartinib | −9.3 | Asp788-H;
Asp788-H; | Arg704, Leu767,
Leu616, |
|
|
|
| Asp788-H;
Asn790-N; | Asp698, Phe779 |
|
|
|
| Arg704-N;
Arg704-O; |
|
|
|
|
| Arg704-O |
|
| WT-FLT3 DFG-in | Sorafenib | −9.4 | Asn701-O;
Asp698-H | Phe691, Leu767,
Val624, Cys777, |
|
|
|
|
| Leu700, Arg764,
Ala642 |
|
| Midostaurin | −7.4 | Asn836-H | Arg764, Trp803,
Lys802, Pro800, |
|
|
|
|
| Leu799 |
|
| Gilteritinib | −9.2 | Cys694-H | Gly619, Val624,
Leu767, Cys777, |
|
|
|
|
| Asp698, Arg764 |
|
| Quizartinib | −9.6 | Lys802-O;
Val801-O | Phe691, Ala642,
Leu767, Val624, |
|
|
|
|
| Asp698, Arg764,
Ala620 |
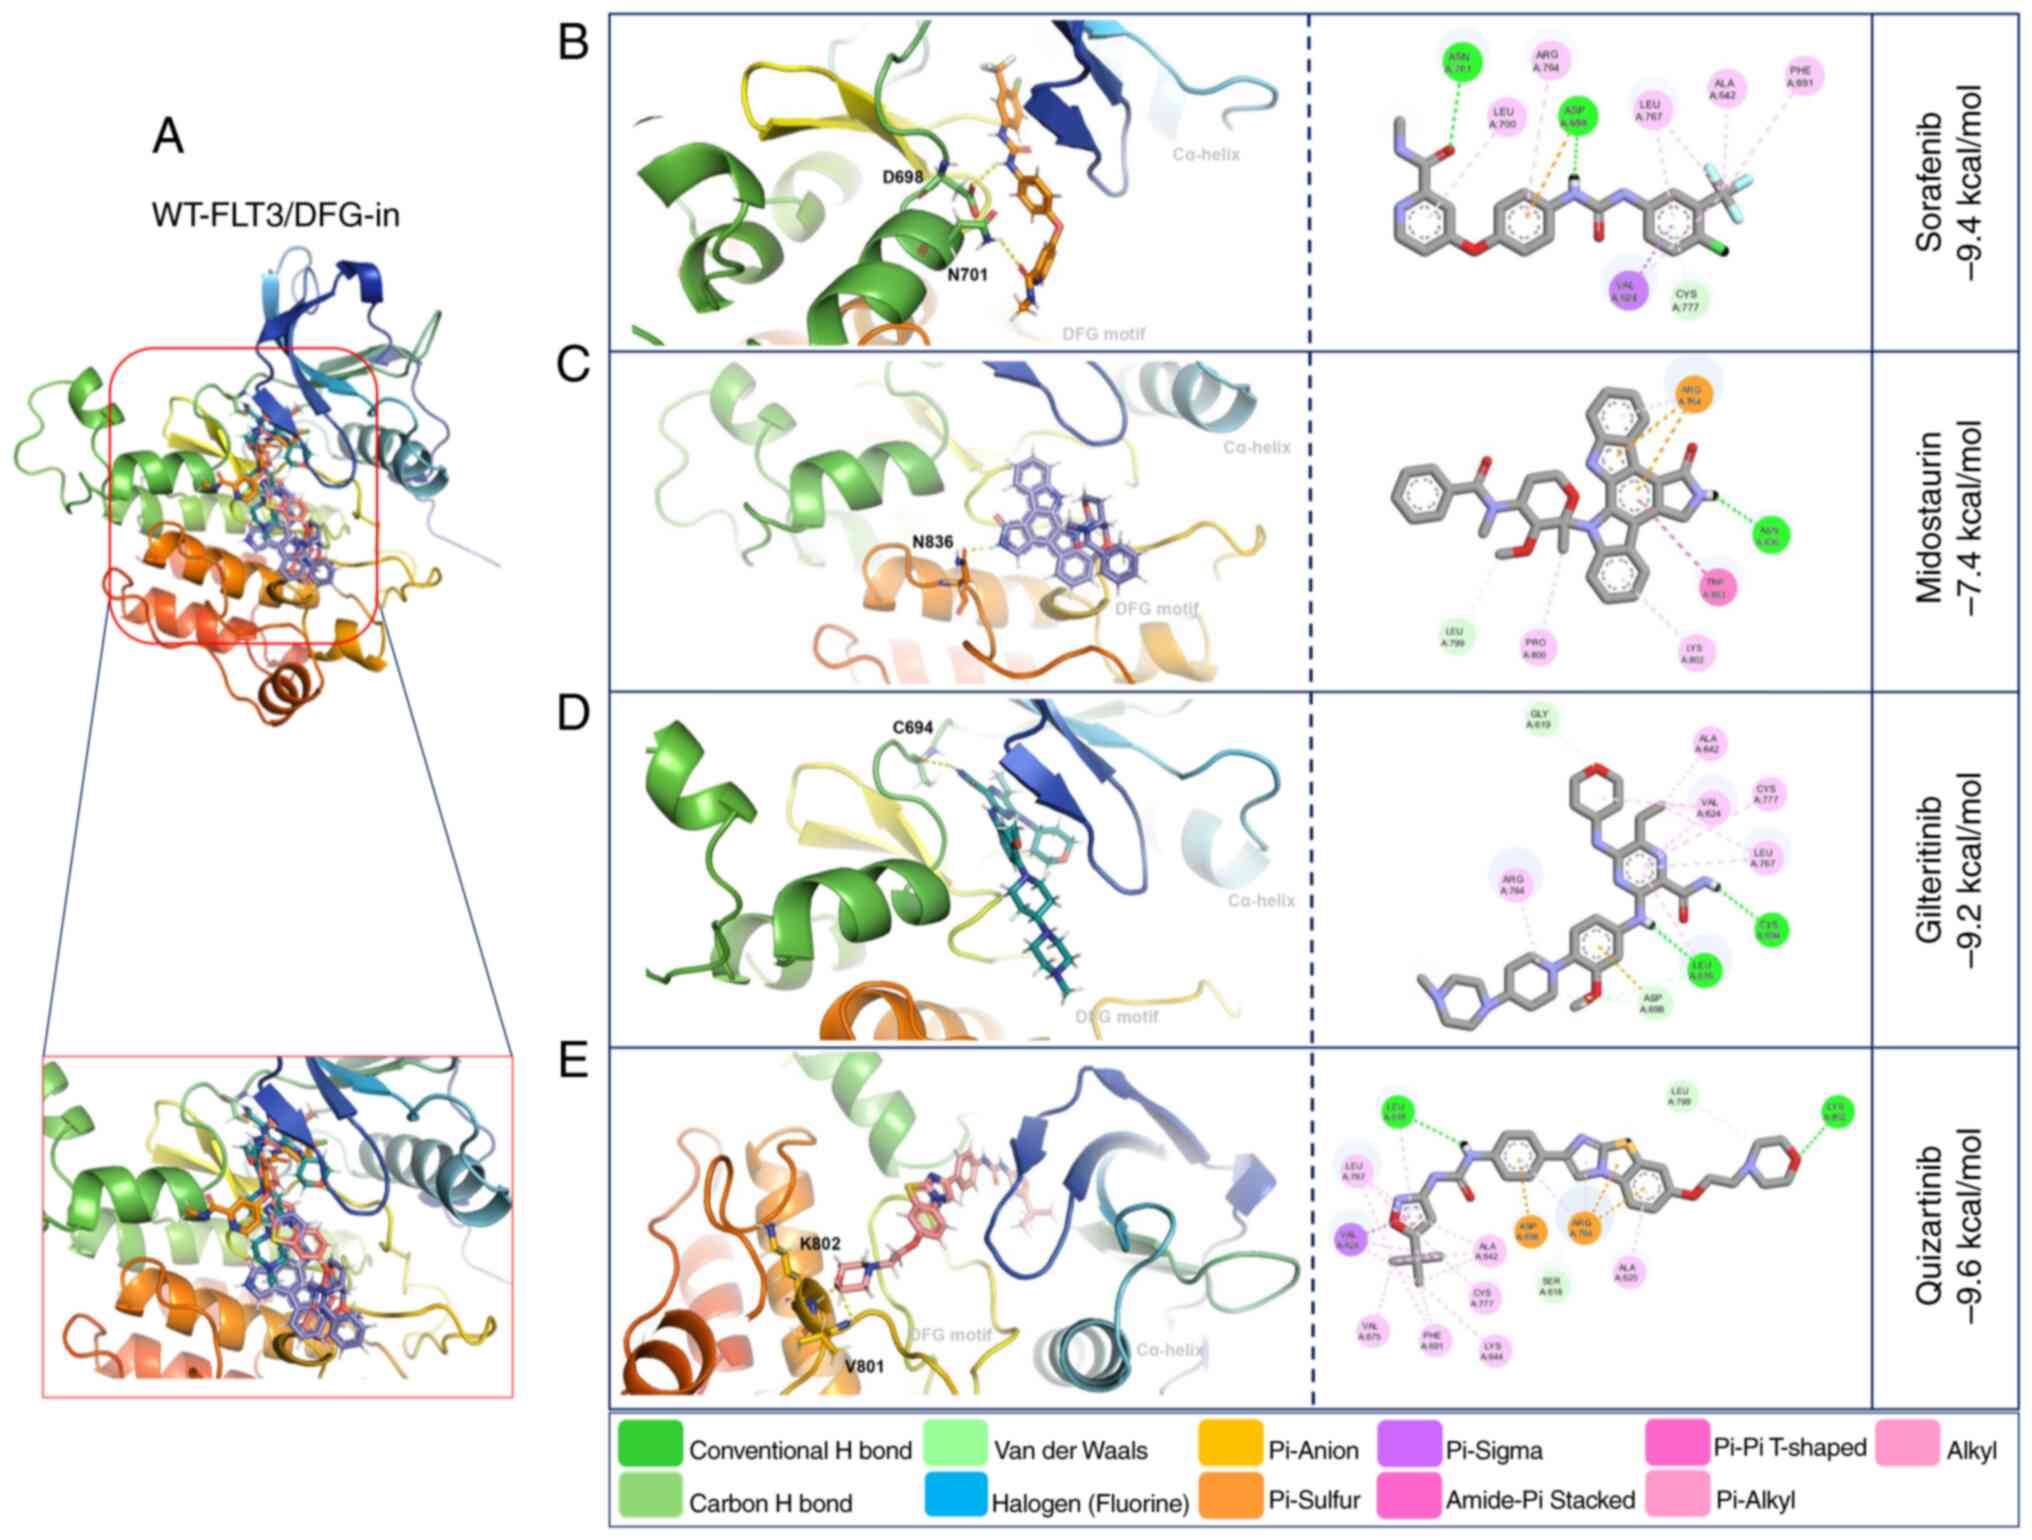
Molecular docking with WT-FLT3/DFG-in showed that
gilteritinib, quizartinib and sorafenib presented high affinity
(−9.2, −9.6 and −9.4 kcal/mol, respectively) towards this receptor.
By contrast, midostaurin presented the lowest affinity (−7.4
kcal/mol) (Fig. 4: Table V).
The interactions of WT-FLT3/DFG-out with the
first-generation inhibitors involved forming polar bonds with
Leu616 and Tyr693 for sorafenib and Arg764 and Asn701 for
midostaurin. Conversely, for WT-FLT3/DFG-in, Asn701 and Asp698
participated in the binding of sorafenib, and Asn836 was used for
midostaurin. The interactions of WT-FLT3/DFG-out with the
second-generation inhibitors involved Tyr696, Lys614, Tyr693 and
Cys695 for gilteritinib, and Asp788, Asn790 and Arg704 for
quizartinib. Furthermore, for WT-FLT3/DFG-in, Cys694 was required
for the interaction with gilteritinib, and Lys802 and Val801 were
required for the interaction with quizartinib (Fig. 3; Table
V). Notably, the number of polar bonds of the four inhibitors
tested was higher with the DFG-out conformation (3–7) than
with the DFG-in conformation (1–2) of
WT-FLT3 (Figs. 3 and 4).
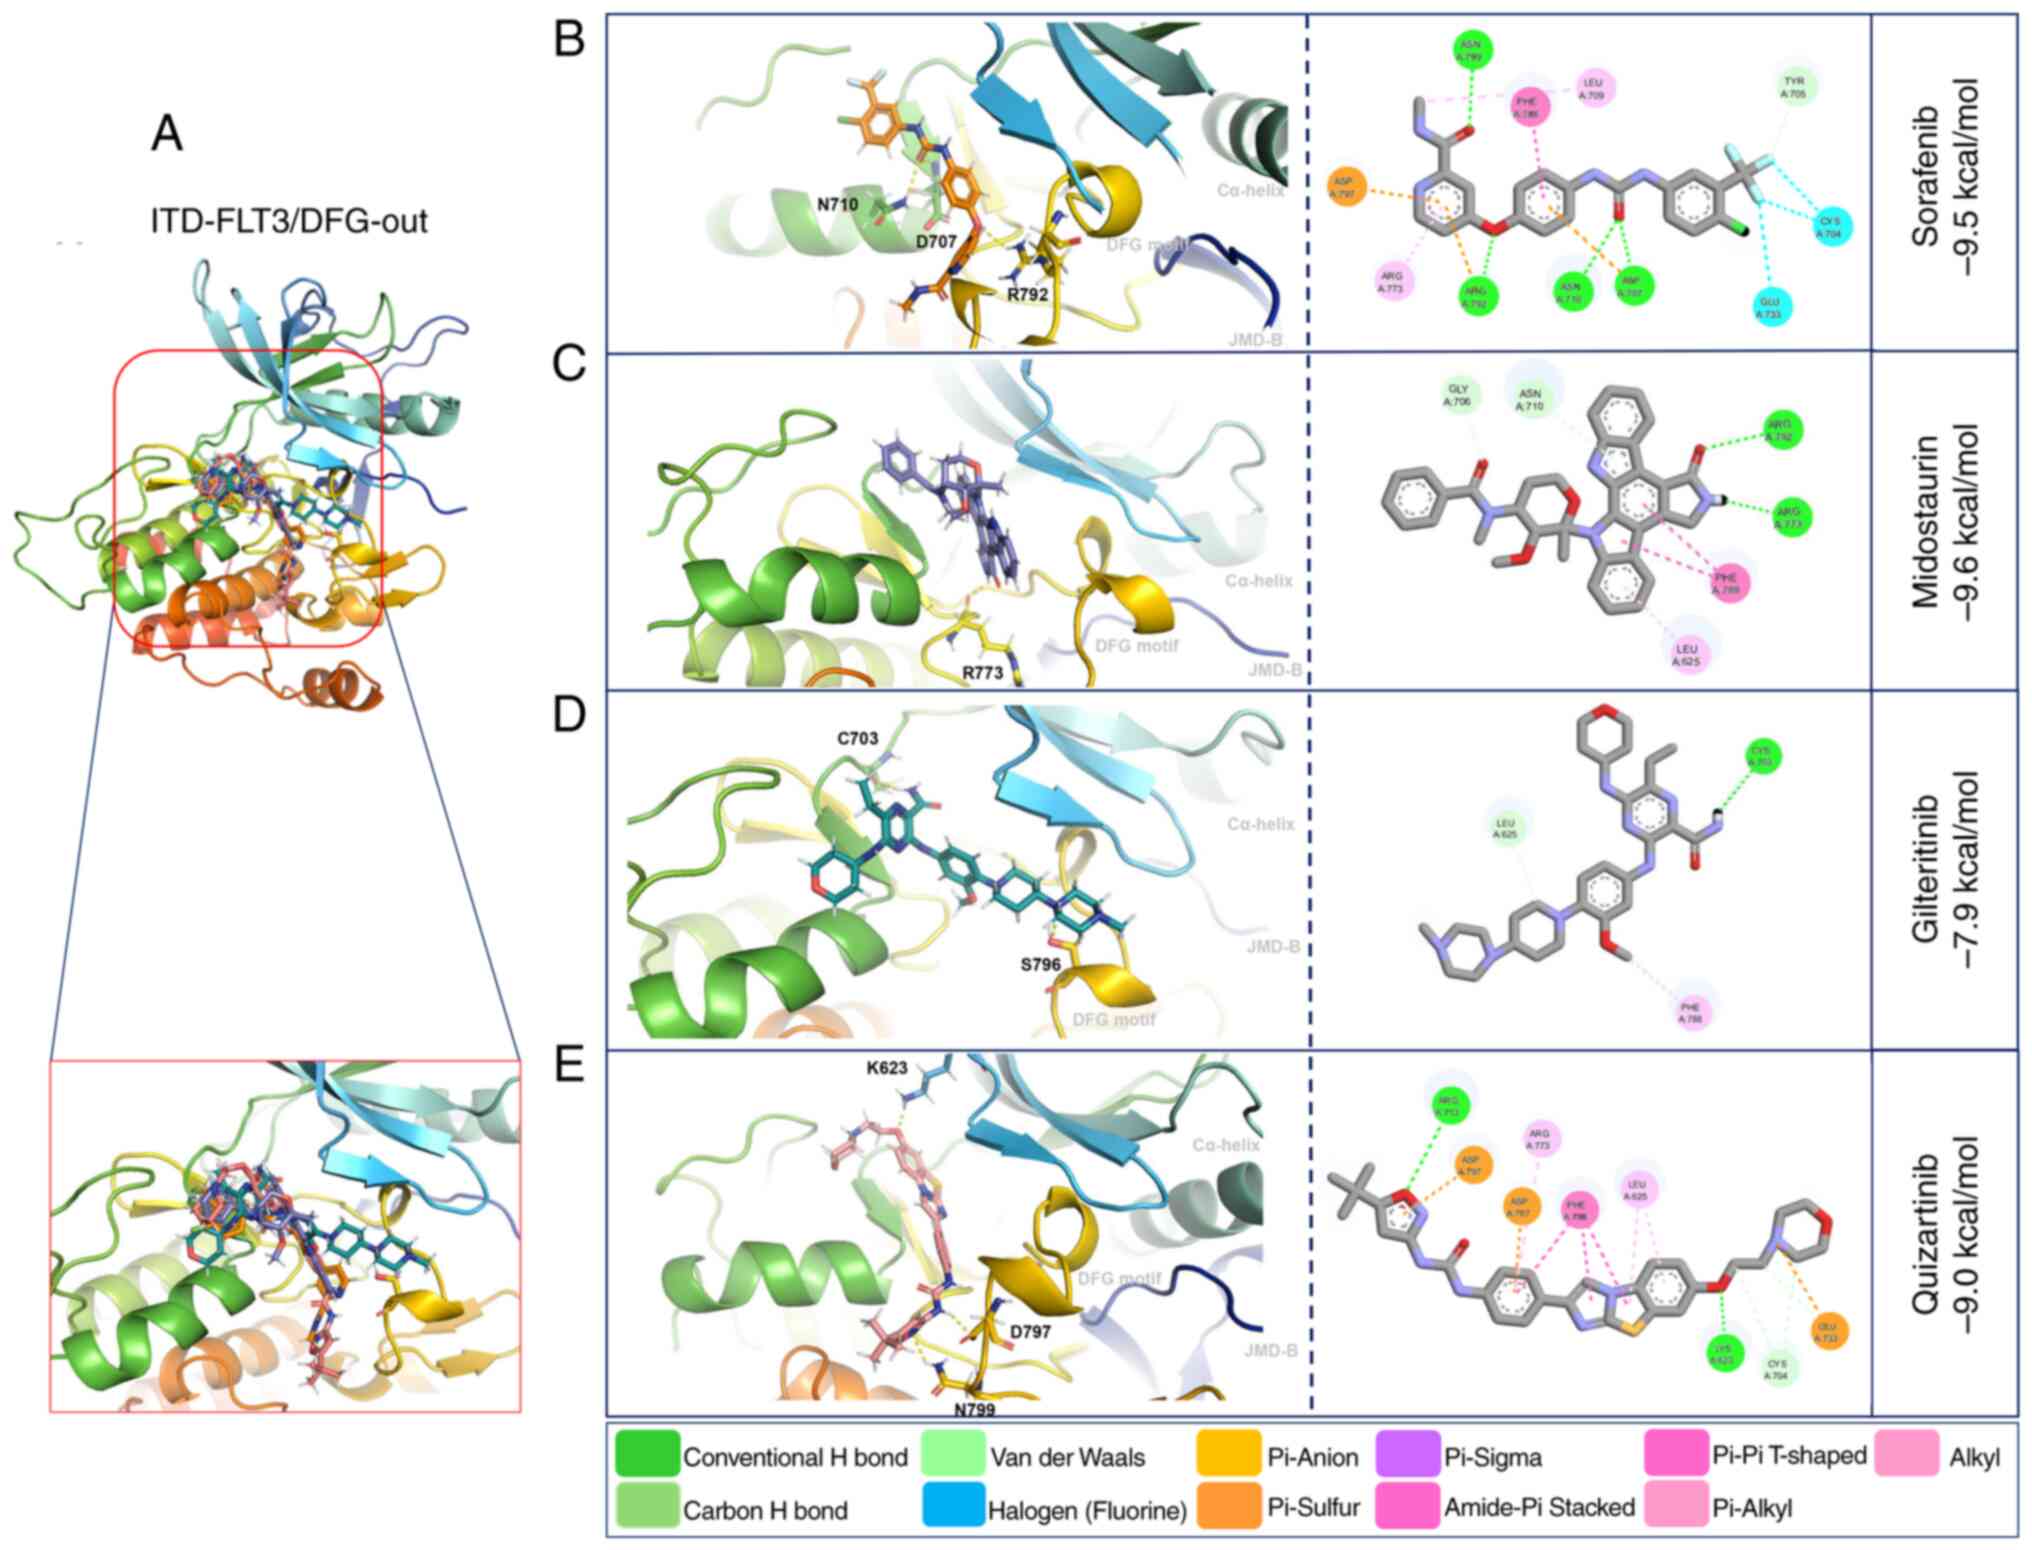
Molecular docking of TKIs with
ITD-FLT3
The affinity forces of ITD-FLT3/DFG-out with the
first-generation inhibitors sorafenib (−9.5 kcal/mol) and
midostaurin (−9.6 kcal/mol) were increased compared with those of
WT-FLT3/DFG-out. By contrast, these forces were decreased for the
second-generation inhibitors gilteritinib (−7.9 kcal/mol) and
quizartinib (−9.0 kcal/mol) (Fig.
5; Table VI).
| Table VI.Characteristics of the affinity
forces of tyrosine kinase inhibitors towards the DFG-out and DFG-in
conformations of ITD-FLT3. |
Table VI.
Characteristics of the affinity
forces of tyrosine kinase inhibitors towards the DFG-out and DFG-in
conformations of ITD-FLT3.
| Receptor | Inhibitor | Affinity,
kcal/mol | Polar bonds | Non-covalent
interactions |
|---|
| ITD-FLT3
DFG-out | Sorafenib | −9.5 | Arg 792-O; Asn
710-O; | Arg773, Asp797,
Phe788, |
|
|
|
| Asp 707-O | Glu733, Cys704,
Tyr705 |
|
| Midostaurin | −9.6 | Arg 773-H | Gly706, Asn710,
Phe788, Leu625 |
|
| Gilteritinib | −7.9 | Ser 796-H; Cys
703-H | Phe 788 |
|
| Quizartinib | −9.0 | Asn 799-N; Asp
797-H; | Asp707, Phe788,
Arg773, |
|
|
|
| Cys 623-O | Asp797, Leu625,
Glu733 |
| ITD-FLT3
DFG-in | Sorafenib | −9.4 | Ala 629-O; Arg
773-N | Gly628, Val633,
Cys786, |
|
|
|
|
| Leu776, Phe700,
Ala651 |
|
| Midostaurin | −7.5 | Arg 773-O; Asn
774-H; | Asp707, Gly626,
Arg773 |
|
|
|
| Asp 787-H |
|
|
| Gilteritinib | −7.5 | Arg 773-H | Asp707, Ser627,
Ala629, |
|
|
|
|
| Trp812, Lys811,
Pro846 |
|
| Quizartinib | −9.7 | Val 810-O; Lys
811-O | Phe700, Val684,
Ala651, Cys786, |
|
|
|
|
| Leu776, Val633,
Asp707, Arg773 |
Compared with WT-FLT3/DFG-in, the ITD mutation in
FLT3/DFG-in did not affect the affinity force of sorafenib (−9.4
kcal/mol), midostaurin (−7.5 kcal/mol) or quizartinib (−9.7
kcal/mol); however, it decreased the affinity force of gilteritinib
(−7.5 kcal/mol) (Fig. 6; Table VI). The ITD mutation in FLT3
modified the amino acid residues and the number of polar bonds
involved in the interaction of this receptor with its ligands. The
main amino acid residues involved in the formation of the
ITD-FLT3/DFG-out/ligand complexes were Arg792, Asn710 and Asp707
for sorafenib, Arg773 for midostaurin, Ser796 and Cys703 for
gilteritinib, and Asn799, Asp797 and Cys623 for quizartinib. The
complexes between ITD-FLT3/DFG-in and its ligands involved Ala629
and Arg773 for sorafenib, Arg773, Asn774 and Asp787 for
midostaurin, Arg773 for gilteritinib, and Val810 and Lys811 for
quizartinib (Figs. 5 and 6; Table
VI). The number of polar bonds between ITD-FLT3 and its ligands
was higher for its DFG-out than its DFG-in conformations, except
for midostaurin.
As aforementioned, the non-covalent molecular
interactions of ITD-FLT3 were more abundant with the
ITD-FLT3/DFG-out conformation than with the ITD-FLT3/DFG-in
conformation (Figs. 5 and 6).
In vitro evaluation
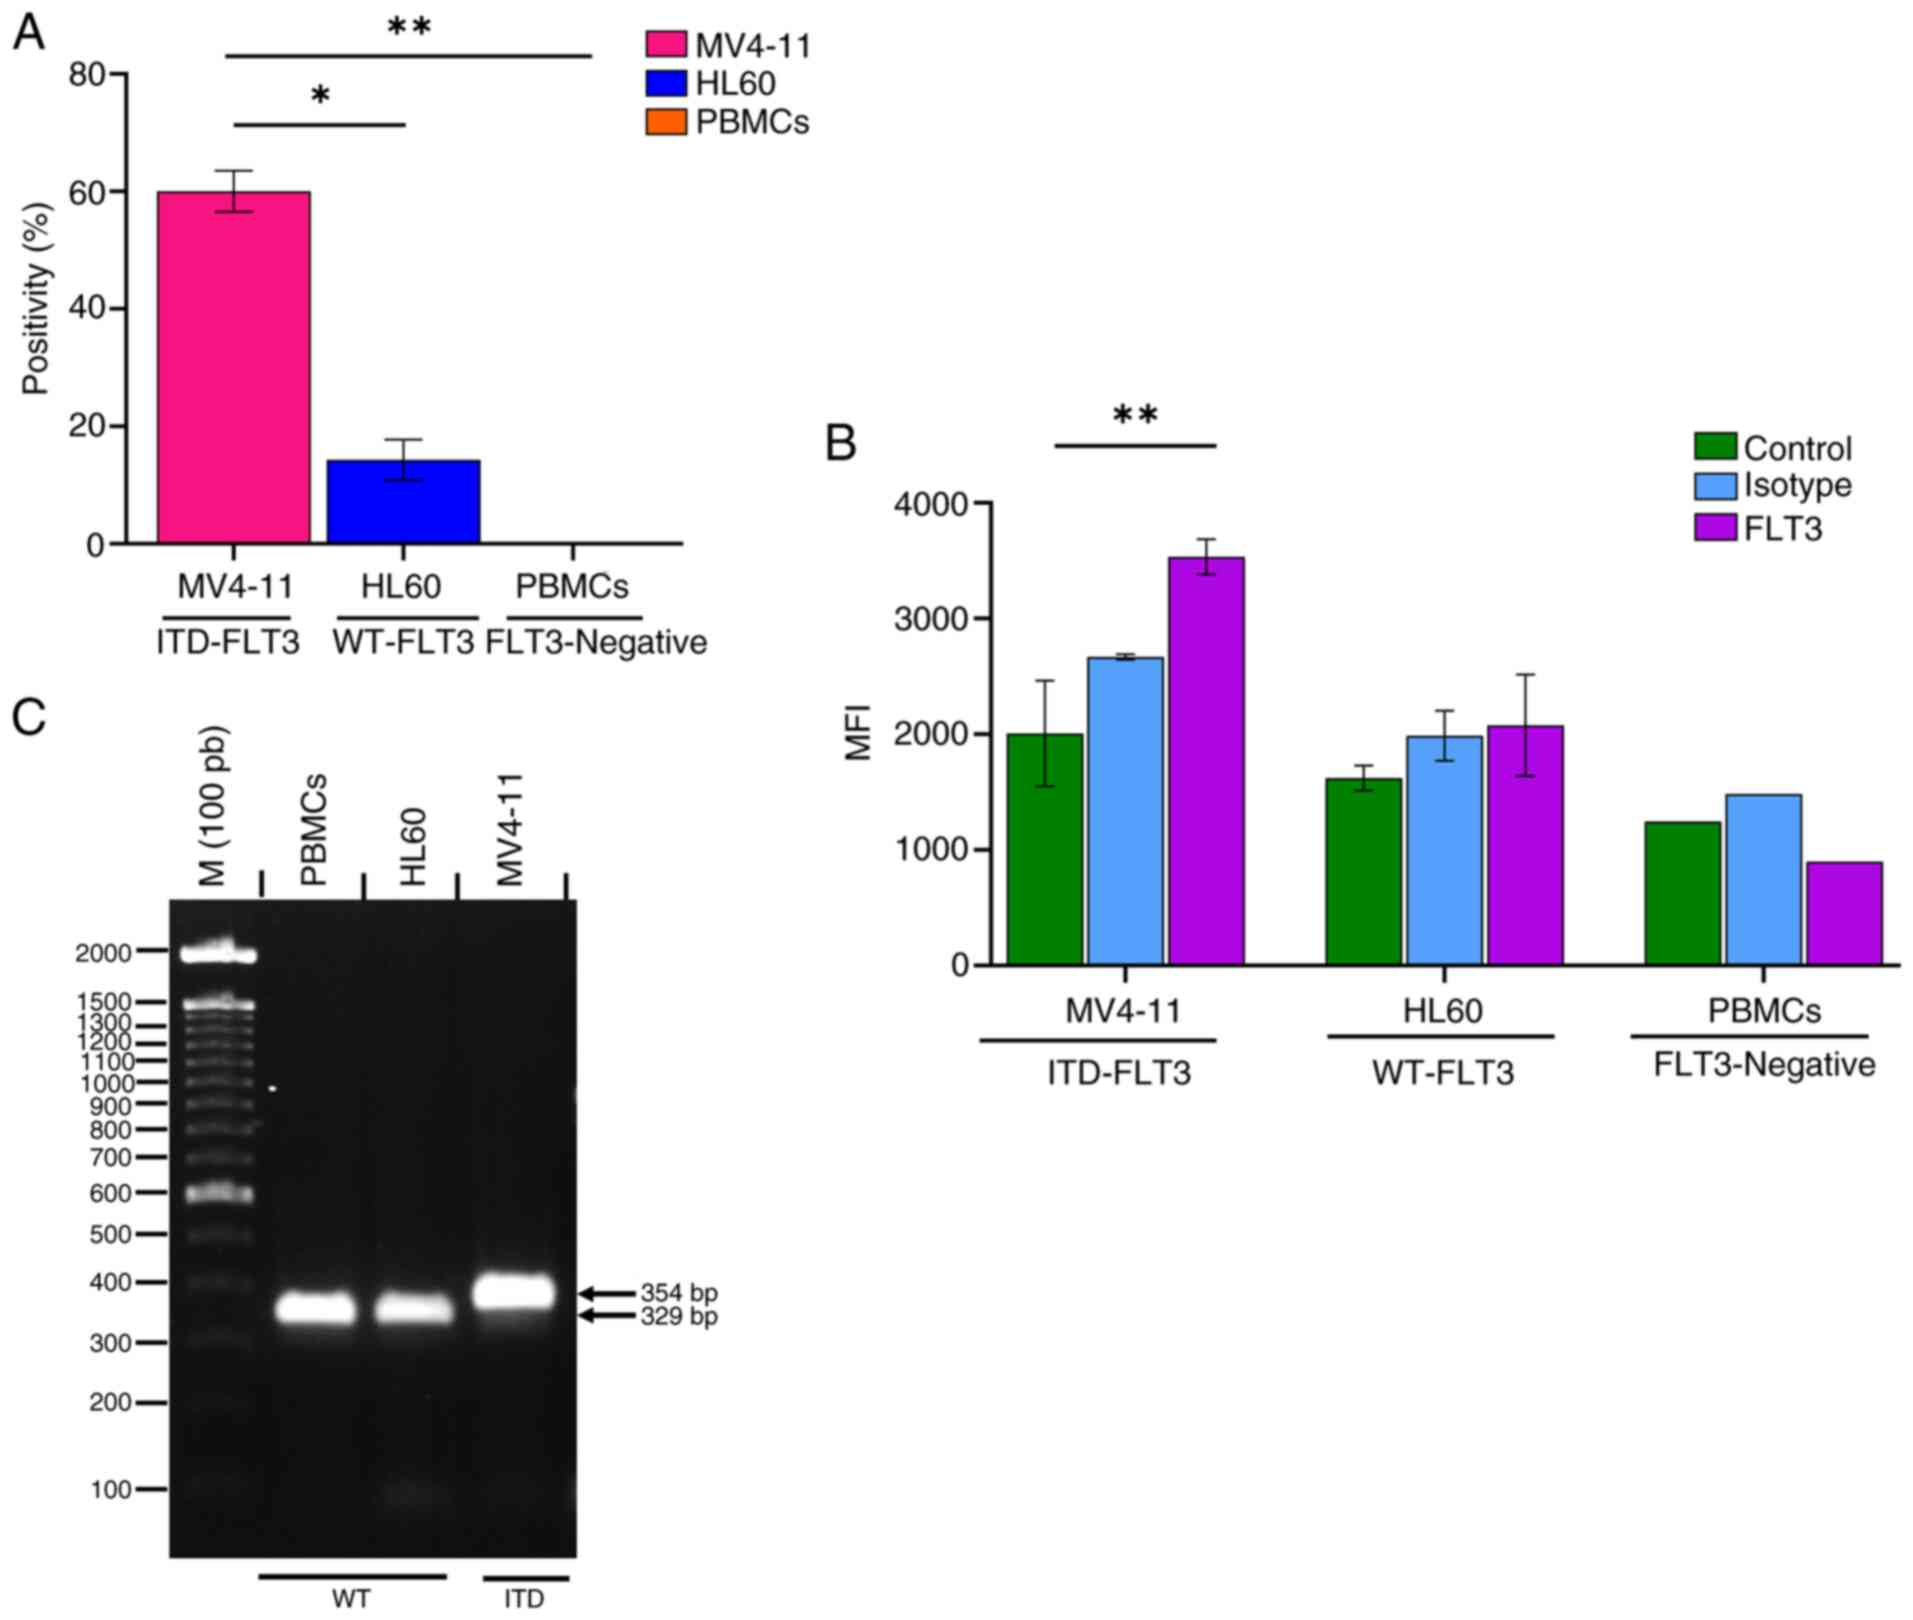
FLT3 expression and identification of the ITD
mutation in AML cells
The FLT3 receptor was expressed in 60.03±3.5% of
MV4-11 cells and 14.23±3.4% of HL60 cells (Fig. 7A). The amount of FLT3 receptor
(mean fluorescence index) was 1.7 times higher on the surface of
MV4-11 cells than on that of HL60 cells (Fig. 7B). The PBMC samples obtained from
the clinically healthy volunteer showed no FLT3-positive cells and
the mean fluorescence intensity value of these cells was similar to
that of the unstained control (Fig. 7A
and B). Fig. S4 shows the dot
plots and histograms of the flow cytometric analysis of FLT3
expression on MV4-11 and HL60 cells, and PBMCs.
The FLT3 amplicon, which corresponds to the sequence
between exons 14 and 15, showed a larger PCR product for the MV4-11
cell line than the HL60 cell line and PBMCs (WT-FLT3) (Fig. 7C). The increase in the PCR product
size (354 vs. 329 bp) corresponds to the presence of the ITD
mutation in MV4-11 cells as described by Quentmeier et al
(32), Huang et al
(65) and Jilani et al
(74).
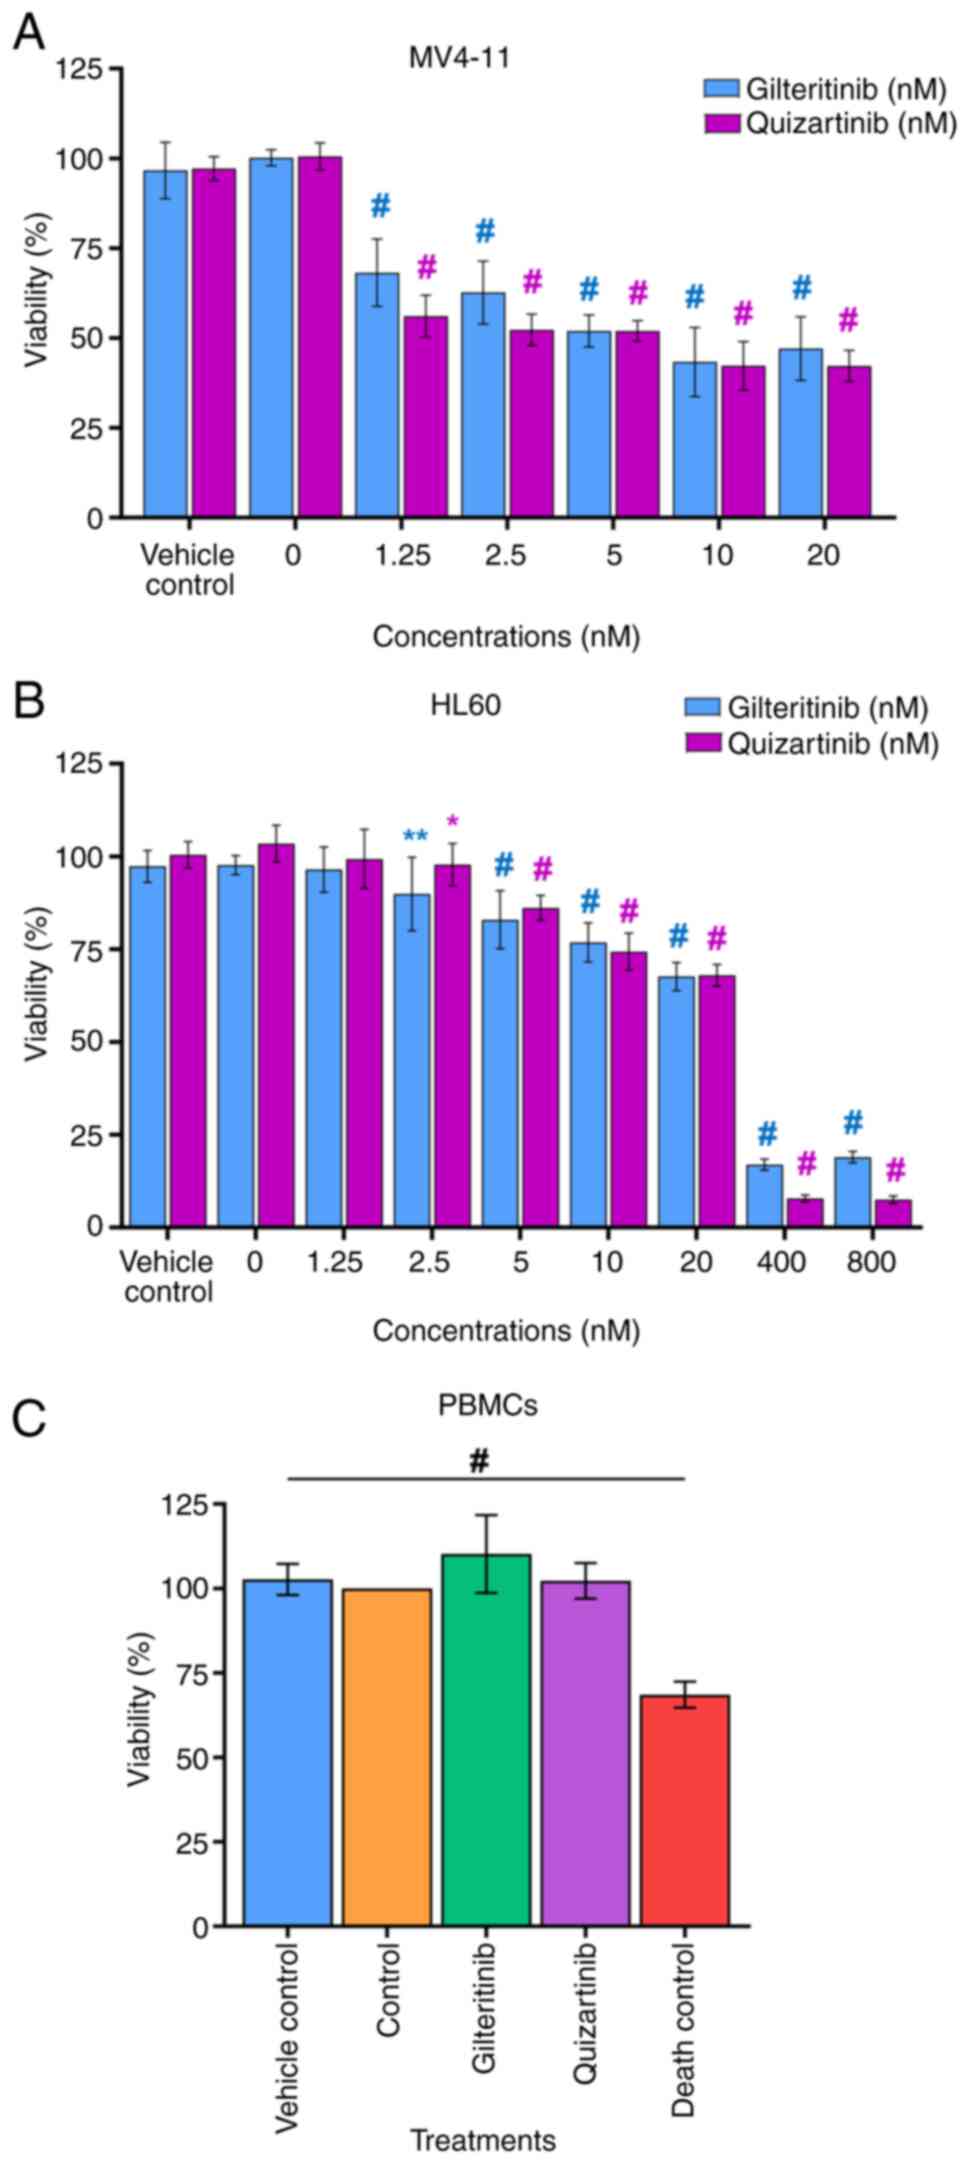
Effect of gilteritinib and quizartinib
on the viability of MV4-11 cells, HL60 cells and PBMCs
The IC50 determined for gilteritinib in
MV4-11 and HL60 cells was 7.99±1.07 and 57.54±3.99 nM,
respectively. For quizartinib, these values were 4.76±0.55 and
38.75±2.4 nM, respectively (Fig. 8A
and B). Thus, gilteritinib and quizartinib presented a
significantly higher cytotoxic effect (lower viability %) against
MV4-11 cells than HL60 cells. This effect was especially marked for
gilteritinib since its IC50 was seven times lower in
MV4-11 cells (7.99±1.07 nM) than in HL60 cells (57.54±3.99 nM),
while for quizartinib the IC50 was eight times lower in
MV4-11 cells (4.76±0.55 nM) compared with HL60 cells (38.75±2.4 nM)
(Fig. 8A and B). The exposure of
PBMCs to gilteritinib or quizartinib (using the IC50
value calculated for MV4-11 cells) did not affect their viability
(Fig. 8C; Table VII).
| Table VII.IC50 of gilteritinib and
quizartinib in in vitro models of acute myeloid
leukemia. |
Table VII.
IC50 of gilteritinib and
quizartinib in in vitro models of acute myeloid
leukemia.
| Cell line | IC50 of
gilteritinib, nM | IC50 of
quizartinib, nM |
|---|
| MV4-11 | 7.99±1.07 | 4.76±0.55 |
| HL60 | 57.54±3.99 | 38.75±2.40 |
| PBMCs | NA | NA |
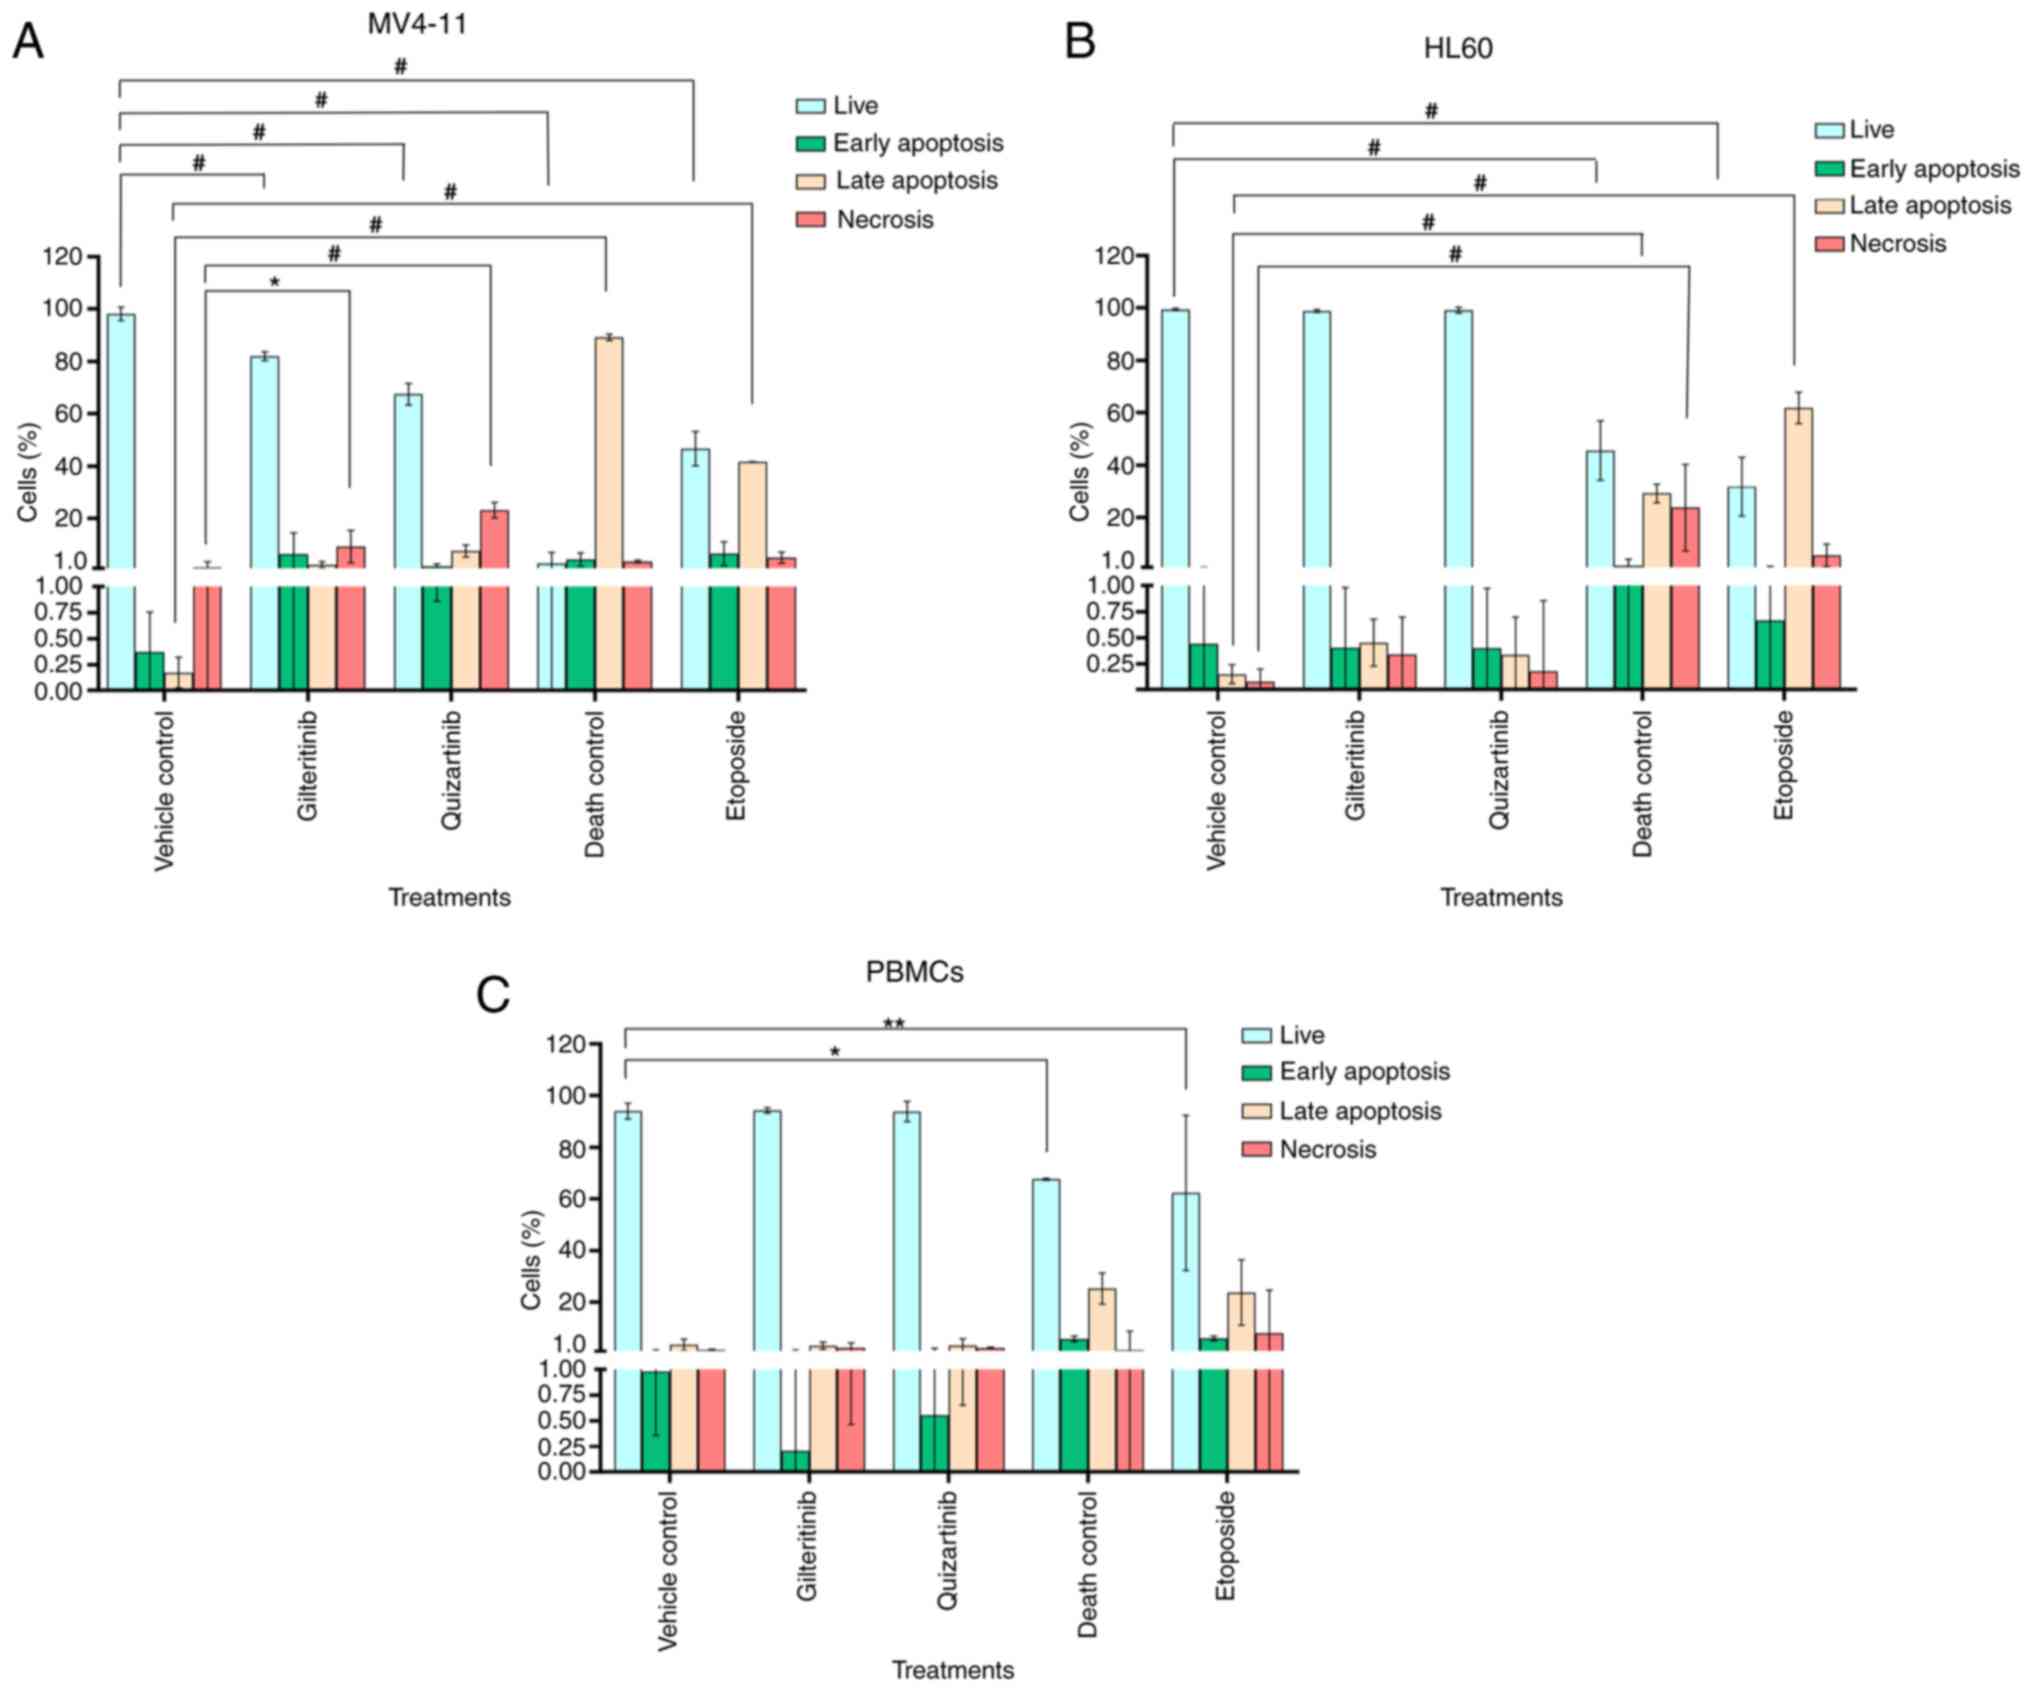
Effects of gilteritinib and
quizartinib on the apoptosis and proliferation of MV4-11 cells,
HL60 cells and PBMCs
The effects of gilteritinib and quizartinib on
apoptosis induction and cell proliferation inhibition of MV4-11
cells, HL60 cells and PBMCs were evaluated by flow cytometry. For
this purpose, the cells were exposed to 7.99 nM gilteritinib or
4.76 nM quizartinib, corresponding to the IC50 of these
compounds, as calculated for the MV4-11 cell line.
Gilteritinib appeared to induce apoptosis in MV4-11
cells (6.4±8.0% of cells in early apoptosis and 2.3±1.2% in late
apoptosis), although this effect was not statistically significant
compared with the untreated control. Quizartinib induced
irreversible necrotic damage to MV4-11 cells: 23±2.8% of the cell
population showed high PI staining, 7.6±2.3% were in late apoptosis
and 1.78±0.9% were in early apoptosis (Fig. 9A). The exposure to gilteritinib or
quizartinib did not induce apoptosis in HL60 cells or PBMCs, and
the apoptosis levels were similar compared with the vehicle control
(Fig. 9B and C). Fig. S5 shows the dot plot representation
of the effect of gilteritinib and quizartinib on the induction of
apoptosis in AML cell lines and PBMCs.
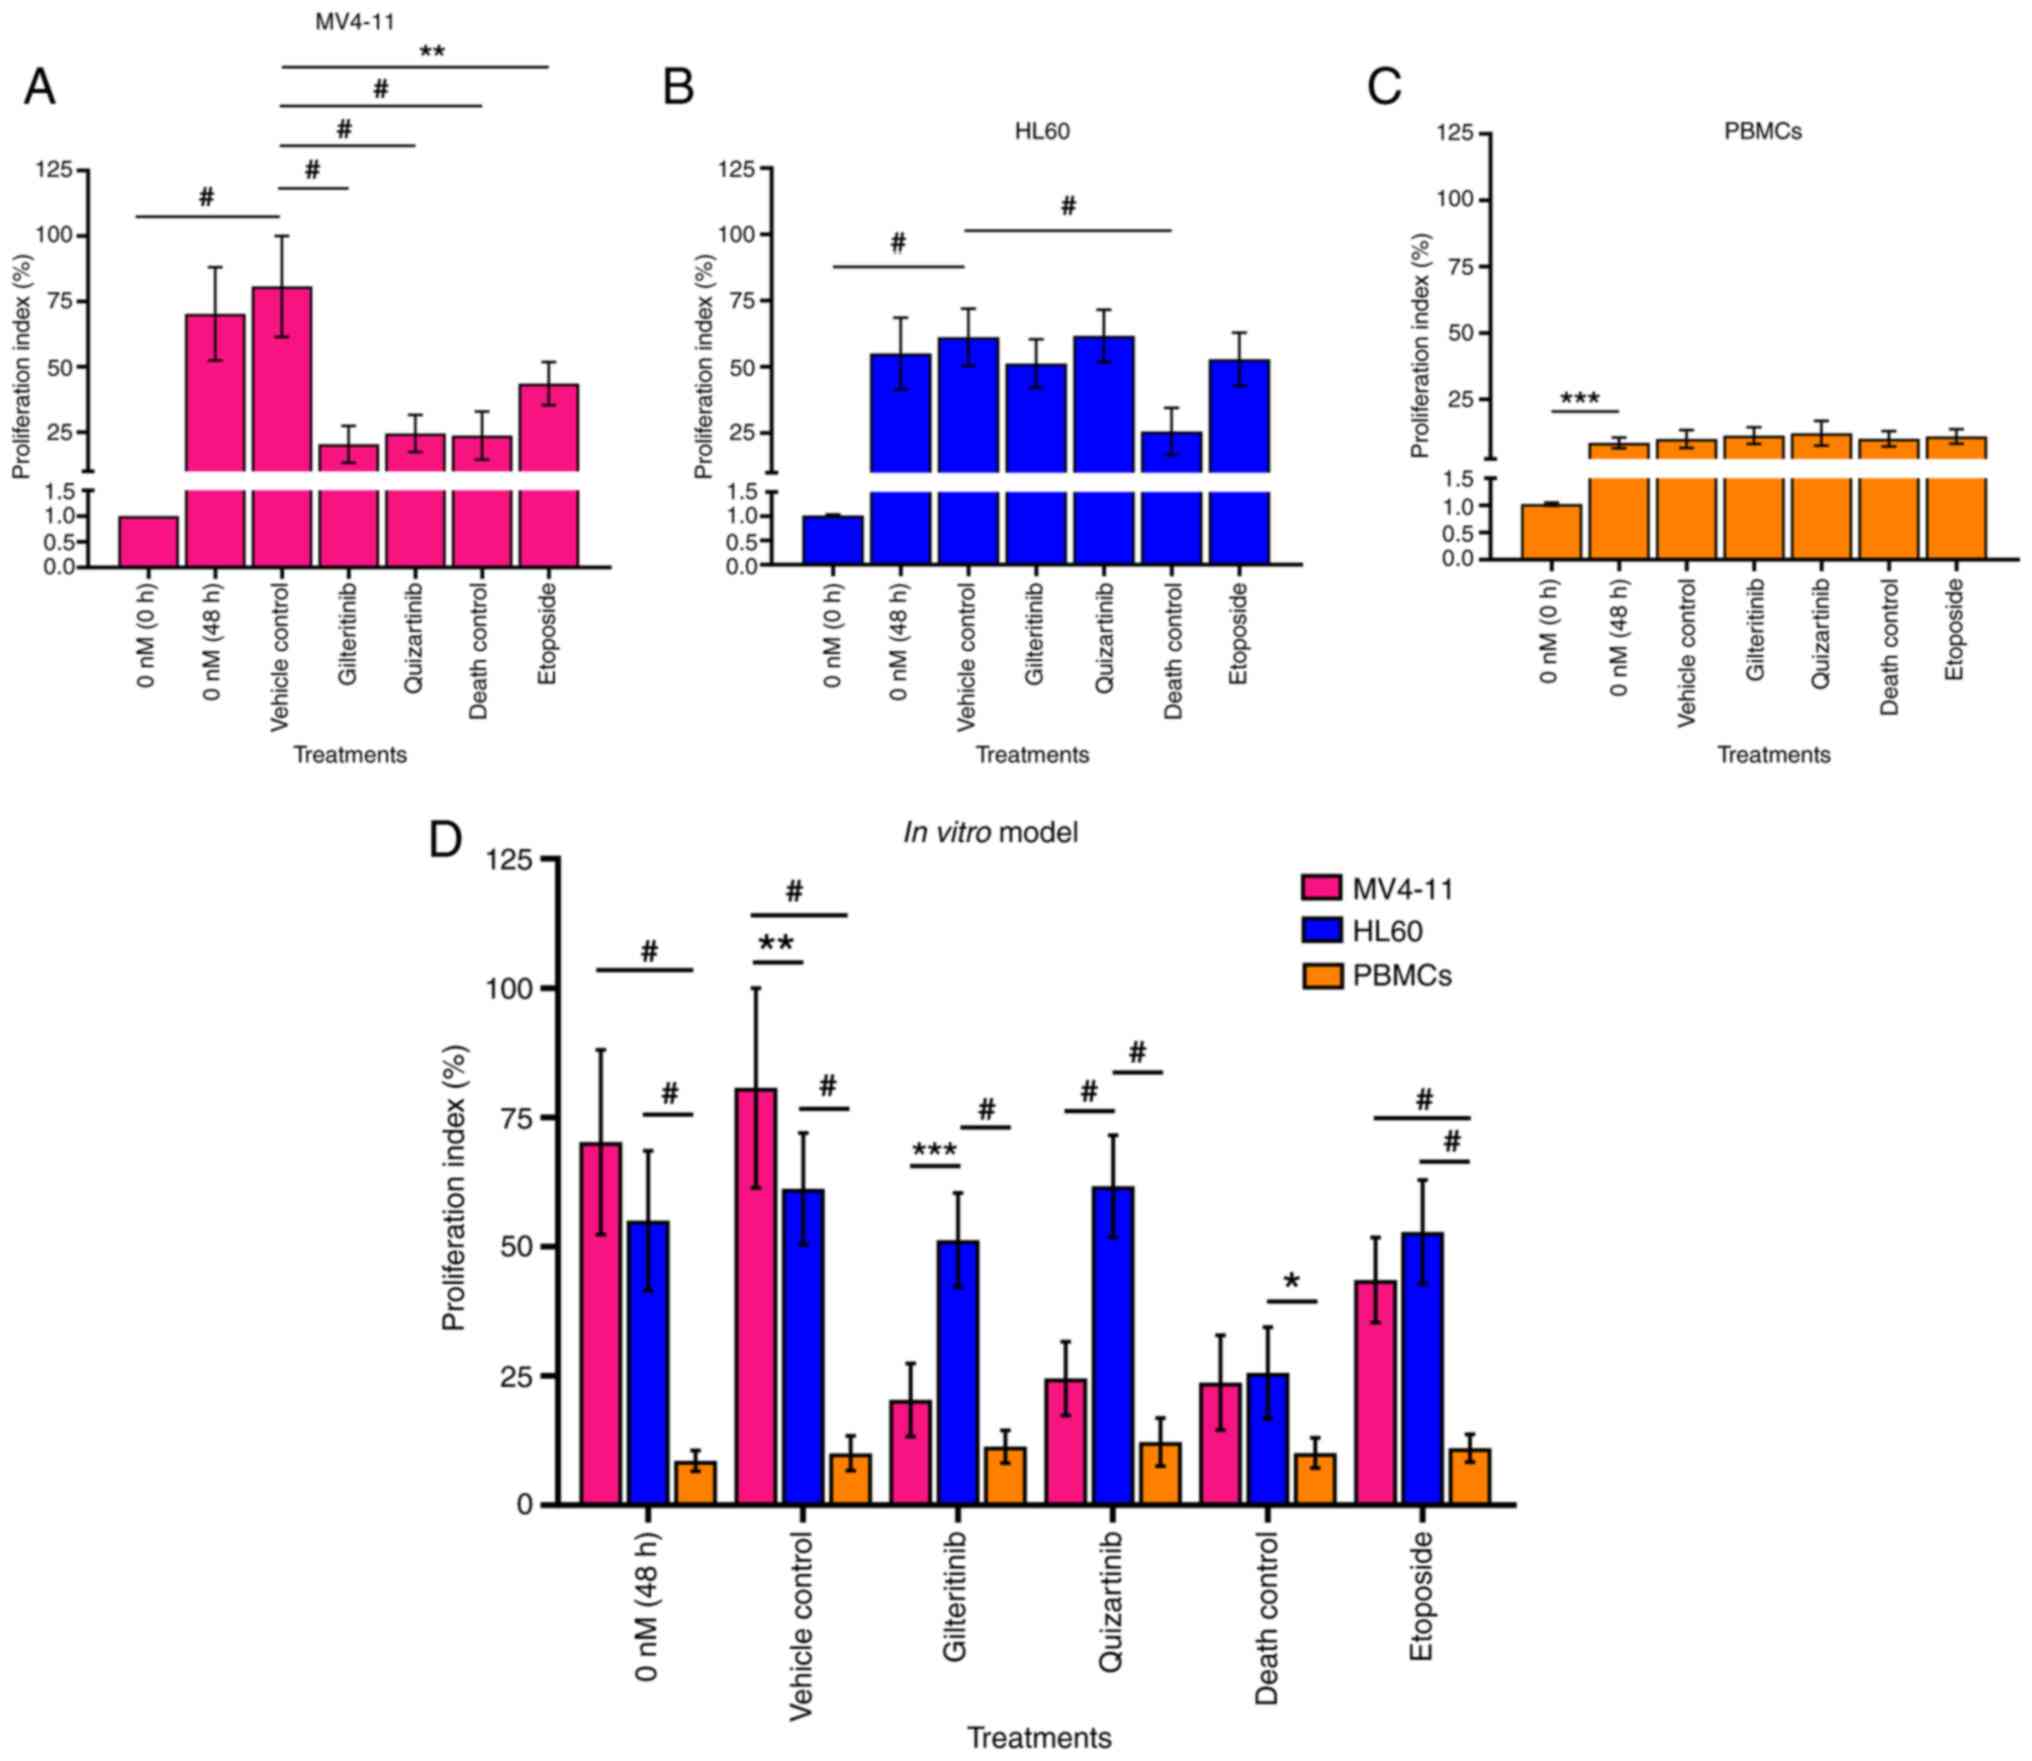
Gilteritinib and quizartinib significantly
decreased the proliferation (20.36 and 24.00%, respectively) of
MV4-11 cells compared with the vehicle control (70.29%). This
effect was comparable to the 3% DMSO death control (23.7%)
(Fig. 10A and D). However, these
inhibitors did not affect HL60 cell proliferation (51 and 61%
proliferation index, respectively) or PBMC proliferation (11 and
12% proliferation index, respectively) (Fig. 10B-D). Fig. S6, Fig. S7, Fig. S8 show the dot plots and histograms
of the flow cytometry analysis of cell division of MV4-11 cells,
HL60 cells and PBMCs using CFSE.
Discussion
The upregulation of FLT3 expression leads to the
excessive proliferation and death evasion of leukemic cells, as
well as the rapid progression of the disease. FLT3 participates in
cell proliferation, motility and differentiation. Its activation is
induced by autophosphorylation of Tyr589, Tyr591 and Tyr599, which
promotes conformational changes in the conserved DFG motif of this
receptor and makes the ATP-binding site available (75,76).
Additionally, ITD insertions in the JMD of FLT3 are present in
69.5% of patients with AML and are associated with higher cell
proliferation and malignancy (13,77,78).
Therefore, WT-FLT3 and ITD-FLT3 are essential targets for AML
therapy.
The conformation of the FLT3 receptor is dynamic in
biological systems, alternating between DFG-out (inactive) and
DFG-in (active) forms depending on cellular processes and signaling
(79). Thus, it was essential to
obtain the structural models of the DFG-out and DFG-in forms of
WT-FLT3 and ITD-FLT3 receptors. This contributes to understanding
the impact of the ITD in JMD on the conformational changes of FLT3,
and the molecular interactions, affinity and effectiveness of
TKIs.
The first homology model of WT-FLT3/DFG-in was
constructed by Ke et al (13), who used the FLT3/DFG-out (1RJB) and
the colony stimulating factor 1 (3LCD) (DFG-in) structures. This
model helped define the molecular interaction parameters of type I
TKIs and allowed the identification of novel inhibitors through
structure-based virtual screening (13). Furthermore, Mashkani et al
(15) described two potential
models of WT-FLT3/DFG-in based on the structures of c-Kit (1PKG)
and Abelson kinases (2GQG), and their molecular interactions with
adenosine diphosphate and a type I TKI (dasatinib). Lee et
al (80) also constructed a
model of WT-FLT3/DFG-in using dual specificity tyrosine
phosphorylation regulated kinase 1A (4NCT) to study the effect of
the G697R point mutation on the molecular interactions and drug
responses to sorafenib and midostaurin. The WT-FLT3/DFG-out
structure obtained in the present study complements these previous
models and the ones reported by Griffith et al (38) (1RJB) and Thomas (6IL3) (39).
Based on this structural model, WT-FLT3/DFG-in was
then constructed using the DFG-in portion of the crystalized c-Kit
structure (1PGK) as described in previous works employing c-Kit
(42) and other RTKs as templates
(13,15,42).
Despite the relevance of the ITD-FLT3 mutation in AML progression,
few structural models have been reported so far. Most of them focus
on elucidating the effect of ITD length on conformational changes
of the receptor (37,81). Therefore, to the best of our
knowledge, the present study was the first to report the ITD-FLT3
structural models in DFG-out and DFG-in conformations.
To evaluate the quality scores of the four models,
seven programs (ERRAT, Profile 3D Verify, QMEAN, Molprobity, ProSA,
ProQ and PROCHECK) were used, providing a set of parameters
indicating their high structural quality. This strategy
demonstrated that they could be used to assess the molecular
interactions and affinity scores of sorafenib, midostaurin,
gilteritinib and quizartinib.
The molecular interactions of TKIs with the FLT3
receptor are determined by the biochemical characteristics of each
inhibitor and the conformation of the receptor to which they bind
(76,82). First-generation TKIs were initially
designed to target RTKs, but they are not specific for FLT3. For
example, sorafenib and midostaurin can efficiently treat solid
tumors, such as hepatocarcinoma, advanced renal carcinoma and
non-small cell lung cancer, through the inhibition of Raf
serine/threonine kinase (83) and
protein kinase C (84),
respectively. However, the lack of specificity of these inhibitors
leads to strong cytotoxic effects at therapeutic doses, limiting
their therapeutic use (77,85).
Conversely, gilteritinib and quizartinib (second-generation
inhibitors) were explicitly designed against FLT3 to treat patients
with AML bearing ITD mutations or the D835 mutation in the TKD
(86–88). The molecular docking presented in
the present study confirmed that gilteritinib and quizartinib
(second-generation TKIs) have higher affinities for the
WT-FLT3/DFG-out and WT-FLT3/DFG-in models compared with sorafenib
and midostaurin (first-generation TKIs).
The molecular docking of WT-FLT3 and the use of
PyMOL2 and Discovery Studio visualizer programs indicated that
Leu616 and Lys614 [from the phosphate-binding loop (P-loop)],
Tyr693, Cys695, and Tyr696 [from the amino terminal lobe (N-lobe)]
were the main residues participating in the interactions of
WT-FLT3/DFG-out with its inhibitors, whereas Asp698 and Cys694
(from the N-lobe) were involved in the interaction with
WT-FLT3/DFG-in. These data partially coincide (Leu616, Tyr693,
Cys694, Cys695 and Tyr696) with those of Pandurang et al
(89), who also reported the
participation of Gly617, Val624, Ala642, Phe830 and Gly697 during
the formation of inhibitor/WT-FLT3 complexes. The present study
also indicated the participation of other residues, including
Arg764, Asp788, Asn790 (from the DFG-motif), Arg704 (from the
N-lobe) for WT-FLT3/DFG-out, and Asn701 (from the N-lobe), Asn836
(from the A-loop), Lys802 and Val801 (from the catalytic loop) for
WT-FLT3/DFG-in. These sites are associated with the backbone and
hinge region (JMD-TKD) of FLT3 and are crucial for the inhibitory
activity of the drugs (13,85).
Therefore, the ITD insertion in JMD, known to affect the
conformation of this region of FLT3, may modify the molecular
interactions with its inhibitors and modulate their activity.
Regarding the ITD-FLT3 models, it should be noted
that the amino acid position (number) increased downstream of the
ITD insertion site (9 aa long). The dockings showed that Asn710
(WT, Asn701), Asp707 (WT, Asp698), Arg773 (WT, Arg764), Cys703 (WT,
Cys694), Asn799 (WT, Asn790), Asp797 (WT, Asp788), Val810 (WT,
Val801) and Lys811 (WT, Lys802) were involved for both ITD-FLT3 and
WT-FLT3 receptors (common amino acids). Most amino acids
participating in the formation of the inhibitor/ITD-FLT3 complexes
belonged to the hinge region, P-loop, A-loop and N-lobe of the
receptor, as observed for WT-FLT3. The ITD insertion in FLT3 also
led to the participation of new amino acids from the interacting
region of the receptor. In particular, the
sorafenib/ITD-FLT3/DFG-out complex involved Arg792 (WT, Arg783),
the gilteritinib/ITD-FLT3/DFG-out complex involved Ser796 (WT,
Ser787), the quizartinib/ITD-FLT3/DFG-out complex involved Cys623
(WT, Cys614), and the midostaurin/ITD-FLT3/DFG-in complex involved
Arg773, Asn774 and Asp787 (WT, Arg764, Asn765 and Asp778,
respectively). The different residues forming these complexes may
change the affinity of the inhibitors.
The ITD mutation in FLT3 modified the affinity
forces of the TKIs included in the present study. This observation
supports previous reports by Zorn et al (36) and Friedman (76), who showed that the ITD mutation
increased receptor flexibility and facilitated the interaction
between ATP or TKIs (drugs) with their binding site, leading to
constitutive activation (through ATP binding) or modulation of the
activity of the receptors (through TKI binding). Sorafenib and
midostaurin exhibited increased affinity towards ITD-FLT3/DFG-out
compared with WT-FLT3/DFG-out. Conversely, sorafenib, midostaurin
and quizartinib exhibited no marked changes in their affinities
towards ITD-FLT3/DFG-in and WT-FLT3/DFG-in. Furthermore,
gilteritinib exhibited decreased affinity towards ITD-FLT3 compared
with WT-FLT3 (both DFG-out and DFG-in). Therefore, this inhibitor
was more sensitive to the effect of the ITD mutation than the rest.
Despite this in silico prediction, Perl et al
(90) and Smith et al
(91) reported that gilteritinib
was associated with a good survival outcome in patients with
refractory AML, 70% of which presented the ITD mutation.
Regarding the DFG motif, changes in its
conformation may modulate the affinity of its inhibitors and their
efficacy in AML treatment. Type I TKIs (midostaurin and
gilteritinib) preferentially bind to the ATP-binding pocket of the
DFG-in conformation, which is highly conserved between RTKs. By
contrast, type II TKIs (sorafenib and quizartinib) preferentially
bind to a less conserved region adjacent to the ATP binding pocket
of the DFG-out conformation (23,92).
The present data on type I TKIs showed that gilteritinib exhibited
improved affinity compared with midostaurin for WT-FLT3 (DFG-out
and DFG-in). These data agree with those of Egbuna et al
(93) and Bultum et al
(94), who reported high affinity
of gilteritinib for WT-FLT3/DFG-out. Mashkani et al
(15) reported that midostaurin
had a similar affinity for WT-FLT3, in DFG-out and DFG-in
conformations. The present results on type II TKIs also showed that
sorafenib and quizartinib had high affinity for the four FLT3
models, which coincides with reports by Egbuna et al
(93) for sorafenib and Mirza
et al (95) for quizartinib
using a WT-FLT3/DFG-out structural model of the receptor.
The differences in the molecular interactions and
affinities of the inhibitors may be related to their biochemical
characteristics. Both type I and type II inhibitors included in the
present study are heterocyclic aromatic compounds; however, they
have different characteristic structural groups; the type I
inhibitors are indoles and the type II inhibitors are
benzimidazoles. This may favor the binding of type I TKIs
(WT-FLT3/DFG-in) to the ATP-binding site and the binding of type II
TKIs (WT-FLT3/DFG-out) adjacent to the ATP-binding site (96). The changes in affinity forces may
also be due to the differences in polar and non-polar bonds, which
modulate the stability of the ligand/protein complexes (80).
Gilteritinib (type I TKIs) exhibited low affinity
for the active ITD-FLT3/DFG-in conformation compared with sorafenib
and quizartinib (type II TKIs) in both conformations (DFG-out and
DFG-in), while midostaurin showed an increase in affinity for
DFG-out. This difference may be related to the impact of the ITD
insertion on the availability of the binding site of FLT3 (97,98).
Although both inhibitors (type I and type II)
suppress FLT3, Wodicka et al (99) and Ke et al (13) reported that type I TKIs bind more
strongly to the WT-FLT3/DFG-in model. Contrarily, Vijayan et
al (18) reported that type II
TKIs have an improved selectivity for the inactive conformations of
FLT3 (DFG-out) because they are specific for each RTK.
In summary, the HMP and molecular docking tools
applied revealed that the four models were suitable for studying
the molecular interactions of TKIs with FLT3. They also highlighted
the affinity of the second-generation drugs gilteritinib and
quizartinib for WT and mutated FLT3 (DFG-out and DFG-in). To
corroborate the accuracy of these predictions, their effect was
evaluated in an in vitro cellular model of AML.
Several AML cell lines are available to evaluate
the cytotoxicity and specificity of TKIs, including the HL60
(WT-FLT3) and MV4-11 (ITD-FLT3-LOH) homozygote cell lines (32). It has been reported that LOH of
FLT3 in MV4-11 leukemia cells and patients with AML leads to the
constitutive phosphorylation of FLT3, the activation of its related
pathways and high malignancy (15). Commonly, ITD-FLT3-LOH is present in
35% of patients with newly diagnosed AML but in 70–80% of
refractory patients (32,100); thus, it is particularly important
to characterize inhibitors of this receptor.
The presence of the ITD insertion (~30 bp) in the
FLT3 sequence of MV4-11 cells was validated by end-point PCR,
confirming other reports (32,43,67).
In addition, the expression of FLT3 in the MV4-11 and HL60 cells
was confirmed by flow cytometry, which also showed that MV4-11
cells expressed more FLT3 receptors on their surface than HL60
cells. Quentmeier et al (32) also reported high expression levels
of ITD-FLT3 in MV4-11 cells, which enhanced their proliferation
compared with that of MULT-11 or MOLM-13 heterozygote cells, which
express WT-FLT3 and ITD-FLT3.
The upregulation of WT-FLT3 expression is commonly
observed in patients with newly diagnosed AML who respond
satisfactorily to conventional therapy (induction treatments with
daunorubicin and cytarabine, and consolidation treatment by bone
marrow transplant) (101).
However, if the patient (new or refractory) is positive for
ITD-FLT3 (homozygous or heterozygous), the only viable alternative
is TKI therapy (11). At present,
the only FDA-approved TKIs for the treatment of AML are midostaurin
(Rydapt®; 2017), gilteritinib (Xosapta®;
2018) and quizartinib (Vanflyta®; 2023) (25,68,90,102). Midostaurin induces adverse
effects and presents high toxicity (103). Additionally, this molecule may
induce drug resistance, leading to a progressive loss of
effectiveness and the need to increase the therapeutic dose during
the illness (76). Therefore, it
is mainly used in chemotherapy as a complement to cytostatic drugs
(daunorubicin and cytarabine) in newly diagnosed patients (86). Sorafenib has not yet been approved
for AML because of its strong side effects (104). Gilteritinib and quizartinib are
considered competitive inhibitors of WT- and ITD-FLT3 because of
their transitory binding to the receptor at the ATP-binding site
(type I) or adjacent to it (type II) (76,96).
Although both molecules were explicitly designed against WT- and
ITD-FLT3, quizartinib has a more potent inhibitory activity (22
mg/day) than gilteritinib (120 mg/day) (68,105,106), Gilteritinib is better tolerated
by patients than quizartinib (76). Thus, at present, quizartinib is
approved to be used in combination with chemotherapy in newly
diagnosed patients, and gilteritinib is recommended for monotherapy
in patients with refractory or relapsed AML (68,106).
In the MTT assay, both compounds strongly affected
AML cell viability, with IC50 values of 7.99 nM
(gilteritinib) and 4.76 nM (quizartinib) against MV4-11 cells, and
57.54 nM (gilteritinib) and 38.75 nM (quizartinib) against HL60
cells. These IC50 values were consistent with previous
reports in MV4-11 cells. Kawase et al (34) reported an IC50 of 3.8 nM
for gilteritinib and 0.7 nM for quizartinib; Wang and Baron
(103) reported an
IC50 of 3.34 nM for gilteritinib and 1.07 nM for
quizartinib; Hu et al (69)
reported an IC50 of 3.02 nM for gilteritinib; and Reiter
et al (44) reported an
IC50 of 1.8 nM for quizartinib. Furthermore, Mori et
al (25) reported that, in
Ba/F3 cells (murine interleukin-3-dependent pro-B cell line)
transfected with the ITD mutation, gilteritinib (IC50,
1.8 nM) and quizartinib (IC50, 0.46 nM) showed a similar
effect to that observed in the present study. Kawase et al
(34) also reported an
IC50 of 15.5 nM for gilteritinib and 1.6 nM for
quizartinib in MOLM-13 cells expressing the WT and ITD FLT3
receptor. These data highlight the strong in vitro effect of
gilteritinib (type I TKI) and quizartinib (type II TKI) against
leukemic cells and support the clinical evidence showing that they
are currently the best TKIs for the treatment of patients with
refractory AML.
The discrepancy between the high cytotoxic effect
of gilteritinib against MV4-11 cells that express ITD-FLT3 and the
prediction using molecular docking of a low affinity for ITD-FLT3
may be related to the Cys703 residue of ITD-FLT3 (WT, Cys694). Ke
et al (13), Mashkani et
al (15) and Pandurang et
al (89) pointed out the
importance of this amino acid for the formation of the
gilteritinib/FLT3 complexes because it helps maintain the
inhibitory effect. This may also explain why gilteritinib is useful
(as monotherapy) in AML in refractory patients that present a high
percentage of ITD-positive cells (68,90,100,106). Furthermore, the IC50
values revealed that the MV4-11 cells (ITD-FLT3) were more
sensitive to both inhibitors than the HL60 cells (WT-FLT3),
reflecting the fact that these drugs were designed to inhibit
ITD-FLT3.
Cell death by apoptosis and inhibition of cell
proliferation are among the main mechanisms that may explain the
effect of gilteritinib and quizartinib on MV4-11 and HL60 cells
through inhibition of the FLT3 receptor (69,104). Thus, apoptosis was examined by
flow cytometry using annexin V (a marker of phosphatidylserine
implicated in the induction of apoptosis) and PI (a DNA marker
related to loss of membrane integrity) labeling, and cell
proliferation was examined using CFSE labeling (a marker of cell
generation).
Under the present experimental conditions, both
gilteritinib (7.99 nM) and quizartinib (4.76 nM) slightly induced
early and late apoptosis in MV4-11 cells after 48 h of exposure,
and significantly induced necrosis compared with the vehicle
control. These results differ from those of Hu et al
(69), who reported a higher
percentage (37.2%) of annexin V-positive MV4-11 cells exposed to
2.5 nM gilteritinib for 48 h. However, the present results align
with those of other authors, such as Ueno et al (107), who observed that doses of 3–30 nM
only induced 20% apoptosis. Similarly, Qiao et al (108) tested gilteritinib concentrations
of 12.5, 25 and 50 nM, and observed that the highest concentration
promoted apoptosis in only 25% of MV4-11 cells after 24 h.
Quizartinib was recently evaluated by Qiu et al (109), who showed that 48 h of exposure
to a high concentration of this molecule (50 nM) induced apoptosis
in 65.8% of MV4-11 cells. In addition, the present study
demonstrated that 48 h of exposure to gilteritinib or quizartinib
did not induce apoptosis in HL60 cells or PBMCs. These data agreed
with Qiao et al (108) and
Darici et al (110) for
THP1 cells, HL60 cells and PBMCs.
The present study also demonstrated that the 48-h
exposure to the inhibitors significantly decreased MV4-11 cell
proliferation from 80.68% (vehicle control) to 20.36%
(gilteritinib) and 24.48% (quizartinib). However, this effect was
not observed in HL60 cells which showed a similar percentage of
proliferation after exposure to gilteritinib or quizartinib
compared with the vehicle control, suggesting that one of the
mechanisms responsible for the activity of these drugs is through
their specific and competitive binding to ITD-FLT3 in MV4-11 cells,
which inhibits its activity and delays the generation of new cells.
This observation confirmed previous studies with other
methodologies (Cell Counting Kit-8 and MTT assays) reporting that
both inhibitors (used at nM ranges) have a higher specificity for
ITD-FLT3 than for WT-FLT3 (70,111,112).
The viability of PBMCs was not affected following
48 h of exposure to gilteritinib or quizartinib. This result agrees
with reports by Qiao et al (108) and Darici et al (110) on PBMCs exposed to high
concentrations of gilteritinib (8,000 nM) and quizartinib (500 nM).
These cells exhibited no sign of apoptosis or impact on their
proliferation. These results are supported by the fact that the
main target of both inhibitors is the FLT3 protein. This
observation is of importance to avoid unwanted toxic effects in
non-tumor blood cells, which are crucial in the functioning and
defense of the organism. AML treatments have progressed in the last
decade, fostering the development of precision TKIs targeting WT
and ITD-mutated FLT3 receptors (76,85,89).
The present in silico study showed a strong affinity of
second-generation TKIs for WT-FLT3 (DFG-out and DFG-in) compared
with the first-generation drugs. Additionally, the ITD mutation in
FLT3 impacted the binding of the TKIs tested, and the effects were
different for each inhibitor. The high affinities of gilteritinib
(for WT-FLT3/DFG-out and WT-FLT3/DFG-in) and quizartinib (for all
four FLT3 models) predicted in silico were tested in
vitro by evaluating their IC50 in MV4-11 (ITD-FLT3)
and HL60 (WT-FLT3) cell lines. The MV4-11 cells showed a slight
induction of apoptosis and were more sensitive to both inhibitors
than the HL60 cells. A significant decrease in proliferation in
MV4-11 cells and a milder effect on HL60 cells were observed. No
cytotoxic effect against non-tumoral blood cells (PBMCs from a
healthy volunteer with null FLT3 expression) was observed,
suggesting a specific effect of these TKIs against the FLT3
receptor expressed in leukemic cells.
As aforementioned, in the early stages of AML,
patients express low levels of WT-FLT3 (such as HL60 cells). By
contrast, 70–80% of patients with refractory or advanced-stage AML
present the ITD-FLT3 mutation due to LOH (such as MV4-11 cells),
which favors leukemic cell proliferation because of the
constitutive expression of FLT3 (12,100). Thus, the rationale for using
MV4-11 cells that possess the homozygous ITD-FLT3 mutation and HL60
cells that only express WT-FLT3 was to compare the effect of
gilteritinib and quizartinib in a progressive cellular model of
AML. Based on the present data and to further explore the
contribution of FLT3 in leukemic cell proliferation and the
inhibitory mechanism of TKIs, it would be interesting to complement
the present in vitro model with more AML cell lines that
express WT-FLT3 (THP1 cells) and WT/ITD-FLT3 (MOLM-13 and PL21
cells), and with null expression of FLT3 (U937 and HEL cells)
(32,63). Additionally, more work is needed to
include an MV4-11 cell line with equal expression of WT-FLT3 and
ITD-FLT3 receptor, as well as an FLT3-free control system, which
could be achieved by transfection and knockout of expression of
FLT3 using interfering RNA (short hairpin RNA or small interfering
RNA).
The present study provides a valuable starting
point for further research. The construction of the structural
models of WT-FLT3 and ITD-FLT3 (DFG-out and DFG-in), the
descriptions of the molecular interactions and the calculations of
the affinity forces of TKIs are relevant as they contribute to the
knowledge of their mechanisms of action and provide high-quality
data to search for novel, more specific and potent FLT3 inhibitory
molecules of synthetic or natural origins, which are urgently
needed for patients with AML. In addition, the present study
provides the basis of an in vitro progressive model of AML
to test their efficiency.
Supplementary Material
Supporting Data
Acknowledgements
The authors would like to thank Dr Abel Gutiérrez
Ortega and Dr Rodolfo Hernández Gutiérrez for facilitating access
to the Medical Biotechnology and Pharmaceutical Unit of the Center
for Research and Assistance in Technology and Design of the State
of Jalisco, Guadalajara, Mexico, Dr Susana del Toro Arreola (Health
Science Campus of the University of Guadalajara, Guadalajara,
Mexico) and Dr Jesse Haramati (Biological and Agricultural Sciences
Campus of the University of Guadalajara, Zapopan, Mexico) for their
expert scientific guidelines, and Dr Luis Javier Reséndiz Castillo
(Health Science Campus of the University of Guadalajara,
Guadalajara, Mexico) for revising the manuscript. The authors would
also like to thank Dr Rebeca Mendez-Hernandez (Monell Chemical
Senses Center, Philadelphia, PA, USA) for editing the manuscript in
English.
Funding
The present study was supported by the Research Promoting
Programs of the University of Guadalajara, Mexico (grant no.
271980) and a PhD degree grant (grant no. 842471) from the
CONAHCYT, Mexico.
Availability of data and materials
The data generated in the present study may be
requested from the corresponding author.
Authors' contributions
ASCA, AS and SEHR conceptualized the study. ASCA,
LFJS and FYFH were involved in designing the methodology. ASCA
performed the experiments. ASCA and MDRHL curated the data and
performed formal analyses. ASCA, AS and SEHR wrote the draft and
final version of the manuscript. ASCA, AS, SEHR, LFJS, MDRHL and
FYFH reviewed and edited the manuscript. AS and SEHR acquired the
funding, were involved in project administration and confirm the
authenticity of all the raw data. All authors have read and
approved the final version of the manuscript.
Ethics approval and consent to
participate
The peripheral blood mononuclear cells used in the
present study were obtained with the written informed consent of
one healthy volunteer for participation in this project based on
ethical criteria for collecting biological samples and in
accordance with relevant guidelines and regulations of the
Declaration of Helsinki. The present study was approved by the
Bioethical Committee of the Biological and Agricultural Sciences
Campus of the University of Guadalajara (approval no. 2019-2024;
Zapopan, Jalisco, Mexico).
Patient consent for publication
Not applicable.
Competing interests
The authors declare that they have no competing
interests.
References
|
1
|
Shimony S, Stahl M and Stone RM: Acute
myeloid leukemia: 2023 update on diagnosis, risk-stratification,
and management. Am J Hematol. 98:502–526. 2023. View Article : Google Scholar : PubMed/NCBI
|
|
2
|
Ferlay J, Ervik M, Lam F, Laversanne M,
Colombet M, Mery L, Piñeros M, Znaor A, Soerjomataram I and Bray F:
Global Cancer Observatory: Cancer Today. International agency for
research on cancer; Lyon: 2024, Available from:. https://gco.iarc.who.int/today06–May. 2024
|
|
3
|
Gokhale P, Chauhan APS, Arora A, Khandekar
N, Nayarisseri A and Singh SK: FLT3 inhibitor design using
molecular docking based virtual screening for acute myeloid
leukemia. Bioinformation. 15:104–115. 2019. View Article : Google Scholar : PubMed/NCBI
|
|
4
|
Azizidoost S, Babashah S, Rahim F,
Shahjahani M and Saki N: Bone marrow neoplastic niche in leukemia.
Hematology. 19:232–238. 2014. View Article : Google Scholar : PubMed/NCBI
|
|
5
|
Ding L, Ley T, Larson D, Miller C, Koboldt
D, Welch J, Ritchey J, Young M, Lamprecht T, McLellan M, et al:
Clonal evolution in relapsed acute myeloid leukaemia revealed by
whole-genome sequencing. Nature. 481:506–510. 2012. View Article : Google Scholar : PubMed/NCBI
|
|
6
|
Santoyo-Sánchez A, Ramos-Peñafiel CO,
Saavedra-González A, González-Almanza L, Martínez-Tovar A,
Olarte-Carrillo I and Collazo-Jaloma J: The age and sex frequencies
of patients with leukemia seen in two reference centers in the
metropolitan area of Mexico City. Gac Med Mex. 152:186–189.
2016.PubMed/NCBI
|
|
7
|
Gilliland D and Griffin J: The roles of
FLT3 in hematopoiesis and leukemia. Blood. 100:1532–1542. 2002.
View Article : Google Scholar : PubMed/NCBI
|
|
8
|
Lagunas-Rangel FA and Chávez-Valencia V:
FLT3-ITD and its current role in acute myeloid leukaemia. Med
Oncol. 34:1142017. View Article : Google Scholar : PubMed/NCBI
|
|
9
|
Arber D, Orazi A, Hasserjia R, Thiele J,
Borowitz M, Beau M, Bloomfield C, Cazzola M and Vardiman J: The
2016 revision to the World Health Organization classification of
myeloid neoplasms and acute leukemia. Blood. 127:2391–2405. 2016.
View Article : Google Scholar : PubMed/NCBI
|
|
10
|
Kazi J and Rönnstrand L: FMS-like tyrosine
kinase 3/FLT3: From basic science to clinical implications. Physiol
Rev. 99:1433–1466. 2019. View Article : Google Scholar : PubMed/NCBI
|
|
11
|
Fernández S, Desplat V, Villacreces A,
Guitart A, Milpied N, Rigneux A, Vigo I, Pasquet J and Dumas P:
Targeting tyrosine kinases in acute myeloid leukemia: Why, who and
how? Int J Mol Sci. 20:34292019. View Article : Google Scholar : PubMed/NCBI
|
|
12
|
Marensi V, Keeshan KR and MacEwan DJ:
Pharmacological impact of FLT3 mutations on receptor activity and
responsiveness to tyrosine kinase inhibitors. Biochem Pharmacol.
183:1143482021. View Article : Google Scholar : PubMed/NCBI
|
|
13
|
Ke YY, Singh VK, Coumar MS, Hsu YC, Wang
WC, Song JS, Chen CH, Lin WH, Wu SH, Hsu JT, et al: Homology
modeling if DFG-in FMS-like tyrosine kinase 3 (FLT3) and
structure-based virtual screening for inhibitor identification. Sci
Rep. 5:117022015. View Article : Google Scholar : PubMed/NCBI
|
|
14
|
Peng YH, Shiao HY, Tu CH, Liu PM, Hsu JT,
Amancha PK, Wu JS, Coumar MS, Chen CH, Wang SY, et al: Protein
kinase inhibitor design by targeting the Asp-Phe-Gly (DFG) motif:
The role of the DFG motif in the design of epidermal growth factor
receptor inhibitors. J Med Chem. 56:3889–3903. 2013. View Article : Google Scholar : PubMed/NCBI
|
|
15
|
Mashkani B, Tanipour MH, Saadatmandzadeh
M, Ashman LK and Griffith R: FMS-like tyrosine kinase 3 (FLT3)
inhibitors: Molecular docking and experimental studies. Eur J
Pharmacol. 776:156–166. 2016. View Article : Google Scholar : PubMed/NCBI
|
|
16
|
Fabbro D, Cowan-Jacob SW and Moebitz H:
Ten things you should know about protein kinases: IUPHAR review 14.
Br J Pharmacol. 172:2675–2700. 2015. View Article : Google Scholar : PubMed/NCBI
|
|
17
|
Ung PM and Schlessinger A: DFGmodel:
Predicting protein kinase structures in inactive states for
structure-based discovery of type-II inhibitors. ACS Chem Biol.
10:269–278. 2015. View Article : Google Scholar : PubMed/NCBI
|
|
18
|
Vijayan RS, He P, Modi V, Duong-Ly KC, Ma
H, Peterson JR, Dunbrack RL and Levy RM: Conformational analysis of
the DFG-out kinase motif and biochemical profiling of structurally
validated type II inhibitors. Med Chem. 58:466–479. 2015.
View Article : Google Scholar : PubMed/NCBI
|
|
19
|
Uras I, Maurer B, Nebenfuehr S, Zujer M,
Valent P and Sexl V: Therapeutic vulnerabilities in FLT3-mutant AML
unmasked by Palbociclib. Int J Mol Sci. 19:39872018. View Article : Google Scholar : PubMed/NCBI
|
|
20
|
Rücker FG, Du L, Luck TJ, Benner A,
Krzykalla J, Gathmann I, Voso MT, Amadori S, Prior TW, Brandwein
JM, et al: Molecular landscape and prognostic impact of FLT3-ITD
insertion site in acute myeloid leukemia: RATIFY study results.
Leukemia. 36:90–99. 2022. View Article : Google Scholar : PubMed/NCBI
|
|
21
|
Bohl SR, Bullinger L and Rücker FG: New
targeted agents in acute myeloid leukemia: New hope on the rise.
Int J Mol Sci. 20:19832019. View Article : Google Scholar : PubMed/NCBI
|
|
22
|
Kayser S, Schlenk RF, Londono MC,
Breitenbuecher F, Wittke K, Du J, Groner S, Späth D, Krauter J,
Ganser A, et al: Insertion of FLT3 internal tandem duplication in
the tyrosine kinase domain-1 is associated with resistance to
chemotherapy and inferior outcome. Blood. 114:2386–2392. 2009.
View Article : Google Scholar : PubMed/NCBI
|
|
23
|
Sexauer A and Tasian S: Targeting FLT3
signaling in childhood acute myeloid leukemia. Front pediatr.
5:2482017. View Article : Google Scholar : PubMed/NCBI
|
|
24
|
Daver N, Schlenk RF, Russell NH and Levis
MJ: Targeting FLT3 mutations in AML: review of current knowledge
and evidence. Leukemia. 33:299–312. 2019. View Article : Google Scholar : PubMed/NCBI
|
|
25
|
Mori M, Kaneko N, Ueno Y, Yamada M, Tanaka
R, Saito R, Shimada I, Mori K and Kuromitsu S: Gilteritinib, a
FLT3/AXL inhibitor, shows antileukemic activity in mouse models of
FLT3 mutated acute myeloid leukemia. Invest New Drugs. 35:556–565.
2017. View Article : Google Scholar : PubMed/NCBI
|
|
26
|
Loschi M, Sammut R, Chiche E and Cluzeau
T: FLT3 tyrosine kinase inhibitors for the treatment of fit and
unfit patients with FLT3-mutated AML: A systematic review. Int J
Mol Sci. 11:58732021. View Article : Google Scholar
|
|
27
|
Sun J, Hu R, Han M, Tan Y, Xie M, Gao S
and Hu JF: Mechanisms underlying therapeutic resistance of tyrosine
kinase inhibitors in chronic myeloid leukemia. Int J Biol Sci.
1:175–181. 2024. View Article : Google Scholar
|
|
28
|
Barton GJ: Protein sequence alignment
techniques. Acta Crystallogr D Biol. 54:1139–1146. 1998. View Article : Google Scholar : PubMed/NCBI
|
|
29
|
Contreras-Moreira B, Fitzjohn P and Bates
P: Comparative modelling: And essential methodology for protein
structure prediction in the post-genomic era. Appl Bioinformatics.
1:177–190. 2002.PubMed/NCBI
|
|
30
|
Saxena A, Sangwan RS and Mishra S:
Fundamentals of homology modeling steps and comparison among
important bioinformatics tools: An overview. Sci Int. 1:237–252.
2013. View Article : Google Scholar
|
|
31
|
Meng XY, Zhang HX, Mezei M and Cui M:
Molecular docking: A powerful approach for structure-based drug
discovery. Curr Comput Aided Drug Des. 7:146–157. 2011. View Article : Google Scholar : PubMed/NCBI
|
|
32
|
Quentmeier H, Reinhardt J, Zaborski M and
Drexler HG: FLT3 mutations in acute myeloid leukemia cell lines.
Leukemia. 17:120–124. 2003. View Article : Google Scholar : PubMed/NCBI
|
|
33
|
Xu B, Zhao Y, Wang X, Gong P and Ge W:
MZH29 is a novel potent inhibitor that overcomes drug resistance
FLT3 mutations in acute myeloid leukemia. Leukemia. 31:913–921.
2017. View Article : Google Scholar : PubMed/NCBI
|
|
34
|
Kawase T, Nakazawa T, Eguchi T, Tsuzuki H,
Ueno Y, Amano Y, Suzuki T, Mori M and Yoshida T: Effect of Fms-like
tyrosine kinase 3 (FLT3) ligand (FL) on antitumor activity of
gilteritinib, a FLT3 inhibitor, in mice xenografted with
FL-overexpressing cells. Oncotarget. 101:6111–6123. 2019.
View Article : Google Scholar : PubMed/NCBI
|
|
35
|
Akwata D, Kempen AL and Sintim HO:
Identification of a selective FLT3 inhibitor with low activity
against VEGFR, FGFR, PDGFR, c-KIT, and RET anti-targets.
ChemMedChem. 19:e2023004422023. View Article : Google Scholar : PubMed/NCBI
|
|
36
|
Zorn JA, Wang Q, Fujimura E, Barros T and
Kuriyan J: Crystal structure of the FLT3 kinase domain bound to the
inhibitor Quizartinib (AC220). PLoS One. 10:e01211772015.
View Article : Google Scholar : PubMed/NCBI
|
|
37
|
Todde G and Friedman R: Conformational
modifications induced by internal tandem duplication on the FLT3
kinase and juxtamembrane domains. Phys Chem Chem Phys.
21:18467–18476. 2019. View Article : Google Scholar : PubMed/NCBI
|
|
38
|
Griffith J, Black J, Faerman C, Swenson L,
Wynn M, Lu F, Lippke J and Kumkum Saxena K: The structural basis
for autoinhibition of FLT3 by the juxtamembrane domain. Mol Cell.
13:169–178. 2004. View Article : Google Scholar : PubMed/NCBI
|
|
39
|
Thomas C: Crystal structure of the FLT3
kinase bound to a small molecule inhibitor. 2018.Available from:.
https://doi.org/10.2210/pdb6il3/pdb
|
|
40
|
Waterhouse A, Bertoni M, Bienert S, Studer
G, Tauriello G, Gumienny R, Heer FT, de Beer TAP, Rempfer C,
Bordoli L, et al: SWISS-MODEL: Homology modelling of protein
structures and complexes. Nucleic Acids Res. 46:W296–W303. 2018.
View Article : Google Scholar : PubMed/NCBI
|
|
41
|
Altschul SF, Gish W, Miller W, Myers EW
and Lipman DJ: Basic local alignment search tool. J Mol Biol.
215:403–410. 1990. View Article : Google Scholar : PubMed/NCBI
|
|
42
|
Mol CD, Lim KB, Sridhar V, Zou H, Chien
EY, Sang BC, Nowakowski J, Kassel DB, Cronin CN and McRee DE:
Structure of a c-kit product complex reveals the basis for kinase
transactivation. JBC. 278:31461–31464. 2003. View Article : Google Scholar : PubMed/NCBI
|
|
43
|
Thompson JD, Higgins DG and Gibson TJ:
CLUSTAL W: Improving the sensitivity of progressive multiple
sequence alignment through sequence weighting, position-specific
gap penalties and weight matrix choice. Nucleic Acids Res.
22:4673–4680. 1994. View Article : Google Scholar : PubMed/NCBI
|
|
44
|
Reiter K, Polzer H, Krupka C, Maiser A,
Vick B, Rothenberg-Thurley M, Metzeler KH, Dörfel D, Salih HR, Jung
G, et al: Tyrosine kinase inhibition increases the cell surface
localization of FLT3-ITD and enhances FLT3-directed immunotherapy
of acute myeloid leukemia. Leukemia. 32:313–322. 2018. View Article : Google Scholar : PubMed/NCBI
|
|
45
|
Webb B and Sali A: Comparative protein
structure modeling using modeller. Curr Protoc Bioinformatics.
54:5.6.1–5.6.37. 2016. View
Article : Google Scholar : PubMed/NCBI
|
|
46
|
Pettersen E, Goddard T, Huang C, Couch G,
Greenblatt D, Meng E and Ferriny T: UCSF chimera visualization
system for exploratory research and analysis. J Comput Chem.
25:1605–1612. 2004. View Article : Google Scholar : PubMed/NCBI
|
|
47
|
Shen MY and Sali A: Statistical potential
for assessment and prediction of protein structures. Protein Sci.
15:2507–2524. 2006. View Article : Google Scholar : PubMed/NCBI
|
|
48
|
Bhattacharya D, Nowotny J, Cao R and Cheng
J: 3Drefine: An interactive web server for efficient protein
structure refinement. Nucleic Acids Res. 44:W406–W409. 2016.
View Article : Google Scholar : PubMed/NCBI
|
|
49
|
Colvos C and Yeates T: Verification of
protein structures: Patterns of nonbonded atomic interactions.
Protein Sci. 2:1511–1519. 1993. View Article : Google Scholar : PubMed/NCBI
|
|
50
|
Eisenberg D, Luthy R and Bowie J:
VERIFY3D: Assessment of protein models with three-dimensional
profiles. Methods Enzymol. 277:396–404. 1997. View Article : Google Scholar : PubMed/NCBI
|
|
51
|
Laskowski R, Moss D and Thornton J:
Main-chain bond length and bond angles in protein structures. J Mol
Biol. 231:1049–1067. 1993. View Article : Google Scholar : PubMed/NCBI
|
|
52
|
Benkert P, Biasini M and Schwede T: Toward
the estimation of the absolute quality of individual protein
structure models. Bioinformatics. 27:343–350. 2011. View Article : Google Scholar : PubMed/NCBI
|
|
53
|
Williams CJ, Headd JJ, Moriarty NW,
Prisant MG, Videau LL, Deis LN, Verma V, Keedy DA, Hintze BJ, Chen
VB, et al: MolProbity: More and better reference data for improved
all-atom structure validation. Protein Sci. 27:293–315. 2018.
View Article : Google Scholar : PubMed/NCBI
|
|
54
|
Wiederstein M and Sippl M: ProSA-web:
Interactive web service for the recognition of errors in
three-dimensional structures of proteins. Nucleic Acids Res.
35:W407–W410. 2007. View Article : Google Scholar : PubMed/NCBI
|
|
55
|
Cristobal S, Zemla A, Fischer D,
Rychlewski L and Elofsson A: A study of quality measures for
protein threading models. BMC Bioinformatics. 2:52001. View Article : Google Scholar : PubMed/NCBI
|
|
56
|
Morris G, Huey R, Lindstrom W, Sanner M,
Belew R, Goodsell D and Olson A: AutoDock4 and AutoDockTools4:
Automated docking with selective receptor flexibility. J Comput
Chem. 30:2785–2791. 2009. View Article : Google Scholar : PubMed/NCBI
|
|
57
|
Irwin J and Shoichet B: ZINC-A Free
database of commercially available compounds for virtual screening.
J Chem Inf Model. 45:177–182. 2005. View Article : Google Scholar : PubMed/NCBI
|
|
58
|
Goodsell D, Morris G and Olson A:
Automated docking of flexible ligands: Applications of autodock.
JMR. 9:1–5. 1996.PubMed/NCBI
|
|
59
|
Trott O and Olson A: AutoDock Vina:
Improving the speed and accuracy of docking with a new scoring
function, efficient optimization, and multithreading. J Comput
Chem. 31:455–461. 2010. View Article : Google Scholar : PubMed/NCBI
|
|
60
|
Schrödinger L and DeLano W: PyMOL.
2020.Available from:. http://www.pymol.org/pymol
|
|
61
|
Den Dunnen JT, Dalgleish R, Maglott DR,
Hart RK, Greenblatt MS, McGowan-Jordan J, Roux AF, Smith T,
Antonarakis SE and Taschner PEM: HGVS recommendations for the
description of sequence variants: 2016 update. Hum Mutat.
37:564–569. 2016. View Article : Google Scholar : PubMed/NCBI
|
|
62
|
Schiffer CA and Stone RM: Morphologic
Classification and Clinical and Laboratory Correlates. Holland-Frei
Cancer Medicine. Kufe DW, Pollock RE, Weichselbaum RR, et al: 6th
edition. BC Decker; Hamilton, ON: 2003, Available from:. https://www.ncbi.nlm.nih.gov/books/NBK13452/
|
|
63
|
Skopek R, Palusińsk M, Kaczor-Keller K,
Pingwara R, Papierniak-Wyglądała A, Schenk T, Lewicki S, Zelent A
and Szymański Ł: Choosing the right cell line for acute myeloid
leukemia (AML) research. Int J Mol Sci. 24:53772023. View Article : Google Scholar : PubMed/NCBI
|
|
64
|
Sambrook J and Russell DW: Molecular
Cloning: A Laboratory Manual. 1. 3rd edition. Cold Spring Harbor
Laboratory Press; New York, NY: 2001
|
|
65
|
Huang Y, Hu J, Lu T, Luo Y, Shi J, Wu W,
Han X, Zheng W, He J, Cai Z, et al: Acute myeloid leukemia patient
with FLT3-ITD and NPM1 double mutation should undergo allogeneic
hematopoietic stem cell transplantation in CR1 for better
prognosis. Cancer Treat Res Commun. 11:4129–4142. 2019.
|
|
66
|
FlowJo™ Software (Windows) [software
application] Version 10.6.2. Becton-Dickinson and Company; Ashland,
OR: 2023
|
|
67
|
Pulte ED, Norsworthy KJ, Wang Y, Xu Q,
Qosa H, Gudi R, Przepiorka D, Fu W, Okusanya OO, Goldberg KB, et
al: FDA approval summary: Gilteritinib for relapsed or refractory
acute myeloid leukemia with a FLT3 mutation. Clin Cancer Re.
27:3515–3521. 2021. View Article : Google Scholar : PubMed/NCBI
|
|
68
|
Erba HP, Montesinos P, Kim HJ, Patkowska
E, Vrhovac R, Žák P, Wang PN, Mitov T, Hanyok J, Kamel YM, et al:
Quizartinib plus chemotherapy in newly diagnosed patients with
FLT3-internal-tandem-duplication-positive acute myeloid leukaemia
(QuANTUM-First): A randomised, double-blind, placebo-controlled,
phase 3 trial. Lancet Glob Health. 401:1571–1583. 2023.
|
|
69
|
Hu X, Cai J, Zhu J, Lang W, Zhong J, Zhong
H and Chen F: Arsenic trioxide potentiates Gilteritinib-induced
apoptosis in FLT3-ITD positive leukemic cells via
IRE1a-JNK-mediated endoplasmic reticulum stress. Cancer Cell Int.
20:2502020. View Article : Google Scholar : PubMed/NCBI
|
|
70
|
James AJ, Smith CC, Litzow M, Perl AE,
Altman JK, Shepard D, Kadokura T, Souda K, Patton M, Lu Z, et al:
Pharmacokinetic profile of Gilteritinib: A novel FLT-3 tyrosine
kinase inhibitor. Clin Pharmacokinet. 59:1273–1290. 2020.
View Article : Google Scholar : PubMed/NCBI
|
|
71
|
Li J, Trone D, Mendell J, O'Donnel P and
Cook N: A drug-drug interaction study to assess the potential
effect of acid-reducing agent, lansoprazole, on quizartinib
pharmacokinetics. Cancer Chemother Pharmacol. 84:799–807. 2019.
View Article : Google Scholar : PubMed/NCBI
|
|
72
|
Motulsky H and Christopoulos A: Fitting
models to biological data using linear and nonlinear regression.
Oxford Press; Oxford, UK: in press; pp. 211–316. 2004
|
|
73
|
RStudio Team: RStudio: Integrated
Development for R. RStudio. PBC; Boston, MA: 2020, Available from:.
http://www.rstudio.com/
|
|
74
|
Jilani I, Estey E, Manshuri T, Caligiuri
M, Keating M, Giles F, Thomas D, Kantarjian H and Albitar M: Better
detection of FLT3 internal tandem duplication using peripheral
blood plasma DNA. Leukemia. 17:114–119. 2003. View Article : Google Scholar : PubMed/NCBI
|
|
75
|
Razumovskaya E, Masson K, Khan R,
Bengtsson S and Rönnstrand L: Oncogenic Flt3 receptors display
different specificity and kinetics of autophosphorylation. Exp
Hematol. 37:979–989. 2009. View Article : Google Scholar : PubMed/NCBI
|
|
76
|
Friedman R: The molecular mechanisms
behind activation of FLT3 in acute myeloid leukemia and resistance
to therapy by selective inhibitors. Biochim Biophys Acta Rev
Cancer. 1877:1886662022. View Article : Google Scholar : PubMed/NCBI
|
|
77
|
Patnaik MM: The importance of FLT3
mutational analysis in acute myeloid leukemia. Leuk Lymphoma.
59:2273–2286. 2018. View Article : Google Scholar : PubMed/NCBI
|
|
78
|
Castaño-Bonilla T, Alonso-Dominguez JM,
Barragán E, Rodríguez-Veiga R, Sargas C, Gil C, Chillón C,
Vidriales MB, García R, Martínez-López J, et al: Prognostic
significance of FLT3-ITD length in AML patients treated with
intensive regimens. Sci Rep. 11:207452021. View Article : Google Scholar : PubMed/NCBI
|
|
79
|
Xie T, Saleh T, Rossi P and Kalodimos CG:
Conformational states dynamically populated by a kinase determine
its function. Science. 370:eabc27542020. View Article : Google Scholar : PubMed/NCBI
|
|
80
|
Lee CC, Chuang YC, Liu YL and Yang CN: A
molecular dynamics simulation study for variant drug responses due
to FMS-like tyrosine kinase 3 G697R mutation. RSC Adv.
7:29871–29881. 2017. View Article : Google Scholar
|
|
81
|
Todde G and Friedman R: Pattern and
dynamics of FLT3 duplications. J Chem Inf Model. 60:4005–4020.
2020. View Article : Google Scholar : PubMed/NCBI
|
|
82
|
Zhao J, Song Y and Liu D: Gilteritinib: A
novel FLT3 inhibitor for acute myeloid leukemia. Biomark Res.
7:192019. View Article : Google Scholar : PubMed/NCBI
|
|
83
|
Iyer R, Fetterly G, Lugade A and Thanavala
Y: Sorafenib: A clinical and pharmacologic review. Expert Opin
Pharmacother. 11:1943–1955. 2010. View Article : Google Scholar : PubMed/NCBI
|
|
84
|
Kawano T, Inokuchi J, Eto M, Murata M and
Kang JH: Activators and inhibitors of protein kinase C (PKC): Their
applications in clinical trials. Pharmaceutics. 13:17482021.
View Article : Google Scholar : PubMed/NCBI
|
|
85
|
Assi R and Ravandi F: FLT3 inhibitors in
acute myeloid leukemia: Choosing the best when the optimal does not
exist. Am J Hematol. 93:553–563. 2018. View Article : Google Scholar : PubMed/NCBI
|
|
86
|
Tarver TC, Hill JE, Rahmat L, Perl AE,
Bahceci E, Mori K and Smith CC: Gilteritinib is a clinically active
FLT3 inhibitor with broad activity against FLT3 kinase domain
mutations. Blood Adv. 4:514–524. 2020. View Article : Google Scholar : PubMed/NCBI
|
|
87
|
Zhou F, Ge Z and Chen B: Quizartinib
(AC220) a promising option for acute myeloid leukemia. Drug Des
Devel Ther. 13:1117–1125. 2019. View Article : Google Scholar : PubMed/NCBI
|
|
88
|
Kennedy VE and Smith CC: FLT3 mutations in
acute myeloid leukemia: Key concepts and emerging controversies.
Front Oncol. 10:6128802020. View Article : Google Scholar : PubMed/NCBI
|
|
89
|
Pandurang S, Keretsu S and Joo S: Design
of new therapeutic agents targeting FLT3 receptor tyrosine kinase
using molecular docking and 3D-QSAR approach. Lett Drug Des Discov.
17:585–596. 2020. View Article : Google Scholar
|
|
90
|
Perl AE, Martinelli G, Cortes JE, Neubauer
A, Berman E, Paolini S, Montesinos P, Baer MR, Larson RA, Ustun C,
et al: Gilteritinib or chemotherapy for relapsed or refractory
FLT3-mutated AML. N Engl J Med. 381:1728–1740. 2019. View Article : Google Scholar : PubMed/NCBI
|
|
91
|
Smith CC, Levis MJ, Perl AE, Hill JE,
Rosales M and Bahceci E: Molecular profile of FLT3-mutated
relapsed/refractory patients with AML in the phase 3 ADMIRAL study
of gilteritinib. Blood Adv. 6:2144–2155. 2022. View Article : Google Scholar : PubMed/NCBI
|
|
92
|
Larrosa-Garcia M and Baer MR: FLT3
inhibitors in acute myeloid leukemia: Current status and future
directions. Mol Cancer Ther. 16:991–1001. 2017. View Article : Google Scholar : PubMed/NCBI
|
|
93
|
Egbuna C, Patrick-Iwuanyanwu KC, Onyeike
EN, Khan J and Alshehri B: FMS-like tyrosine kinase-3 (FLT3)
inhibitors with better binding affinity and ADMET properties than
sorafenib and gilteritinib against acute myeloid leukemia: In
silico studies. J Biomol Struct Dyn. 40:12248–12259. 2022.
View Article : Google Scholar : PubMed/NCBI
|
|
94
|
Bultum LE, Tolossa GB and Lee D: Combining
empirical knowledge, in silico molecular docking and ADMET
profiling to identify therapeutic phytochemicals from Brucea
antidysentrica for acute myeloid leukemia. PLoS One.
17:e02700502022. View Article : Google Scholar : PubMed/NCBI
|
|
95
|
Mirza Z, Al-Saedi DA, Alganmi N and Karim
S: Landscape of FLT3 variations associated with structural and
functional impact on acute myeloid leukemia: A computational study.
Int J Mol Sci. 25:34192024. View Article : Google Scholar : PubMed/NCBI
|
|
96
|
Ezelarab HAA, Ali TFS, Abbas SH, Hassan HA
and Beshr EAM: Indole-based FLT3 inhibitors and related scaffolds
as potential therapeutic agents for acute myeloid leukemia. BMC
Chem. 17:732023. View Article : Google Scholar : PubMed/NCBI
|
|
97
|
Chen D, Oezguen N, Urvil P, Ferguson C,
Dann SM and Savidge TC: Regulation of protein-ligand binding
affinity by hydrogen bond pairing. Sci Adv. 2:e15012402016.
View Article : Google Scholar : PubMed/NCBI
|
|
98
|
Madushanka A, Moura Jr RT, Verma N and
Kraka E: Quantum mechanical assessment of protein-ligand hydrogen
bond strength patterns: Insights from semiempirical tight-binding
and local vibrational mode theory. Int J Mol Med Sci. 24:63112023.
View Article : Google Scholar
|
|
99
|
Wodicka LM, Ciceri P, Davis MI, Hunt JP,
Floyd M, Salerno S, Hua XH, Ford JM, Armstrong RC, Zarrinkar PP and
Treiber DK: Activation state-dependent binding of small molecule
kinase inhibitors: structural insights from biochemistry. Chem
Biol. 17:1241–1249. 2010. View Article : Google Scholar : PubMed/NCBI
|
|
100
|
Stirewalt DL, Pogosova-Agadjanyan EL,
Tsuchiya K, Joaquin J and Meshinchi S: Copy-neutral loss of
heterozygosity is prevalent and a late event in the pathogenesis of
FLT3/ITD AML. Blood Cancer J. 4:e2082014. View Article : Google Scholar : PubMed/NCBI
|
|
101
|
Daver N, Venugopal S and Ravandi F: FLT3
mutated acute myeloid leukemia: 2021 treatment algorithm. Blood
Cancer J. 11:1042021. View Article : Google Scholar : PubMed/NCBI
|
|
102
|
Kim ES: Midostaurin: First global
approval. Drugs. 77:1251–1259. 2017. View Article : Google Scholar : PubMed/NCBI
|
|
103
|
Wang ES and Baron J: Management of
toxicities associated with targeted therapies for acute myeloid
leukemia: When to push through and when to stop. Hematology Am Soc
Hematol Educ Program. 1:57–66. 2020. View Article : Google Scholar : PubMed/NCBI
|
|
104
|
Scholl S, Fleischmann M, Schnetzke U and
Heidel FH: Molecular mechanisms of resistance to FLT3 inhibitors in
acute myeloid leukemia: Ongoing challenges and future treatments.
Cells. 9:24932020. View Article : Google Scholar : PubMed/NCBI
|
|
105
|
Levis M: Quizartinib for the treatment of
FLT3/ITD acute myeloid leukemia. Future Oncol. 10:1571–1579. 2014.
View Article : Google Scholar : PubMed/NCBI
|
|
106
|
Perl AE, Hosono N, Montesinos P, Podoltsev
N, Martinelli G, Panoskaltsis N, Recher C, Smith CC, Levis MJ,
Strickland S, et al: Clinical outcomes in patients with
relapsed/refractory FLT3-mutated acute myeloid leukemia treated
with gilteritinib who received prior midostaurin or sorafenib.
Blood Cancer J. 12:842022. View Article : Google Scholar : PubMed/NCBI
|
|
107
|
Ueno Y, Mori M, Kamiyama Y, Saito R,
Kaneko N, Isshiki E, Kuromitsu S and Takeuchi M: Evaluation of
gilteritinib in combination with chemotherapy in preclinical models
of FLT3-ITD+ acute myeloid leukemia. Oncotarget. 10:2530–2545.
2019. View Article : Google Scholar : PubMed/NCBI
|
|
108
|
Qiao X, Ma J, Knight T, Su Y, Edwards H,
Polin L, Li J, Kushner J, Dzinic SH, White K, et al: The
combination of CUDC-907 and gilteritinib shows promising in
vitro and in vivo antileukemic activity against FLT3-ITD
AML. Blood Cancer J. 11:1112021. View Article : Google Scholar : PubMed/NCBI
|
|
109
|
Qiu Y, Li Y, Chai M, Hua H, Wang R, Waxman
S and Jing Y: The GSK3β/Mcl-1 axis is regulated by both FLT3-ITD
and Axl and determines the apoptosis induction abilities of
FLT3-ITD inhibitors. Cell Death Discov. 9:442023. View Article : Google Scholar : PubMed/NCBI
|
|
110
|
Darici S, Jørgensen HG, Huang X, Serafin
V, Antolini L, Barozzi P, Luppi M, Forghieri F, Marmiroli S and
Zavatti M: Improved efficacy of quizartinib in combination therapy
with PI3K inhibition in primary FLT3-ITD AML cells. Adv Biol Regul.
89:1009742023. View Article : Google Scholar : PubMed/NCBI
|
|
111
|
Wang Y, Zhang L, Tang X, Luo J, Tu Z,
Jiang K, Ren X, Xu F, Chan S, Li Y, et al: GZD824 as a FLT3, FGFR1
and PDGFRα inhibitor against leukemia in vitro and in
vivo. Transl Oncol. 13:100766. 2020. View Article : Google Scholar
|
|
112
|
Zhu R, Li L, Nguyen B, Seo J, Min Wu M,
Seale T, Levis M, Duffield A, Hu Y and Small D: FLT3 tyrosine
kinase inhibitors synergize with BCL-2 inhibition to eliminate
FLT3/ITD acute leukemia cells through BIM activation. Signal
Transduct Target Ther. 6:1862021. View Article : Google Scholar : PubMed/NCBI
|