Introduction
Endometrial carcinoma (EC) is the sixth most
prevalent cancer among female patients worldwide and the second
most common gynecologic malignancy after cervical cancer with
notable morbidity (1). In 2022,
the estimated number of new cases of EC was 420,242, and the
estimated number of deaths was 97,704 (2), which is an upward trend compared with
2020. In 2020, there were estimated to be 417,367 new cases and
97,370 mortalities due to EC worldwide (3). The prevalence of EC has increased
with increasing rates of obesity among women globally, suggesting
that obesity is a risk factor for this disease (4,5).
Excess weight can be attributed to ~41% of cases of uterine cancer
(6). Women whose body mass indices
are in the normal range have a 3% risk of developing EC in their
lifetime. However, the risk of EC increases by >50% for every
5-unit increase in BMI in obese women (6). Prognosis and treatment options for
patients with EC are often determined by histological subtyping
(7). The recurrent and metastatic
nature of this type of cancer is the main reason for the reduced
survival rates of patients (7). As
a result, early detection, diagnosis and treatment of EC are
important for improving the prognosis of EC.
The development of several prognostic models has
improved clinical management by evaluating survival, exploring
pathogenesis and predicting drug sensitivity. Signatures have been
established based on immune-associated (8), methylation-driven (9), autophagy-associated (10) and glycolysis-associated (11) genes. Current research primarily
focuses on investigating the possible underlying pathogenesis of EC
and the improvement of innovative, cutting-edge treatments.
However, conventional treatments such as curative surgery,
chemotherapy and radiotherapy are also still being improved.
Recently, immune checkpoint inhibitor (ICI) therapy
has become a key element of EC treatment, since immune
dysregulation is likely to occur in EC (12). The microsatellite instability-high
(MSI-H) subtype accounted for ~30% of primary ECs. The proportion
of MSI-H or mismatch repair-deficient (dMMR) in recurrent ECs is
~13-30% (12–14). It is well known that immunotherapy
has more favorable results in patients with EC with MSI-H (15). Embrolizumab, which inhibits the
programmed cell death protein 1 (PD-1) receptor, was approved for
the treatment of MSI-H or dMMR solid tumors in 2017 by the United
States Food and Drug Administration, regardless of the type of
cancer (16,17). A recent clinical trial revealed
that 44% of patients presenting sporadic MSI-H with recurrent EC
responded to pembrolizumab (18).
ICIs are transforming EC treatment, with the potential for broader
efficacy through combination therapies and biomarker insights
(17). Therefore, it is becoming
clear that novel predictive biomarkers are needed to guide clinical
decision making.
Abnormal metabolism is a hallmark of cancer. Fatty
acid metabolism (FAM) contributes to carcinogenesis, progression of
numerous diseases, as well as treatment tolerance and resistance
through enhancement of anabolism and catabolism of lipids (19). The mechanism associated with the
reprogramming of lipid metabolism and cancer development has been
investigated. The involvement of enzymes in the pathways of fatty
acid production and catabolism (cholesterol and phospholipids) are
upregulated in ovarian cancer (20,21).
The abnormal metabolism of fatty acids has been implicated in the
development of hepatocellular carcinoma (22) and nasopharyngeal carcinoma
(23). Renal cell carcinomas and
hepatocellular carcinomas often exhibit deregulation of lipid
metabolism, including increased de novo biosynthesis and
breakdown of fatty acids, allowing cancer cells to proliferate and
invade the tissue (24).
The utilization of lipids by cancer cells is often
influenced by complex interactions between the tumor
microenvironment (TME) and the adjacent stroma. Obesity induced by
high-fat diet (HFD) reduces the number and impairs the function of
CD8+ T cells in the TME of mice, accelerating tumor
growth (25). As tumor
cell-stromal cell interactions intensify during tumor progression,
fatty acids secreted into the microenvironment can influence the
function and phenotype of infiltrating immune cells (26). FAM also contributes to therapy
resistance, including resistance to chemotherapy, radiation
therapy, and therapies targeting tumors with complex and diverse
mechanisms (19). In response to
oxidative stress induced by numerous chemotherapeutic agents, toxic
lipid peroxidation can trigger apoptosis and ferroptosis (27,28).
Accordingly, FAM-associated genes may serve as novel potential
therapeutic targets for numerous types of cancer. To the best of
our knowledge, how abnormal fatty acid programming in EC affects
tumor and immune cells or how it affects prognosis is currently
unknown.
In the present study, a total of 518 tumor samples
and 23 normal samples from The Cancer Genome Atlas (TCGA) were
divided into high- and low-immune groups based on the immune scores
calculated by the single-sample gene set enrichment analysis
(ssGSEA) algorithm, and the prognosis-associated FAM differential
genes between the two groups were screened to construct a
prognostic gene signature. The tumor samples were then divided into
high- and low-risk groups based on the FAM-gene signature. A
nomogram was established to predict survival, and the relationship
between the nomogram and TME were further explored. In summary, the
present study is intended to demonstrate the effect of
FAM-associated genes in the development of EC and the influence on
prognosis.
Materials and methods
Research data collection
Expression profiles, RNA sequencing data, mutation
information and clinical features of samples were downloaded from
the open TCGA database (https://portal.gdc.cancer.gov/). Samples with
incomplete data were excluded. Furthermore, samples with survival
times <20 days or >8 years were removed from the present
study since their survival results were not relevant to EC. For
survival time <20 days, the death was considered to be
associated with postoperative complications; for survival time
>8 years, the present study considered the cause of death to be
unrelated to EC as patients with EC with a survival of ≥5 years are
defined clinically cured. Thus, 518 EC samples and 23 normal
samples were enrolled for further study. Copy number variation
(CNV) data was acquired from the UCSC Xena database (http://xena.ucsc.edu/). The MSI data of the samples
was downloaded from the Cancer Imaging Archive database (https://tcia.at/home).
Acquisition of FAM-associated
genes
FAM-associated genes were obtained from two online
gene sets and one published gene set. The
HALLMARK_FATTY_ACID_METABOLISM gene set, consisting of 158 genes,
was downloaded from the Molecular Signatures Database (http://www.gsea-msigdb.org/gsea/msigdb/index.jsp).
Using ‘fatty acid metabolism’ as the keyword, a total of 543 genes
with relevance scores >20 were downloaded from GeneCards
(https://www.genecards.org/). A total of
92 FAM-associated genes were obtained from a previous study
(29), which introduced
metabolism-associated signatures based on fatty acid degradation,
elongation and biosynthesis. The feasibility of this genetic source
has been established (30). A
total of 669 genes were obtained after excluding duplicate genes
(Table SI).
Immunocorrelation analysis
The ssGSEA algorithm was used to evaluate the immune
cell content and immune function of each sample. Based on the
evaluation results, the samples were classified into high- and
low-immune groups using the R package ‘limma’ (version 3.26.9) with
a false discovery rate (FDR) >0.05 and fold change >2. The
CIBERSORT algorithm was used to quantify 22 types of
tumor-infiltrating immune cells in high- and low-immune samples
using the R package ‘CIBERSORT’ (version 1.04) as previously
described (31). Microenvironment
Cell Populations-Counter (MCPcounter) analysis is a robust
quantification method (32), which
is based on the R packages ‘MCPcounter’ and ‘limma’. CIBERSORT,
MCPcounter and ssGSEA were used to compare the differences in
immune cell types and immune-associated functions between the EC
and normal samples. The intersection of the three algorithms was
considered more reliable, strengthening the confidence in the
evidence. The R packages ‘limma’ (version 3.26.9) and ‘ggpubr’
(version 0.6.0) were used to visualize the differential results.
The immune cell estimation of each EC sample was also downloaded
from Tumor Immune Estimation Resource (TIMER; version 2.0,
http://cistrome.shinyapps.io/timer/).
Construction and validation of the
signature
The common genes between the union of FAM-associated
genes and differential genes of the two immune groups were defined
as differentially expressed genes (DEGs). A total of 50 genes were
identified. The association between prognosis and these 50 genes
was analyzed by univariate Cox regression analysis. A total of 22
genes with prognostic values were obtained. Least absolute
shrinkage and selection operator (LASSO) Cox regression analysis of
prognosis-associated genes was conducted using the R package
‘glmnet’ (version 4.1–8). The risk score for each sample is the sum
of the multiplication of the expression values of genes and
correlation coefficients, which can be further explained as
follows:
Where Expk indicates the expression level of genes
and Coefk denotes the risk coefficient of genes. The R package
‘survival’ (version 3.7.0) was used for Kaplan-Meier survival
analysis, and univariate and multivariate Cox regression analyses
were conducted. Additionally, to determine the accuracy and
reliability of the risk assessment model, the R package ‘timeROC’
(version 0.4) was used to plot the receiver operating
characteristic (ROC) curve and calculate the area under the curve
(AUC). The R packages ‘timeROC’ (version 0.4) and ‘rms’ (version
6.9–0) were used to develop a predictive model that merged gene
expression values and clinical features. The R package ‘ggDCA’
(version 1.2) was used for the decision curve analysis to evaluate
the predictive ability of the nomogram.
Dimensionality reduction methods
The R package ‘scatterplot3d’ (version 0.3–44) was
used to conduct principal component analysis (PCA) to improve data
visibility. ‘Rtsne’ R package (version 0.17) was employed to
conducted t-distributed stochastic neighbor embedding dimension
reduction (t-SNE).
Functional enrichment analysis
Kyoto Encyclopedia of Genes and Genomes (KEGG) and
Gene Ontology (GO) enrichment analyses were conducted using the R
package ‘clusterProfiler’ (version 4.14.4) for the differential
genes between the high- and low-immune groups and differential
genes between high- and low-risk groups. The R package ‘GSVA’
(version 2.0.2) was used for enrichment analysis of biological
functions. The enrichment analysis results were visualized using
the R packages ‘enrichplot’ (version 1.13.1.994) and ‘ggplot2’
(version 0.6.0). Statistical significance was defined as an FDR
<0.05.
Immunohistochemical (IHC)
staining
Human EC tumor samples and normal endometrium
tissues were obtained from female patients aged 25–70 who were
treated surgically from 2022 to 2023 at the Department of
Obstetrics and Gynecology, Qilu Hospital of Shandong University
(Jinan, China). The patients diagnosed with EC were the
experimental group and patients who did not have EC or a
endometrial precancerous lesion but received hysterectomy for other
reasons were set as the normal controls. All methods were conducted
in accordance with the relevant guidelines and regulations and the
experiment was approved by the Ethics Committee of Qilu Hospital of
Shandong University (Jinan, China). Clinical specimens were fixed
in 4% paraformaldehyde for 12 h at room temperature, then embedded
in paraffin. The specimens were cut into 4-µm paraffin sections,
dewaxed with xylene, hydrated with a descending alcohol series, and
endogenous peroxidase activity was blocked according to the
instruction (ZSGB-BIO; cat. no. PV-9000). Subsequently, antigen
retrieval was carried at 95°C using pH 6.0 sodium citrate and
non-specific binding sites were blocked with goat serum (Beyotime
Institute of Biotechnology; cat. no. C0265) for 30 min at room
temperature. The samples were then washed with PBS. Rabbit
anti-PPARG coactivator 1α antibody (cat. no. A20995; ABclonal
Biotech Co., Ltd.) was administered to the slides at a 1:2,000
dilution and slides were incubated at 4°C overnight. The samples
were then incubated with horseradish peroxidase-labeled secondary
antibody, according to the instructions of the kit (Mouse/Rabbit
Polymer Detection System; ZSGB-BIO; cat. no. PV-9000), at room
temperature for 30 min, and treated with diaminobenzidine for 1
min, followed by hematoxylin staining for 5 min at 37°C. Finally,
images were captured with an Olympus light microscope (IX71;
Olympus Corporation). The IHC images were analyzed using Image-Pro
Plus 6.0 (Media Cybernetics, Inc.) to determine the average optical
density (AOD), which can be expressed as AOD=integrated optical
density/area.
Statistical analysis
Bioinformatic analyses were conducted using R
(https://www.r-project.org/; version
4.4.2) and the RStudio (https://posit.co/products/open-source/rstudio/;
version 2023.06.2+561.pro5) software. χ2 test was used
to analyze differences in clinical information. Kaplan-Meier
analysis and the weight of ‘aalen’ calculated by the R package
‘timeROC’ (version 0.4) were used to conduct survival analyses and
draw the ROC curves. Log-rank test was used to calculate the
P-value in the survival analysis. The ‘cph’ function from the ‘rms’
package (version 6.9–0) was used for survival calibration in risk
model. Analysis of paired data was performed using the paired
t-test. Analysis of group data was performed using the Wilcoxon
rank sum test and Kruskal-Wallis test (non-parametric) using the
‘stat_compare_means’ algorithm in the ‘ggpubr’ R package (version
0.6.0). An unpaired Student's t-test was conducted for the
statistical analysis of the IHC staining. Linear regression and
Spearman's rank correlation analysis was performed. All statistical
P-values were two-sided, and P<0.05 was considered to indicate a
statistically significant difference. The waterfall function of the
R package ‘maftools’ (version 3.20) was used to compare the TMB in
high- and low-risk groups. Heat maps were created using the R
package ‘ComplexHeatmap’ (version 2.22.0).
Results
Immune cluster according to
ssGSEA
The immune cell content in each EC sample was
calculated using the ssGSEA algorithm. Using this evaluation,
samples were clustered into high- and low-immune groups (Fig. 1A). t-SNE further indicated that the
clustering was effective and the difference between groups was
notable (Fig. 1B). The TME score
of each sample and the content of immune cells computed by ssGSEA
in the high- and low-immune groups are displayed in Fig. 1C. The analysis indicated that
low-immune groups contained lower immune cell infiltration and
response, resulting in lower immune scores in the TME. There was
also a lower stromal score in the low-immune group, which led to a
lower ESTIMATE score since this is the sum of the immune and
stromal scores. Therefore, the low-immune group had a higher tumor
purity. The opposite was true in the high-immune group. For the
estimated TME score, quantitative analysis demonstrated the
difference in TME between the high- and low-immune groups in
immune, stromal and ESTIMATE scores (P<0.001; Fig. 1D).
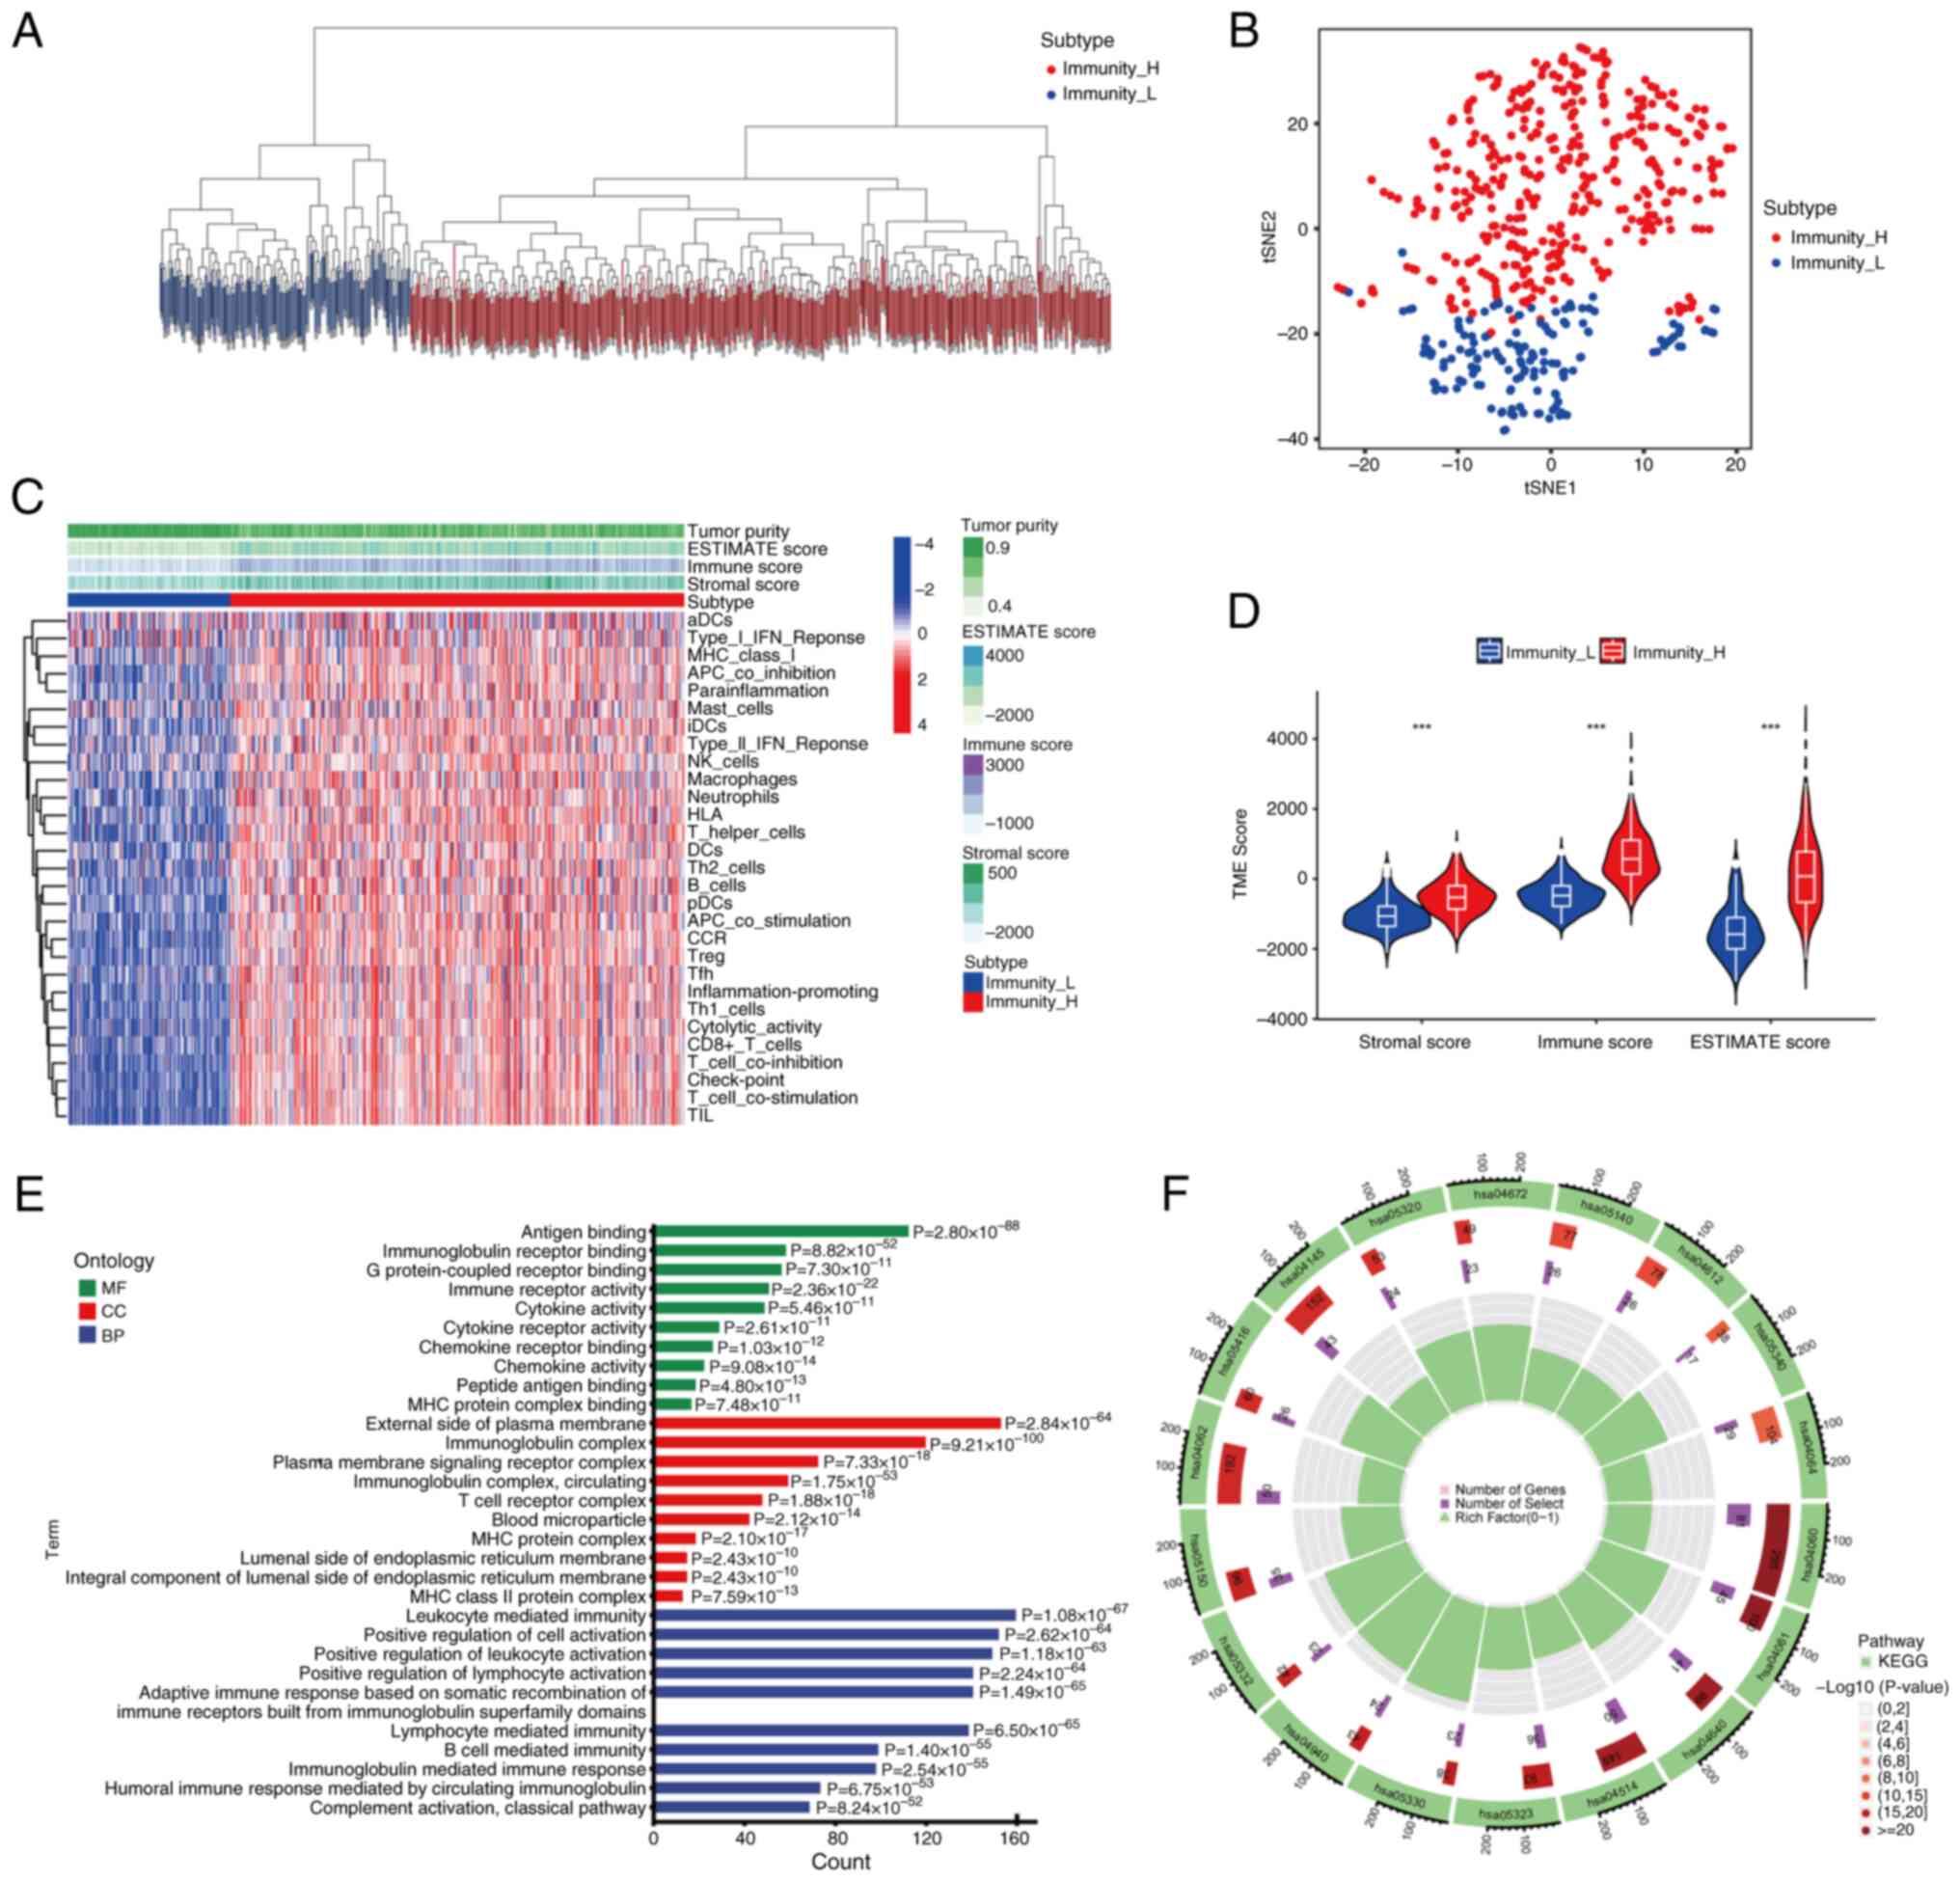 | Figure 1.Immune subgroups of samples and their
characteristics in the TME. (A) Endometrial carcinoma samples were
divided into high- and low-immune groups based on the immune
content calculated by single-sample gene set enrichment analysis.
(B) tSNE verified the efficiency of grouping indicated by the
clustering of the dots in both groups. (C) TME analysis and the
immune cell content of each sample arranged by grouping. (D) A
violin plot was used to quantify the TME difference between groups.
***P<0.001 (E) Gene Ontology enrichment analysis of the DEGs for
MF, CC and BP terms. (F) KEGG enrichment analysis of differentially
expressed genes. hsa04672, ‘Intestinal immune network for IgA
production’; hsa05140, ‘Leishmaniasis’; hsa04612, ‘Antigen
processing and presentation’; hsa05340, ‘Primary immunodeficiency’;
hsa04064, ‘NF-kappa B signaling pathway’; hsa04060,
‘Cytokine-cytokine receptor interaction’; hsa04061, ‘Viral protein
interaction with cytokine and receptor’; hsa04640, ‘Hematopoietic
cell lineage’; hsa04514, ‘Cell adhesion molecules’; hsa05323,
‘Rheumatoid arthritis’; hsa05330, ‘allograft rejection’; hsa04940,
‘Type I diabetes mellitus’; hsa05332, ‘Graft-vs.-host disease’;
hsa05150, ‘Staphylococcus aureus infection’; hsa04062, ‘Chemokine
signaling pathway’; hsa05416, ‘Viral myocarditis’; hsa04145,
‘Phagosome’; hsa05320, ‘Autoimmune thyroid disease’; tSNE,
T-distributed stochastic neighbor embedding; TME, tumor
microenvironment; MF, molecular function; CC, cellular component;
BP, biological process; Immunity_H, high-immune group; Immunity_L,
low-immune group; ESTIMATE, estimation of stromal and immune cells
in malignant tumor tissues using expression data; KEGG, Kyoto
Encyclopedia of Genes and Genomes. |
Enrichment analysis between groups revealed that the
enriched GO molecular function terms were associated with receptor
binding. The enriched GO cellular component terms were associated
with the plasma membrane, and the enriched biological process terms
were associated with ‘positive regulation of cell activation’ and
immunity (Fig. 1E). KEGG
enrichment analysis of DEGs was also conducted, and
‘cytokine-cytokine receptor interaction’ and ‘cell adhesion
molecules’ were detected (Fig.
1F).
Construction and validation of the
prognostic signature
Between the high- and low-immune groups, 2,609 DEGs
were identified (Fig. 2A). A total
of 669 FAM-associated genes were obtained after deleting duplicate
genes from the two online gene sets and one published gene set.
Differentially expressed FAM-associated genes were obtained by
intersecting the total FAM-associated genes and DEGs from the
aforementioned immune cluster, leaving 50 genes (Fig. 2B). Based on Cox regression
analysis, 22 prognostic genes were selected (Fig. 2C). Tumor samples from TCGA were
randomly divided into training and test cohorts, with an equal
number of samples in both groups. Subsequently, clinical
manifestation analysis was conducted for patients with clinical
manifestations in the two cohorts. Any patients in the unknown
group were not analyzed. The analysis revealed that there was no
difference in clinical manifestations between the two cohorts
(Table I). After LASSO analysis,
three genes with the best λ value were chosen to construct the
optimum signature (Fig. 2D and E).
The risk score of each sample was calculated according to the
following formula: Risk score=(expression level of PPARGC1A ×
0.653085171388467) + (expression level of RBP4 × 0.323298560719871)
+ (expression level of CRABP2 × 0.647075550554985).
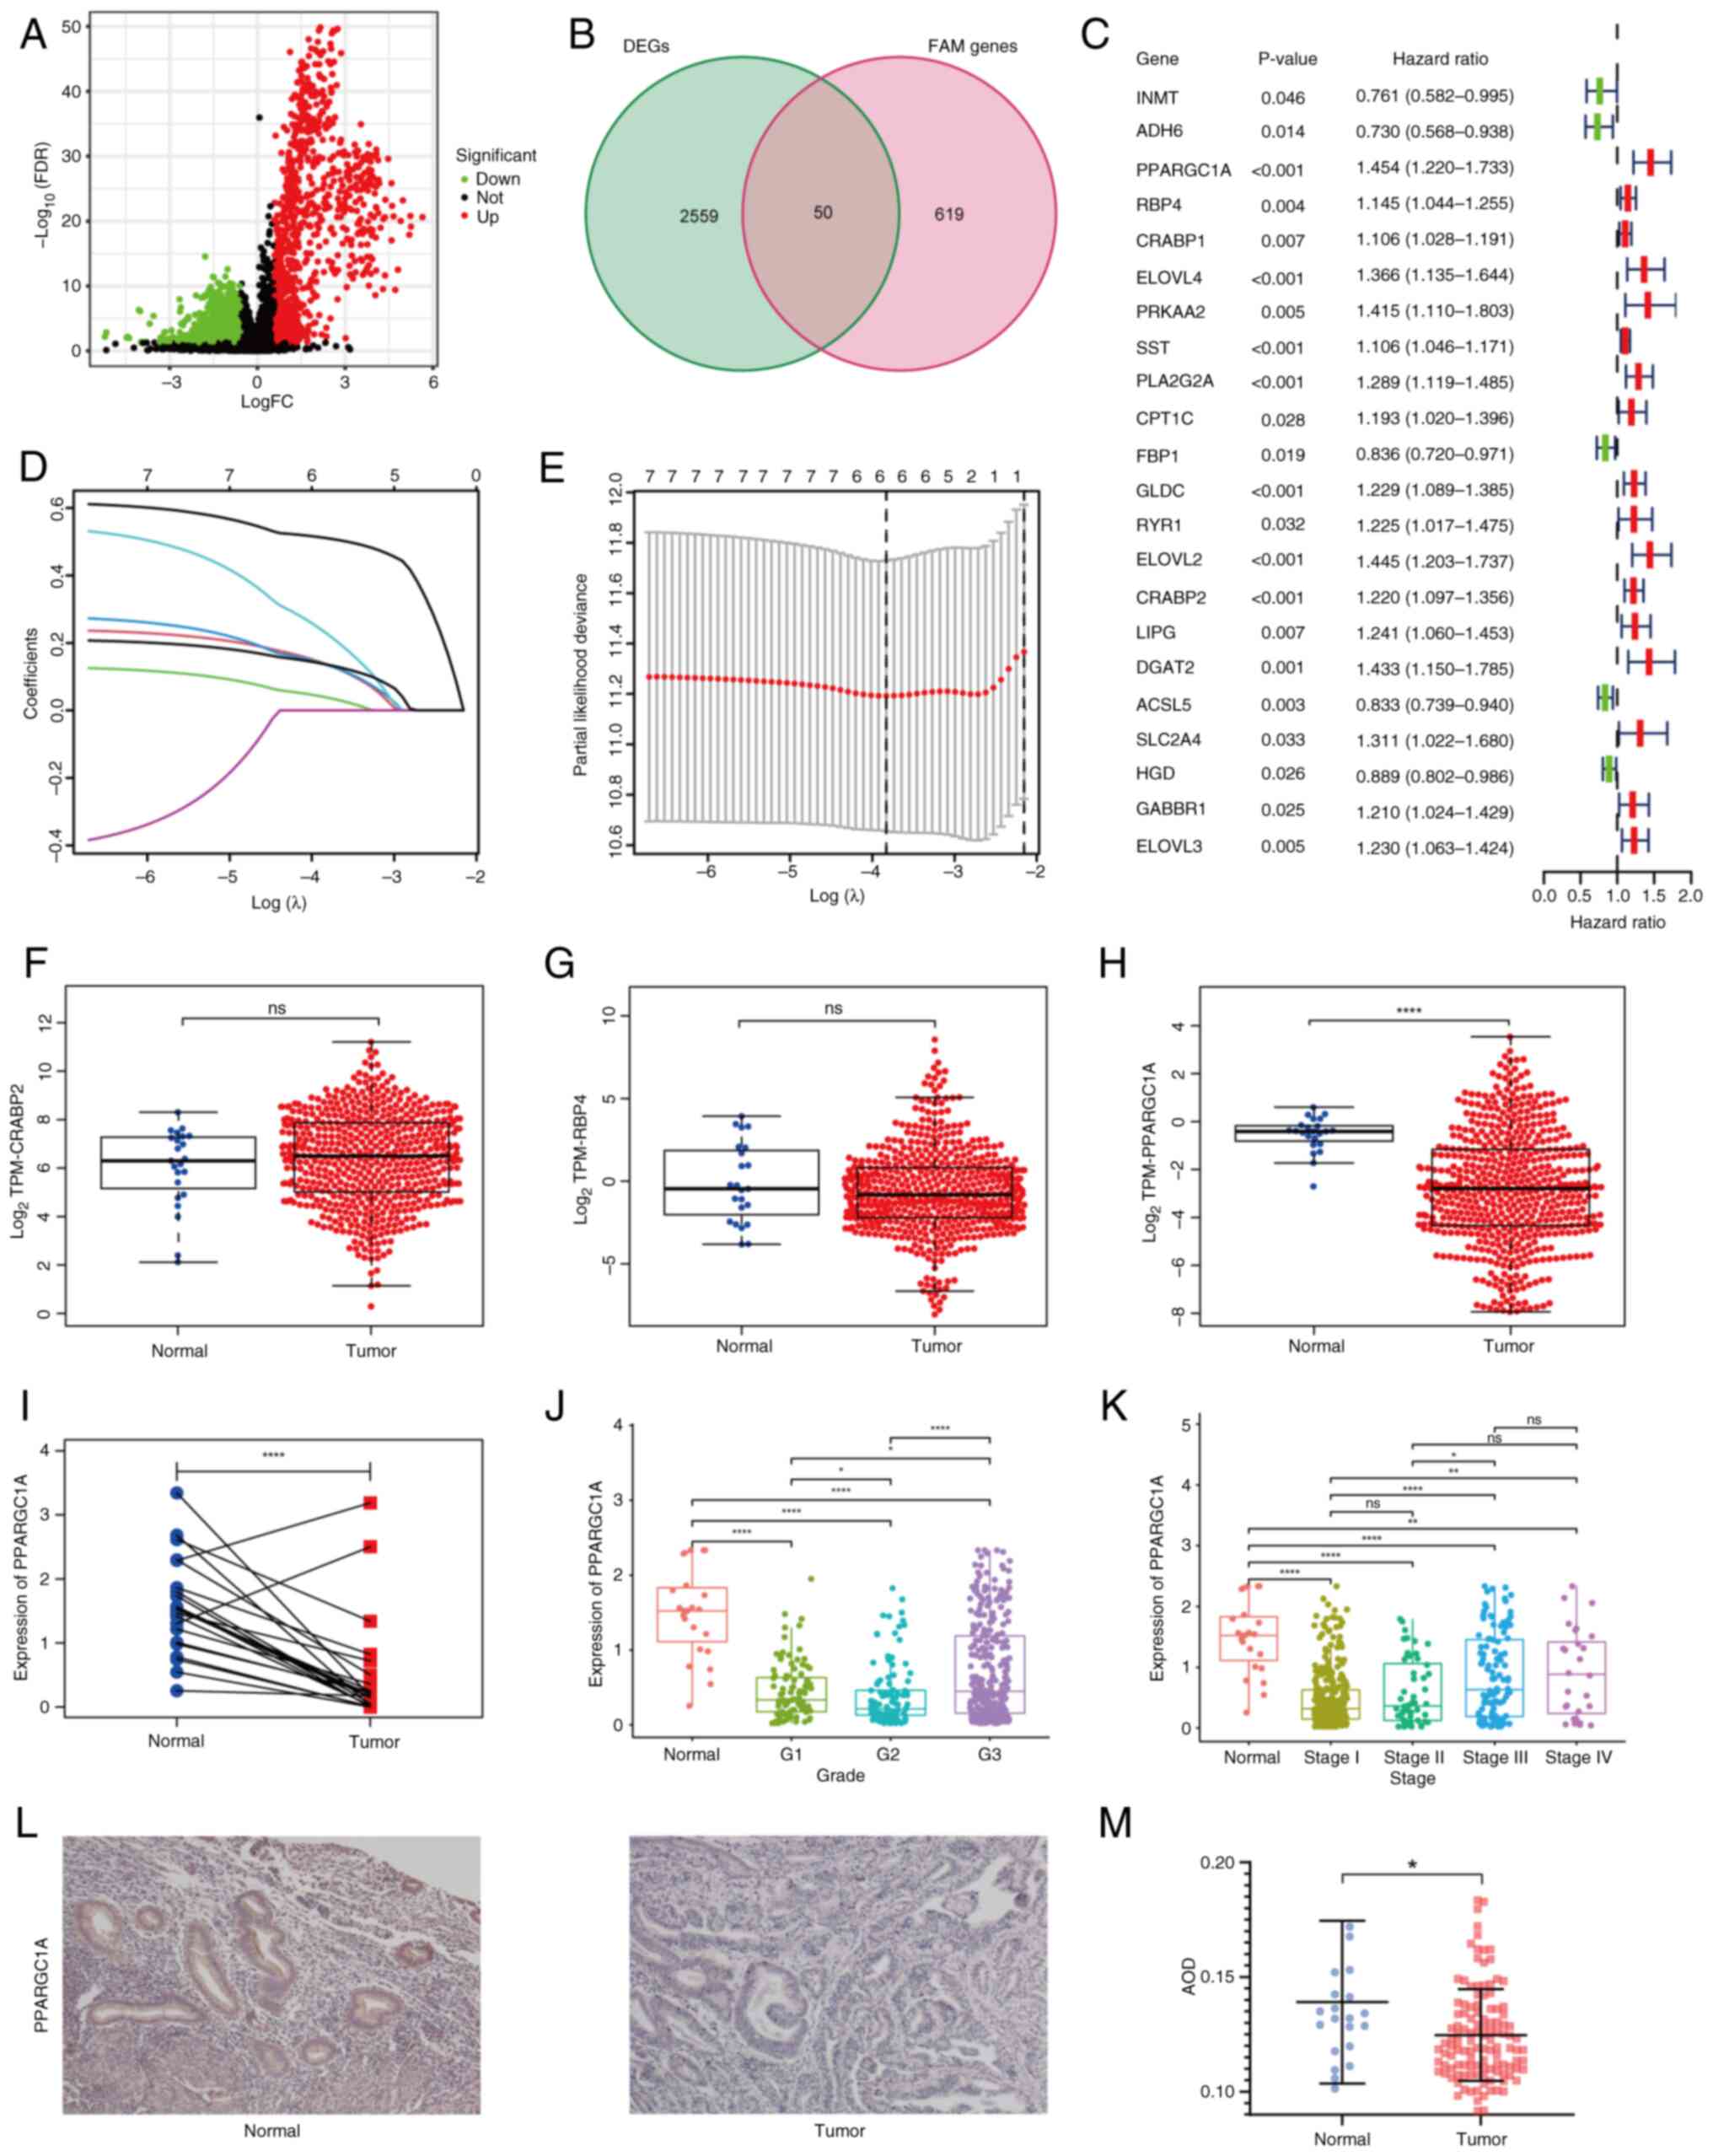 | Figure 2.Construction of the prognostic
signature. (A) A volcano plot of DEGs between high- and low-immune
groups. (B) A Venn diagram of the overlap between DEGs and
FAM-associated genes. (C) Prognostic differential FAM-associated
genes determined by Cox analysis. (D) LASSO coefficient of
differentially expressed FAM-associated genes. (E) Relationship of
partial likelihood deviance and log (λ). Expression levels of the
signature genes (F) CRABP2, (G) RBP4 and (H)
PPARGC1A in The Cancer Genome Atlas datasets. (I)
PPARGC1A expression of paired samples. Relationship of
PPARGC1A expression and clinical features, including (J)
grade and (K) stage. (L) Immunohistochemical staining of
PPARGC1A in normal and endometrial carcinoma tissue
(magnification, ×100). (M) AOD score of PPARGC1A.
*P<0.05; **P<0.01; ****P<0.001; DEGs, differentially
expressed genes; FAM, fatty acid metabolism; LASSO, least absolute
shrinkage and selection operator; AOD, average optical density;
FDR, false discovery rate; FC, fold change; TPM, transcripts per
million; ns, not significant. |
 | Table I.Comparison of the clinical
manifestations between the training and test cohorts. |
Table I.
Comparison of the clinical
manifestations between the training and test cohorts.
| Clinical
features | Test, n (%) | Training, n
(%) | P-value |
|---|
| Age, years |
|
|
|
|
≤60 | 98 (37.84) | 102 (24.88) | 0.7863 |
|
>60 | 161 (62.16) | 157 (75.12) |
|
| Grade |
|
|
|
| 1 | 52 (20.08) | 44 (16.99) | 0.3752 |
| 2 | 52 (20.08) | 64 (24.71) |
|
| 3 | 155 (59.85) | 151 (58.30) |
|
| FIGO stage |
|
|
|
| I | 165 (63.71) | 157 (60.62) | 0.4354 |
| II | 29 (11.20) | 23 (8.88) |
|
|
III | 54 (20.85) | 62 (23.94) |
|
| IV | 11 (4.25) | 17 (6.56) |
|
A series of analyses on the constructor genes,
CRABP2, RBP4 and PPARGC1A, were conducted. According
to TCGA, CRABP2 had lower expression levels and RBP4
had higher expression levels in normal samples, but the P-value did
not reach significance (Fig. 2F and
G). PPARGC1A had significantly higher expression levels
in normal tissue compared with tumor tissue (Fig. 2H). The mRNA expression levels of
PPARGC1A were found to be significantly reduced in both
carcinoma and adjacent tissue within the same patient (Fig. 2I). The difference in expression
levels of PPARGC1A among different grades of EC is displayed
in Fig. 2J, and the difference in
expression levels of PPARGC1A among different stages of EC
is shown in Fig. 2K. Clinical
samples were used to confirm the difference in expression levels of
PPARGC1A between EC and normal tissue. IHC analysis of 103
EC and 17 endometrium samples revealed higher PPARGC1A levels in
normal samples (unpaired Student's t-test; Fig. 2L and M). Together, these results
suggested that PPARGC1A may be an indicator of EC.
Based on the median risk score of 0.93, samples were
divided into high-risk and low-risk groups in the training cohort.
A significant difference was shown between risk groups in terms of
overall survival (OS) and progression-free survival; the low-risk
group had an increased survival rate (Fig. 3A and B). The risk curve suggested
that as the risk increased, the number of mortalities increased
(Fig. 3C). A significant but weak
correlation was found between the OS and the risk score based on
correlation analysis (Fig. 3D).
The time-dependent ROC curve of the prognostic signature in the
training cohort indicated a reliable prediction of prognosis in
terms of 1-, 3- and 5-year survival (Fig. 3E). An evaluation of the calibration
curve also confirmed the effectiveness of the signature (Fig. 3F). The test cohort and the whole
tumor samples were split into high- and low-risk groups based on
the same cut-off value as the training cohort. The same analysis
was applied in the test cohort (Fig.
S1A-F) and all samples (Fig.
S2A-F), and the results were consistent with the aforementioned
results.
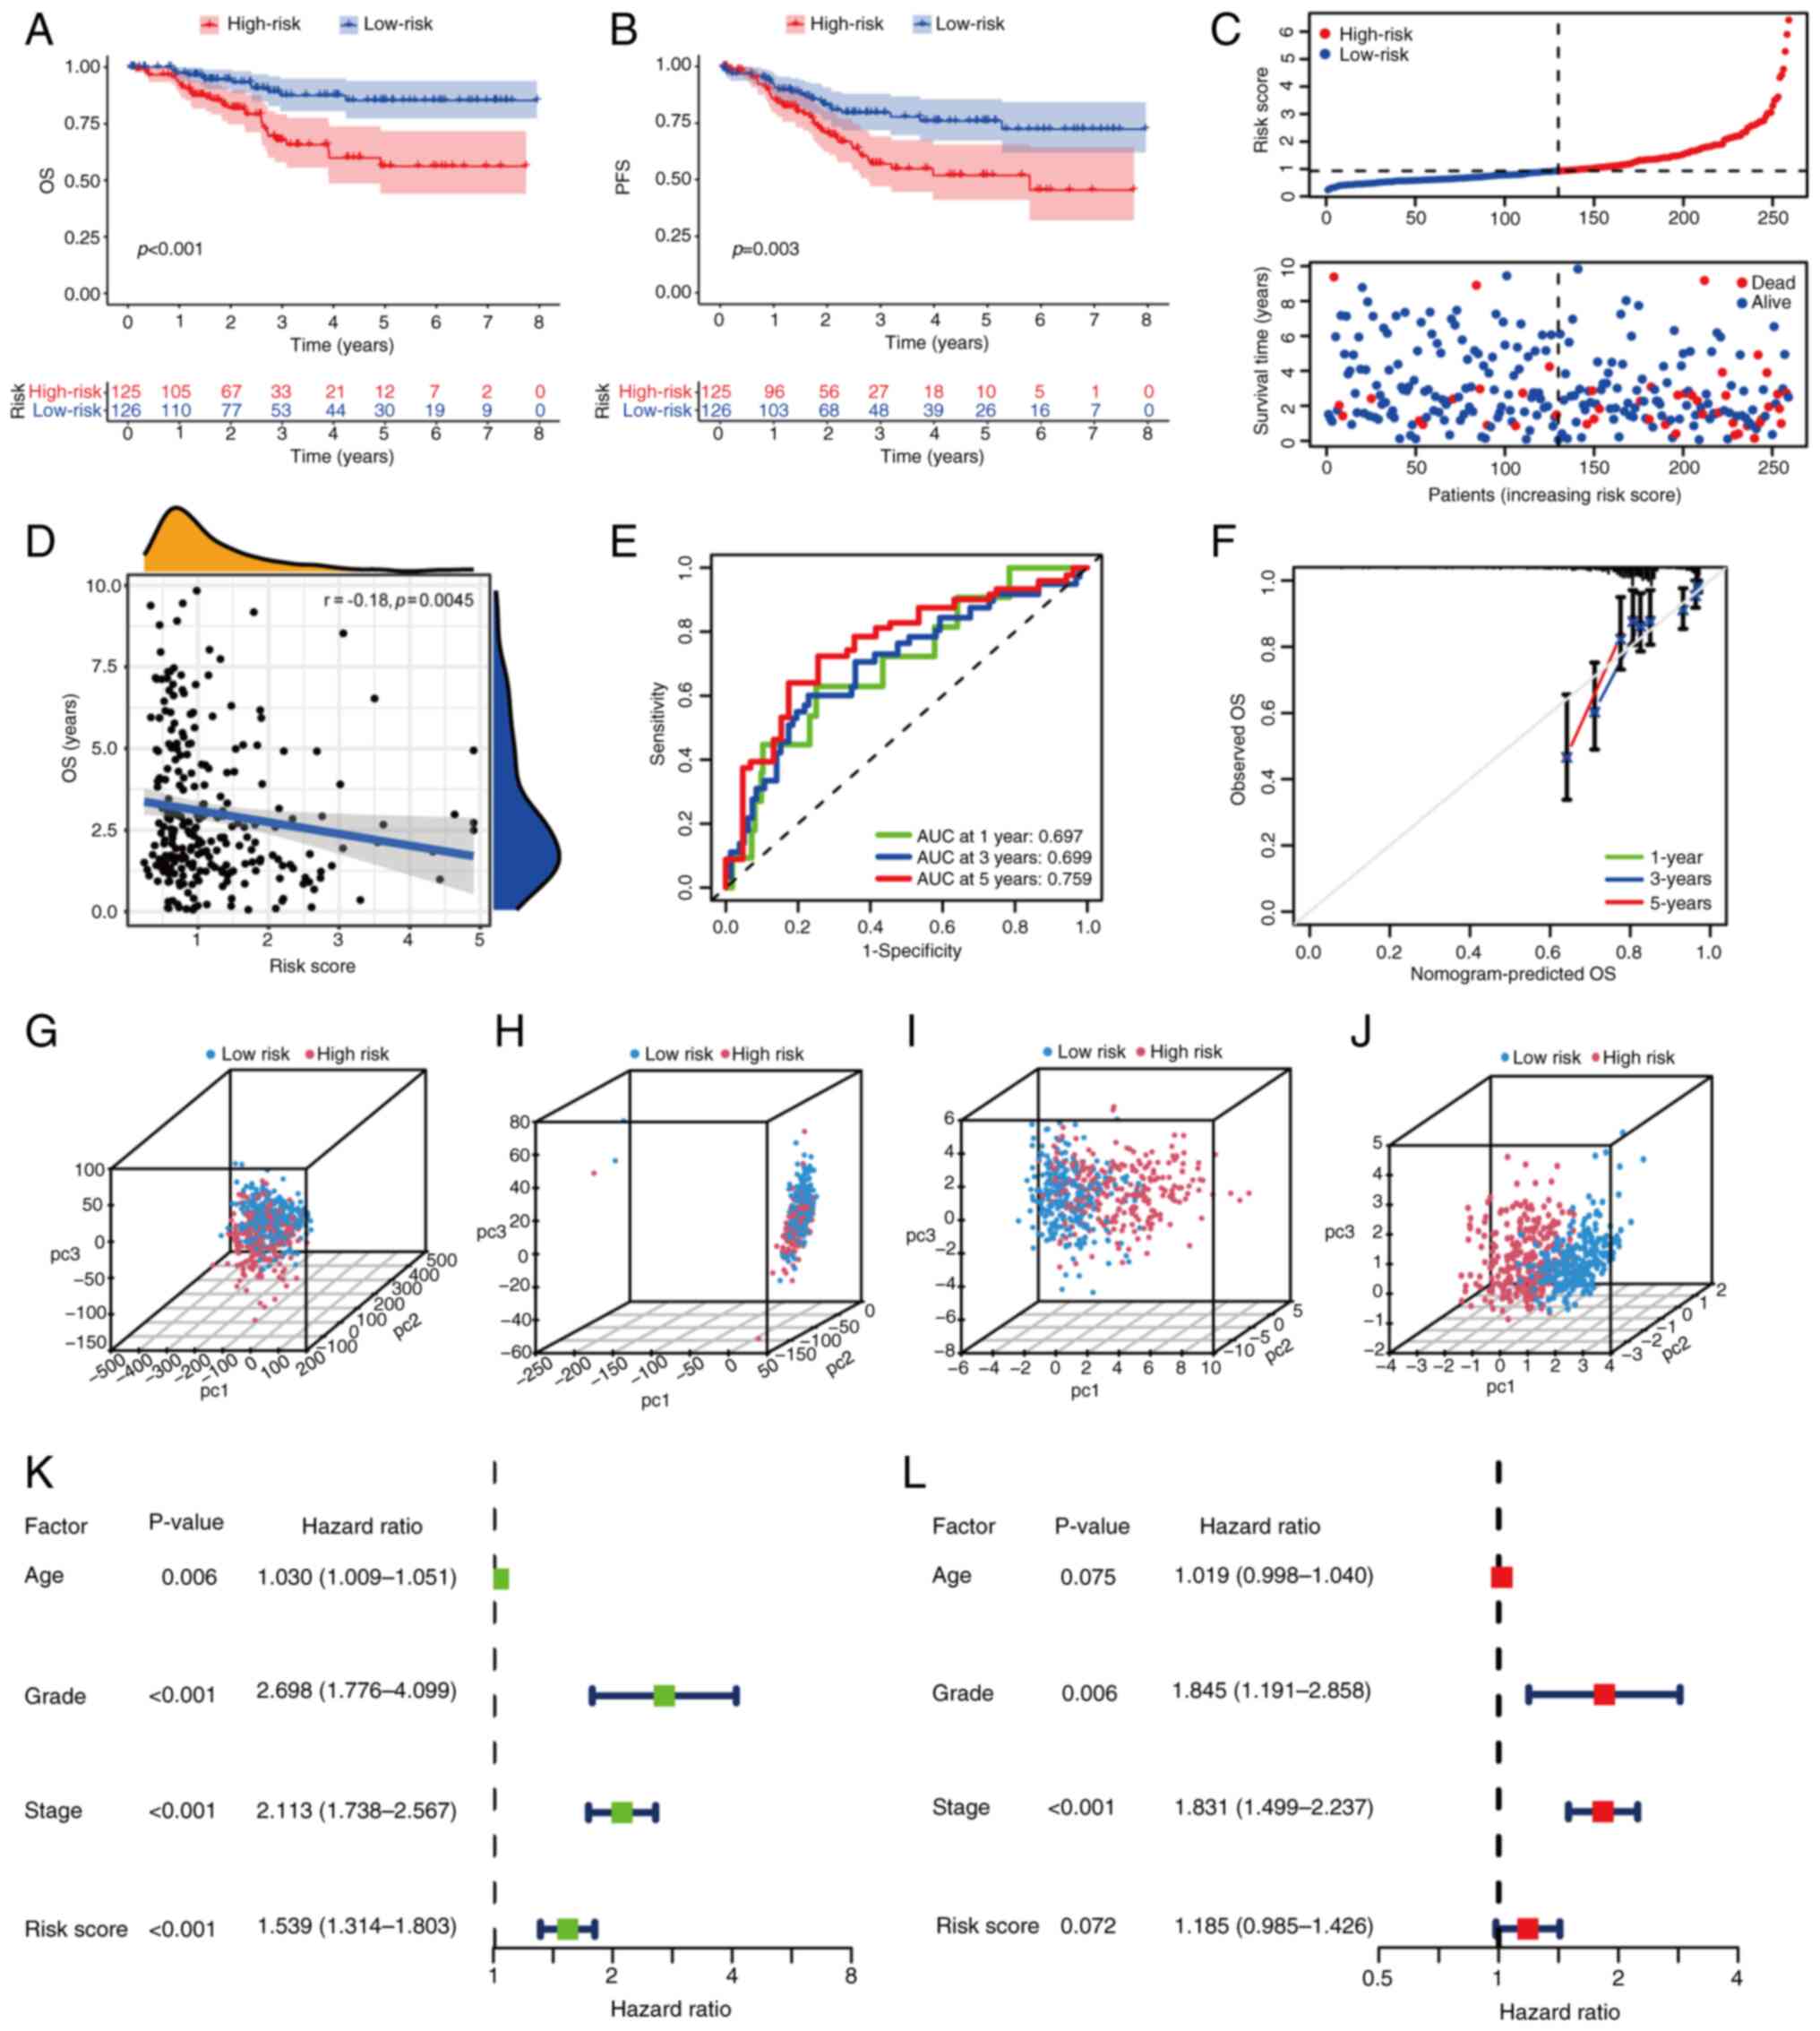 | Figure 3.Clinical characteristics and
prognosis analysis of the training group. (A) OS and (B) PFS
comparison between high- and low-risk score groups in the training
cohort. (C) Risk score distribution in high- and low-risk groups.
(D) Correlation analysis of OS and risk score. (E) Receiver
operating characteristic curve of the signature at 1, 3 and 5 years
in the training group. The AUC indicates the accuracy of
prediction. (F) Calibration curve of the prediction at 1, 3 and 5
years in the training group. PCA of all patients with EC for (G)
all genes, (H) all 2,609 differentially expressed genes and (I) all
669 FAM-associated genes. (J) PCA of all patients with EC in the
gene signature. (K) Univariate and (L) multivariate analyses of
common clinical characteristics and risk scores. OS, overall
survival; PFS, progression-free survival; AUC, area under the
curve; PCA, principle component analysis; EC, endometrial
carcinoma; pc, principal component; FAM, fatty acid metabolism. |
Disruption of FAM can also lead to changes in body
weight (6). Therefore, the BMI of
each sample in the high- and low-risk groups was investigated.
There was no significant difference between the high- and low-risk
groups of the training cohort (data not shown); however, a
significant difference was observed in the test cohort (Fig. S1G) and all samples (Fig. S2G), indicating that patients in
the low-risk group had a higher BMI score. The relationship between
abnormal FAM and BMI and EC needs to be further verified.
PCA was conducted on all EC samples. Compared with
other classification methods (Fig.
3G-I), the gene signature established displayed differences
between groups as the distribution of dots were separated (Fig. 3J), confirming that grouping and
demarcation points of the risk score had been selected effectively.
Based on univariate logistic analysis, the signature was associated
with a poor prognosis (Fig. 3K).
According to multivariate logistic analysis, grade and
International Federation of Gynecology and Obstetrics (FIGO) stage
were independent prognostic factors, while the signature did not
have statistical validity (Fig.
3L). Thus, the evidence was insufficient to indicate that the
signature was an independent prognostic factor.
Enrichment analysis
Gene set variation analysis (GSVA) of GO and KEGG
terms was conducted in high- and low-risk groups. GSVA of GO terms
between groups was mainly associated with dendritic regulation and
metabolic processes (Fig. S3A;
Table SII). The top three
pathways of GSVA enrichment on KEGG between groups were ‘fatty acid
metabolism’, ‘alpha linolenic acid metabolism’ and ‘maturity onset
diabetes of the young’ (Fig. S3B;
Table SIII). All enrichment
analyses indicated that metabolism and diabetes mellitus were
closely associated with EC groups, suggesting that these factors
may have an impact on EC progression.
Immunoinfiltration and immune function
analysis
An immune-associated analysis was conducted to
determine whether high- and low-risk groups had different immune
compositions. The MCPcounter method was used to assess the immune
cell contents of each group. The levels of three types of immune
cells were found to be statistically different between the two
groups. Levels of B lineage cells and cytotoxic lymphocytes were
higher in the low-risk group, while the level of T cells was higher
in the high-risk group (Fig.
S3C-E). The immune cell estimation of each EC sample was
downloaded from TIMER version 2.0 (https://cistrome.shinyapps.io/timer/) (33). The results indicated that B cells,
CD4 T cells, CD8 T cells, dendritic cells and macrophages were
weakly negatively associated with the risk score, and a significant
difference was observed (Fig.
S3F-J). CIBERSORT was then used to analyze the differences in
immune cell infiltration between high- and low-risk groups. The
levels of six immune cell types were different between the groups.
The levels of five cell types, including resting dendritic cells,
were higher in the low-risk group and the level of activated
dendritic cells was higher in the high-risk group (Fig. S3K). The immune cell infiltration
of each sample in the high- and low-risk groups is displayed in
Fig. S3L. Furthermore, ssGSEA was
conducted to compare immune cell types between high- and low-risk
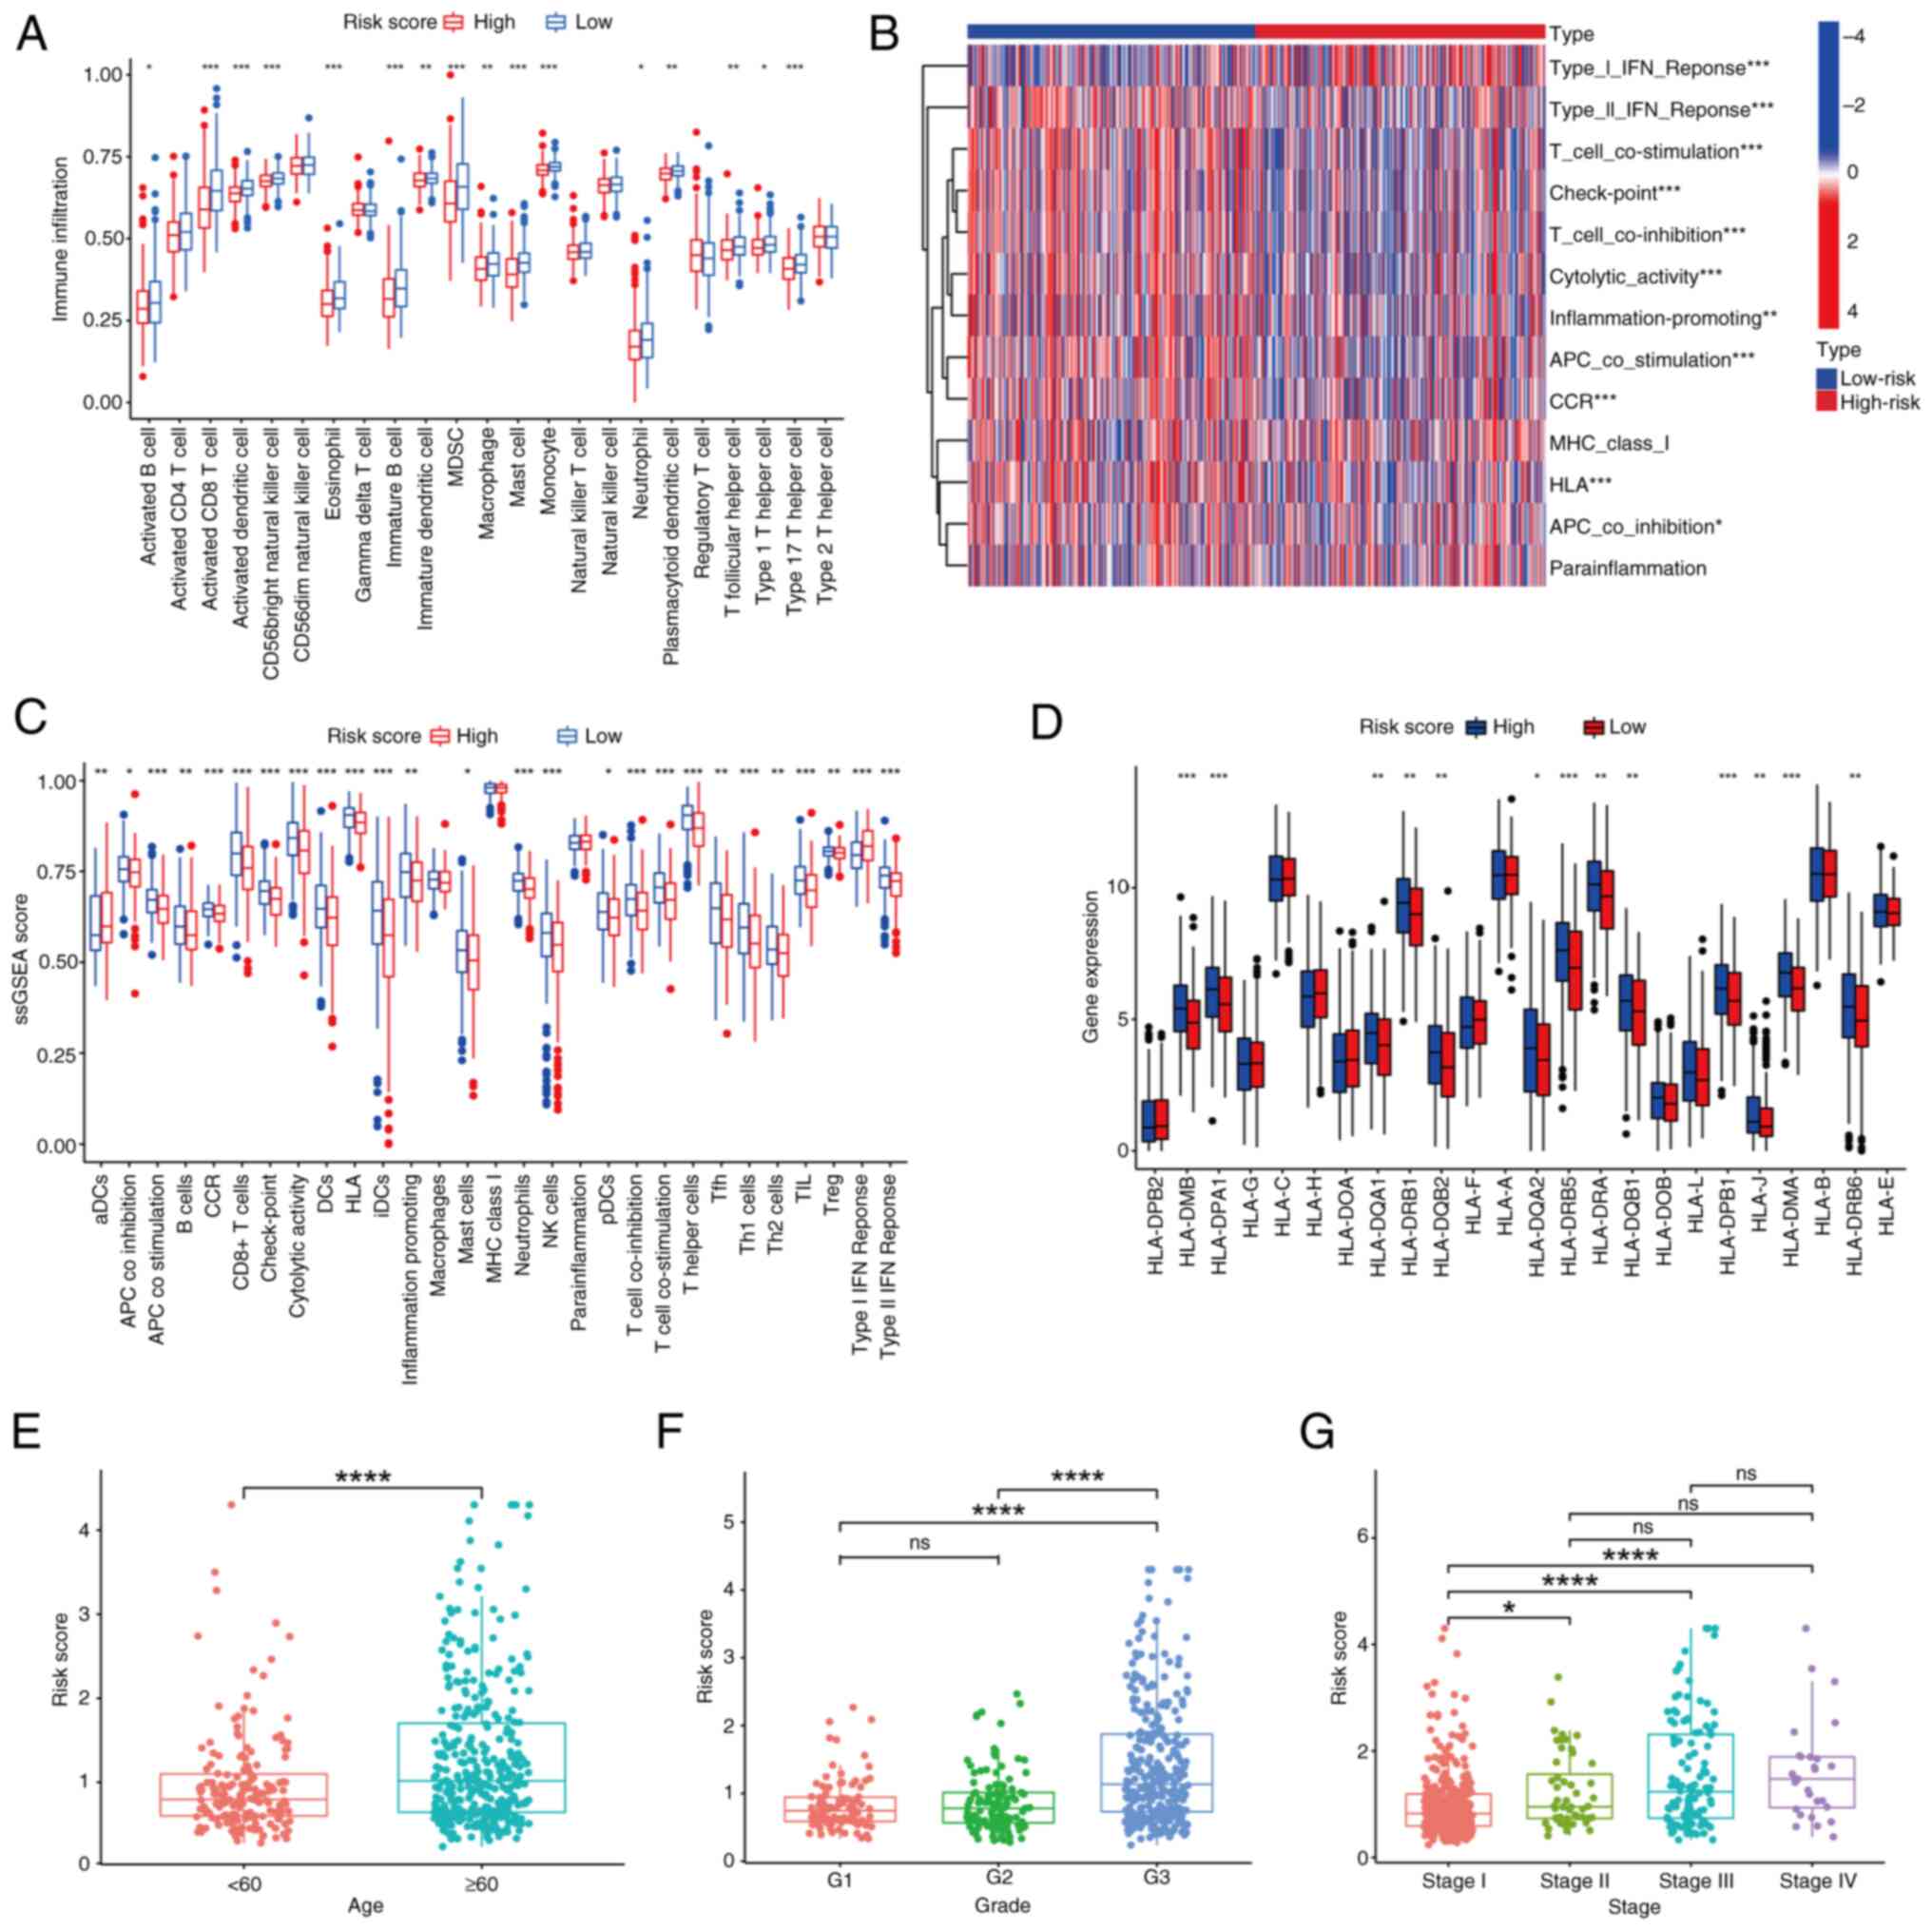
groups (Fig. 4A). A total of 16
immune cell types were found to be significantly different between
the low-risk and high-risk groups, with increased clustering in the
low-risk group. The results of immune infiltration analysis
assessed by four independent algorithms are summarized in Table SIV. The majority of the
correlations were negative, which indicated that immune cells were
gathered in low-risk groups. T cells counted using MCPcounter and
dendritic cells assessed by CIBERSORT exhibited positive
correlations. The positive correlation of activated dendritic cells
was consistent with the negative correlation of resting dendritic
cells. However, the positive correlation of T cells calculated by
MCPcounter was contradictory to the finding that all types of T
cells exhibited a negative correlation according to the four
algorithms and this warrants further investigation.
In addition to immune cells, the association between
immune-associated functions and the risk score was also examined.
Based on the ssGSEA algorithm, each sample was scored for
immune-associated functions, and the scores of samples were
displayed based on the high- and low-risk groups (Fig. 4B). Distinct differences in the
score were observed between the two groups. The qualitative
differences in scores between groups are shown in Fig. 4C. Based on the results, it was
concluded that several immune-associated functions were more
concentrated in the low-risk group, with the exception of
antibody-drug conjugates and type I IFN response. Further
investigation of the expression level difference of human leukocyte
antigen subtypes between high- and low-risk groups was carried out
(Fig. 4D). Of the 24 subtypes
studied, 13 were expressed differently between groups and all 13
subtypes were highly expressed in the high-risk group.
The aforementioned results indicated differences in
immune infiltration between the high- and low-risk groups. The
low-risk group had higher immune content, which indicated that
immunotherapy may be beneficial in these patients with EC. The
findings also suggested that the created signature could discern
between immunity levels, and the cut-off points that were set could
identify these differences.
Clinical validation
To determine the effect of age, samples were divided
into two groups, <60 and ≥60 years, as a study has shown that
the incidence of EC increases significantly over the age of 60
(4). The risk scores were
significantly different between the two groups; the ≥60 years group
had higher risk scores compared with the <60 years group
(Fig. 4E). The differences between
grades 1 and 3, and grades 2 and 3 were significant, while there
was no difference between grades 1 and 2. Therefore, if grades 1
and 2 are joined into a low-grade group and grade 3 is denoted as a
high-grade group, the difference between the high- and low-grade
groups is significant (Fig. 4F).
Stage I of the FIGO stage was classed as the early stage, and
stages II–IV were classed as the late stage. A difference in risk
score was observed between the early and late stages; the higher
the stage, the higher the risk score (Fig. 4G). The aforementioned results
indicated the relationship between the risk score and clinical
traits, and they also redefined and divided clinical traits
according to the prognostic model to improve alignment of clinical
traits with the FAM prognostic signature.
Establishment of the nomogram and
comparisons with previous models
Based on the aforementioned analysis, a nomogram, a
fusion model of gene expression levels and clinical traits,
including age, grade and stage information, was established
(Fig. 5A). ROC curves demonstrated
considerable prognostic effects for 1, 3 and 5 years with an AUC of
0.772, 0.780 and 0.814, respectively (Fig. 5B). The calibration curve also
confirmed the validity of the prediction (Fig. 5C). Numerous prognostic models have
been developed to predict factors that may affect prognosis from
different perspectives. To compare the effectiveness of the models
created in the present study with previously established models,
five established models were chosen at random. These were from the
studies of Chen et al (34), Liu et al (35), Yin et al (36), Zhang and Yang (37) and Zhang et al (38). In terms of 1-, 3- and 5-year
predictions, the nomogram of the present study ranked highest and
in terms of 1- and 5-year predictions, the signature created in the
present study ranked second (Fig.
5D-F). Both the FAM gene-based signature and nomogram model
performed well in prognosis prediction, suggesting that FAM serves
an important role in EC.
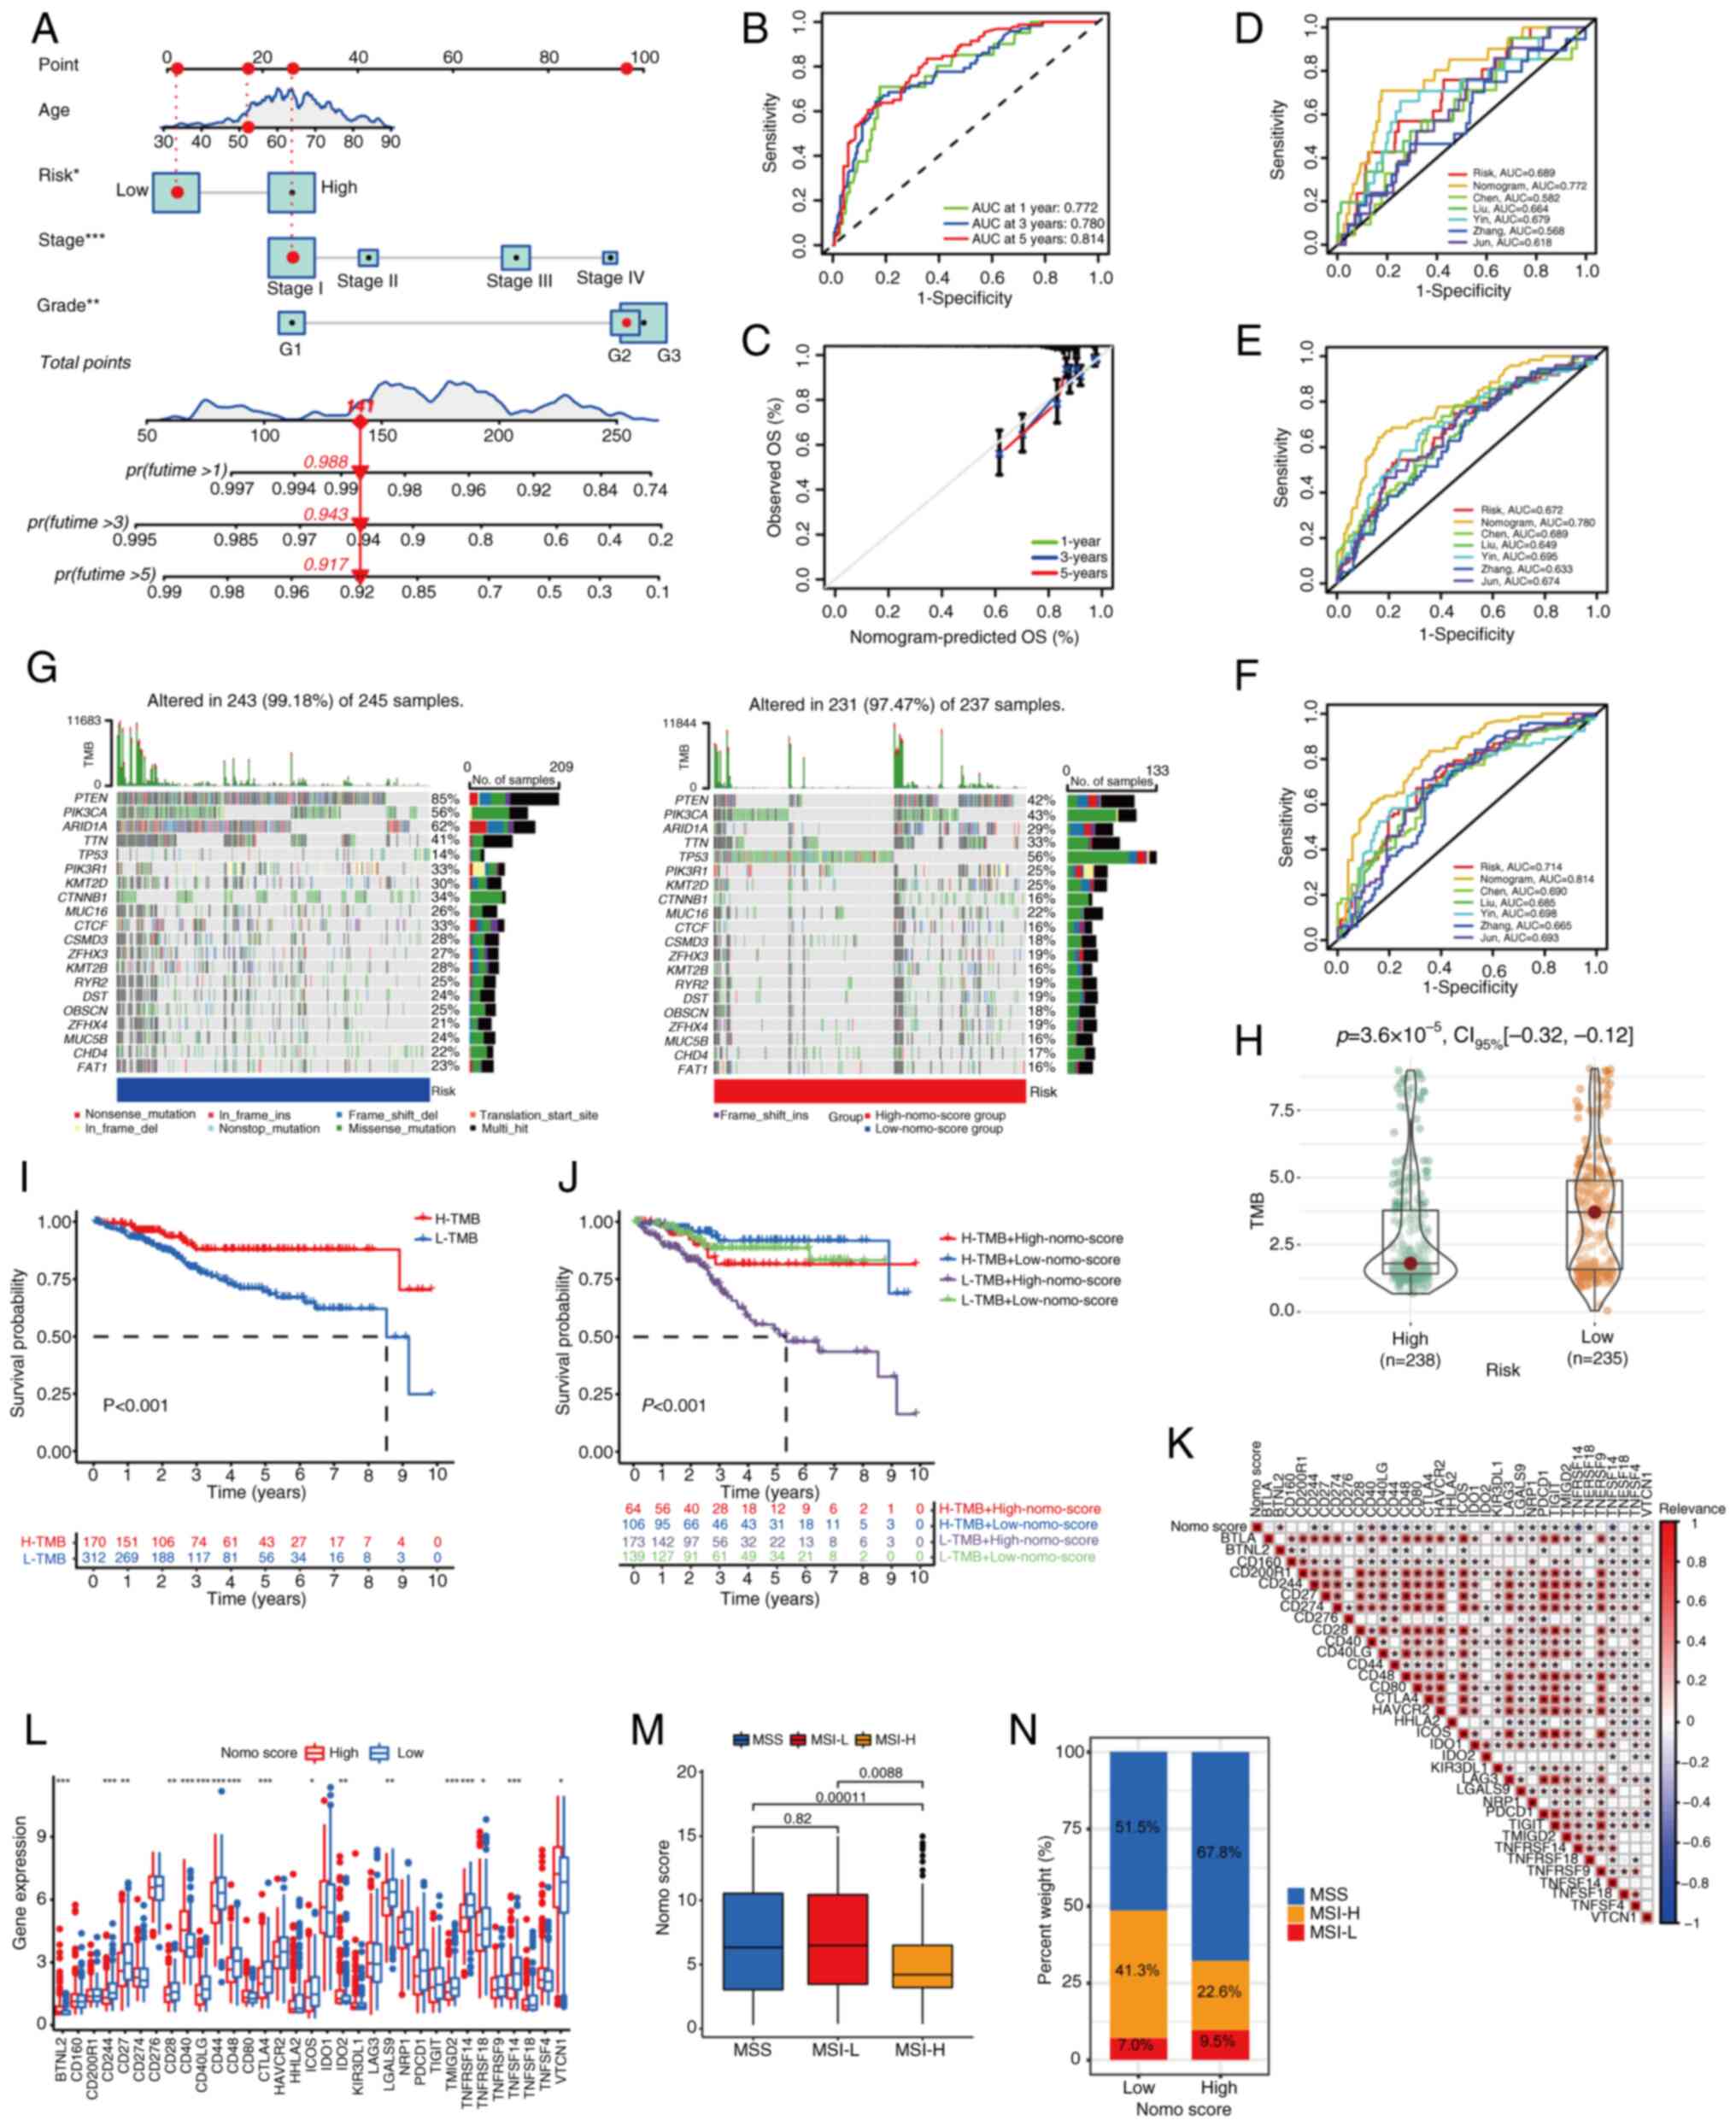 | Figure 5.Establishment of a nomogram and
therapy prediction based on the nomogram. (A) Nomogram comprising
age, grade, stage and risk score. Patients received a score based
on their clinical information and risk score to predict 1-, 3- and
5-year survival rates. (B) Receiver operating characteristic curves
for the prediction of 1-, 3- and 5-year survival rates. (C)
Calibration curve to explicate the prediction accuracy. Comparison
between the models built in the present study and existing models
for (D) 1, (E) 3 and (F) 5 years. (G) Gene mutation rate of each
sample in the high-nomo-score and low-nomo-score groups. The top 20
genes with the highest mutation rate were listed. (H) Scatter plot
of the TMB of samples in the two groups. (I) Survival analysis of
samples with high and low TMB. (J) Samples were divided into four
groups according to the nomo-score and TMB. The survival status was
significantly different among groups. (K) The relevance between
ICI-associated genes and nomo score. (L) Differences in
ICI-associated gene expression levels between the high- and
low-nomo-score groups. (M) MSI subtypes of samples and nomo scores.
(N) MSI subtype composition in high- and low-nomo-score groups.
*P<0.05; **P<0.01; ***P<0.001 OS, overall survival; TMB,
tumor mutation burden; ICI, immune checkpoint inhibitor; MSI,
microsatellite instability; AUC, area under the curve; nomo,
nomogram; ins, insertion; del, deletion; H-, high; L-, low; MSI-H,
high microsatellite instability; MSI-L, low microsatellite
instability; MSS, microsatellite stability. |
Therapy prediction based on the
nomogram
According to the median number of total scores from
the nomogram, the samples were evenly divided into high- and
low-nomo-score groups. Genes were mutated at different frequencies
in samples. For the 20 genes with the highest mutation rates, the
mutation percentage of the low-nomo-score group was higher than
that of the high-nomo-score group, except for TP53 (Fig. 5G). The TP53 mutation
occurred at a rate of 14% in the low-nomo-score samples, whereas
the mutation rate was 56% in the high-nomo-score samples, with
missense mutations accounting for the majority of mutations. The
three genes with the highest mutation rates were PTEN,
PIK3CA and ARID1A in both high and low nomo-score
groups. The TMB of samples from different nomo groups was then
calculated. In general, the low-nomo-score group had a higher TMB,
with a statistically significant difference (Fig. 5H). Samples were divided into high-
and low-TMB groups according to the median value of TMB and
survival analysis demonstrated that the high-TMB group had a higher
survival probability (Fig. 5I),
which was consistent with the established conclusion that a high
TMB is associated with prolonged survival after immune checkpoint
inhibitor (ICI) treatment in several types of cancer (39). The combination of TMB
classification and nomo-risk showed a higher survival rate for
patients with a high TMB and a low nomo-risk score. Furthermore,
patients with low TMB and high nomo-risk score had the least
favorable outcomes (Fig. 5J). In
summary, the aforementioned results indicated that low-nomo-score
groups have a higher TMB, thus predicting an improved outcome of
immunotherapy.
As ICI therapy strategies have been discussed
previously (17), the relationship
between the nomo-score and ICI genes was investigated. A total of
34 ICI-associated genes were identified and the results of
correlation analysis revealed that ICI genes were correlated with
the nomogram (Fig. 5K).
Furthermore, the expression levels of ICI genes in the high- and
low-nomo-risk groups were calculated. There were 17 genes with
different expression levels between groups (Fig. 5L). Thus, a prevalent relationship
between the ICI genes and the nomogram was observed. The MSI of EC
also affected the efficacy of immunotherapy. The MSI-H group had a
lower nomo-score, indicating improved immunotherapy efficacy for
the low-risk group (Fig. 5M and
N). All results indicated that low-nomo-score groups had
improved survival rates and responded effectively to immunotherapy.
A prediction of drug sensitivity was conducted based on gene
signatures and nomo-score groups using the R package ‘pRRophetic’.
There were 35 predicted sensitive drugs in both categories, and 29
of them were identified in both the gene signature and nomo-score
groups (Table SV). These results
demonstrated that the nomo-score evaluation system could predict
the survival status and therapy effect, and that a low nomo-score
indicated improved outcomes.
Discussion
Abnormal FAM can affect the progression of EC, which
may be mediated by the gut microbial profile (40); however, its interaction with
immunity is rarely described. In the present study, a comprehensive
analysis of the role of FAM-associated genes in EC samples was
conducted. The impact was discussed from perspectives such as CNVs,
somatic mutations, expression levels, interactions between genes
and influence on survival. Tumor samples were grouped into high-
and low-immune groups according to the ssGSEA score. A common
feature of DEGs between immune groups and FAM-associated genes was
the presence of 50 differentially expressed FAM-associated genes,
22 of which were associated with prognosis. Three genes,
PPARGC1A, RBP4 and CRABP2, were selected to establish
prognostic signatures. Following the categorization of tumor
samples into high- and low-risk groups based on the signature
formula, a comprehensive set of analyses were undertaken to
validate the efficacy of the signature. Significant differences
were observed in the distribution of risk scores and survival rates
between the groups, where the low-risk group exhibited more
pronounced immune infiltration. Furthermore, differential
expression of ICI-associated genes was observed between the groups,
which led to the identification of 35 sensitive compounds.
PPARGC1A promotes apoptosis and inhibits
proliferation in breast cancer (41). RBP4, a fatty acid-binding
protein (42), is implicated in
the pathogenesis of endometriosis by enhancing endometrial stromal
cells viability, proliferation and invasion (43). In endometrioid endometrial
adenocarcinoma, RBP4 has been identified as one of the six
hub genes associated with survival and may serve as a potential
target of immune therapy (44).
CRABP2 directs retinoic acid toward the retinoic acid
receptor (RAR), resulting in growth arrest and apoptosis (45). Resveratrol interferes with the
reprogramming of the retinoic acid signaling pathway in
decidualized human endometrial stromal cells (HESCs) by
accelerating the downregulation of cellular CRABP2 and RAR
(46). HESCs express CRBP1,
an intracellular carrier protein for retinol, and RBP4, a
blood carrier protein for retinol, which can function as a
paracrine messenger (47). The
aforementioned studies suggest that decidual transformation, the
CRBP1-RAR pathway and retinoic acid may contribute to the
pathogenesis and progression of EC.
Tumor samples were separated into high- and low-risk
groups according to the signature formula. The difference in risk
score distribution and survival rates between groups were
significant. The 5-year survival rate of patients was sufficiently
predicted by this model. Samples in the two groups had different
clinical manifestations. In the majority of cases, immune cells
were negatively correlated with the signature, which means that
low-risk score groups exhibited increased immune infiltration. An
IHC study on endometrioid adenocarcinoma demonstrated that the
expression levels of CD3 (T lymphocytes), CD57 (natural killer
cells) and CD68 (macrophages) were higher in the optimal outcome
group compared with the poor outcome group. The two groups did not
significantly differ in terms of CD20 (B lymphocytes) and S100
(dendritic cells) expression (48). To the best of our knowledge, no
studies have confirmed the relationship between immune cell
activation status and EC, which needs further exploration.
The model in the present study was made more
practical by including age, grade and stage of EC, thus a nomogram
was established. According to bioinformatics analysis, the TMB is
an important prognostic factor for EC (49). Thus, the TMB was compared between
the two nomo-score groups. The low-score group had a higher TMB and
improved survival rates. However, contradictory to this,
TP53 had a lower mutation rate in the low-score group.
Pan-cancer analysis on the mutation rate of TP53 indicated
that TP53 mutations result in poor survival prognosis in
uterine EC (50). A high mutation
rate of TP53 was observed in the high-score group, which
indicated poor survival rates. Analysis of MSI also demonstrated
that samples in the low-score group were more inclined to MSI-H and
thus had improved responses to immunotherapy. As for ICI, it can be
used both as a monotherapy and in combination with cytotoxic
chemotherapy, other immunotherapy or as targeted agents (51). The PD-L1 (also known as
CD274) and cytotoxic T-lymphocyte-associated antigen 4
(CTLA-4) pathways are the two main targets of ICI (52,53).
The expression levels of PD-L1 and CTLA-4 were
significantly different between the high- and low-nomo-score
groups. The correlation between gene expression levels and the
nomogram was also validated.
Both the gene signature and nomogram model were
associated with 35 sensitive drugs, 29 of which were associated
with both. Clinically common anticancer drugs, such as dasatinib
and tamoxifen, were identified among the 29 sensitive components.
Foretinib was also identified, and this inhibits hepatocyte growth
factor/Met signaling in EC cell lines. This pathway is typically
stimulated in an autocrine manner and is relevant for cell
survival, inducing p53-dependent apoptosis in EC cell lines in
vitro (54). Since TP53
had an unusual mutation rate in samples, this finding should be
investigated in future studies. These findings demonstrated that
the model constructed in the present study could be feasible for
clinical applications, providing appropriate treatment options and
relatively accurate prediction of prognosis.
In conclusion, the present study demonstrated that
different FAM modification patterns contributed to the
heterogeneity and complexity of individual TMEs. In patients with
EC, the FAM score is a promising biomarker for determining
prognosis, molecular subtypes, TME infiltration characteristics and
immunotherapy effects. The present study has limitations, despite
extensive analysis. The data in the Gene Expression Omnibus lack
survival information, thus only TCGA data were used, limiting the
sample size. In addition, the genes found in the present study have
not been fully verified in vitro.
Supplementary Material
Supporting Data
Supporting Data
Supporting Data
Supporting Data
Supporting Data
Supporting Data
Acknowledgements
Not applicable.
Funding
The present study was supported by the National Nature Science
Foundation of China (grant no. 81902657), Natural Science
Foundation of Shandong Province (grant no. ZR2020MH271) and China
Postdoctoral Science Foundation (grant no. 2021M691939).
Availability of data and materials
The data generated in the present study may be
requested from the corresponding author.
Authors' contributions
LP and RD designed the present study. LP conducted
the bioinformatics analysis, while RS and TH were responsible for
the immunohistochemistry. LP and YM collaborated on writing the
content, creating the figures and conducting the experiments. QZ
funded the present study and was responsible for clinical data
collection. JJ and HBS were responsible for the interpretation of
data and revising the manuscript. All authors read and approved the
final version of the manuscript. LP, YM and QZ confirm the
authenticity of all the raw data.
Ethics approval and consent to
participate
The human research was approved by the Ethics
Committee of Qilu Hospital of Shandong University (approval no.
KYLL-202210-055-1; Jinan, China). All patients participating in the
present study provided written informed consent.
Patient consent for publication
All patients provided written consent for their
information to be published.
Competing interests
The authors declare that they have no competing
interests.
References
|
1
|
Makker V, MacKay H, Ray-Coquard I, Levine
DA, Westin SN, Aoki D and Oaknin A: Endometrial cancer. Nat Rev Dis
Primers. 7:882021. View Article : Google Scholar : PubMed/NCBI
|
|
2
|
Bray F, Laversanne M, Sung H, Ferlay J,
Siegel RL, Soerjomataram I and Jemal A: Global cancer statistics
2022: GLOBOCAN estimates of incidence and mortality worldwide for
36 cancers in 185 countries. CA Cancer J Clin. 74:229–263. 2024.
View Article : Google Scholar : PubMed/NCBI
|
|
3
|
Sung H, Ferlay J, Siegel RL, Laversanne M,
Soerjomataram I, Jemal A and Bray F: Global cancer statistics 2020:
GLOBOCAN estimates of incidence and mortality worldwide for 36
cancers in 185 countries. CA Cancer J Clin. 71:209–49. 2021.
View Article : Google Scholar : PubMed/NCBI
|
|
4
|
Lu KH and Broaddus RR: Endometrial cancer.
N Engl J Med. 383:2053–2064. 2020. View Article : Google Scholar : PubMed/NCBI
|
|
5
|
Morice P, Leary A, Creutzberg C,
Abu-Rustum N and Darai E: Endometrial cancer. Lancet.
387:1094–1108. 2016. View Article : Google Scholar : PubMed/NCBI
|
|
6
|
Bhaskaran K, Douglas I, Forbes H,
dos-Santos-Silva I, Leon DA and Smeeth L: Body-mass index and risk
of 22 specific cancers: A population-based cohort study of 5·24
million UK adults. Lancet. 384:755–765. 2014. View Article : Google Scholar : PubMed/NCBI
|
|
7
|
Urick ME and Bell DW: Clinical
actionability of molecular targets in endometrial cancer. Nat Rev
Cancer. 19:510–521. 2019. View Article : Google Scholar : PubMed/NCBI
|
|
8
|
Cheng Y, Li X, Dai Y, Dong Y, Yang X and
Wang J: Identification of an immune-related risk signature and
nomogram predicting the overall survival in patients with
endometrial cancer. J Gynecol Oncol. 32:e302021. View Article : Google Scholar : PubMed/NCBI
|
|
9
|
Liu J, Ji C, Wang Y, Zhang C and Zhu H:
Identification of methylation-driven genes prognosis signature and
immune microenvironment in uterus corpus endometrial cancer. Cancer
Cell Int. 21:3652021. View Article : Google Scholar : PubMed/NCBI
|
|
10
|
Wang H, Ma X, Liu J, Wan Y, Jiang Y, Xia Y
and Cheng W: Prognostic value of an autophagy-related gene
expression signature for endometrial cancer patients. Cancer Cell
Int. 20:3062020. View Article : Google Scholar : PubMed/NCBI
|
|
11
|
Yang X, Li X, Cheng Y, Zhou J, Shen B,
Zhao L and Wang J: Comprehensive analysis of the glycolysis-related
gene prognostic signature and immune infiltration in endometrial
cancer. Front Cell Dev Biol. 9:7978262021. View Article : Google Scholar : PubMed/NCBI
|
|
12
|
Cancer Genome Atlas Research Network, .
Kandoth C, Schultz N, Cherniack AD, Akbani R, Liu Y, Shen H,
Robertson AG, Pashtan I, Shen R, et al: Integrated genomic
characterization of endometrial carcinoma. Nature. 497:67–73. 2013.
View Article : Google Scholar : PubMed/NCBI
|
|
13
|
Prendergast EN, Holman LL, Liu AY, Lai TS,
Campos MP, Fahey JN, Wang X, Abdelaal N, Rao JY, Elvin JA, et al:
Comprehensive genomic profiling of recurrent endometrial cancer:
Implications for selection of systemic therapy. Gynecol Oncol.
154:461–466. 2019. View Article : Google Scholar : PubMed/NCBI
|
|
14
|
Soumerai TE, Donoghue MTA, Bandlamudi C,
Srinivasan P, Chang MT, Zamarin D, Cadoo KA, Grisham RN,
O'Cearbhaill RE, Tew WP, et al: Clinical utility of prospective
molecular characterization in advanced endometrial cancer. Clin
Cancer Res. 24:5939–5947. 2018. View Article : Google Scholar : PubMed/NCBI
|
|
15
|
O'Malley D, Bariani GM, Cassier PA,
Marabelle A, Hansen AR, De Jesus Acosta A, Miller WH Jr, Safra T,
Italiano A, Mileshkin L, et al: Pembrolizumab in patients with
microsatellite instability-high advanced endometrial cancer:
Results from the KEYNOTE-158 study. J Clin Oncol. 40:752–761. 2022.
View Article : Google Scholar : PubMed/NCBI
|
|
16
|
du Rusquec P, de Calbiac O, Robert M,
Campone M and Frenel JS: Clinical utility of pembrolizumab in the
management of advanced solid tumors: An evidence-based review on
the emerging new data. Cancer Manag Res. 11:4297–4312. 2019.
View Article : Google Scholar : PubMed/NCBI
|
|
17
|
Mutlu L, Harold J, Tymon-Rosario J and
Santin AD: Immune checkpoint inhibitors for recurrent endometrial
cancer. Expert Rev Anticancer Ther. 22:249–258. 2022. View Article : Google Scholar : PubMed/NCBI
|
|
18
|
Bellone S, Roque DM, Siegel ER, Buza N,
Hui P, Bonazzoli E, Guglielmi A, Zammataro L, Nagarkatti N, Zaidi
S, et al: A phase II evaluation of pembrolizumab in recurrent
microsatellite instability-high (MSI-H) endometrial cancer patients
with Lynch-like versus MLH-1 methylated characteristics
(NCT02899793). Ann Oncol. 32:1045–1046. 2021. View Article : Google Scholar : PubMed/NCBI
|
|
19
|
Hoy AJ, Nagarajan SR and Butler LM: Tumour
fatty acid metabolism in the context of therapy resistance and
obesity. Nat Rev Cancer. 21:753–766. 2021. View Article : Google Scholar : PubMed/NCBI
|
|
20
|
Ji Z, Shen Y, Feng X, Kong Y, Shao Y, Meng
J, Zhang X and Yang G: Deregulation of lipid metabolism: The
critical factors in ovarian cancer. Front Oncol. 10:5930172020.
View Article : Google Scholar : PubMed/NCBI
|
|
21
|
Yoon H and Lee S: Fatty acid metabolism in
ovarian cancer: Therapeutic implications. Int J Mol Sci.
23:21702022. View Article : Google Scholar : PubMed/NCBI
|
|
22
|
Darwish NM, Elshaer MMA, Almutairi SM,
Chen TW, Mohamed MO, Ghaly WBA and Rasheed RA: Omega-3
polyunsaturated fatty acids provoke apoptosis in hepatocellular
carcinoma through knocking down the STAT3 activated signaling
pathway: In vivo and in vitro study. Molecules. 27:30322022.
View Article : Google Scholar : PubMed/NCBI
|
|
23
|
Tang M, Dong X, Xiao L, Tan Z, Luo X, Yang
L, Li W, Shi F, Li Y, Zhao L, et al: CPT1A-mediated fatty acid
oxidation promotes cell proliferation via nucleoside metabolism in
nasopharyngeal carcinoma. Cell Death Dis. 13:3312022. View Article : Google Scholar : PubMed/NCBI
|
|
24
|
Chen J, Chen J, Huang J, Li Z, Gong Y, Zou
B, Liu X, Ding L, Li P, Zhu Z, et al: HIF-2α upregulation mediated
by hypoxia promotes NAFLD-HCC progression by activating lipid
synthesis via the PI3K-AKT-mTOR pathway. Aging (Albany NY).
11:10839–10860. 2019. View Article : Google Scholar : PubMed/NCBI
|
|
25
|
Ringel AE, Drijvers JM, Baker GJ, Catozzi
A, García-Cañaveras JC, Gassaway BM, Miller BC, Juneja VR, Nguyen
TH, Joshi S, et al: Obesity shapes metabolism in the tumor
microenvironment to suppress anti-tumor immunity. Cell.
183:1848–1866.e26. 2020. View Article : Google Scholar : PubMed/NCBI
|
|
26
|
Corn KC, Windham MA and Rafat M: Lipids in
the tumor microenvironment: From cancer progression to treatment.
Prog Lipid Res. 80:1010552020. View Article : Google Scholar : PubMed/NCBI
|
|
27
|
Rysman E, Brusselmans K, Scheys K,
Timmermans L, Derua R, Munck S, Van Veldhoven PP, Waltregny D,
Daniëls VW, Machiels J, et al: De novo lipogenesis protects cancer
cells from free radicals and chemotherapeutics by promoting
membrane lipid saturation. Cancer Res. 70:8117–8126. 2010.
View Article : Google Scholar : PubMed/NCBI
|
|
28
|
Hajjaji N and Bougnoux P: Selective
sensitization of tumors to chemotherapy by marine-derived lipids: A
review. Cancer Treat Rev. 39:473–488. 2013. View Article : Google Scholar : PubMed/NCBI
|
|
29
|
Yang C, Huang X, Liu Z, Qin W and Wang C:
Metabolism-associated molecular classification of hepatocellular
carcinoma. Mol Oncol. 14:896–913. 2020. View Article : Google Scholar : PubMed/NCBI
|
|
30
|
Ding C, Shan Z, Li M, Chen H, Li X and Jin
Z: Characterization of the fatty acid metabolism in colorectal
cancer to guide clinical therapy. Mol Ther Oncolytics. 20:532–544.
2021. View Article : Google Scholar : PubMed/NCBI
|
|
31
|
Newman AM, Liu CL, Green MR, Gentles AJ,
Feng W, Xu Y, Hoang CD, Diehn M and Alizadeh AA: Robust enumeration
of cell subsets from tissue expression profiles. Nat Methods.
12:453–457. 2015. View Article : Google Scholar : PubMed/NCBI
|
|
32
|
Becht E, Giraldo NA, Lacroix L, Buttard B,
Elarouci N, Petitprez F, Selves J, Laurent-Puig P, Sautès-Fridman
C, Fridman WH and de Reyniès A: Estimating the population abundance
of tissue-infiltrating immune and stromal cell populations using
gene expression. Genome Biol. 17:2182016. View Article : Google Scholar : PubMed/NCBI
|
|
33
|
Li T, Fu J, Zeng Z, Cohen D, Li J, Chen Q,
Li B and Liu XS: TIMER2.0 for analysis of tumor-infiltrating immune
cells. Nucleic Acids Res. 48:W509–W514. 2020. View Article : Google Scholar : PubMed/NCBI
|
|
34
|
Chen Y, Liao Y, Du Q, Shang C, Qin S, Lee
K, Zou Q, Liu J and Yao S: Roles of pyroptosis-related gene
signature in prediction of endometrial cancer outcomes. Front Med
(Lausanne). 9:8228062022. View Article : Google Scholar : PubMed/NCBI
|
|
35
|
Liu J, Wang Y, Meng H, Yin Y, Zhu H and Ni
T: Identification of the prognostic signature associated with tumor
immune microenvironment of uterine corpus endometrial carcinoma
based on ferroptosis-related genes. Front Cell Dev Biol.
9:7350132021. View Article : Google Scholar : PubMed/NCBI
|
|
36
|
Yin W, Liao F, Chen M, Qin X, Lai H, Lin Y
and Yao D: Immune infiltration and a ferroptosis-associated gene
signature for predicting the prognosis of patients with endometrial
cancer. Aging (Albany NY). 13:16713–16732. 2021.PubMed/NCBI
|
|
37
|
Zhang X and Yang Q: A pyroptosis-related
gene panel in prognosis prediction and immune microenvironment of
human endometrial cancer. Front Cell Dev Biol. 9:7058282021.
View Article : Google Scholar : PubMed/NCBI
|
|
38
|
Zhang J, Wang Z, Zhao R, An L, Zhou X,
Zhao Y and Wang H: An integrated autophagy-related gene signature
predicts prognosis in human endometrial cancer. BMC Cancer.
20:10302020. View Article : Google Scholar : PubMed/NCBI
|
|
39
|
Valero C, Lee M, Hoen D, Wang J, Nadeem Z,
Patel N, Postow MA, Shoushtari AN, Plitas G, Balachandran VP, et
al: The association between tumor mutational burden and prognosis
is dependent on treatment context. Nat Genet. 53:11–15. 2021.
View Article : Google Scholar : PubMed/NCBI
|
|
40
|
Zhao SS, Chen L, Yang J, Wu ZH, Wang XY,
Zhang Q, Liu WJ and Liu HX: Altered gut microbial profile
accompanied by abnormal fatty acid metabolism activity exacerbates
endometrial cancer progression. Microbiol Spectr. 10:e02612222022.
View Article : Google Scholar : PubMed/NCBI
|
|
41
|
Zu Y, Chen XF, Li Q, Zhang ST and Si LN:
PGC-1α activates SIRT3 to modulate cell proliferation and
glycolytic metabolism in breast cancer. Neoplasma. 68:352–361.
2021. View Article : Google Scholar : PubMed/NCBI
|
|
42
|
Perduca M, Nicolis S, Mannucci B, Galliano
M and Monaco HL: Human plasma retinol-binding protein (RBP4) is
also a fatty acid-binding protein. Biochim Biophys Acta Mol Cell
Biol Lipids. 1863:458–466. 2018. View Article : Google Scholar : PubMed/NCBI
|
|
43
|
Lee JC, Kim SH, Oh YS, Kim JH, Lee SR and
Chae HD: Increased expression of retinol-binding protein 4 in
ovarian endometrioma and its possible role in the pathogenesis of
endometriosis. Int J Mol Sci. 22:58272021. View Article : Google Scholar : PubMed/NCBI
|
|
44
|
Chen B, Wang D, Li J, Hou Y and Qiao C:
Screening and identification of prognostic tumor-infiltrating
immune cells and genes of endometrioid endometrial adenocarcinoma:
Based on the cancer genome atlas database and bioinformatics. Front
Oncol. 10:5542142020. View Article : Google Scholar : PubMed/NCBI
|
|
45
|
Schug TT, Berry DC, Shaw NS, Travis SN and
Noy N: Opposing effects of retinoic acid on cell growth result from
alternate activation of two different nuclear receptors. Cell.
129:723–733. 2007. View Article : Google Scholar : PubMed/NCBI
|
|
46
|
Ochiai A, Kuroda K, Ozaki R, Ikemoto Y,
Murakami K, Muter J, Matsumoto A, Itakura A, Brosens JJ and Takeda
S: Resveratrol inhibits decidualization by accelerating
downregulation of the CRABP2-RAR pathway in differentiating human
endometrial stromal cells. Cell Death Dis. 10:2762019. View Article : Google Scholar : PubMed/NCBI
|
|
47
|
Pavone ME, Malpani S, Dyson M and Bulun
SE: Altered retinoid signaling compromises decidualization in human
endometriotic stromal cells. Reproduction. 154:207–216. 2017.
View Article : Google Scholar : PubMed/NCBI
|
|
48
|
Zinovkin D and Pranjol MZ:
Tumor-infiltrated lymphocytes, macrophages, and dendritic cells in
endometrioid adenocarcinoma of corpus uteri as potential prognostic
factors: An immunohistochemical study. Int J Gynecol Cancer.
26:1207–1212. 2016. View Article : Google Scholar : PubMed/NCBI
|
|
49
|
Zhang J, An L, Zhou X, Shi R and Wang H:
Analysis of tumor mutation burden combined with immune infiltrates
in endometrial cancer. Ann Transl Med. 9:5512021. View Article : Google Scholar : PubMed/NCBI
|
|
50
|
Li VD, Li KH and Li JT: TP53 mutations as
potential prognostic markers for specific cancers: analysis of data
from the cancer genome atlas and the international agency for
research on cancer TP53 database. J Cancer Res Clin Oncol.
145:625–636. 2019. View Article : Google Scholar : PubMed/NCBI
|
|
51
|
Green AK, Feinberg J and Makker V: A
review of immune checkpoint blockade therapy in endometrial cancer.
Am Soc Clin Oncol Educ Book. 40:1–7. 2020.PubMed/NCBI
|
|
52
|
Oyewole-Said D, Konduri V, Vazquez-Perez
J, Weldon SA, Levitt JM and Decker WK: Beyond T-cells: Functional
characterization of CTLA-4 expression in immune and non-immune cell
types. Front Immunol. 11:6080242020. View Article : Google Scholar : PubMed/NCBI
|
|
53
|
Chaudhri A, Xiao Y, Klee AN, Wang X, Zhu B
and Freeman GJ: PD-L1 binds to B7-1 only in cis on the same cell
surface. Cancer Immunol Res. 6:921–929. 2018. View Article : Google Scholar : PubMed/NCBI
|
|
54
|
Kogata Y, Tanaka T, Ono YJ, Hayashi M,
Terai Y and Ohmichi M: Foretinib (GSK1363089) induces p53-dependent
apoptosis in endometrial cancer. Oncotarget. 9:22769–22784. 2018.
View Article : Google Scholar : PubMed/NCBI
|