Introduction
Malignant melanoma (MM) is a highly malignant type
of cancer characterized by aggressive behavior and rapid metastasis
to distant sites. Existing melanoma treatments include surgical
resection, chemotherapy and radiotherapy (1). Despite notable advancements in
immunotherapy, targeted agents and oncolytic viral therapy, the
5-year survival rate is 50% for patients with advanced melanoma
(2). Therefore, there is a
critical need to investigate novel therapeutic targets for the
treatment of MM.
Melanoma is commonly associated with mutations in
the Ser/Thr kinase BRAF (50%), the small GTPase NRAS (25%) or the
RAS regulator neurofibromin 1 (14%), leading to enhanced RAS/MAPK
signaling (3). This pathway,
involving RAS, RAF, MEK and ERK, serves crucial roles in melanoma,
thus indicating that it may be a prominent therapeutic target of
significant interest (4). MEK
serves as a key relay in the pathway, passing signals from RAF to
ERK. Pharmacological inhibition of MEK can disrupt this signaling
relay, thereby impeding ERK activation and effectively arresting
the aberrant signaling cascade that fuels cancer proliferation
(5). Notably, preclinical and
clinical studies have highlighted the RAS/RAF/MAPK pathway as a key
therapeutic target, particularly in the era of precision medicine
(1–3,6).
Wnt/β-catenin signaling, which regulates cell
proliferation, is frequently hyperactive in cancer, including
melanoma (7). In the canonical
β-catenin-dependent pathway, Wnt ligands bind to Frizzled receptors
on the cell surface, triggering Dishevelled (DVL) recruitment and
disruption of the β-catenin destruction complex (8), its translocation into the nucleus and
subsequent alteration of gene expression, particularly affecting
TCF/LEF target genes. In cancer, this signaling cascade upregulates
genes such as cyclin D1 and cMyc, driving G1/S cell
cycle progression, and promoting tumor growth and malignancy
(7). The involvement of Wnt
signaling in melanoma pathogenesis remains a topic of ongoing
discussion, with its precise contributions subject to debate
(7,9). Numerous studies have demonstrated
that Wnt/β-catenin signaling serves a role in facilitating tumor
initiation and progression in melanomas harboring mutations in BRAF
and NRAS (10–12). A previous study using an engineered
mouse model also linked Wnt signaling to the transformation of
melanocyte stem cells into melanoma in BRAF and PTEN mutants
(13). Notably, it has been
observed that the efficacy of BRAF inhibition is enhanced in
scenarios where β-catenin levels are decreased (14).
Pleckstrin homology domain-containing family A
member 4 (PLEKHA4) has a key role in the landscape of cancer
biology, such as in glioma (15).
This biomolecule performs crucial functions in cancer advancement
and prognosis, delineated by its diverse mechanisms of action. It
is involved in tumor microenvironment remodeling, particularly
through the recruitment and polarization of M2 macrophages
(15,16). In glioblastoma, PLEKHA4 is involved
in the modulation of apoptotic regulators and inhibits apoptosis
(15). Additionally, PLEKHA4 has
been implicated in promoting cancer cell proliferation in melanoma
through the activation of the Wnt/β-catenin signaling pathway, a
key regulator of cell proliferation and differentiation (17). In a BRAF-mutant melanoma xenograft
model (18), inducible PLEKHA4
knockdown exhibited additive effects when combined with the
clinically used BRAF V600D/E inhibitor encorafenib (19). These findings suggested the
therapeutic potential of targeting PLEKHA4 in melanoma,
particularly involving the MAPK pathway. Since β-catenin levels
contribute to the inhibition of BRAF, an upstream component of the
MAPK pathway, a comprehensive examination of both the MAPK and
Wnt/β-catenin pathways is imperative in MM. The present study aimed
to assess the role of PLEKHA4 in MAPK and Wnt/β-catenin pathways,
as well as the underlying mechanisms in melanoma.
Materials and methods
Bioinformatics analysis
Pan-cancer RNA sequencing data from 51 datasets were
obtained from The Cancer Genome Atlas (TCGA) (https://portal.gdc.cancer.gov) and Genotype-Tissue
Expression (https://www.gtexportal.org/home/). The data were
processed using R software (v.4.2.1) (https://cran.r-project.org/bin/windows/base/old/4.2.1/)
and visualized with the ‘ggplot2’ package (v.3.3.6; http://cran.r-project.org/src/contrib/Archive/ggplot2/).
Statistical analyses were performed using the Wilcoxon rank-sum
test. Additionally, the expression profile of PLEKHA4 in melanoma
was examined using the Gene Expression Profiling Interactive
Analysis (GEPIA) platform (http://gepia.cancer-pku.cn). Furthermore, the gene
expression profiles GSE3189 (20)
and GSE8401 (21) were obtained
from the Gene Expression Omnibus (GEO) database (https://www.ncbi.nlm.nih.gov/geo/), both of which
are based on the GPL96 platform. The GSE3189 data were collected
from 7 normal skin, 18 nevi and 45 melanoma samples, whereas the
GSE8401 data were collected from 31 primary melanoma and 52
melanoma metastasis tissues from patients. Data from the GEO
database were downloaded using ‘GEOquery’ (v.2.64.2; http://bioconductor.org/packages/release/bioc/html/GEOquery.html)
and were normalized with the ‘normalizeBetweenArrays’ function from
the ‘limma’ package (v.3.52.2; http://www.bioconductor.org/packages/release/bioc/html/limma.html).
All gene expression data were calibrated, standardized and
log2-transformed. The results were visualized using
‘ggplot2’ (v.3.3.6) and ‘ComplexHeatmap’ (v.2.13.1; http://github.com/jokergoo/complexheatmap). Principal
component analysis was performed using R package ggplot2
(https://cran.r-project.org/web/packages/ggplot2/index.html).
The expression of PLEKHA4 across various pathological and
histological grades was analyzed using R and was visualized with
‘ggplot2’. RNAseq data from TCGA-Skin Cutaneous Melanoma (SKCM)
project (portal.gdc.cancer.gov/projects/TCGA-SKCM) was obtained
using the STAARpipeline (https://github.com/xihaoli/STAARpipeline) from TCGA
database and extracted in transcripts per million (TPM) format.
Kyoto Encyclopedia of Genes and Genomes (KEGG) combined with Gene
Ontology (GO) analyses were performed using ‘clusterProfiler’
(v.4.4.4; http://bioconductor.org/packages/release/bioc/html/clusterProfiler.html)
and GOplot (v.1.0.2; http://cran.r-project.org/web/packages/GOplot/index.html).
Correlation analysis was conducted by downloading TCGA-SKCM
dataset, as aforementioned. Results were statistically analyzed
using Spearman's correlation coefficient. The interaction of
PLEKHA4 and other proteins was analyzed using GeneMANIA (http://genemania.org). The overall survival analysis
was conducted using the GEPIA platform, incorporating both the
Kaplan-Meier method and the log-rank test.
Cell culture
Human melanoma cells A375, A2058 and SK-MEL-3 cells
were obtained from the National Collection of Authenticated Cell
Cultures. A375, A2058 and SK-MEL-3 cells were maintained in DMEM
(Gibco; Thermo Fisher Scientific, Inc.) supplemented with 10% FBS
and 1% penicillin-streptomycin (both from Biological Industries;
Sartorius AG) at 37°C in a 5% CO2 incubator. For drug
treatment, lithium chloride (LiCl; Selleck Chemicals) was added at
5 mM to activate the Wnt/β-catenin pathway, with cells incubated
under the same conditions for 12 h at 37°C in a 5% CO2
incubator. MG132 (cat. no. S2619; Selleck Chemicals) was added at
concentrations of 0, 5, 10 and 20 µM and incubated at 37°C in a 5%
CO2 incubator for 24 h to conduct the ubiquitination
assay.
Cell transduction and
transfection
A375 and A2058 cells were transduced with
PLEKHA4-targeting short hairpin RNA (shRNA) lentiviruses. The shRNA
sequences were as follows: shPLEKHA4 [K7453
LV3(H1/GFP&Puro)-PLEKHA4-Homo-2851; target sequence:
5′-GCGAGTCACTCTGCTACAATC-3′], forward,
5′-GATCCGCGAGTCACTCTGCTACAATCTTCAAGAGAGATTGTAGCAGAGTGACTCGCTTTTTTG-3′
and reverse,
5′-AATTCAAAAAAGCGAGTCACTCTGCTACAATCTCTCTTGAAGATTGTAGCAGAGTGACTCGCG-3′;
and a negative control (NC) (LV3-shNC; target sequence:
5′-GTTCTCCGAACGTGTCACGT-3′), forward,
5′-GATCCGTTCTCCGAACGTGTCACGTTTCAAGAGAACGTGACACGTTCGGAGAACTTTTTTG-3′
and reverse
5′-AATTCAAAAAAGTTCTCCGAACGTGTCACGTTCTCTTGAAACGTGACACGTTCGGAGAACG-3′.
These lentiviruses were provided by Shanghai GenePharma Co.,
Ltd.
A 3rd-generation system facilitated lentiviral
transduction. Briefly, 293T cells (National Collection of
Authenticated Cell Cultures) were used for viral production,
utilizing recombinant shuttle and packaging plasmids (pGag/Pol,
pRev and pVSV-G) (Addgene, Inc.). Plasmid concentration and purity
were confirmed by ultraviolet absorption, ensuring an A260/A280
ratio between 1.8 and 2.0. The recombinant and packaging plasmids
were mixed in an 8:4:4:4 µg ratio (shPLEKHA4 or
NC:pGag/Pol:pRev:pVSV-G), added to 293T cells and transfected for
4–6 h at 37°C with 5% CO using EndoFectin™ MAX
(GeneCopoeia, Inc.) The medium was then refreshed and incubation
continued for 72 h. The 293T cell cultures were maintained in a
37°C incubator with 5% CO2 to support optimal growth.
After 72 h, the supernatant was collected, filtered through a
0.45-µm filter to remove debris and concentrated by
ultracentrifugation at 70,000 × g for 2 h at 20°C. Pellets were
resuspended in 100 µl 1X HBSS (Gibco; Thermo Fisher Scientific,
Inc.), and another 100 µl was added, yielding a final volume of 200
µl. The solution was vortexed at low speed for 15–30 min, briefly
spun, and aliquoted into 20-µl portions for storage at −20°C (up to
1 month) or −80°C (long-term), avoiding more than three freeze-thaw
cycles.
Lentiviral infection proceeded immediately
post-preparation. The virus titers were: shPLEKHA4
(LV3-PLEKHA4-Homo-2851), 7×10⁸ TU/ml; and shNC
(LV3-shNC), 9×10⁸ TU/ml. Multiplicity of infection
values for infection were set at 5 and 10 for shPLEKHA4 and shNC in
A375 cells, and at 10 and 15 in A2058 cells, respectively. The
lentiviruses were added to the cells with 2 µg/ml polybrene to
boost infection efficiency and incubation was continued for 24 h.
Post-transduction, cells underwent selection with 1 µg/ml puromycin
for 7 days, with the same concentration maintained thereafter.
Infection efficiency was validated through western blotting,
performed immediately after the selection period along with other
assays.
To induce PLEKHA4 overexpression in SK-MEL-3 cells,
pIRES2-EGFP-PLEKHA4 and the control plasmid (pIRES2-EGFP-empty)
were purchased from Shanghai GenePharma Co., Ltd. Transfection was
performed using EndoFectin MAX. For transfection in a 6-well plate,
2.5 µg DNA and 5–12.5 µl EndoFectin Max were diluted separately in
125 µl medium. After allowing both solutions to sit for 5 min, they
were gently mixed and incubated for 5–20 min to form the
DNA-EndoFectin complex. The complex was then added to SK-MEL-3
cells cultured in a 6-well plate, once the cells had reached 80%
confluence, and the cells were transfected for 24 h at 37°C.
Protein expression was detected 24–48 h post-transfection.
Cell proliferation assay
A375 and A2058 cells were seeded in 96-well plates
at a density of 3×10³ cells/well and were cultured for
0, 24, 48, 72 and 96 h. Following this, cells were treated with 10
µl Cell Counting Kit (CCK)-8 solution (Shanghai Yeasen
Biotechnology Co., Ltd.) and incubated for 1 h at 37°C. Absorbance
was then recorded at 450 nm. Each experiment was repeated at least
three times.
Wound healing assay
Transduced A375 and A2058 cells were plated in
6-well plates at a density of 5×10³ cells/well and grown
to 90% confluence. Subsequently, the cells were incubated overnight
in serum-free medium. The cell monolayers were then mechanically
wounded using a 10-µl pipette tip. Images of the wounds were
captured at 0 and 24 h using a Nikon Eclipse Ti-S/L100 inverted
phase contrast fluorescence microscope (Nikon Corporation) with a
10× objective. The wound was measured by ImageJ bundled with 64-bit
Java 8 [version (ij154-win-java8); National Institutes of Health]
and calculated with SPSS 29 (IBM Corp.).
Colony formation assay
Transduced A375 and A2058 cells were plated in
6-well plates at a density of 5×10³ cells/well and were
cultured for 7 days. After incubation, the cells were rinsed twice
with PBS at room temperature, fixed with 4% paraformaldehyde for 15
min and stained with Giemsa (both from Beijing Solarbio Science
& Technology Co., Ltd.) for 20 min at room temperature. The
cells were then washed twice with PBS. Colonies, defined as groups
of ≥50 cells, were counted using ImageJ software [bundled with
64-bit Java 8 (ij154-win-java8), National Institutes of
Health].
Quantitative proteomics analysis
Cell samples were transferred to a 1.5-ml centrifuge
tube and lysed with DB lysis buffer (8 M urea, 100 mM TEAB, pH
8.5). The solution was then alkylated with sufficient
iodoacetamide. Protein quantity was assessed using a Bradford
protein quantitation kit. The proteins underwent enzymatic
hydrolysis and salt removal. Subsequently, the samples were
processed with tandem mass tag (TMT) labeling reagent (Thermo
Fisher Scientific Inc.). The separated peptides were analyzed by Q
Exactive™ HF-X mass spectrometer, with an ion source of
Nanospray Flex™ (ESI), spray voltage of 2.3 kV and ion
transport capillary temperature of 320°C. The full scan ranged from
350 to 1,500 m/z with a resolution of 60,000 (at m/z 200), the
automatic gain control (AGC) target value was 3×10⁶ and
the maximum ion injection time was 20 msec. The 40 most abundant
precursors in the full scan were selected and fragmented by higher
energy collisional dissociation and analyzed in tandem mass
spectrometry, where resolution was 45,000 (at m/z 200) for 10 plex,
the AGC target value was 5×10⁴, the maximum ion
injection time was 86 msec, the normalized collision energy was set
at 32%, the intensity threshold was 1.2×10⁵, and the
dynamic exclusion parameter was 20 sec. The spectra from each run
were analyzed individually against the UniProt database (https://www.uniprot.org/) using Proteome Discoverer
(Thermo Fisher Scientific, Inc.). Liquid chromatography analysis
was performed with the EASY-nLC™ 1200 UHPLC system
(Thermo Fisher Scientific, Inc.). Identified peptide-spectrum
matches and proteins were retained with a false discovery rate
(FDR) of no more than 1.0%. The protein quantitation results were
then statistically analyzed using unpaired Student's t-test.
Proteins that showed significant differences in quantity between
the experimental and control groups (P<0.05 and |log2FC|>0.5)
were defined as differentially expressed proteins. Finally, KEGG
analysis was utilized to analyze the protein families and
pathways.
Flow cytometric analysis
Cells were trypsinized without EDTA, centrifuged at
300 × g for 5 min at 4°C, washed twice with chilled PBS, and
resuspended in 100 µl 1X Binding Buffer (Shanghai Yeasen
Biotechnology Co., Ltd.). Annexin V-FITC and PI Staining Solution
(Shanghai Yeasen Biotechnology Co., Ltd.) were added, and the cells
were incubated in the dark at room temperature for 10–15 min.
Subsequently, 400 µl 1X Binding Buffer (Shanghai Yeasen
Biotechnology Co., Ltd.) was added on ice. Samples were analyzed on
a CytoFLEX SRT flow cytometer (Beckman Coulter, Inc.) within 1 h,
with FlowJo V8 (FlowJo; BD Biosciences) used for data analysis.
Ubiquitination assay
The ubiquitination assay was performed using the
Ubiquitylation Assay Kit (cat. no. ab139467; Abcam). Protein
lysates from A375shNC, A375shPLEKHA4, A375shPLEKHA4, A2058shNC,
A2058shPLEKHA4 and A2058shPLEKHA4 cells following treatment with 0,
5, 10 and 20 µM MG132 were subjected to the ubiquitination assay.
To prepare the reaction, the E1 stock solution was first diluted
1:20 in 1X ubiquitylation buffer and 5 µl was added to a 50-µl
reaction solution (including E1 Enzyme, E2 Enzyme, Ubiquitin, 10X
Ubiquitylation Buffer, ATP Solution, E3 Enzyme). Next, the E2 stock
solution was diluted 1:40 in 1X ubiquitylation buffer and 5 µl was
added to the reaction solution, and ubiquitin was diluted 1:20 in
1X ubiquitylation buffer and 5 µl was added to the reaction
solution. Subsequently, 3.5 µl 10X ubiquitylation buffer and 5 µl 2
mM ATP solution were added to the reaction solution, with the
amount depending on the substrate concentration, and the volume was
made up to 48.5 µl with water. Finally, 1.5 µl 0.05 mg/ml E3 was
added to generate a final volume of 50-µl reaction mixture), which
was incubated at room temperature for 1 h. After incubation,
western blot analysis was performed.
Western blotting
Briefly, genetically transduced or transfected A375,
A2058 and SK-MEL-3 cells were seeded in 6-well plates at a density
of 1×10⁶ cells/well and were cultured in DMEM
supplemented with 10% FBS until they reached ~90% confluence.
Protein lysates were extracted using RIPA buffer (Beijing Solarbio
Science & Technology Co., Ltd.), and nuclear proteins were
isolated with the Nuclear and Cytoplasmic Extraction Kit
(Invitrogen; Thermo Fisher Scientific, Inc.) according to the
manufacturer's protocol. Protein concentration was assessed using
the BCA Protein Assay Kit (Beyotime Institute of Biotechnology).
Proteins (30 µg/lane) were separated by SDS-PAGE on 8–10% gels,
transferred to PVDF membranes and blocked with 5% non-fat dry milk
(MilliporeSigma) for 1 h at room temperature, before overnight
incubation with primary antibodies at 4°C. The primary antibodies
used included PLEKHA4 (cat. no. NBP1-56679; Novus Biologicals;
Bio-Techne), β-actin (cat. no. GB12001-100; Wuhan Servicebio
Technology), phosphorylated (p)-p38 MAPK (cat. no. AF4001; Affinity
Biosciences), p38 MAPK (cat. no. AF6456; Affinity Biosciences),
p-JNK1/2/3 (cat. no. AF3318; Affinity Biosciences), JNK1/2/3 (cat.
no. AF6318; Affinity Biosciences), p-cJUN (cat. no. AF3095;
Affinity Biosciences), c-Jun (cat. no. AF6090; Affinity
Biosciences), p-MEK1/2 (cat. no. AF8035; Affinity Biosciences), MEK
(cat. no. AF6385; Affinity Biosciences), p-ERK (cat. no. AF1015;
Affinity Biosciences), ERK1/2 (cat. no. AF0155; Affinity
Biosciences), COX2 (cat. no. AF7003; Affinity Biosciences), p-NF-κB
p65 (cat. no. AF2006; Affinity Biosciences), NF-kB p65 (cat. no.
AF5006; Affinity Biosciences), cleaved-caspase-3 (cat. no. AF2006;
Affinity Biosciences), caspase-3 (cat. no. AF6311; Affinity
Biosciences) cMyc (cat. no. 10828-1-AP; Proteintech Group),
ubiquitin polyclonal antibody (cat. no. 10201-2-AP; Proteintech
Group), β-catenin (cat. no. AF6266; Affinity Biosciences), p-GSK3β
(cat. no. sc-373800; Santa Cruz Biotechnology), GSK3β (cat. no.
sc-377213; Santa Cruz Biotechnology), cyclin D1 (cat. no. AF0931;
Affinity Biosciences) and Lamin B1 (cat. no. sc-374015; Santa Cruz
Biotechnology), each diluted 1:1,000 in Primary Antibody Dilution
Buffer (Beyotime Institute of Biotechnology). Membranes were then
incubated with HRP-conjugated anti-rabbit and anti-mouse secondary
antibodies (cat. nos. RGAR001 and RGAM001; Proteintech Group, Inc.)
diluted 1:5,000 in Tris-buffered saline-0.1% Tween 20 for 2 h at
room temperature. Blots were visualized with ECL Western Blotting
Substrate (Beijing Solarbio Science & Technology Co., Ltd.)
using the Shenhua Science Technology Co., Ltd. system. Protein
grayscale values were semi-quantified with ImageJ (version:
ij154-win-java8). Each experiment was performed at least three
times.
Co-immunoprecipitation
Upon reaching a confluence of ~90%, cells were lysed
with RIPA buffer (Beijing Solarbio Science & Technology Co.,
Ltd.) and subjected to co-immunoprecipitation to investigate
protein interactions. Protein concentrations were determined using
the Bradford assay. A cMyc (cat. no. 10828-1-AP; Proteintech Group,
Inc.) antibody was diluted to a final concentration of 10 µg/ml
with whole cell lysates free of debris (to clear debris, the
lysates were centrifuged at 20,000 × g for 20 min at 4°C, and the
sediments were discarded). Subsequently, 400 µl whole
lysate-antibody complex was added to 25 µl Protein A/G Magnetic
Beads (cat. no. HY-K0202; MedChemExpress). The mixture was
centrifuged at 120 × g for 30 sec at 4°C and the supernatant was
discarded. The beads were washed 3–4 times with 1 ml RIPA lysis
buffer, and underwent further centrifugation at 500–1,000 rpm for
30 sec at 4°C before the supernatant was discarded. Two elutions of
the pellet were performed using 40 µl 0.10 M glycine and 0.05 M
Tris-HCl (pH 1.5–2.5) elution buffer with 500 mM NaCl. The eluates
were then combined and neutralized with 10X PBS buffer (pH 6.8–7.2)
to a final concentration of 1X. Finally, the collected eluates were
analyzed by western blotting to identify specific protein
interactions.
In vivo tumor growth analysis
Male nude mice (average weight, 14 g; age, 4 weeks)
were obtained from the Experimental Animal Center of Yanbian
University (Yanji, China) and were randomly divided into two groups
(n=5/group): The shNC and shPLEKHA4 groups. The mice were kept in a
pathogen-free environment at 25°C with 30% humidity, under a 12-h
light/dark cycle, and were provided unrestricted access to
cobalt-60-sterilized feed and autoclaved water. Animal health and
behavior were monitored daily. Each mouse was injected
subcutaneously with 200 µl of a solution containing
5×10⁶ A375 cells transduced with either shNC or
shPLEKHA4 in the right flank. Before the subcutaneous injection,
mice were given 50 mg/kg sodium pentobarbital via the
intraperitoneal route as an anesthetic to minimize suffering. Tumor
growth was tracked every 2 days. The humane endpoints were as
follows: Euthanasia was performed if tumor weight surpassed 10% of
body weight or tumor diameter exceeded 20 mm; however, none of
these criteria were met before day 15 when all mice were
sacrificed. The two groups of total 10 mice (n=5/group) were
euthanized, and no mice were euthanized or found dead prior to day
15. Mice were euthanized by cervical dislocation after anesthesia
with an intravenous dose of 70 mg/kg sodium pentobarbital, with
death confirmed by cessation of respiration and heartbeat for >5
min.
Hematoxylin and eosin staining
Subcutaneous tumors were fixed in 10% formalin at
room temperature for 24 h, dehydrated with graded ethanol and
embedded in paraffin. Tumor samples were then sectioned into 4-µm
slices, baked at 56°C overnight, and stained with an H&E Stain
kit (Beijing Solarbio Science & Technology Co., Ltd.),
following the manufacturer's instructions with all procedures
conducted at room temperature (25°C). Briefly paraffin was removed
by immersing the slides in xylene for two to three changes, each
lasting 5 min and rehydration was achieved through a graded ethanol
series. The slides were then rinsed in distilled water for 1–2 min.
Hematoxylin staining was conducted at room temperature for 5–10
min, followed by rinsing in running tap water for 5 min. Excess
hematoxylin was removed using 1–2 dips in acid alcohol, and the
slides were immediately rinsed again under running tap water. A
bluing reagent (0.1% ammonia solution) was then applied for 1–2 min
and the sections were immersed in eosin staining solution for 1–3
min, followed by a final rinse in running tap water for 5 min.
Images were captured using a Nikon Eclipse Ti-S/L100 inverted phase
contrast fluorescent microscope with a 10× objective.
Statistical analysis
Statistical analysis was performed using an unpaired
Student's t-test for two-group comparisons, and one-way ANOVA with
Tukey's post hoc test for multiple group comparisons. SPSS 26.0
(IBM Corp.) was used for data analysis, with results presented as
the mean ± SD. Each experiment was repeated at least three times.
P<0.05 was considered to indicate a statistically significant
difference.
Results
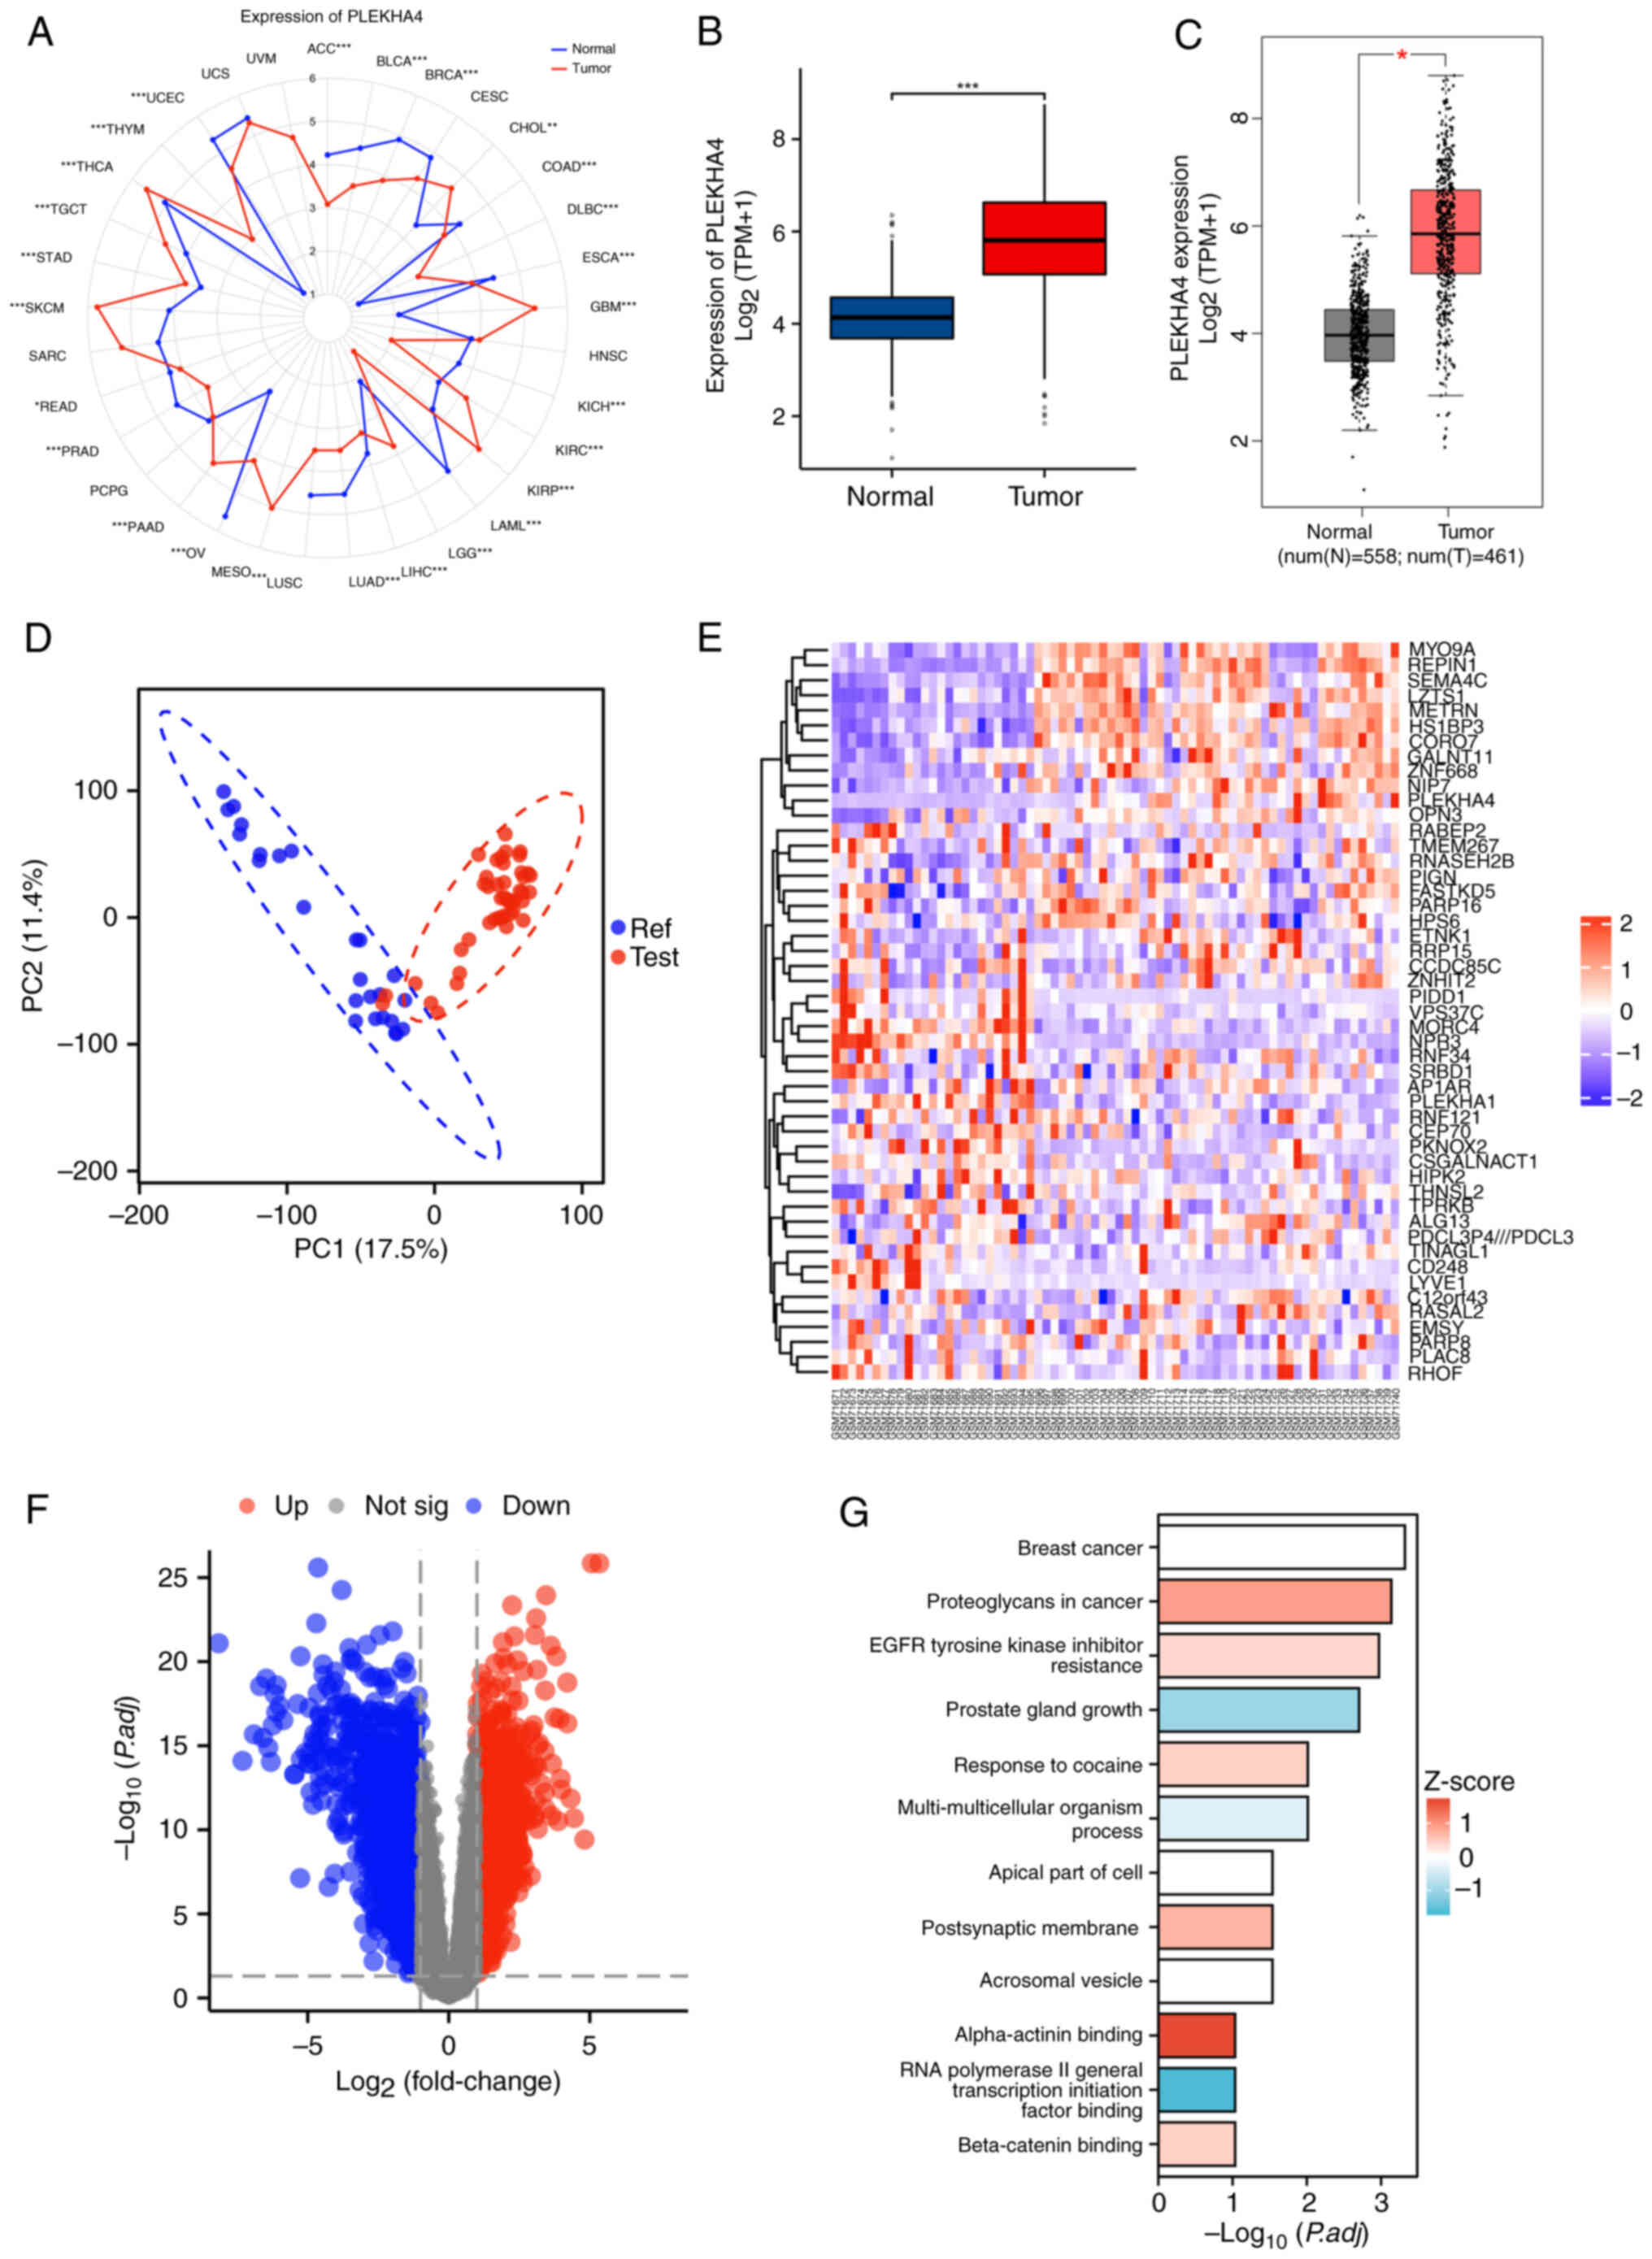
PLEKHA4 is upregulated in
melanoma
The expression of PLEKHA4 in different human cancer
tissues was assessed using RNA sequencing data. PLEKHA4 was widely
expressed in nearly all tissue types, with notably higher
expression in melanoma tissues than in normal skin tissues from
healthy individuals (Fig. 1A and
B). This expression was also confirmed by GEPIA in which tumor
tissues displayed a distinct gene expression pattern compared to
that in normal skin tissues from healthy individuals (Fig. 1C). Subsequently, gene expression
profiles from the GSE3189 and GSE8401 datasets were retrieved from
the GEO database. As shown in Fig.
1D, tumor tissues displayed a distinct gene expression pattern
compared to than in normal skin tissues from healthy individuals.
The heatmap and volcano plots highlighted distinct genes in
melanoma tissues (Fig. 1E and F),
with the heatmap specifically indicating the upregulation of
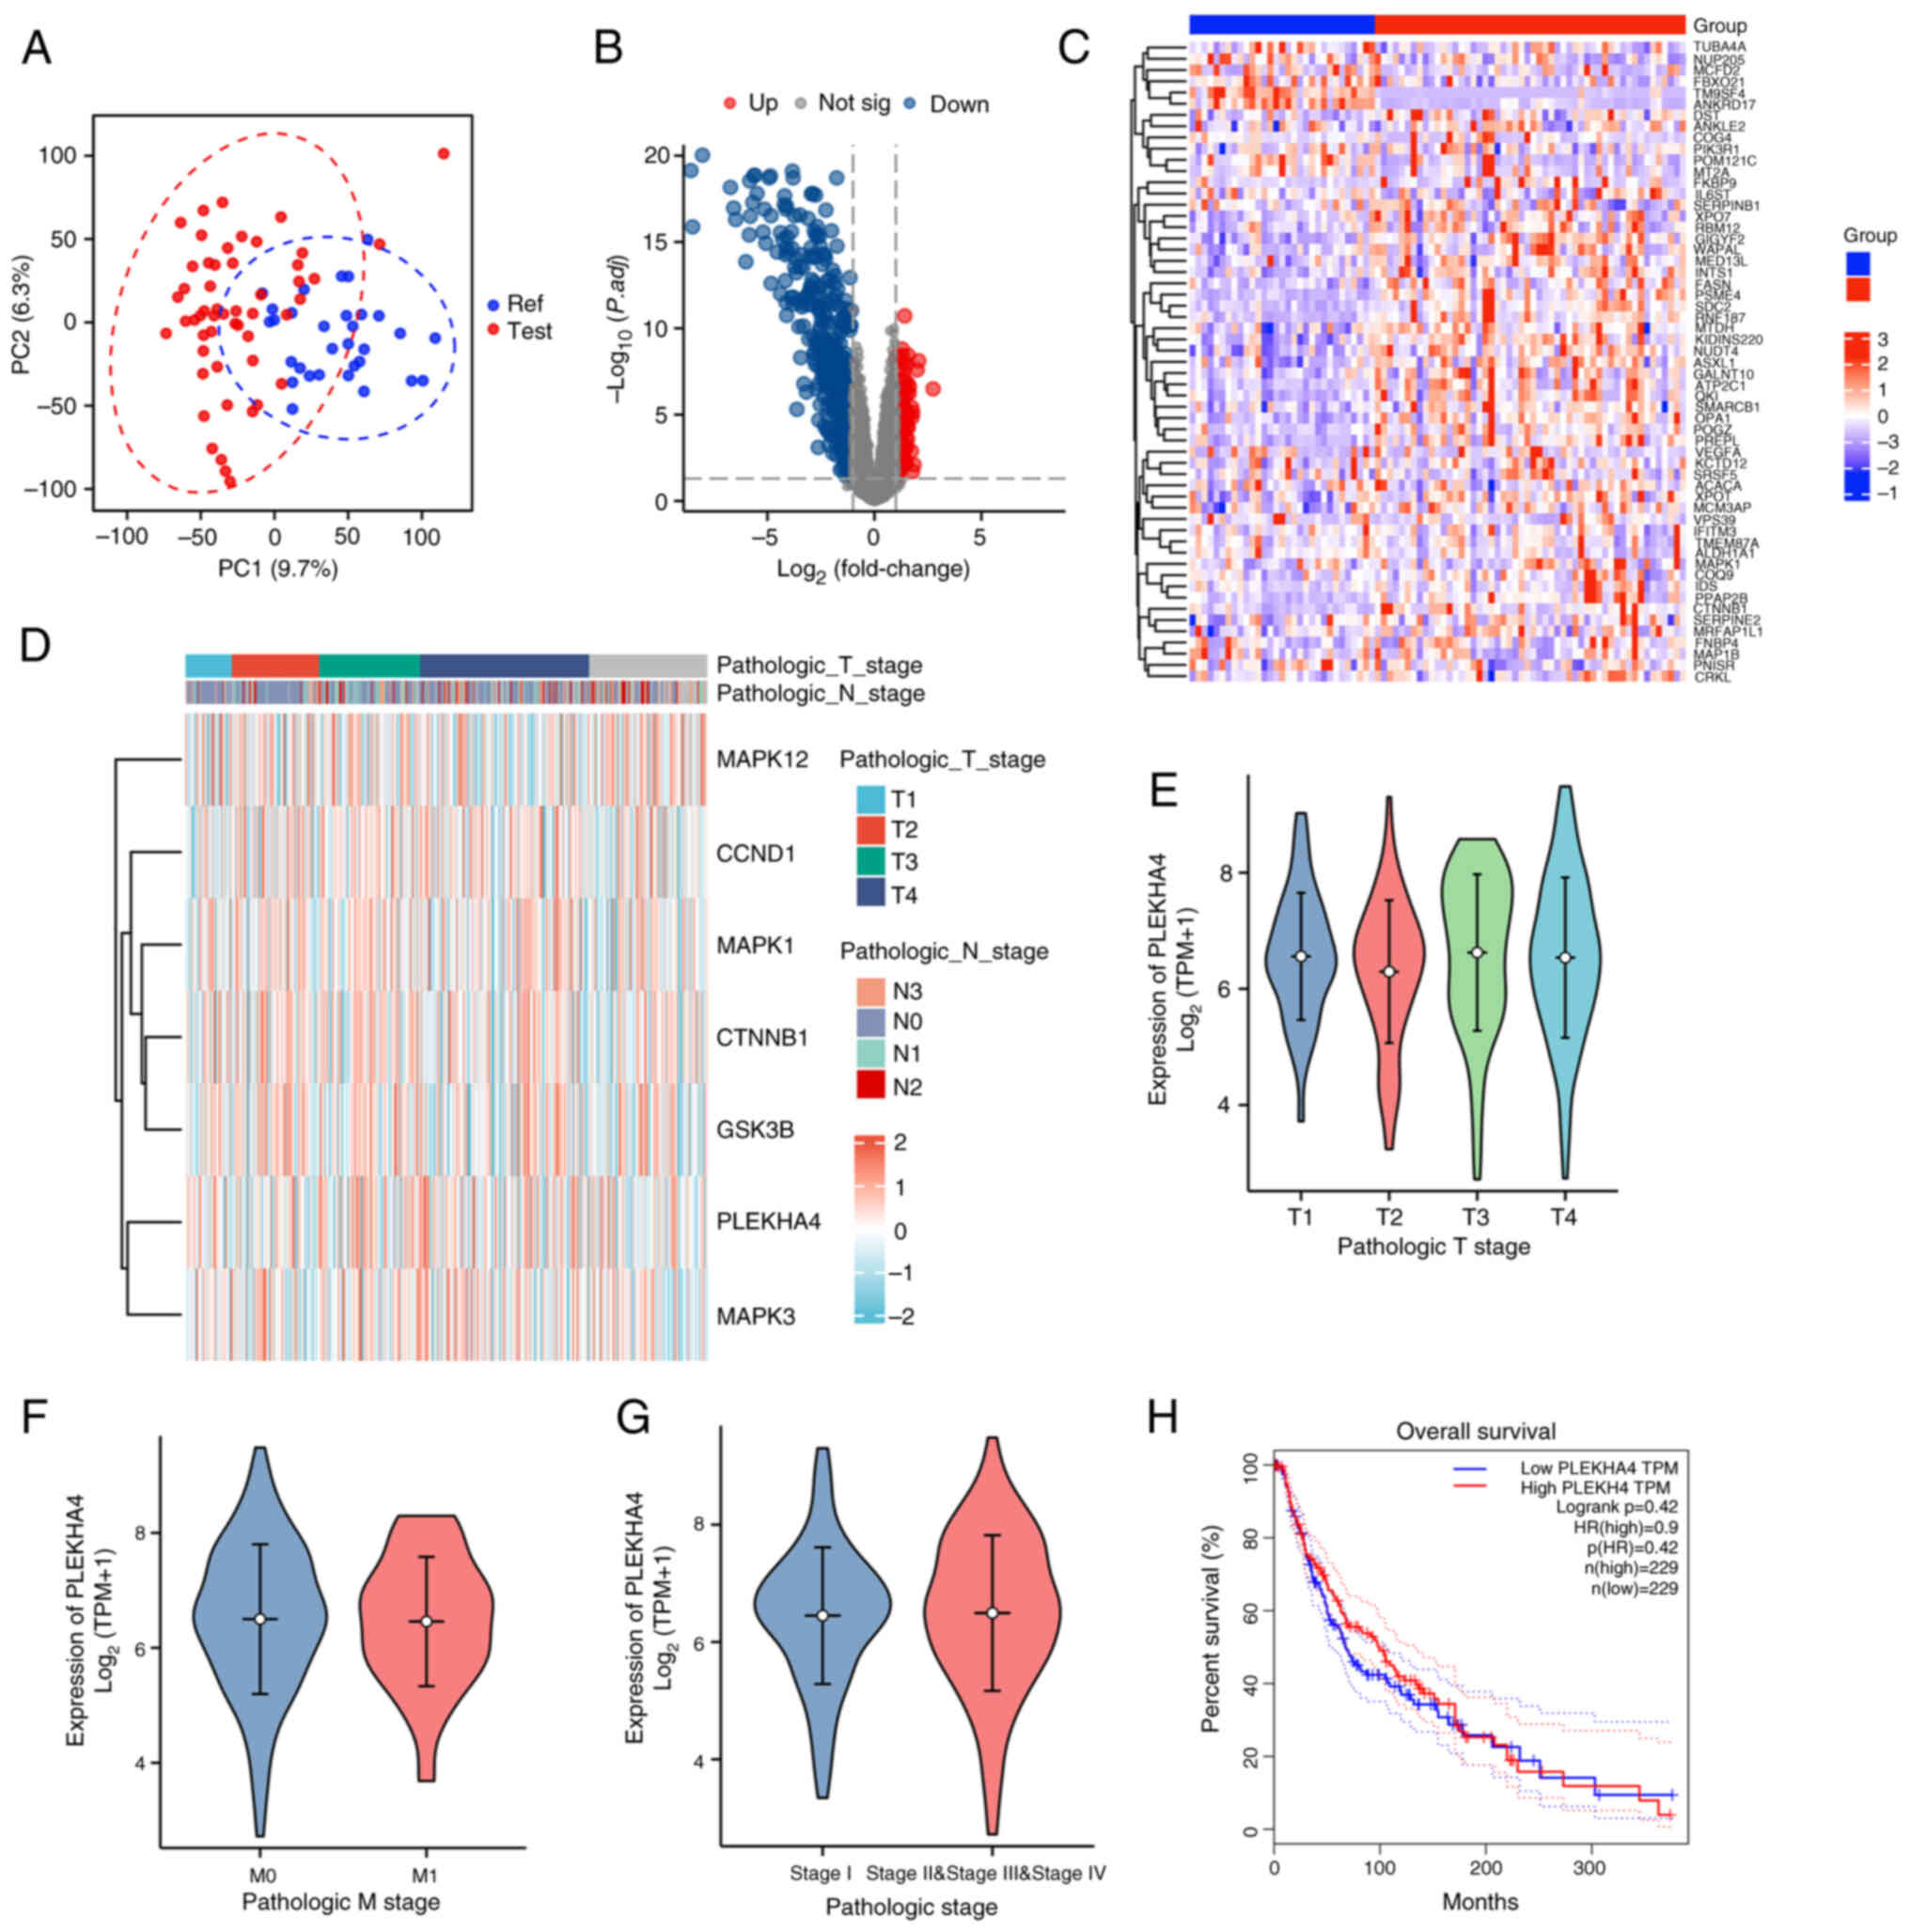
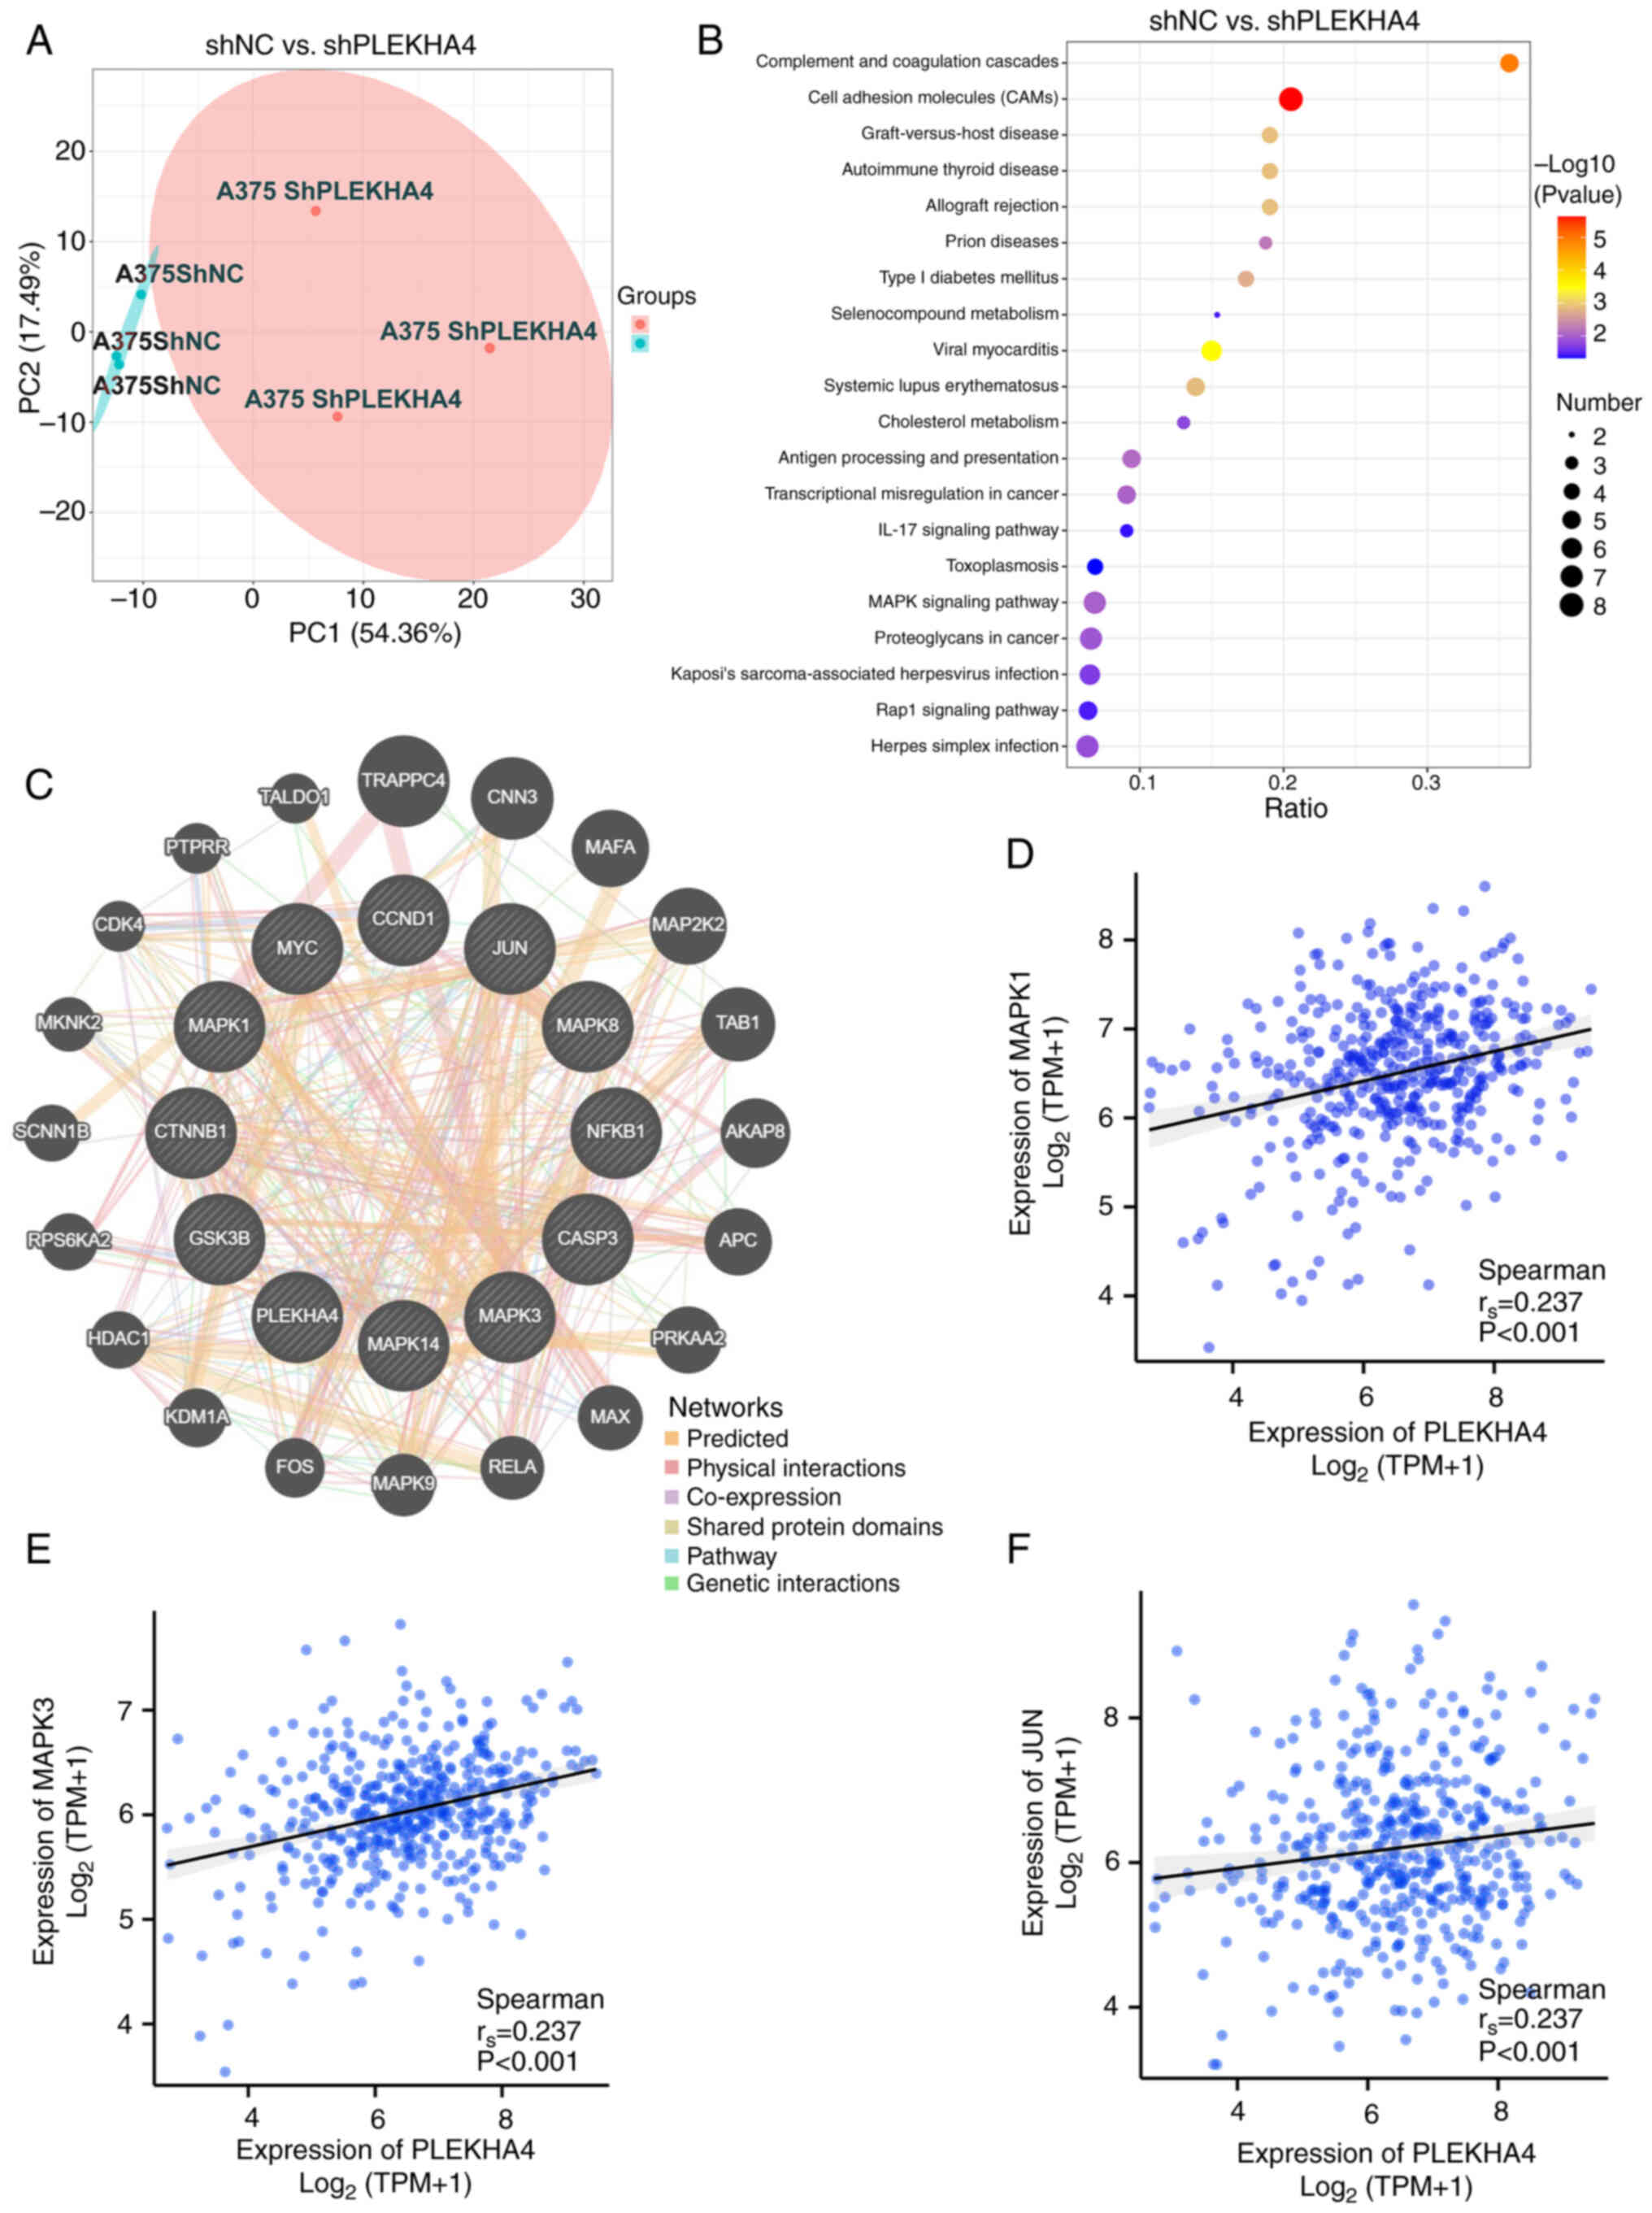
PLEKHA4 (Fig. 1E). Furthermore, as
depicted in Fig. 2A, metastatic
tumor tissues exhibited a pronounced gene expression profile
relative to primary tumor tissues. The volcano plot and heatmap in
Fig. 2B and C revealed distinct
genes in melanoma metastatic tissues; however, PLEKHA4 was not
among them, suggesting that PLEKHA4 may not be involved in melanoma
metastasis. Additionally, PLEKHA4 expression across different
pathological stages showed no significant variation (Fig. 2D-G), and its expression was not
directly associated with overall survival outcomes (Fig. 2H), further suggesting that PLEKHA4
may not be involved in metastasis. To further explore the role of
PLEKHA4 in melanoma, KEGG combined with GO analyses were performed.
The results highlighted an upregulation of ‘beta-catenin binding’,
suggesting activation of the Wnt signaling pathway in melanoma
tissues (Fig. 1G). Additionally,
the heatmap across different pathological stages (Fig. 2D) revealed high expression levels
of PLEKHA4 along with key MAPK signaling genes (MAPK1, MAPK3 and
MAPK12), and Wnt signaling genes (CTNNB1 and GSK3B).
PLEKHA4 knockdown inhibits the
proliferation of melanoma cells
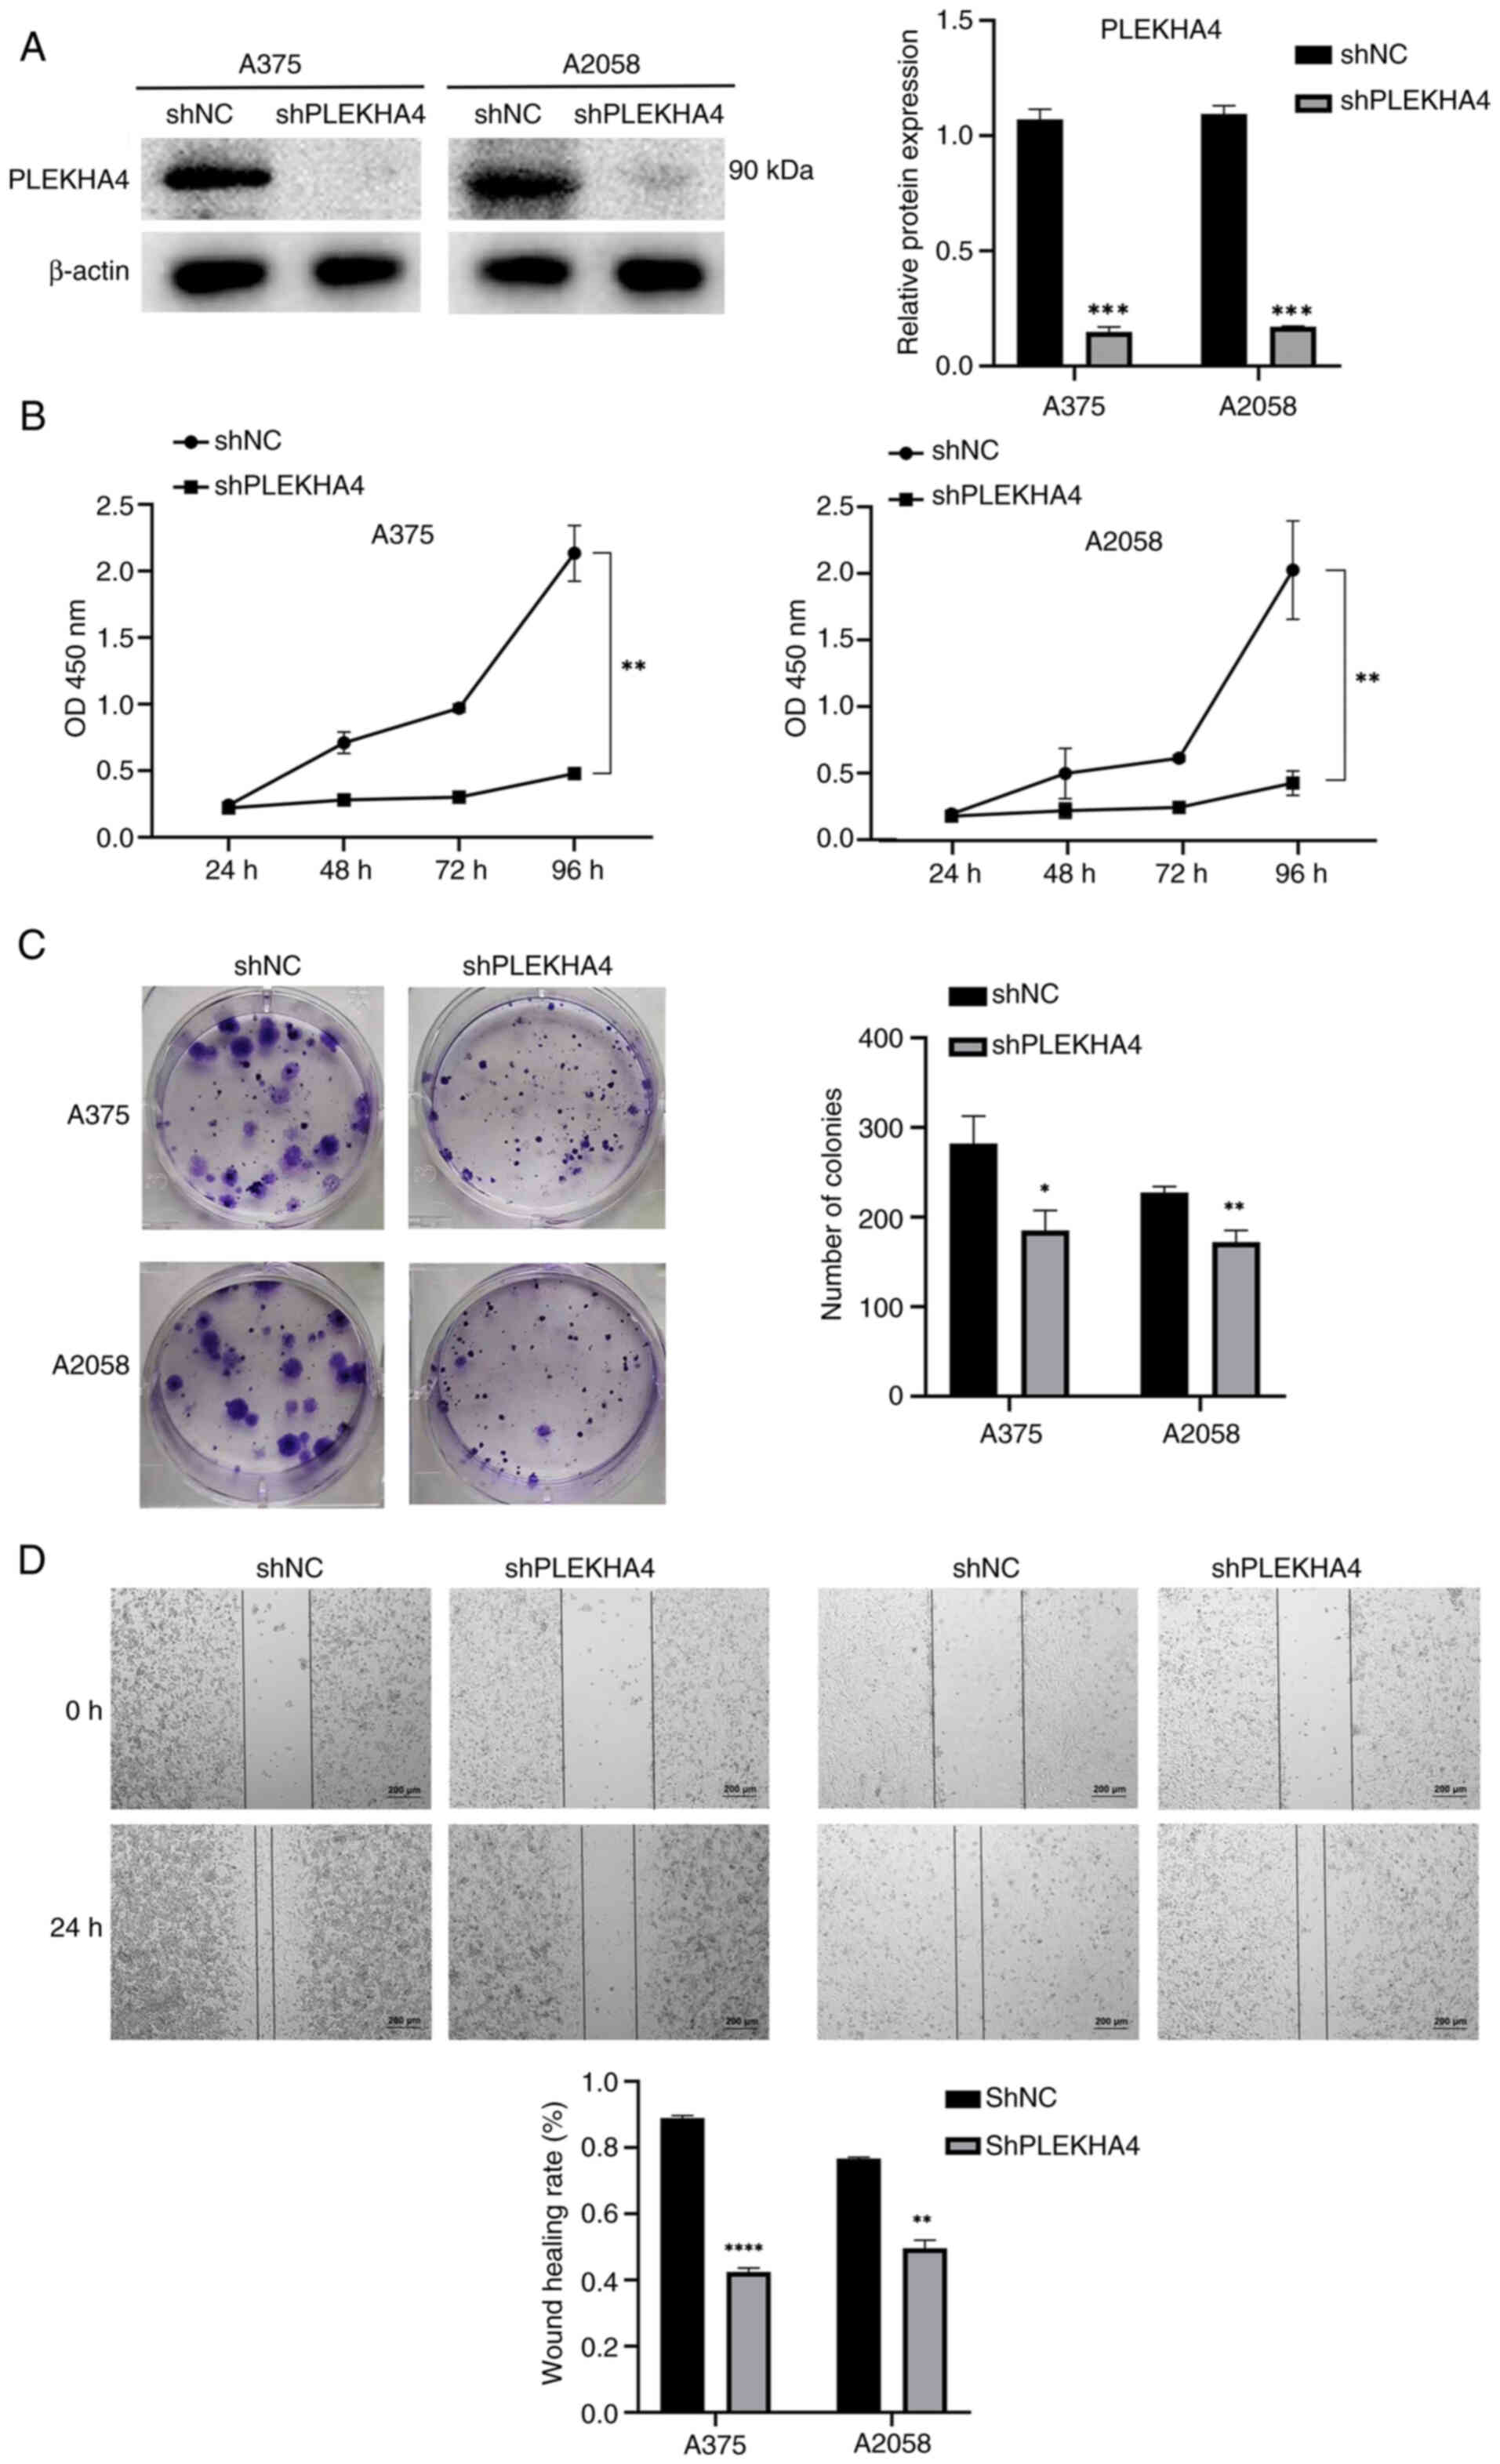
PLEKHA4 knockdown experiments were conducted in A375
and A2058 melanoma cell lines; notably, a significant reduction in
PLEKHA4 protein expression was detected in the A375 and A2058 cells
lines following shRNA transduction (Fig. 3A). Subsequent assessments through
CCK-8, colony formation and wound healing assays were conducted to
evaluate cell proliferation and migration. Knockdown of PLEKHA4
resulted in the inhibition of cell proliferation, colony formation
and migration (Fig. 3B-D).
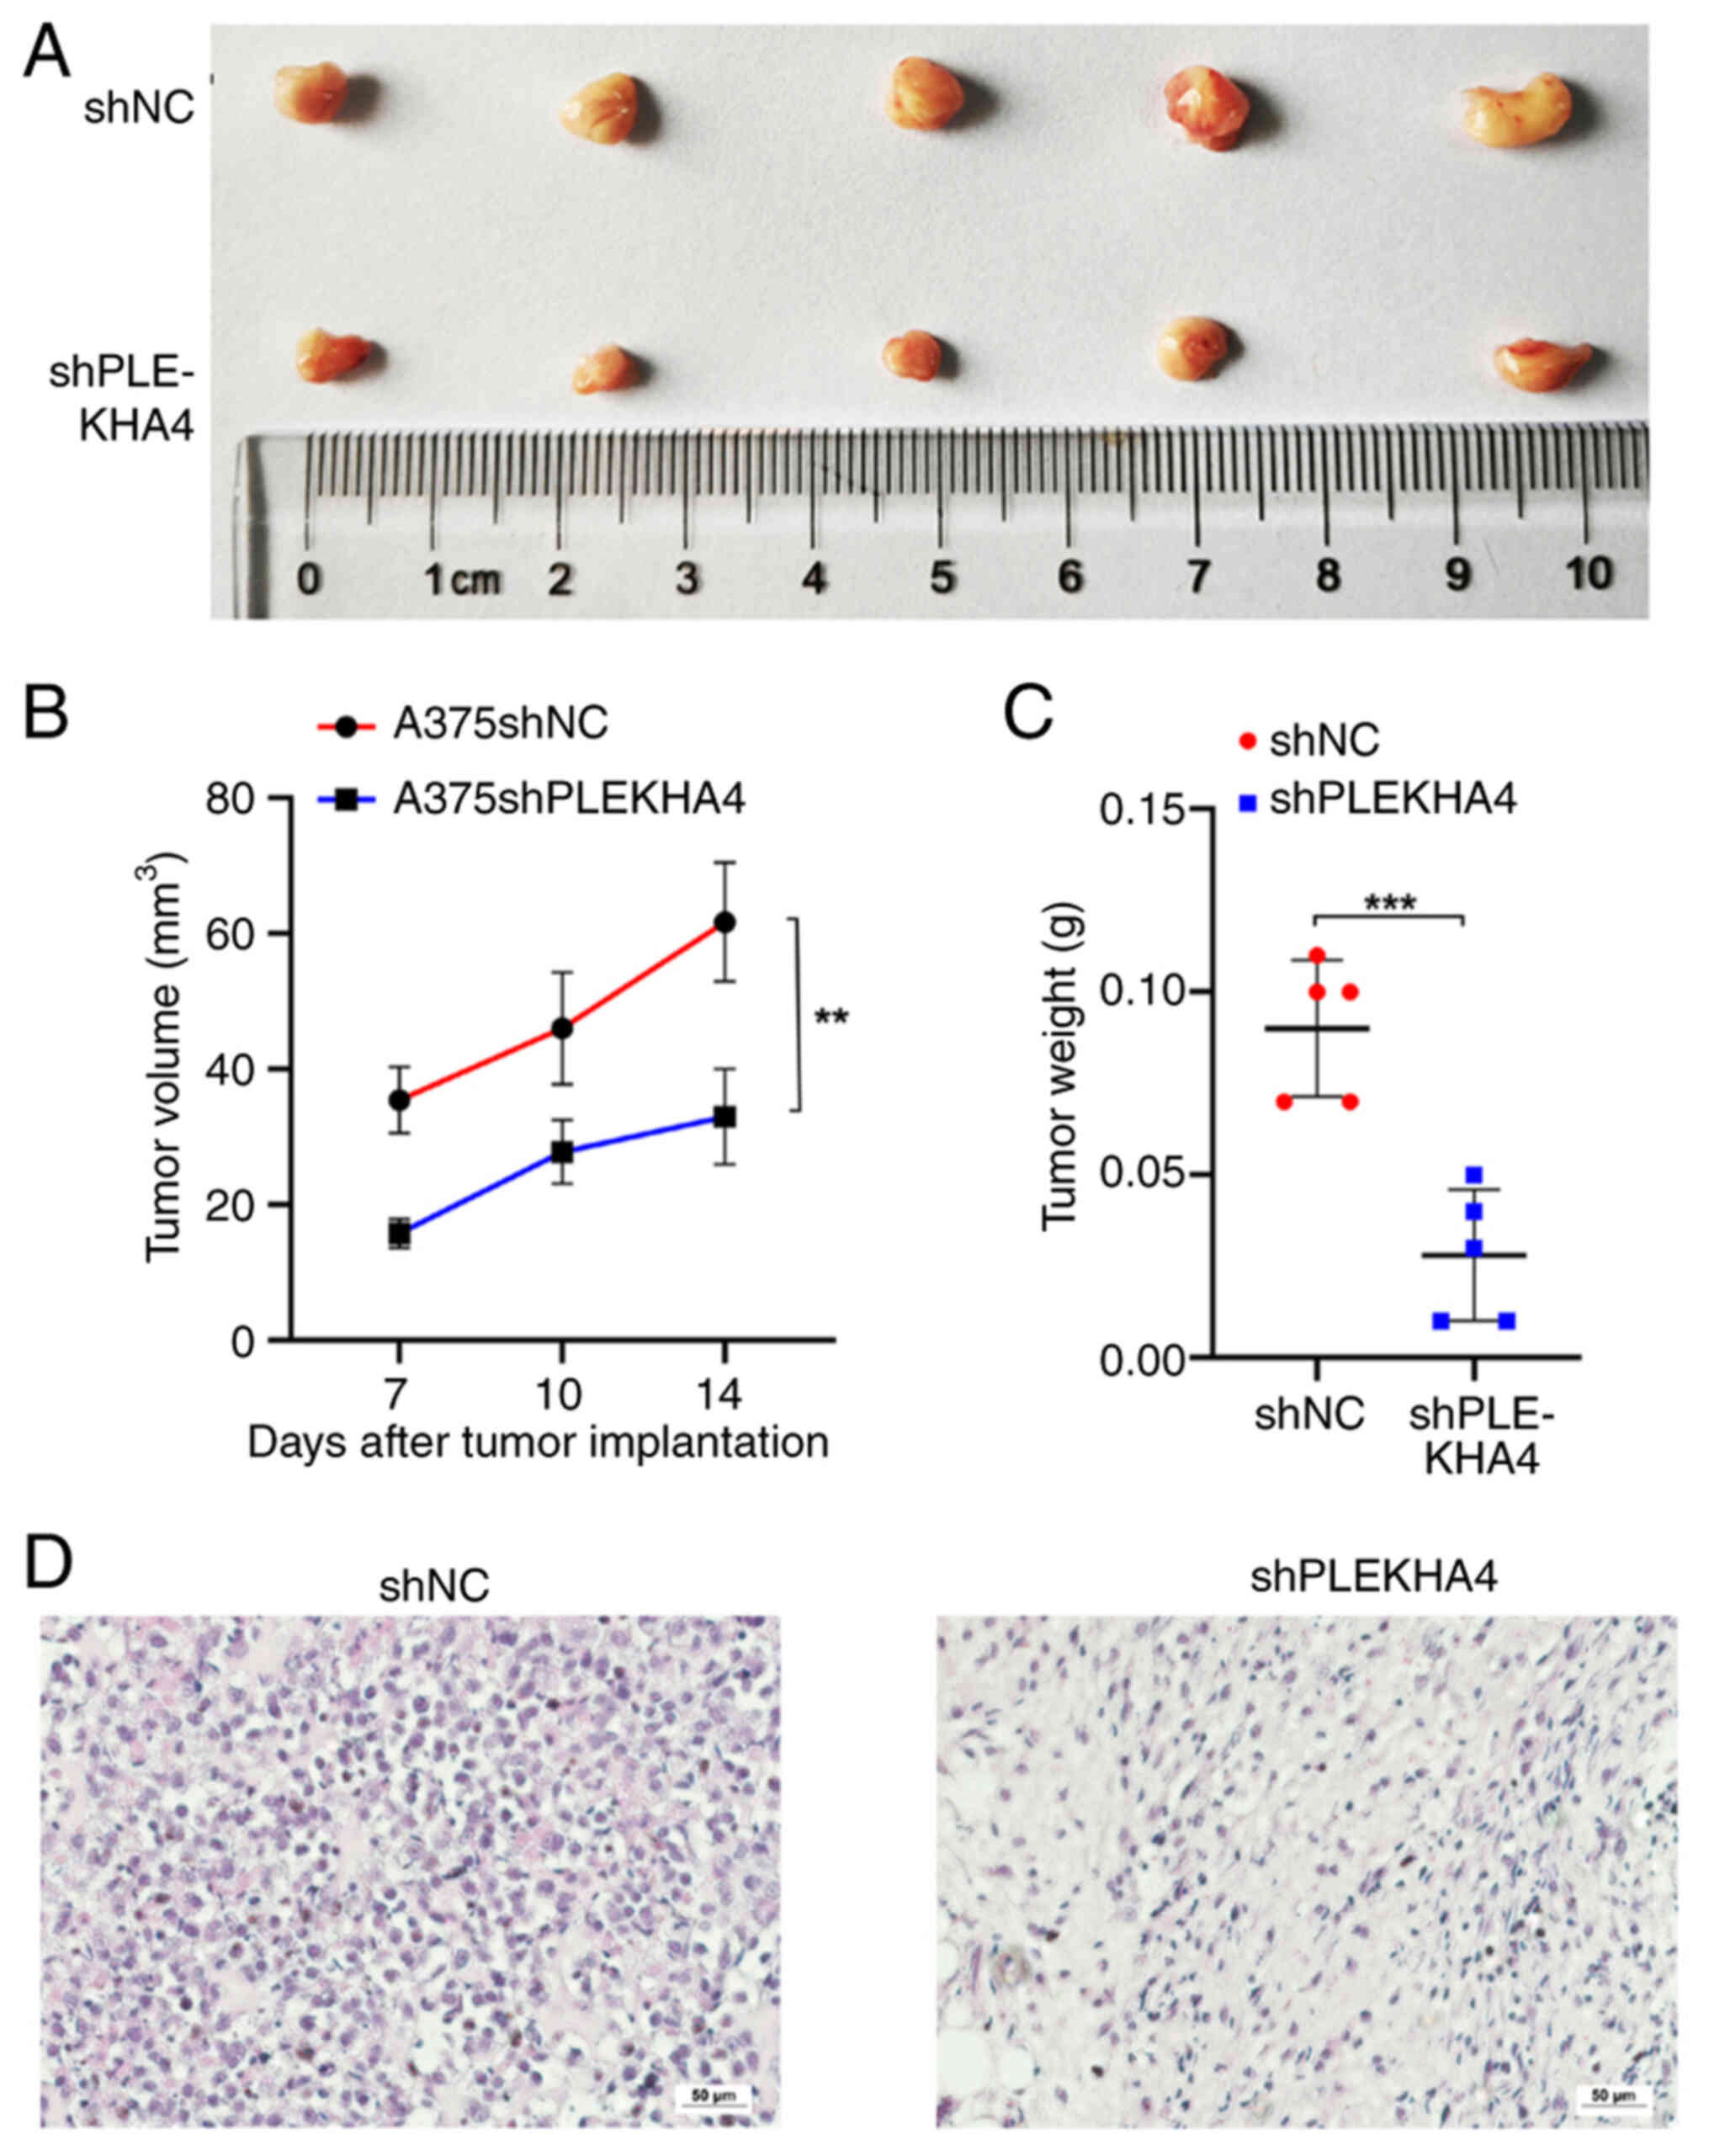
Subsequently, subcutaneous tumor growth models were established to
assess the effect of PLEKHA4 on tumor development. Notably, PLEKHA4
knockdown significantly reduced tumor growth (Fig. 4A-C). Tumors in the A375shPLEKHA4
group grew more slowly than those in the A375shNC group (Fig. 4B), and tumor weight in the
A375shPLEKHA4 group was lower compared to that in the A375shNC
group (Fig. 4C). Following tumor
collection, histological analysis was conducted through H&E
staining. Cells in the shPLEKHA4 group exhibited lighter staining,
were smaller and showed greater heterogeneity compared with those
in the shNC group (Fig. 4D).
PLEKHA4 knockdown inhibits MAPK
signaling in melanoma
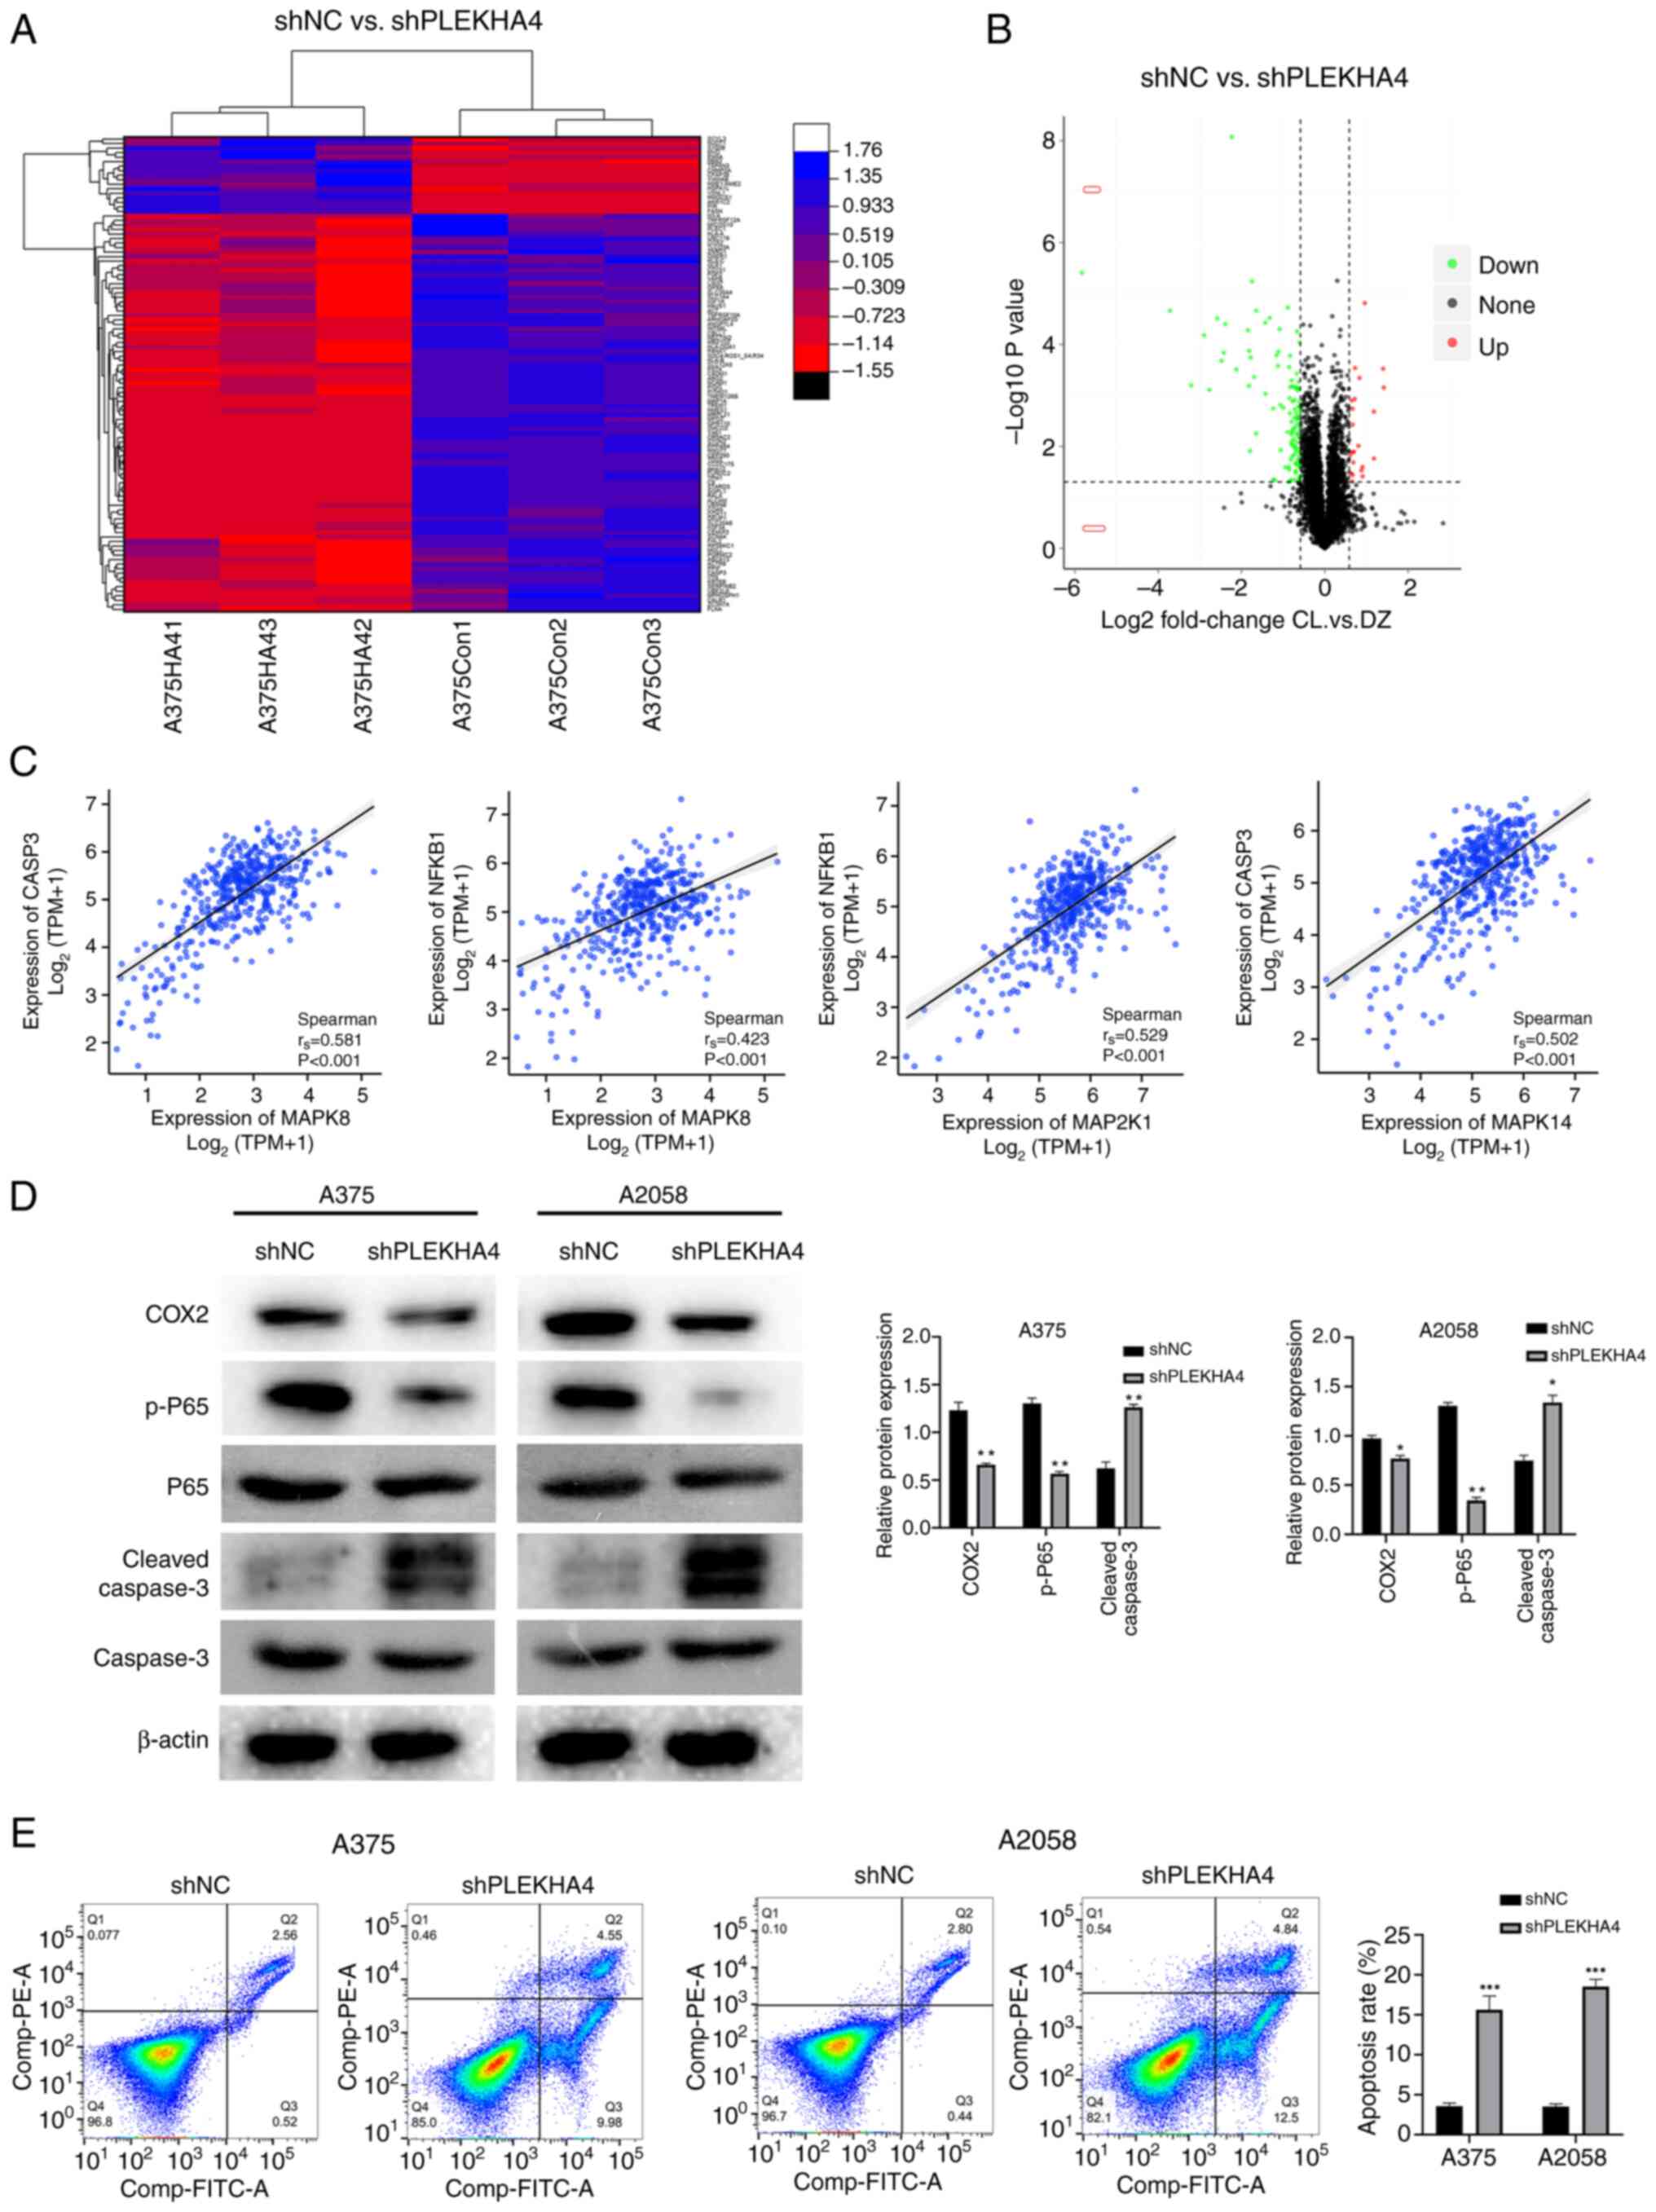
TMT proteomics analysis has evolved as an important
technology for investigating abnormal signaling and therapeutic
responses in cancer. As shown in Fig.
5A, shPLEKHA4-transduced A375 cells exhibited a distinct
proteomic profile compared with those transduced with shNC.
Subsequently, KEGG enrichment analysis was conducted using the TMT
proteomics data. As depicted in Fig.
5B, the differentially expressed proteins were enriched in the
‘MAPK signaling pathway’. Utilizing GeneMANIA, the interactions of
PLEKHA4 with proteins in the MAPK pathway were further explored
(Fig. 5C). PLEKHA4 was found to
have physical interactions with MAPK1 (ERK), MAPK9 (JNK) and MAP2K2
(MEK2). Additionally, correlation analysis unveiled a positive
relationship between PLEKHA4 expression and MAPK1 (ERK2), MAPK3
(ERK1) and JUN (cJUN) (Fig. 5D-F)
Although the r-values were <0.3, the P-values indicated
statistical significance, suggesting that the relationship is
unlikely to be random and warrants further investigation. Weak
correlations may still hold biological significance, especially in
multi-factorial systems where individual contributions are
inherently subtle. Additionally, this is a gene-level correlation,
and further validation at the protein level through western
blotting is necessary to confirm these findings. Subsequent
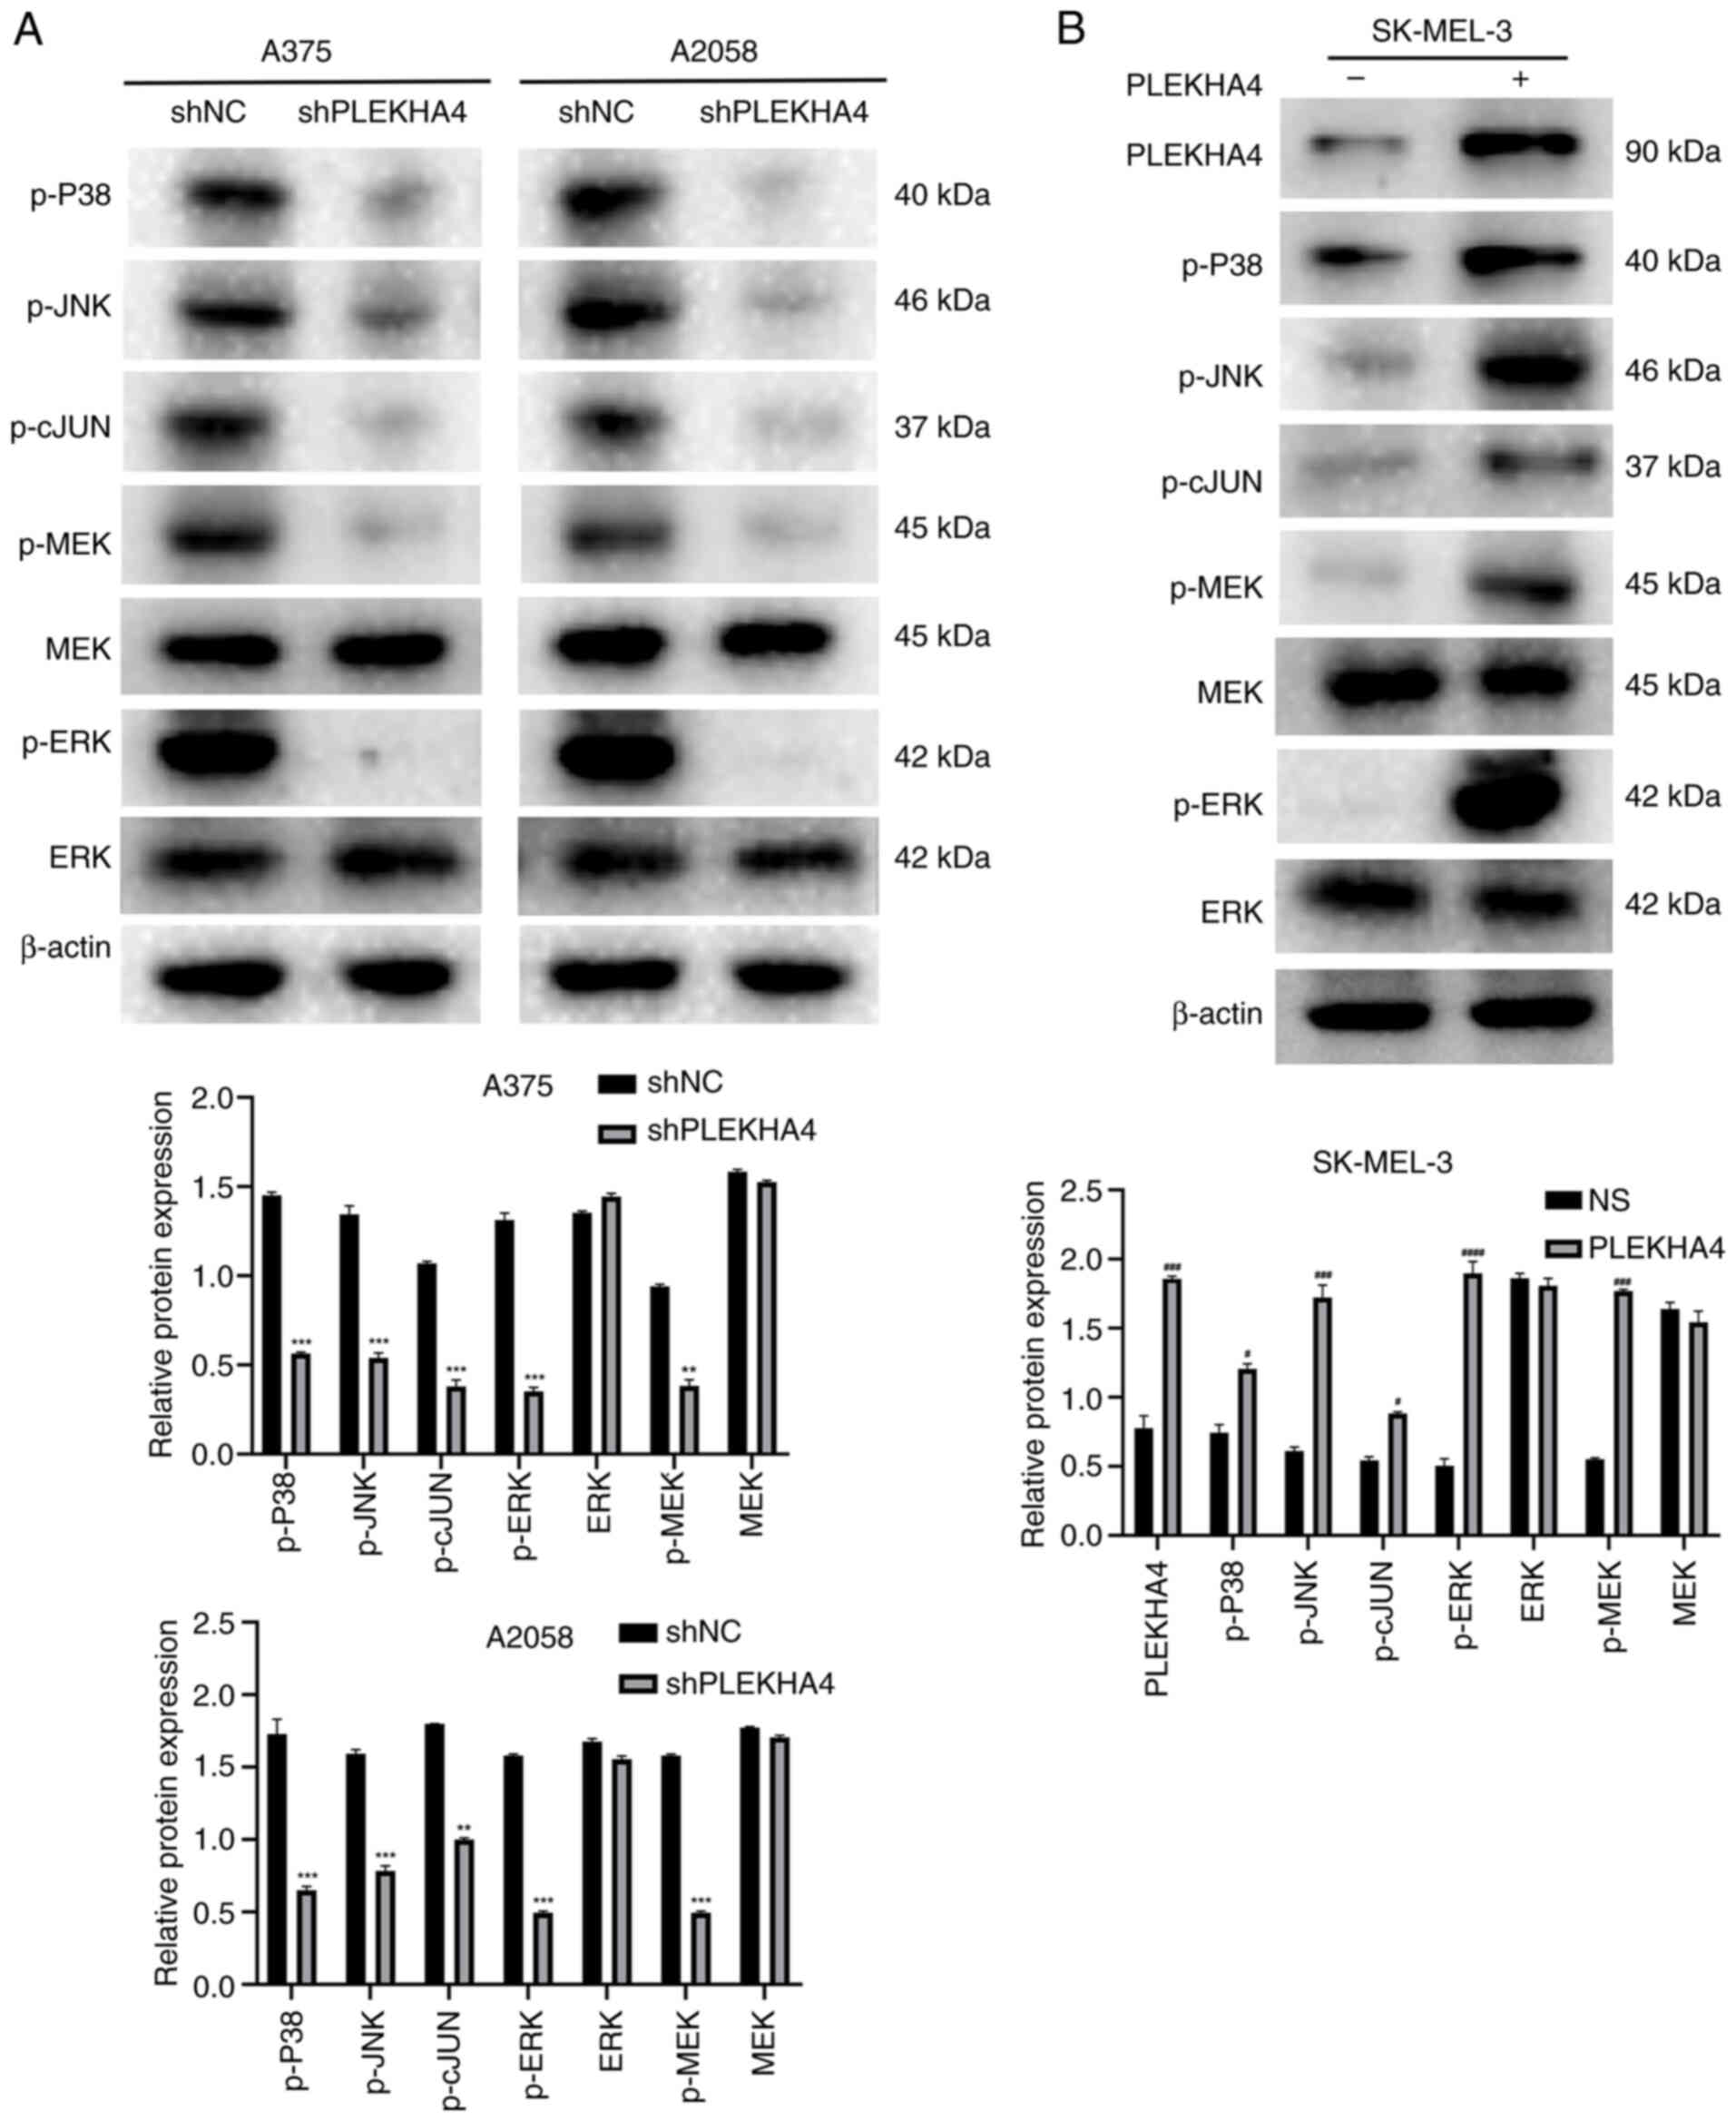
validation through western blotting demonstrated that following
PLEKHA4 knockdown, the levels of p-P38, p-JNK, p-cJUN, p-MEK and
p-ERK were diminished (Fig. 6A).
In addition, an overexpression assay was conducted to examine the
effects of PLEKHA4 overexpression on cells with low PLEKHA4 levels.
The results indicated that PLEKHA4 overexpression successfully
upregulated MAPK signaling in SK-MEL-3 cells (Fig. 6B). Collectively, these results
indicated that PLEKHA4 may affect the MAPK pathway in melanoma.
Melanoma cell apoptosis is induced
after PLEKHA4 knockdown
Quantitative analysis of alterations in the A375
cell proteome following PLEKHA4 gene silencing was conducted using
mass spectrometry (Fig. 7A and B).
A total of 6,206 proteins were quantified, with 133 peptides that
reached an FDR-corrected P<0.05; among these, 23 were
upregulated >5-fold and 111 were downregulated <5-fold in the
shPLEKHA4 group compared with in the shNC group (Table SI). Notably, these dysregulated
peptides encompassed sites known to regulate various apoptotic and
proliferative molecules. Specifically, the substantial reduction of
caspase-3 in PLEKHA4knockdown cells, was associated with apoptosis
(Table SI). Additionally, a
significant reduction was observed in COX2 levels in PLEKHA4
knockdown cells (Table SI),
consistent with the findings from GeneMANIA (Fig. 5C). Subsequent expression
correlation analysis revealed a correlation between NFKB1 (p65) and
CASP3 (with genes in the MAPK pathways at the mRNA level,
consistent with the outcomes depicted in GeneMANIA (Fig. 7C). To confirm the aforementioned
results, western blotting was conducted to assess protein levels in
shNC cells and PLEKHA4 knockdown cells. The results showed that the
protein levels of COX2 and p-p65 were reduced, whereas the levels
of cleaved caspase-3 were increased (Fig. 7D). Subsequently, flow cytometry was
performed to compare the apoptotic effects between the shNC and
shPLEKHA4 groups. The findings indicated an elevation in apoptosis
in the shPLEKHA4 cells (Fig.
7E).
PLEKHA4 modulates Wnt/β-catenin
signaling in melanoma cells
Given the upregulation of Wnt signaling-related
proteins observed in melanoma (Fig.
2D), a correlation analysis focusing on β-catenin was initially
performed. The analysis revealed significant correlations between
CTNNB1 and MAPK1, MAPK8, and MAPK14, highlighting a potential
interaction between β-catenin and these MAPK family members
(Fig. 8A). Subsequently, Wnt
signaling proteins (p-GSK3β, β-catenin and cyclin D1) were examined
and their levels were shown to be reduced following PLEKHA4
knockdown (Fig. 8B). The nuclear
translocation of β-catenin is crucial for initiating gene
transcription and promoting tumorigenesis. Upon PLEKHA4 knockdown,
β-catenin levels decreased in both total and nuclear fractions,
while cytosolic β-catenin levels significantly increased (Fig. 8B and C). These findings indicated
that PLEKHA4 may promote the nuclear translocation of β-catenin. To
further investigate its effect on the Wnt/β-catenin pathway,
melanoma cells were treated with the Wnt signaling activator LiCl
following PLEKHA4 knockdown. Western blotting revealed that LiCl
reversed the changes induced by PLEKHA4 knockdown (Fig. 8D). Additionally, an overexpression
assay in SK-MEL-3 cells demonstrated that PLEKHA4 overexpression
successfully upregulated Wnt/β-catenin signaling proteins (Fig. 8E). These findings suggested that
PLEKHA4 may regulate Wnt/β-catenin signaling in melanoma cells.
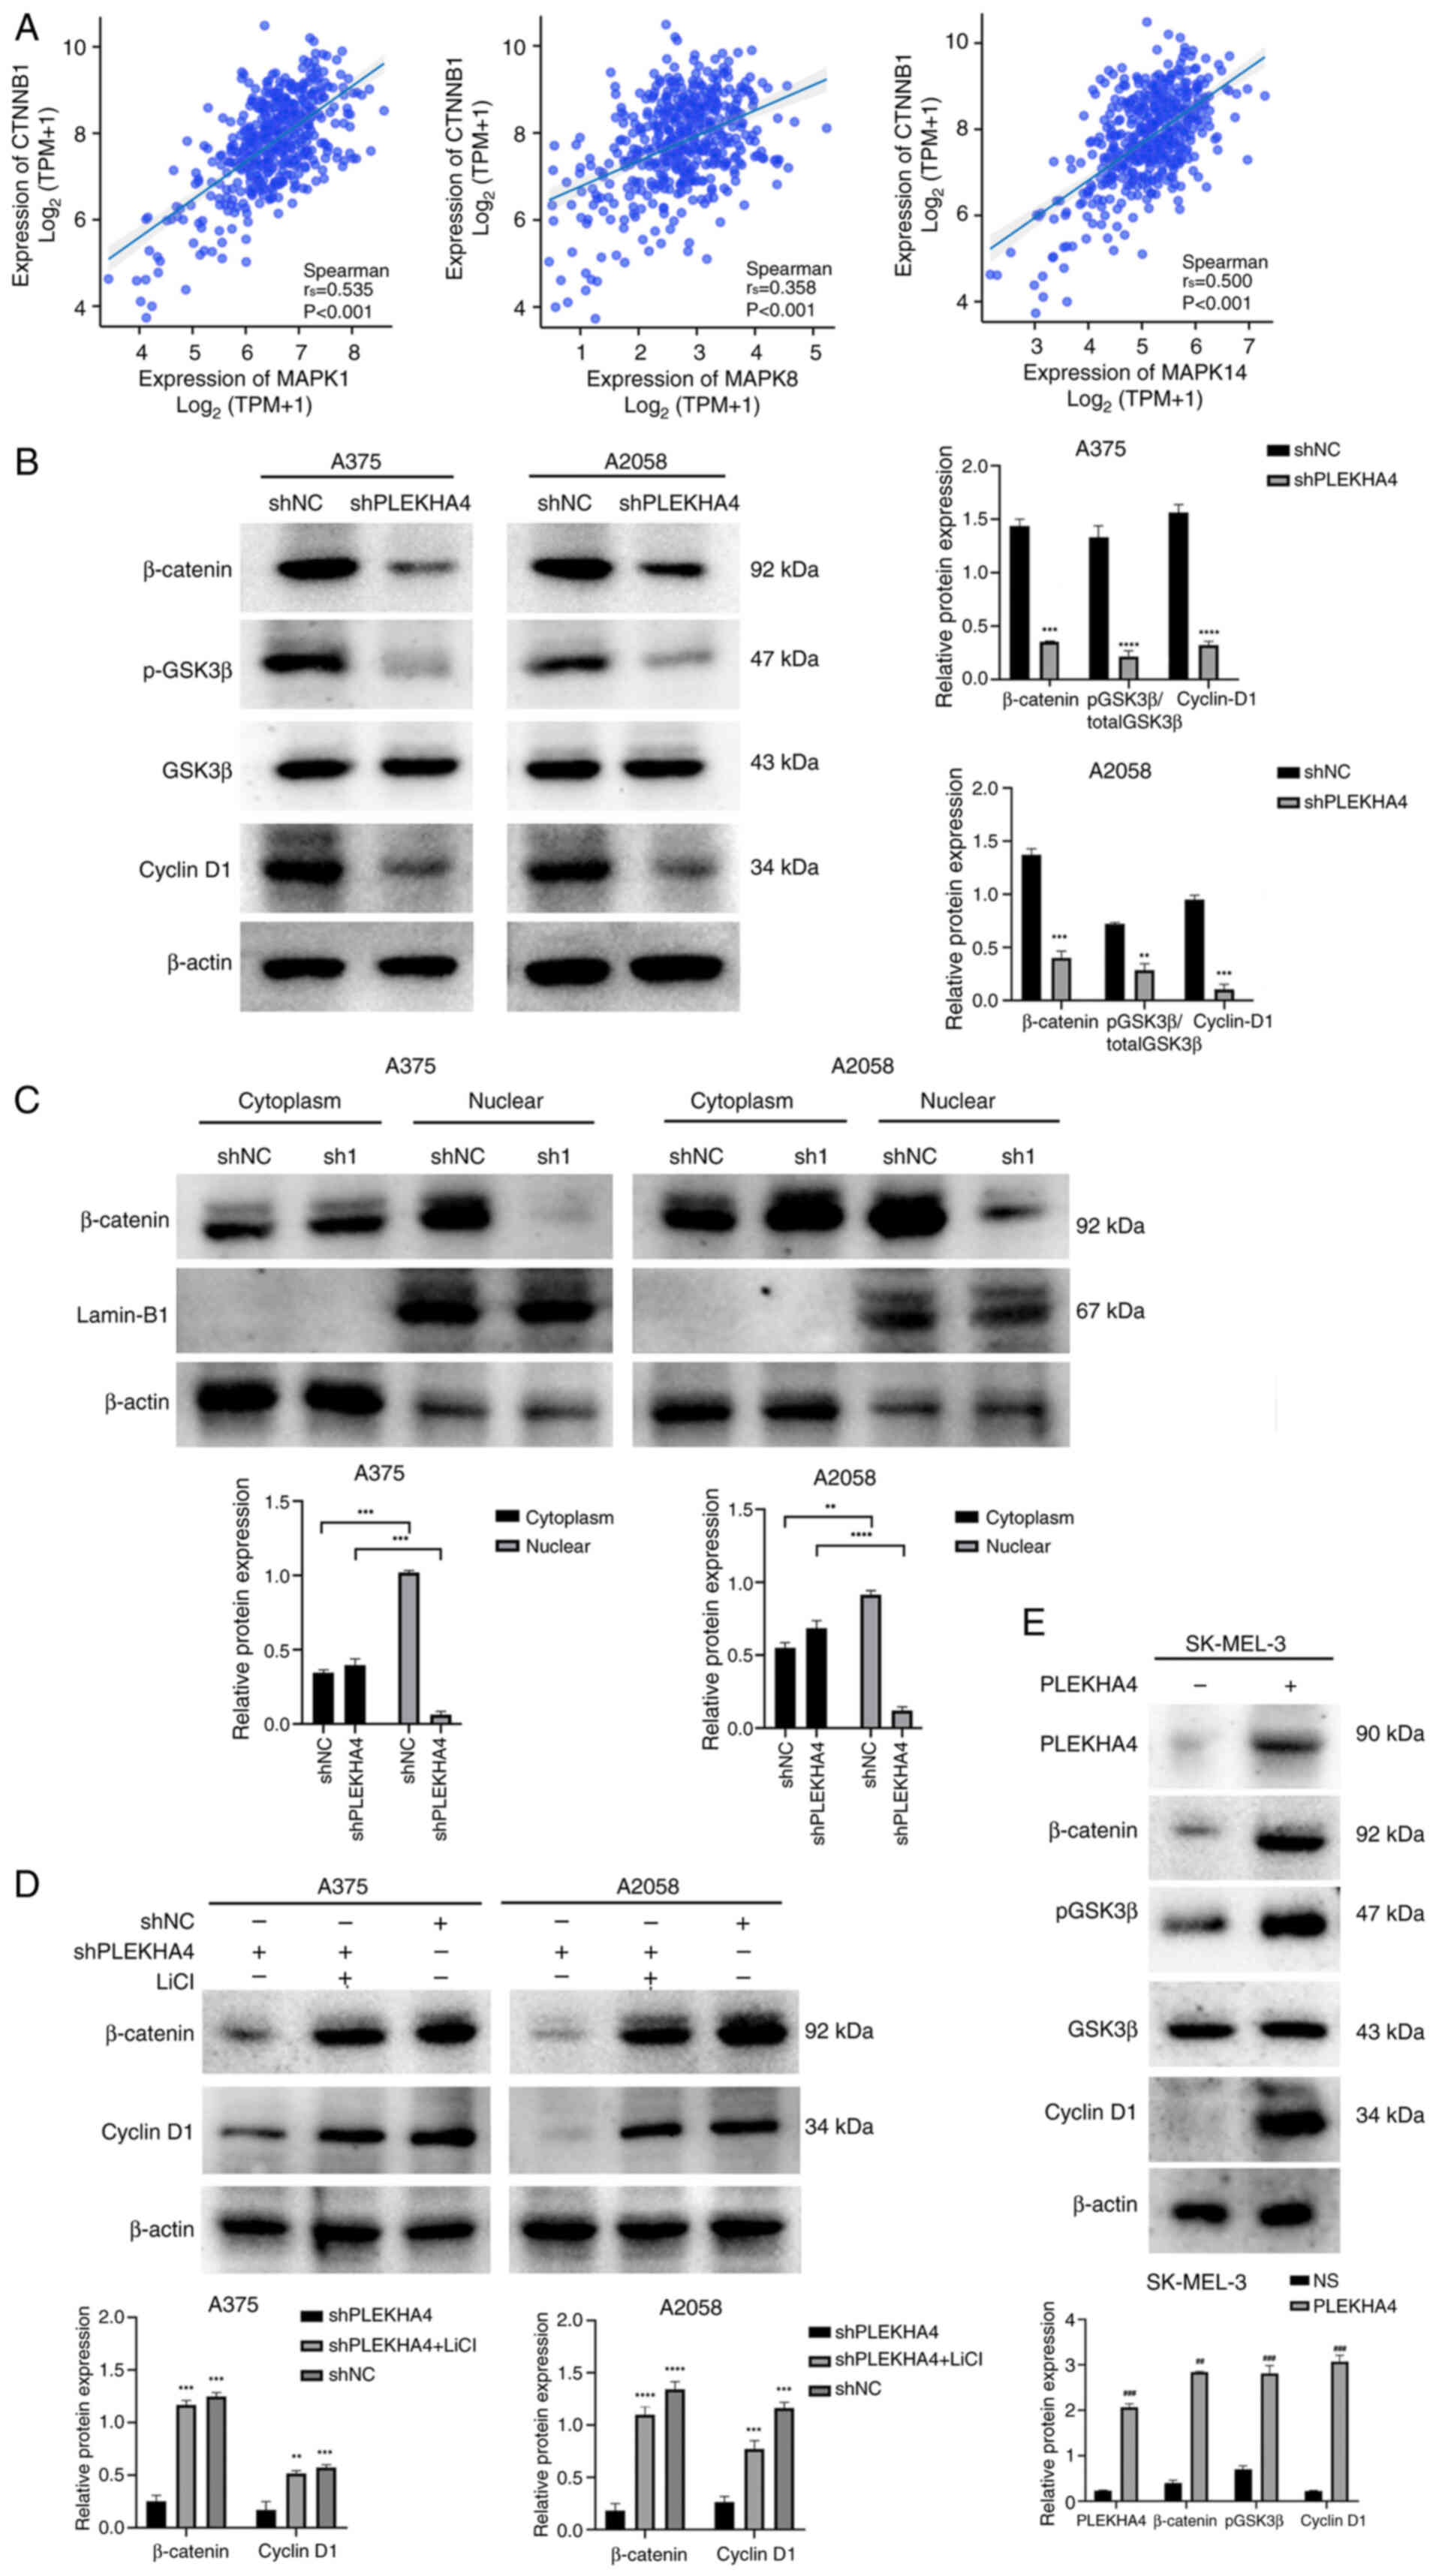 | Figure 8.PLEKHA4 regulates the β-catenin
pathway in melanoma. (A) Correlation of CTNNB1 with MAPK1, MAPK8
and MAPK14 in melanoma. (B) Western blotting revealed that PLEKHA4
knockdown reduced the expression of β-catenin, p-GSK3β and cyclin
D1. (C) PLEKHA4 knockdown affected the subcellular localization of
β-catenin in A375 and A2058 cells. (D) LiCl treatment reversed the
protein expression changes induced by PLEKHA4 knockdown. (E)
Overexpression of PLEKHA4 in SK-MEL-3 cells increased the levels of
β-catenin, p-GSK3β and cyclin D1. **P<0.01, ***P<0.001 and
****P<0.0001 vs. shNC or as indicated. ##P<0.01,
###P<0.001 vs. NS. PLEKHA4, pleckstrin homology
domain-containing family A member 4; sh, short hairpin; NC,
negative control; NS, empty vector; p-, phosphorylated; LiCl,
lithium chloride. |
cMyc ubiquitination is inhibited after
PLEKHA4 knockdown
cMyc is dysregulated in ~70% of human cancer cases,
with substantial evidence linking aberrant cMyc expression to both
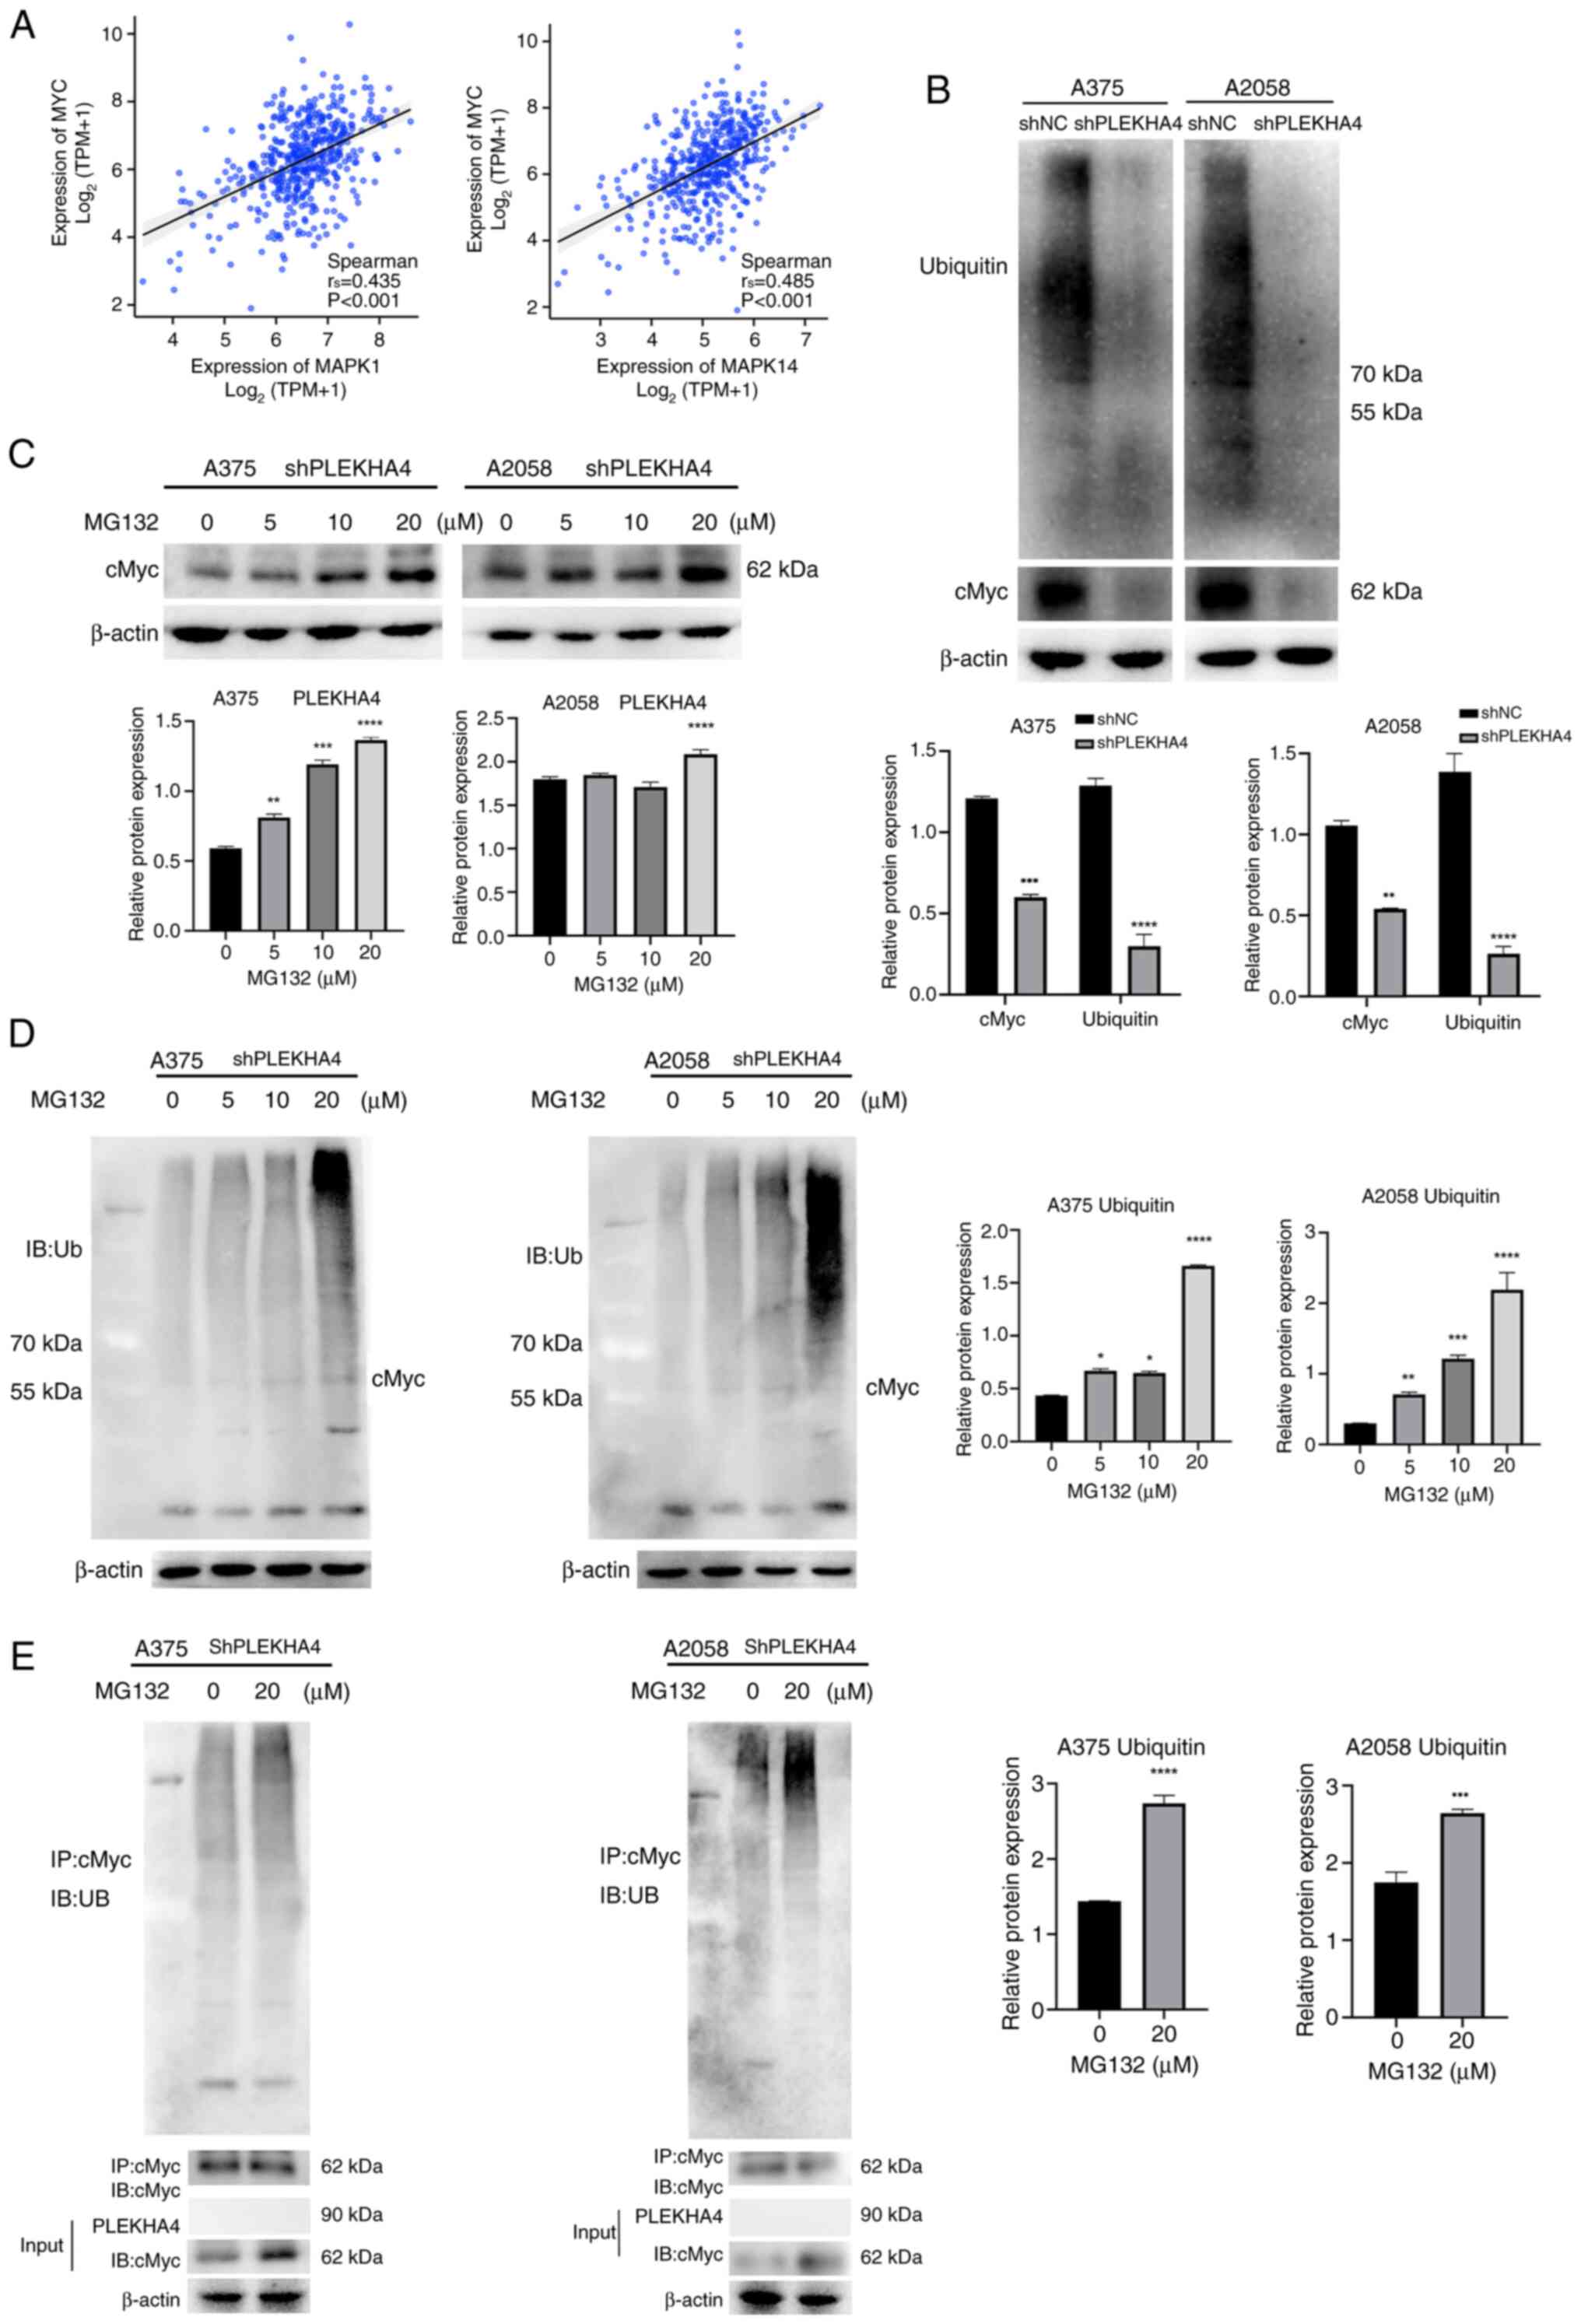
tumor initiation and maintenance (18). GeneMANIA results indicated that
cMyc has physical interactions with multiple members in MAPK
pathway (Fig. 5C). Subsequently, a
correlation analysis was performed and it was revealed that MYC was
positively correlated with MAPK1 and MAPK14 (Fig. 9A). Subsequent western blot analysis
was conducted to investigate cMyc expression following the
inhibition of MAPK signaling in PLEKHA4 knockdown melanoma cells.
PLEKHA4 knockdown markedly reduced cMyc and ubiquitin expression at
the protein level (Fig. 9B). cMyc,
as an unstable protein, has a half-life of <30 min in
non-transformed cells and is rapidly degraded mainly by the
ubiquitin-proteasome pathway (19). To examine whether cMyc was
stabilized through the ubiquitin-proteasome pathway, shPLEKHA4
melanoma cells were treated with different concentrations of the
proteasome inhibitor MG132 (0, 5, 10 and 20 µM). cMyc protein
expression was rescued by different concentrations of MG132
(Fig. 9C), suggesting that cMyc
degradation could be inhibited via the ubiquitin-proteasome
pathway. A higher concentration of MG132 resulted in a higher level
of cMyc protein. Subsequently, a ubiquitination assay was employed
to detect the influence of PLEKHA4 on cMyc ubiquitination. As
revealed in Fig. 9D, MG132
markedly upregulated cMyc polyubiquitination, with higher MG132
concentrations resulting in elevated levels. Furthermore,
co-immunoprecipitation was conducted to test cMyc
polyubiquitination. As shown in Fig.
9E, cMyc and ubiquitin were detected; however, PLEKHA4 was not
detected. This suggests that the PLEKHA4 does not directly interact
with cMyc polyubiquitination; however, knockdown of PLEKHA4
resulted in decreased cMyc expression and its ubiquitination, thus
suggesting that PLEKHA4 may regulate cMyc and its
polyubiquitination indirectly, possibly through another molecule.
In Fig. 9E, although PLEKHA4 was
knocked down, MG132 still increased cMyc ubiquitination in its
absence, thus indicating that while PLEKHA4 may influence cMyc
ubiquitination, other pathways or factors may also be involved in
regulating this process. Collectively, these results strongly
suggested that cMyc is degraded and ubiquitinated by the proteasome
system, which may be related to molecules other than PLEKHA4.
Discussion
Initially, it was observed that cell proliferation
was inhibited following PLEKHA4 knockdown. To further investigate
the role of PLEKHA4, additional analyses, including proteomics
analysis, were conducted.
Proteomics analysis revealed that PLEKHA4 knockdown
led to changes in proteins associated with the MAPK pathway and
apoptosis. Subsequently, GeneMANIA analysis was performed. The
GeneMANIA database combines genomics and proteomics data from
sources such as the GEO, BioGRID, Ensembl and Pathway Commons. To
validate the results from GeneMANIA, correlation analyses were
conducted. The analyses were performed using RNA sequencing data
from TCGA-SKCM project, a widely recognized and reliable database.
The authors recognize the need for further experiments to validate
molecular interactions and plan to explore these mechanisms in
future studies. Furthermore, the bioinformatics investigations
unveiled the activation of the MAPK and β-catenin pathways in
melanoma, and the correlation analysis revealed the interaction
between β-catenin and MAPK pathway genes in melanoma. Notably, up
to 90% of melanoma cases exhibit aberrant MAPK pathway activation,
disrupting the cell cycle and impeding apoptosis (22). Western blotting revealed that
PLEKHA4 knockdown affected both the expression and activation of
ERK, while also suppressing p38, JNK and cJUN activation. In cancer
cells, aberrant protein expression in the JNK and p38 MAPK pathways
is frequently observed. Research has indicated that elevated JNK
and p38 MAPK signaling can promote tumor growth and facilitate
cancer cell invasion (23,24). Conversely, it has also been
suggested that downregulation of p38 MAPK signaling in tumor cells
contributes to anoikis resistance and enhances the survival of
circulating cancer cells (24).
Therefore, the role of JNK and p38 MAPK signaling in cancer remains
a topic of debate.
ERK can act as an antiapoptotic agent by
downregulating proapoptotic proteins and upregulating antiapoptotic
proteins through transcriptional and post-translational mechanisms
(25). Multiple studies have
indicated that ERK can influence mitochondria to trigger cytochrome
c release via pro-apoptotic molecules such as Bax and/or p53
(25,26). Inhibition of the ERK pathway has
been shown to reduce Bax expression induced by cisplatin or
H2O2 (27,28).
The TMT proteomics results showed changes in the expression of the
apoptosis-related proteins COX2 and caspase-3. COX2 prolongs the
G1 phase in cancer cells, thereby suppressing apoptosis
(29,30). Caspase-3 acts as a critical
effector caspase downstream in the apoptotic signaling pathway,
executing the final stages of programmed cell death (31). While suppressing proliferation is
key in cancer therapy, the data of the present study showed that
PLEKHA4 knockdown markedly induced cell apoptosis. Quantitative
proteomics revealed significant changes in apoptosis-related
proteins after PLEKHA4 knockdown, highlighting the role of cell
death pathways. This focus aligns with the goal of exploring
mechanisms that actively eliminate cancer cells rather than just
slowing their growth. In the present study, PLEKHA4 knockdown
reduced COX2 and increased cleaved caspase-3 expression, suggesting
the role of MAPK in regulating apoptosis through interactions with
COX2 and caspase-3. Activation of the MAPK pathway can lead to the
induction of NFκB signaling (32,33).
NFκB activation often inhibits apoptosis by promoting the
transcription of anti-apoptotic genes (34). The present study demonstrated that
downregulation of the MAPK pathway inhibited NFκB activation.
Therefore, these results suggested that knocking down PLEKHA4 may
stimulate melanoma cell apoptosis through MAPK signaling.
PLEKHA4 enhances Wnt signaling by inhibiting the
cullin-3 E3 ubiquitin ligase complex, reducing DVL
polyubiquitination (35).
Silencing PLEKHA4 can impact the expression of cyclin D and cMyc
(36), an effect that the present
study confirmed and could be reversed by the Wnt activator LiCl,
highlighting the pivotal role of PLEKHA4 in Wnt/β-catenin signaling
in melanoma. Additionally, PLEKHA4 knockdown reduced p-GSK-3β
protein levels. GSK-3β, known to aid cancer therapy resistance by
enhancing DNA repair (37), has
been widely studied, although its role in melanoma chemoresistance
necessitates further elucidation.
Increased Wnt/β-catenin activity can raise cMyc
levels, promoting tumor growth (36,37).
Additionally, cMyc serves as a recognized downstream effector of
the MAPK signaling pathway (38).
Correlation analysis further validated the association between cMyc
and MAPK-related proteins. Evaluation of the effects of PLEKHA4
knockdown on cMyc expression revealed diminished cMyc levels,
aligning with the results of a previous study that used a similar
melanoma cell line (38). Notably,
cMyc has a central role in almost every aspect of the oncogenic
process, orchestrating proliferation, apoptosis, differentiation
and metabolism (39–42). Although PLEKHA4 was knocked down in
the present study prior to co-IP analysis, a small amount of
expression remained. Notably, the co-IP results did not detect a
direct interaction between cMyc and PLEKHA4. Instead, it was
observed that c-Myc expression was restored upon the addition of
the proteasome inhibitor MG132, thus suggesting that PLEKHA4 likely
influences other components of the proteasomal pathway rather than
directly interacting with c-Myc to regulate its degradation. These
results suggested that cMyc is degraded and ubiquitinated through
the proteasome system. Typically, cMyc is a short-lived protein
marked for breakdown (43,44), likely involving molecules other
than PLEKHA4. Treatment with the proteasome inhibitor MG132
effectively reversed the degradation of cMyc following PLEKHA4
knockdown; however, after PLEKHA4 knockdown, reduced levels of cMyc
ubiquitination were observed compared with in the shNC group. In
cells, high levels of ubiquitination do not always indicate
increased protein degradation. Ubiquitination can serve various
functions depending on the type of ubiquitin chains attached. For
example, K48-linked chains generally target proteins for
degradation, whereas K63-linked chains are involved in
non-degradative roles, such as signaling and localization (45,46).
Additionally, deubiquitinating enzymes can regulate ubiquitination
by removing ubiquitin from proteins, creating cycles of
ubiquitination and deubiquitination that raise ubiquitination
levels without leading to efficient degradation (47,48).
Furthermore, proteins may be rapidly ubiquitinated but slowly
degraded due to delayed recognition by the proteasome, or they may
accumulate in a ubiquitinated state when the proteasome is
saturated, such as under cellular stress (49,50).
Finally, some proteins employ feedback mechanisms to control their
stability, remaining ubiquitinated yet stable until receiving a
specific degradation signal (51).
Collectively, these factors contribute to the complex relationship
between ubiquitination and protein degradation. We aim to delve
deeper into the relationship between cMyc and its ubiquitination in
the future, along with investigating the roles of Wnt/β-catenin and
MAPK signaling pathways in regulating cMyc ubiquitination.
In conclusion, PLEKHA4 is upregulated in melanoma,
promoting cell proliferation. By contrast, its knockdown triggers
apoptosis through the MAPK and β-catenin pathways, and enhances
cMyc degradation. These findings highlight the role of PLEKHA4 in
melanoma progression and suggest its potential as a therapeutic
target. In future studies, we aim to investigate the mechanisms by
which PLEKHA4 regulates cMyc degradation and ubiquitination, as
well as the roles of JNK and p38 MAPK signaling in melanoma.
Supplementary Material
Supporting Data
Acknowledgements
Not applicable.
Funding
The present study was supported by the Jilin Provincial
Scientific and Technological Development Program (grant no.
TDZJ202301ZYTS173).
Availability of data and materials
The data generated in the present study may be found
in the PRIDE database under accession number PXD053608 or at the
following URL: http://www.ebi.ac.uk/pride/archive/projects/PXD053608.
All other data generated in the present study may be requested from
the corresponding author.
Authors' contributions
YY, GA and SC performed the experiments. DX made
substantial contributions to data analysis. XL and LD made
substantial contributions to the bioinformatics analysis, drafted
the manuscript, critically reviewed the manuscript for important
intellectual content and constructed the figures. LL and DX made
substantial contributions to the conception or design of the work.
LL and DX confirm the authenticity of all the raw data. All authors
read and approved the final version of the manuscript.
Ethics approval and consent to
participate
The present study was approved by the Laboratory
Animal Ethics Committee of Yanbian University (approval no.
YD20230911021). Yanbian University Hospital is affiliated with
Yanbian University and all ethical approvals for Yanbian University
Hospital are issued by Yanbian University.
Patient consent for publication
Not applicable.
Competing interests
The authors declare that they have no competing
interests.
References
|
1
|
Sood S, Jayachandiran R and Pandey S:
Current advancements and novel strategies in the treatment of
metastatic melanoma. Integr Cancer Ther. 20:15347354219900782021.
View Article : Google Scholar : PubMed/NCBI
|
|
2
|
Lee CS, Thomas CM and Ng KE: An overview
of the changing landscape of treatment for advanced melanoma.
Pharmacotherapy. 37:319–333. 2017. View Article : Google Scholar : PubMed/NCBI
|
|
3
|
Cancer Genome Atlas Network, . Genomic
classification of cutaneous melanoma. Cell. 161:1681–1696. 2015.
View Article : Google Scholar : PubMed/NCBI
|
|
4
|
Inamdar GS, Madhunapantula SV and
Robertson GP: Targeting the MAPK pathway in melanoma: Why some
approaches succeed and other fail. Biochem Pharmacol. 80:624–637.
2010. View Article : Google Scholar : PubMed/NCBI
|
|
5
|
Samatar AA and Poulikakos PI: Targeting
RAS-ERK signalling in cancer: Promises and challenges. Nat Rev Drug
Discov. 13:928–942. 2014. View
Article : Google Scholar : PubMed/NCBI
|
|
6
|
Braicu C, Buse M, Busuioc C, Drula R,
Gulei D, Raduly L, Rusu A, Irimie A, Atanasov AG, Slaby O, et al: A
comprehensive review on MAPK: A promising therapeutic target in
cancer. Cancers (Basel). 11:16182019. View Article : Google Scholar : PubMed/NCBI
|
|
7
|
Zhan T, Rindtorff N and Boutros M: Wnt
signaling in cancer. Oncogene. 36:1461–1473. 2017. View Article : Google Scholar : PubMed/NCBI
|
|
8
|
Zhang Y and Wang X: Targeting the
Wnt/β-catenin signaling pathway in cancer. J Hematol Oncol.
13:1652020. View Article : Google Scholar : PubMed/NCBI
|
|
9
|
Gajos-Michniewicz A and Czyz M: WNT
signaling in melanoma. Int J Mol Sci. 21:48522020. View Article : Google Scholar : PubMed/NCBI
|
|
10
|
Pawlikowski JS, McBryan T, van Tuyn J,
Drotar ME, Hewitt RN, Maier AB, King A, Blyth K, Wu H and Adams PD:
Wnt signaling potentiates nevogenesis. Proc Natl Acad Sci USA.
110:16009–16014. 2013. View Article : Google Scholar : PubMed/NCBI
|
|
11
|
Juan J, Muraguchi T, Iezza G, Sears RC and
McMahon M: Diminished WNT -> β-catenin -> c-MYC signaling is
a barrier for malignant progression of BRAFV600E-induced lung
tumors. Genes Dev. 28:561–575. 2014. View Article : Google Scholar : PubMed/NCBI
|
|
12
|
Damsky WE, Curley DP, Santhanakrishnan M,
Rosenbaum LE, Platt JT, Gould Rothberg BE, Taketo MM, Dankort D,
Rimm DL, McMahon M and Bosenberg M: β-catenin signaling controls
metastasis in Braf-activated Pten-deficient melanomas. Cancer Cell.
20:741–754. 2011. View Article : Google Scholar : PubMed/NCBI
|
|
13
|
Sun Q, Lee W, Mohri Y, Takeo M, Lim CH, Xu
X, Myung P, Atit RP, Taketo MM, Moubarak RS, et al: A novel mouse
model demonstrates that oncogenic melanocyte stem cells engender
melanoma resembling human disease. Nat Commun. 10:50232019.
View Article : Google Scholar : PubMed/NCBI
|
|
14
|
Chien AJ, Haydu LE, Biechele TL,
Kulikauskas RM, Rizos H, Kefford RF, Scolyer RA, Moon RT and Long
GV: Targeted BRAF inhibition impacts survival in melanoma patients
with high levels of Wnt/β-catenin signaling. PLoS One.
9:e947482014. View Article : Google Scholar : PubMed/NCBI
|
|
15
|
Zhi W, Wang Y, Jiang C, Gong Y, Chen Q,
Mao X, Deng W and Zhao S: PLEKHA4 is a novel prognostic biomarker
that reshapes the tumor microenvironment in lower-grade glioma.
Front Immunol. 14:11282442023. View Article : Google Scholar : PubMed/NCBI
|
|
16
|
Gao X, Liu Y, Hong S, Yang H, Guan B and
Ma X: PLEKHA4 is associated with tumour microenvironment, stemness,
proliferation and poor prognosis of gliomas. J Integr Neurosci.
22:1352023. View Article : Google Scholar : PubMed/NCBI
|
|
17
|
He Y, Zheng W, Huo Y, Sa L, Zhang H, He G
and Shang P: PLEKHA4 promotes glioblastoma progression through
apoptosis inhibition, tumor cell migration, and macrophage
infiltration. Immunobiology. 228:1527462023. View Article : Google Scholar : PubMed/NCBI
|
|
18
|
Shami Shah A, Batrouni AG, Kim D, Punyala
A, Cao W, Han C, Goldberg ML, Smolka MB and Baskin JM:
PLEKHA4/kramer attenuates dishevelled ubiquitination to modulate
Wnt and planar cell polarity signaling. Cell Rep. 27:2157–2170.e8.
2019. View Article : Google Scholar : PubMed/NCBI
|
|
19
|
Koelblinger P, Thuerigen O and Dummer R:
Development of encorafenib for BRAF-mutated advanced melanoma. Curr
Opin Oncol. 30:125–133. 2018. View Article : Google Scholar : PubMed/NCBI
|
|
20
|
Talantov D, Mazumder A, Yu JX, Briggs T,
Jiang Y, Backus J, Atkins D and Wang Y: Novel genes associated with
malignant melanoma but not benign melanocytic lesions. Clin Cancer
Res. 11:7234–7242. 2005. View Article : Google Scholar : PubMed/NCBI
|
|
21
|
Jalili A, Mertz KD, Romanov J, Wagner C,
Kalthoff F, Stuetz A, Pathria G, Gschaider M, Stingl G and Wagner
SN: NVP-LDE225, a potent and selective SMOOTHENED antagonist
reduces melanoma growth in vitro and in vivo. PLoS One.
8:e690642013. View Article : Google Scholar : PubMed/NCBI
|
|
22
|
Llombart V and Mansour MR: Therapeutic
targeting of ‘undruggable’ MYC. EBioMedicine. 75:1037562022.
View Article : Google Scholar : PubMed/NCBI
|
|
23
|
Sun XX, Sears RC and Dai MS:
Deubiquitinating c-Myc: USP36 steps up in the nucleolus. Cell
Cycle. 14:3786–3793. 2015. View Article : Google Scholar : PubMed/NCBI
|
|
24
|
Wang YF, Jiang CC, Kiejda KA, Gillespie S,
Zhang XD and Hersey P: Apoptosis induction in human melanoma cells
by inhibition of MEK is caspase-independent and mediated by the
Bcl-2 family members PUMA, Bim, and Mcl-1. Clin Cancer Res.
13:4934–4942. 2007. View Article : Google Scholar : PubMed/NCBI
|
|
25
|
Wang J and Tai G: Role of C-Jun N-terminal
kinase in hepatocellular carcinoma development. Target Oncol.
11:723–738. 2016. View Article : Google Scholar : PubMed/NCBI
|
|
26
|
Feng C, He K, Zhang C, Su S, Li B, Li Y,
Duan CY, Chen S, Chen R, Liu Y, et al: JNK contributes to the
tumorigenic potential of human cholangiocarcinoma cells through the
mTOR pathway regulated GRP78 induction. PLoS One. 9:e903882014.
View Article : Google Scholar : PubMed/NCBI
|
|
27
|
Lu Z and Xu S: ERK1/2 MAP kinases in cell
survival and apoptosis. IUBMB Life. 58:621–631. 2006. View Article : Google Scholar : PubMed/NCBI
|
|
28
|
Sugiura R, Satoh R and Takasaki T: ERK: A
double-edged sword in cancer. ERK-dependent apoptosis as a
potential therapeutic strategy for cancer. Cells. 10:25092021.
View Article : Google Scholar : PubMed/NCBI
|
|
29
|
Thamkachy R, Kumar R, Rajasekharan KN and
Sengupta S: ERK mediated upregulation of death receptor 5 overcomes
the lack of p53 functionality in the diaminothiazole DAT1 induced
apoptosis in colon cancer models: Efficiency of DAT1 in Ras-Raf
mutated cells. Mol Cancer. 15:222016. View Article : Google Scholar : PubMed/NCBI
|
|
30
|
Pan R, Ruvolo V, Mu H, Leverson JD,
Nichols G, Reed JC, Konopleva M and Andreeff M: Synthetic lethality
of combined Bcl-2 inhibition and p53 activation in AML: Mechanisms
and superior antileukemic efficacy. Cancer Cell. 32:748–760.e6.
2017. View Article : Google Scholar : PubMed/NCBI
|
|
31
|
Park BG, Yoo CI, Kim HT, Kwon CH and Kim
YK: Role of mitogen-activated protein kinases in hydrogen
peroxide-induced cell death in osteoblastic cells. Toxicology.
215:115–125. 2005. View Article : Google Scholar : PubMed/NCBI
|
|
32
|
Boutahar N, Reynaud E, Lassabliere F and
Borg J: Timing differences of signaling response in neuron cultures
activated by glutamate analogue or free radicals. Brain Res.
1191:20–29. 2008. View Article : Google Scholar : PubMed/NCBI
|
|
33
|
Gungor H, Ilhan N and Eroksuz H: The
effectiveness of cyclooxygenase-2 inhibitors and evaluation of
angiogenesis in the model of experimental colorectal cancer. Biomed
Pharmacother. 102:221–229. 2018. View Article : Google Scholar : PubMed/NCBI
|
|
34
|
Spano D and Catara G: Targeting the
ubiquitin-proteasome system and recent advances in cancer therapy.
Cells. 13:292023. View Article : Google Scholar : PubMed/NCBI
|
|
35
|
Jiang M, Qi L, Li L and Li Y: The
caspase-3/GSDME signal pathway as a switch between apoptosis and
pyroptosis in cancer. Cell Death Discov. 6:1122020. View Article : Google Scholar : PubMed/NCBI
|
|
36
|
Sun SC: The non-canonical NF-κB pathway in
immunity and inflammation. Nat Rev Immunol. 17:545–558. 2017.
View Article : Google Scholar : PubMed/NCBI
|
|
37
|
Hanahan D and Weinberg RA: Hallmarks of
cancer: The next generation. Cell. 144:646–674. 2011. View Article : Google Scholar : PubMed/NCBI
|
|
38
|
Nagendraprabhu P and Sudhandiran G:
Astaxanthin inhibits tumor invasion by decreasing extracellular
matrix production and induces apoptosis in experimental rat colon
carcinogenesis by modulating the expressions of ERK-2, NFkB and
COX-2. Invest New Drugs. 29:207–224. 2011. View Article : Google Scholar : PubMed/NCBI
|
|
39
|
Wang Q, Zhou Y, Rychahou P, Harris JW,
Zaytseva YY, Liu J, Wang C, Weiss HL, Liu C, Lee EY and Evers BM:
Deptor is a novel target of Wnt/β-Catenin/c-Myc and contributes to
colorectal cancer cell growth. Cancer Res. 78:3163–3175. 2018.
View Article : Google Scholar : PubMed/NCBI
|
|
40
|
Dang CV: MYC on the path to cancer. Cell.
149:22–35. 2012. View Article : Google Scholar : PubMed/NCBI
|
|
41
|
Tsai WB, Aiba I, Long Y, Lin HK, Feun L,
Savaraj N and Kuo MT: Activation of Ras/PI3K/ERK pathway induces
c-Myc stabilization to upregulate argininosuccinate synthetase,
leading to arginine deiminase resistance in melanoma cells. Cancer
Res. 72:2622–2633. 2012. View Article : Google Scholar : PubMed/NCBI
|
|
42
|
Chen H, Liu H and Qing G: Targeting
oncogenic Myc as a strategy for cancer treatment. Signal Transduct
Target Ther. 3:52018. View Article : Google Scholar : PubMed/NCBI
|
|
43
|
Hann SR: Role of post-translational
modifications in regulating c-Myc proteolysis, transcriptional
activity and biological function. Semin Cancer Biol. 16:288–302.
2006. View Article : Google Scholar : PubMed/NCBI
|
|
44
|
Akutsu M, Dikic I and Bremm A: Ubiquitin
chain diversity at a glance. J Cell Sci. 129:875–880. 2016.
View Article : Google Scholar : PubMed/NCBI
|
|
45
|
Swatek KN and Komander D: Ubiquitin
modifications. Cell Res. 26:399–422. 2016. View Article : Google Scholar : PubMed/NCBI
|
|
46
|
Haglund K and Dikic I: Ubiquitylation and
cell signaling. EMBO J. 24:3353–3359. 2005. View Article : Google Scholar : PubMed/NCBI
|
|
47
|
Trulsson F, Akimov V, Robu M, van Overbeek
N, Berrocal DAP, Shah RG, Cox J, Shah GM, Blagoev B and Vertegaal
ACO: Deubiquitinating enzymes and the proteasome regulate
preferential sets of ubiquitin substrates. Nat Commun. 13:27362022.
View Article : Google Scholar : PubMed/NCBI
|
|
48
|
Wang J, Zhou Q, Ding J, Yin T, Ye P and
Zhang Y: The conceivable functions of protein ubiquitination and
deubiquitination in reproduction. Front Physiol. 13:8862612022.
View Article : Google Scholar : PubMed/NCBI
|
|
49
|
Mevissen TET and Komander D: Mechanisms of
deubiquitinase specificity and regulation. Annu Rev Biochem.
86:159–192. 2017. View Article : Google Scholar : PubMed/NCBI
|
|
50
|
Sun T, Liu Z and Yang Q: The role of
ubiquitination and deubiquitination in cancer metabolism. Mol
Cancer. 19:1462020. View Article : Google Scholar : PubMed/NCBI
|
|
51
|
Komander D and Rape M: The ubiquitin code.
Annu Rev Biochem. 81:203–229. 2012. View Article : Google Scholar : PubMed/NCBI
|