Introduction
Breast cancer is the most common type of cancer in
women, accounting for 25% of all cases (1). Risk factors include lifestyle (including
smoking or diet), genetics and medical conditions. A number of
treatment methods are now available for breast cancer, including
surgery, radiotherapy, chemotherapy, hormone therapy and targeted
therapy. However, certain patients have a poor prognosis and the
molecular mechanisms underlying this remain unclear. Prognostic
factors include disease stage and grade, recurrence of the disease,
and the age and health of the patient.
With advances in technology and the accumulation of
research results, certain molecular markers associated with breast
cancer have been well studied. Tumor protein p53 mutations are poor
prognostic factors in breast cancer (2). MYC proto-oncogene and bHLH transcription
factor-driven accumulation of 2-hydroxyglutarate are associated
with poor breast cancer prognosis (3). Prostaglandin-endoperoxide synthase 2
expression predicts worse breast cancer prognosis (4). Ki-67 has been associated with
disease-free survival, but its prognostic value remains to be
validated (5). Matrix
metalloproteinase-8 gene variation may influence breast cancer
prognosis and can have an inhibitory effect on cancer metastasis
(6). A gene signature involved in
tumor-immune interactions may provide a more accurate prognostic
tool (7). Zhang et al
(8) performed a meta-analysis and
demonstrated that overexpression of C-X-C motif chemokine receptor
4 was significantly associated with lymph node status and distant
metastasis, indicating poor overall and disease free survival.
SRY-box 4 overexpression is a biomarker for malignant status and
poor prognosis in breast cancer patients (9). A number of other novel biomarkers have
also been also identified, including chromobox homolog 1 (10), HOX transcript antisense intergenic RNA
(9) and anterior gradient 3 (11). Nevertheless, more prognostic genes are
required to further improve treatment decisions and thus the
quality of life of patients with breast cancer.
Microarray technology has been widely used to
identify biomarkers of breast cancer (12,13),
allowing for the large-scale screening of molecular markers. In the
present study, two gene expression datasets were obtained to reveal
prognostic genes (14,15). One dataset was used with the aim of
identifying genes associated with the distant metastasis of
lymph-node-negative primary breast cancer (14); the other was used to identify genes
involved in response and survival following taxane-anthracycline
chemotherapy in breast cancer (14).
The two datasets were combined to construct a gene co-expression
network and analyze survival time to identify novel biomarkers
associated with breast cancer prognosis.
Materials and methods
Raw data and pre-treatment
Two gene expression datasets, GSE2034 (14) and GSE25066 (15), were downloaded from ArrayExpress
(https://www.ebi.ac.uk/arrayexpress/).
Dataset GSE2034 included 286 breast cancer samples and dataset
GSE25066 included 508 breast cancer samples. The two gene
expression datasets were obtained using Affymetrix GPL96
platform.
Normalization was performed with rma from the affy
package (16) in R (R 3.2.0;
https://www.r-project.org/) and then
log2 conversion was applied. Probes were mapped onto
genes according to annotation files. Probes mapping to the same
gene were averaged as the expression level for the gene.
Functional enrichment analysis
Gene Ontology (GO) annotation and pathway enrichment
analysis were performed with DAVID (Database for Annotation,
Visualization and Integration Discovery; http://david.abcc.ncifcrf.gov/) (17).
Gene co-expression network and
modules
The gene co-expression network was constructed with
the WGCNA package (18) in R. The
adjacency coefficient aij was calculated as
follows:
aij=SijβSij=|cor(xi,xj)|
Where xi and xj
are vectors of expression value for gene i and j; cor
represents the Pearson's correlation coefficient of the two
vectors; aij is the adjacency coefficient and is
acquired via exponential transform of Sij.
WGCNA method takes topological properties into
consideration to identify modules from gene co-expression networks.
Therefore, this method not only considers the association between
the two connected nodes, but also takes associated genes into
account. It calculates the weighting coefficient
Wij from aij as follows:
Wij=lij+aijmin{ki,kj}+1–aijlij=∑uaiuauj,ki=∑uaiu
Wij considers the overlap between
neighbor genes of genes i and j. Modules were
identified via hierarchical clustering of the weighting coefficient
matrix, W.
Survival analysis
Cox regression was performed with hub genes from the
modules to identify survival-associated genes, and Kaplan-Meier
survival was used to compare the survival time of different groups,
which were performed with the Survival package in R (https://cran.r-project.org/web/views/Survival.html).
P<0.05 was considered to indicate a statistically significant
difference. Pearson's correlation was performed by cor function in
R (19).
Results
Gene expression data
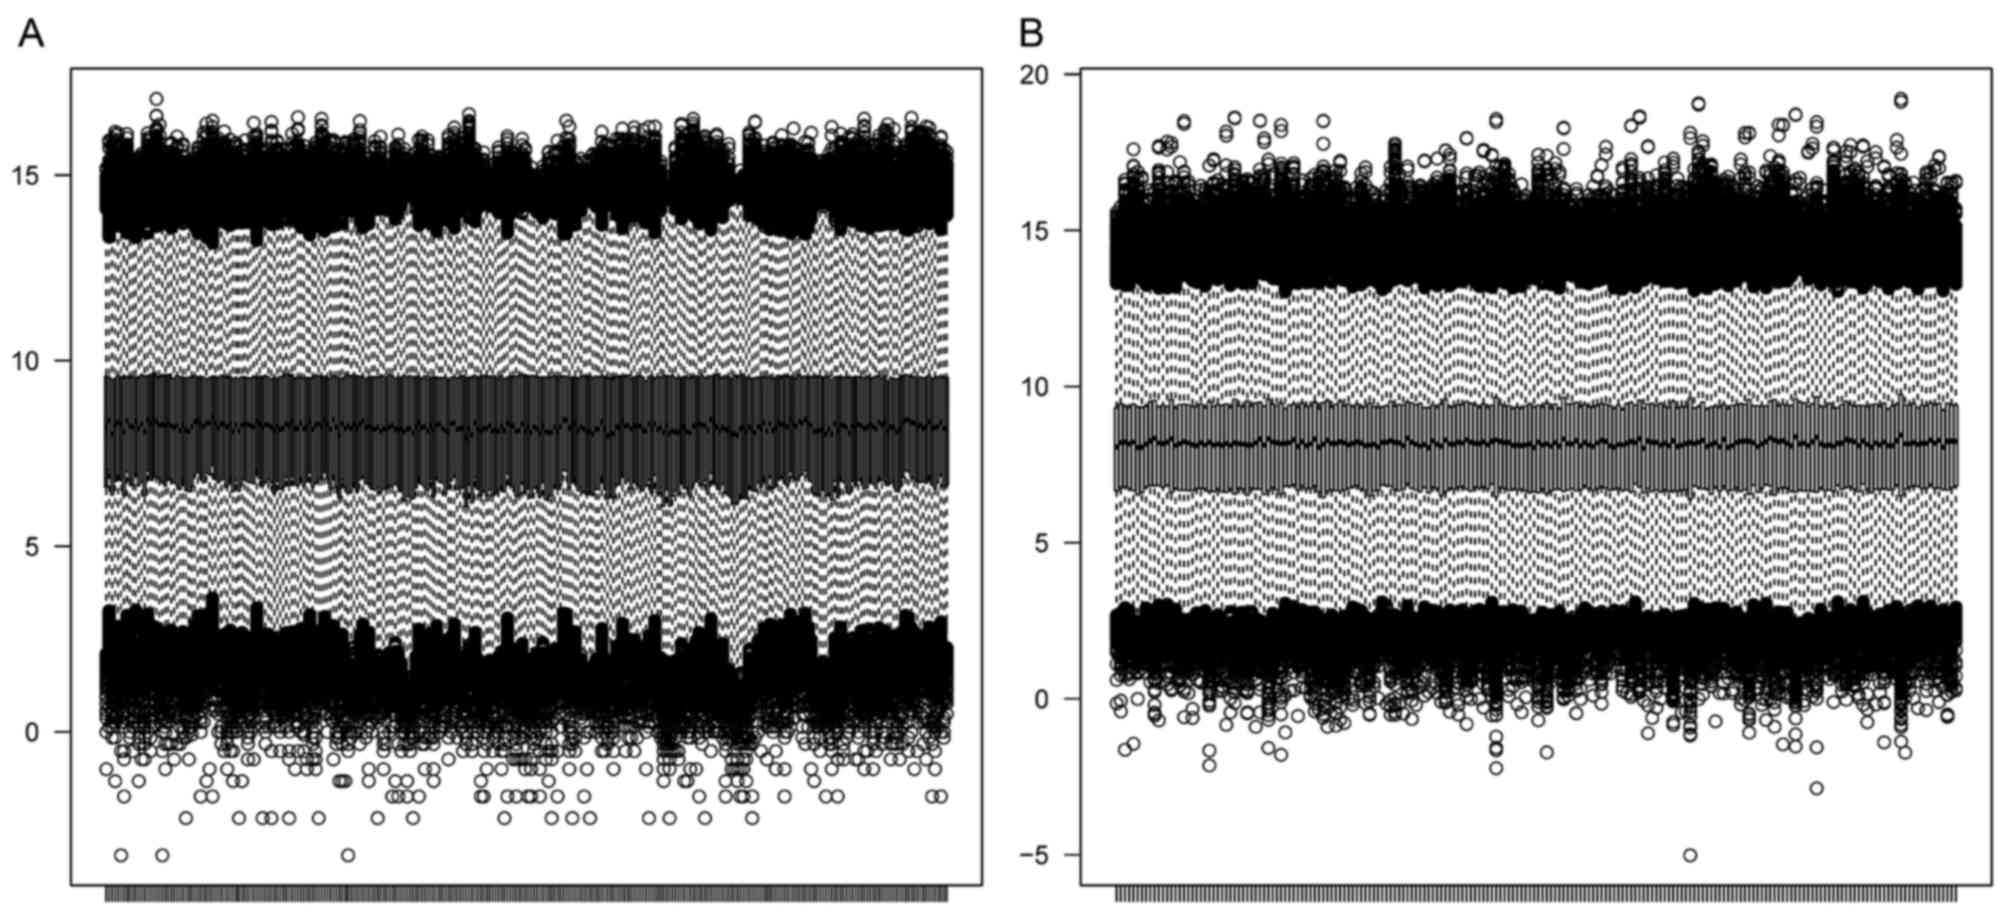
A total of 13,191 genes were identified in the
GSE2034 and GSE25066 datasets, for which box plots are presented in
Fig. 1. According to the box plots,
the average total mRNA expression level in each sample was
consistent, indicating that a good performance of normalization was
achieved for both datasets.
Functional enrichment analysis
A total of 2,669 genes with coefficient of variation
(CV) >0.5 were selected. Functional enrichment analysis revealed
that they were associated primarily with immune response, cell
proliferation, cell differentiation and cell adhesion (Table I).
 | Table I.Top 15 significantly over-represented
biological pathways. |
Table I.
Top 15 significantly over-represented
biological pathways.
| ID | Description | P-value | Adjusted
P-value |
|---|
| GO:0006955 | Immune
response |
2.19×10−63 |
3.27×10−61 |
| GO:0006952 | Defense
response |
2.15×10−57 |
2.80×10−55 |
| GO:0006950 | Response to
stress |
1.57×10−56 |
1.96×10−54 |
| GO:0007166 | Cell-surface
receptor signaling pathway |
1.20×10−55 |
1.43×10−53 |
| GO:0008283 | Cell
proliferation |
1.06×10−49 |
1.09×10−47 |
| GO:0002682 | Regulation of
immune system process |
6.12×10−42 |
4.82×10−40 |
| GO:0016477 | Cell migration |
7.58×10−40 |
5.66×10−38 |
| GO:0045321 | Leukocyte
activation |
1.90×10−39 |
1.32×10−37 |
| GO:0006954 | Inflammatory
response |
3.92×10−38 |
2.66×10−36 |
| GO:0048584 | Positive regulation
of response to stimulus |
6.10×10−38 |
4.05×10−36 |
| GO:0042127 | Regulation of cell
proliferation |
1.72×10−37 |
1.10×10⁻³⁵ |
| GO:0030154 | Cell
differentiation |
3.01×10⁻³⁴ |
1.70×10⁻³² |
| GO:0048869 | Cellular
developmental process |
2.06×10⁻³³ |
1.14×10⁻³¹ |
| GO:0007155 | Cell adhesion |
7.77×10⁻³³ |
4.22×10⁻³¹ |
| GO:0022610 | Biological
adhesion |
1.11×10⁻³² |
5.90×10⁻³¹ |
Prognostic genes
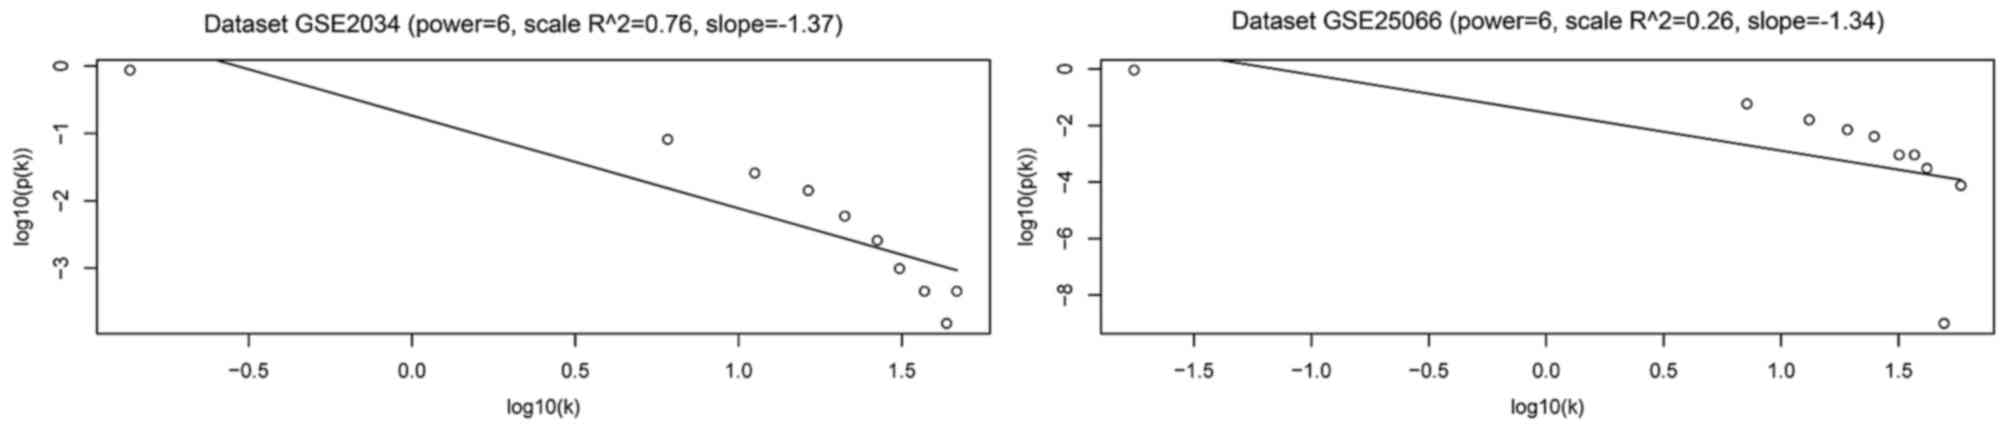
Two gene co-expression networks were constructed for
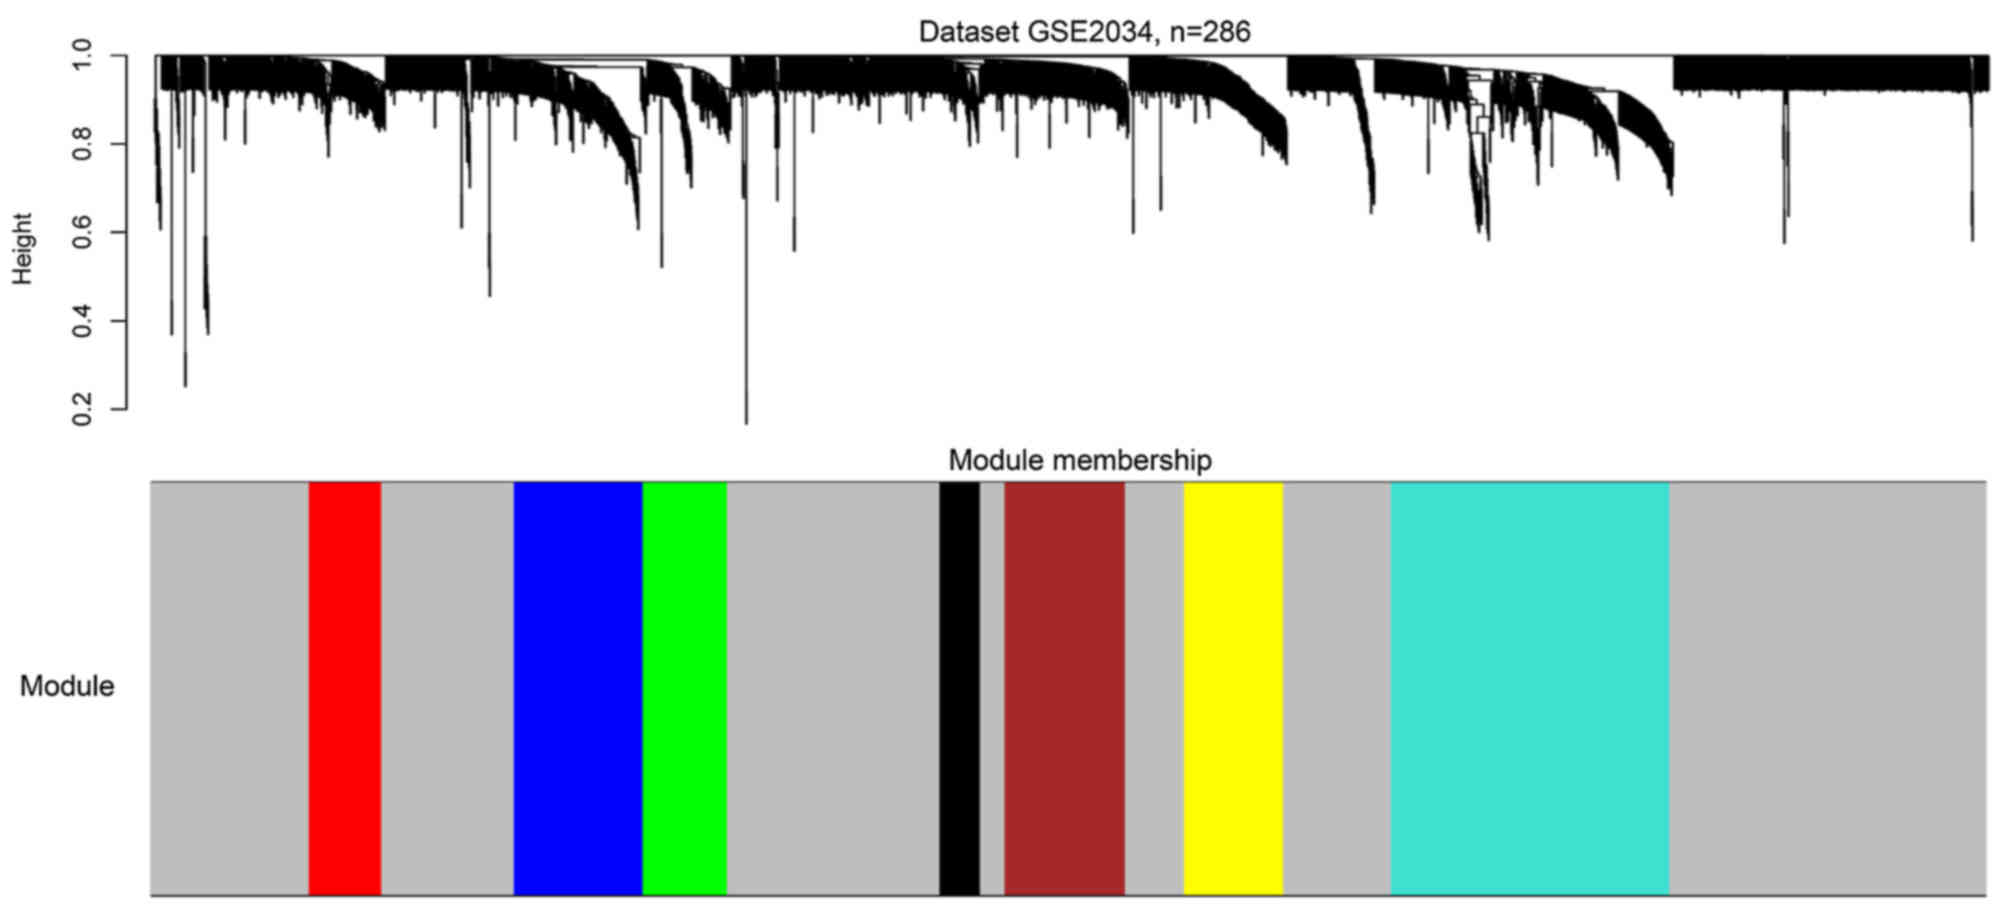
the two datasets by WGCNA (Fig. 2).
Seven modules were identified from the network of GSE2034 via
hierarchical clustering of the weighting coefficient matrix,
W (Fig. 3). The modules were
termed the red, blue, green, black, brown, yellow and turquoise
modules.
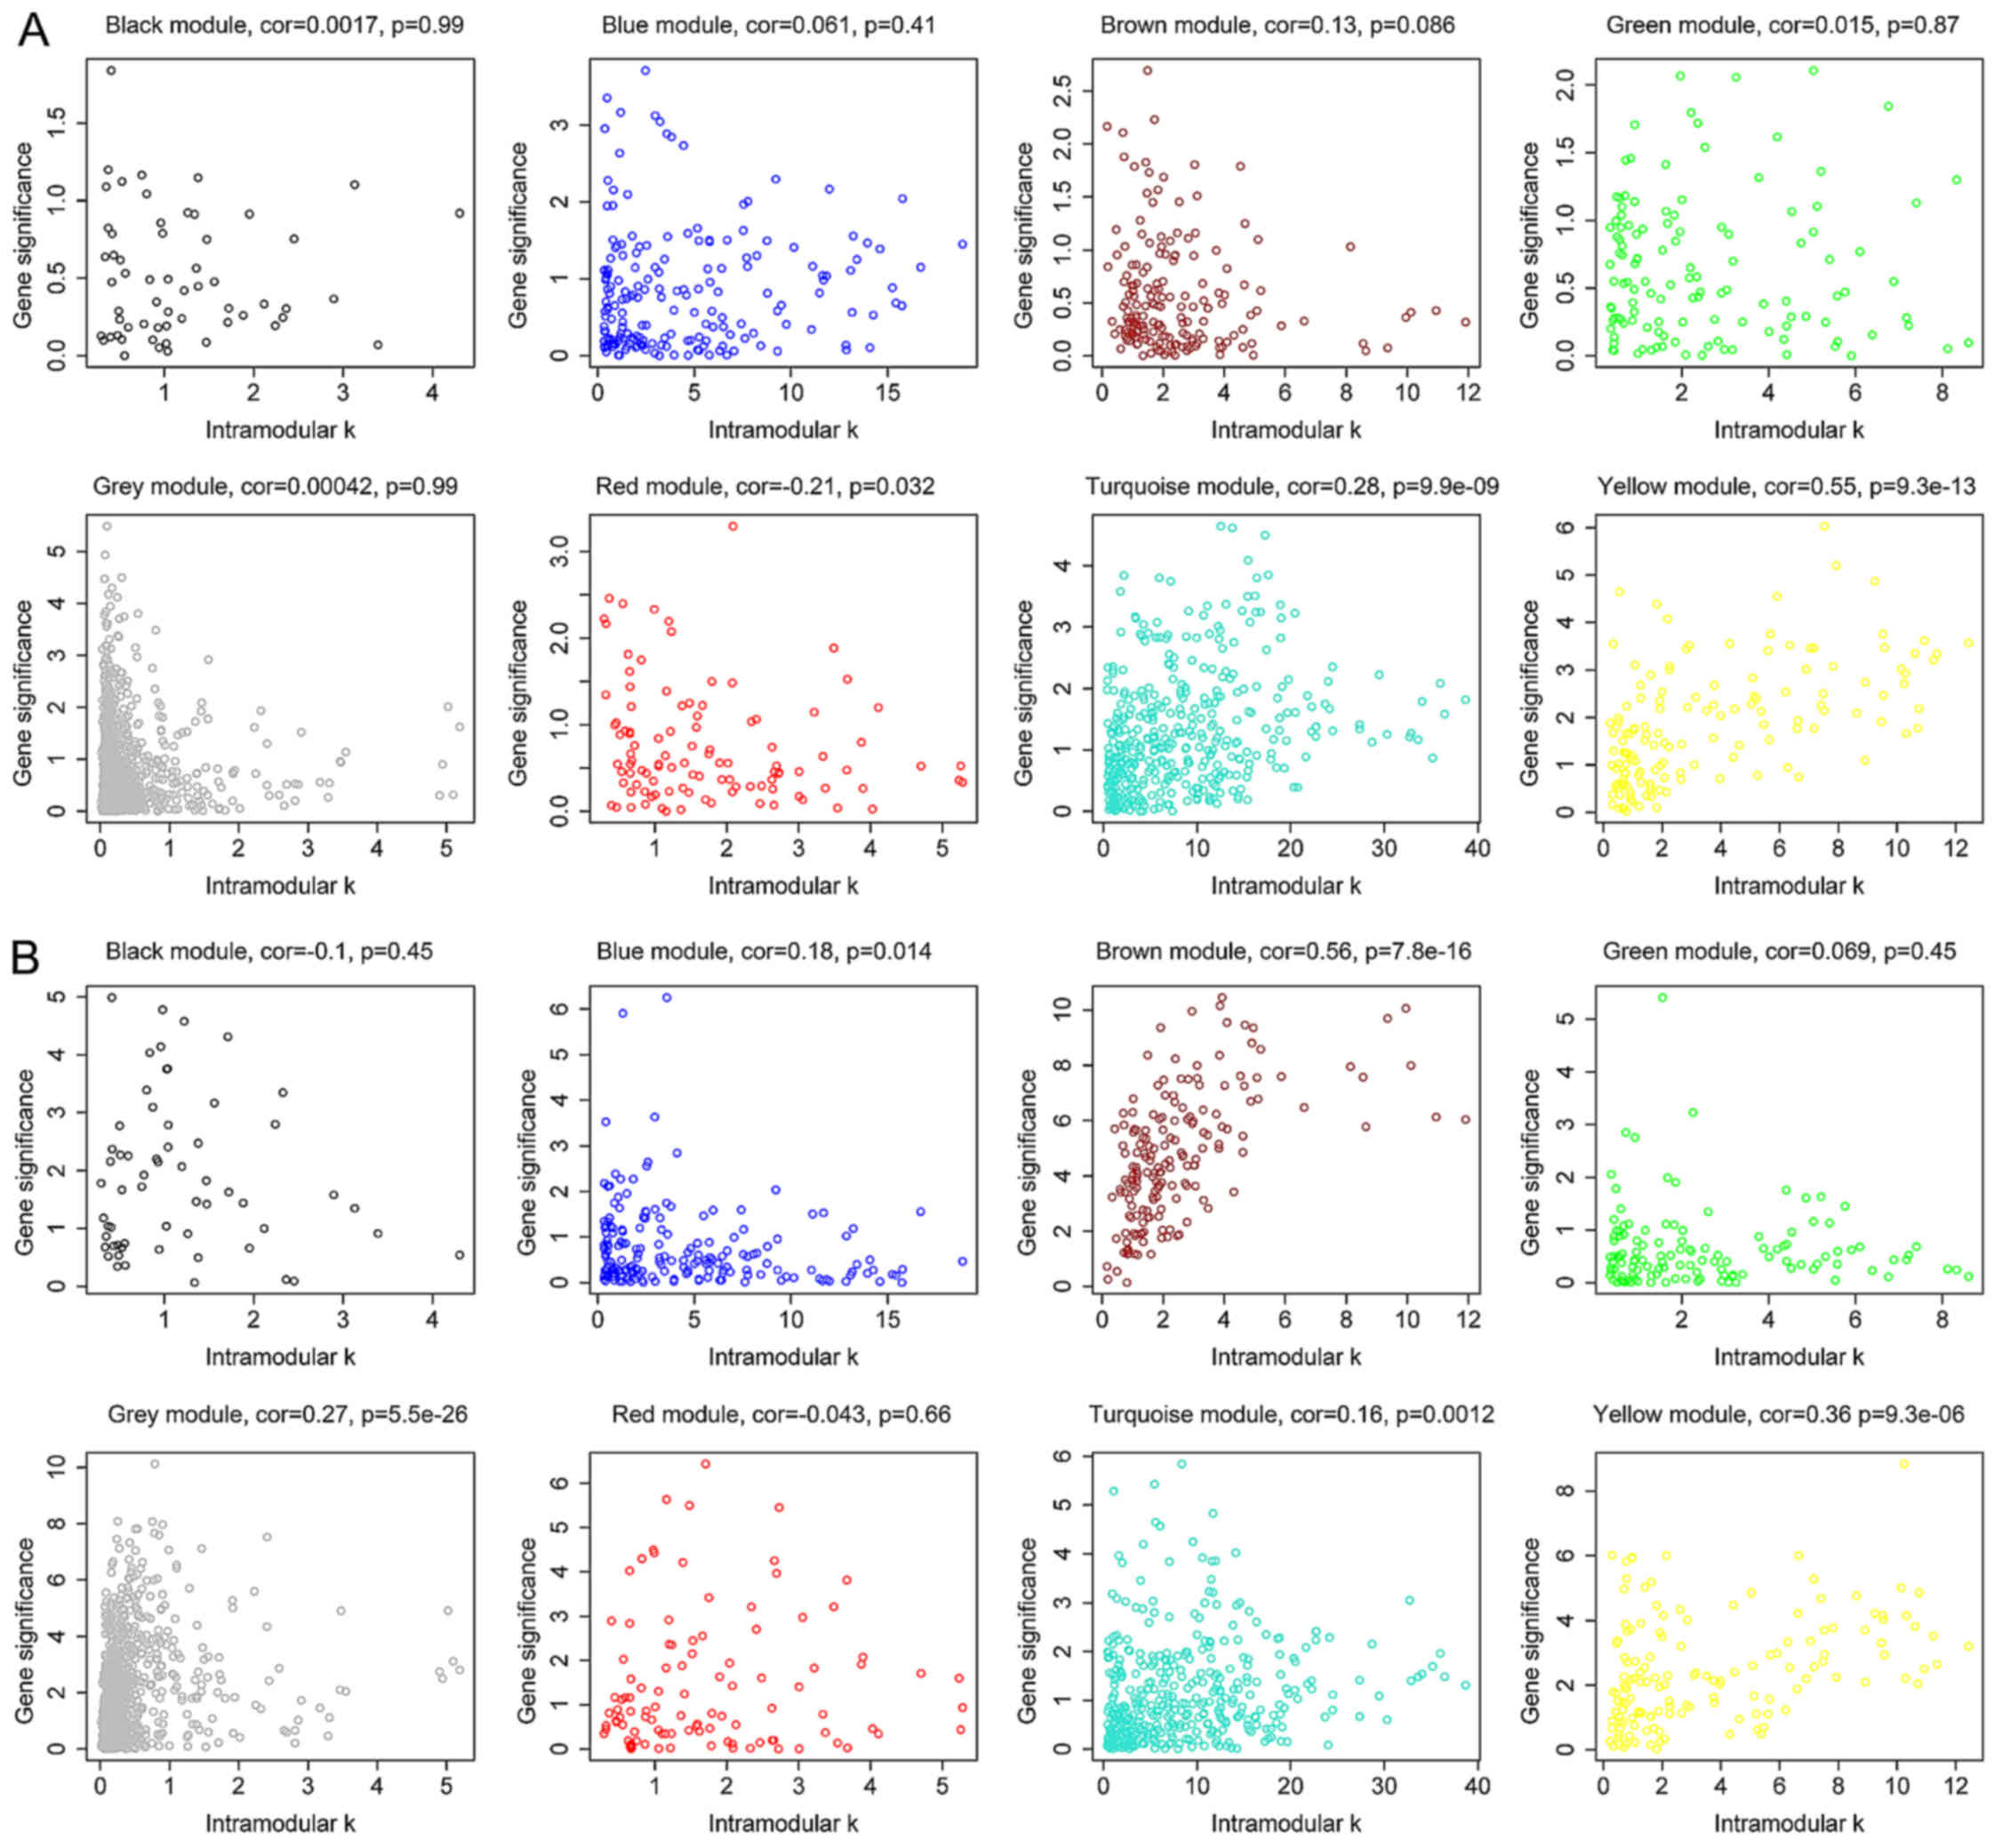
The degree, k, for each gene in the module
was calculated and the P-value of Cox regression between each gene
and survival was also determined. Next, the correlation between
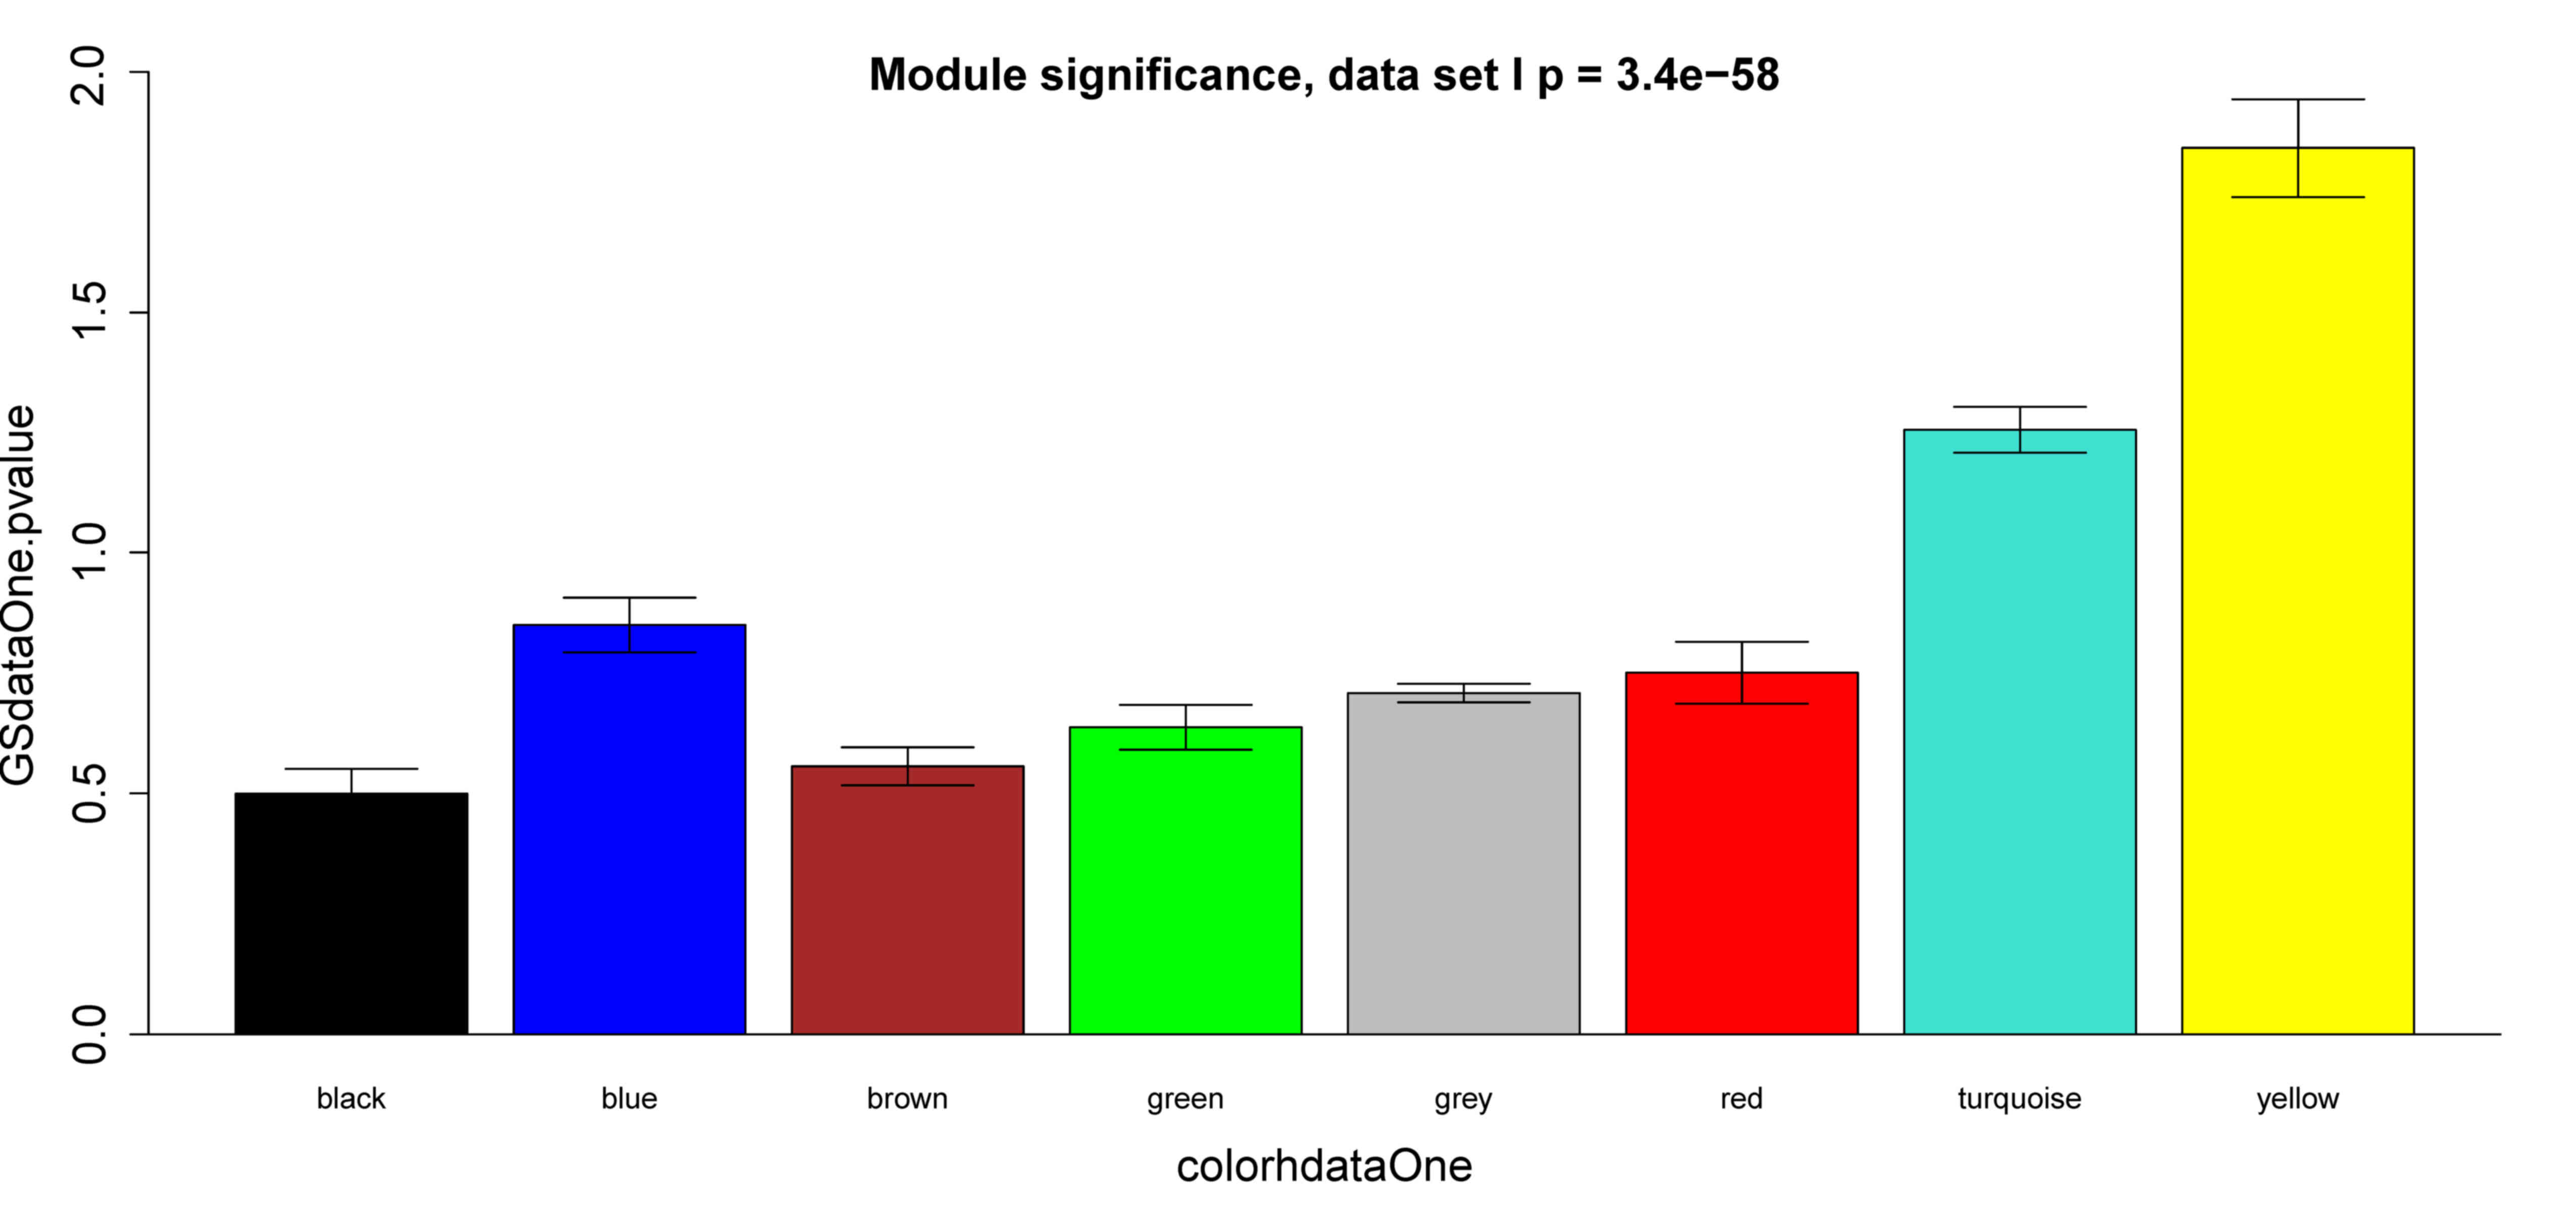
k and -log10 (P) was calculated. The yellow
module exhibited significant correlation with survival time in
dataset GSE2034 (P=9.3×10⁻¹³) (Fig. 4A), which was also observed in dataset
GSE25066 (P=9.3×10⁻⁶) (Fig.
4B). Besides, survival-associated genes (P<0.05 in Cox
regression) were significantly over-represented in the yellow
module in both datasets (Fig. 5).
Therefore, the yellow module was considered to be significantly
associated with breast cancer patient survival, which should be
further investigated to understand the association between survival
time and critical gene expression.
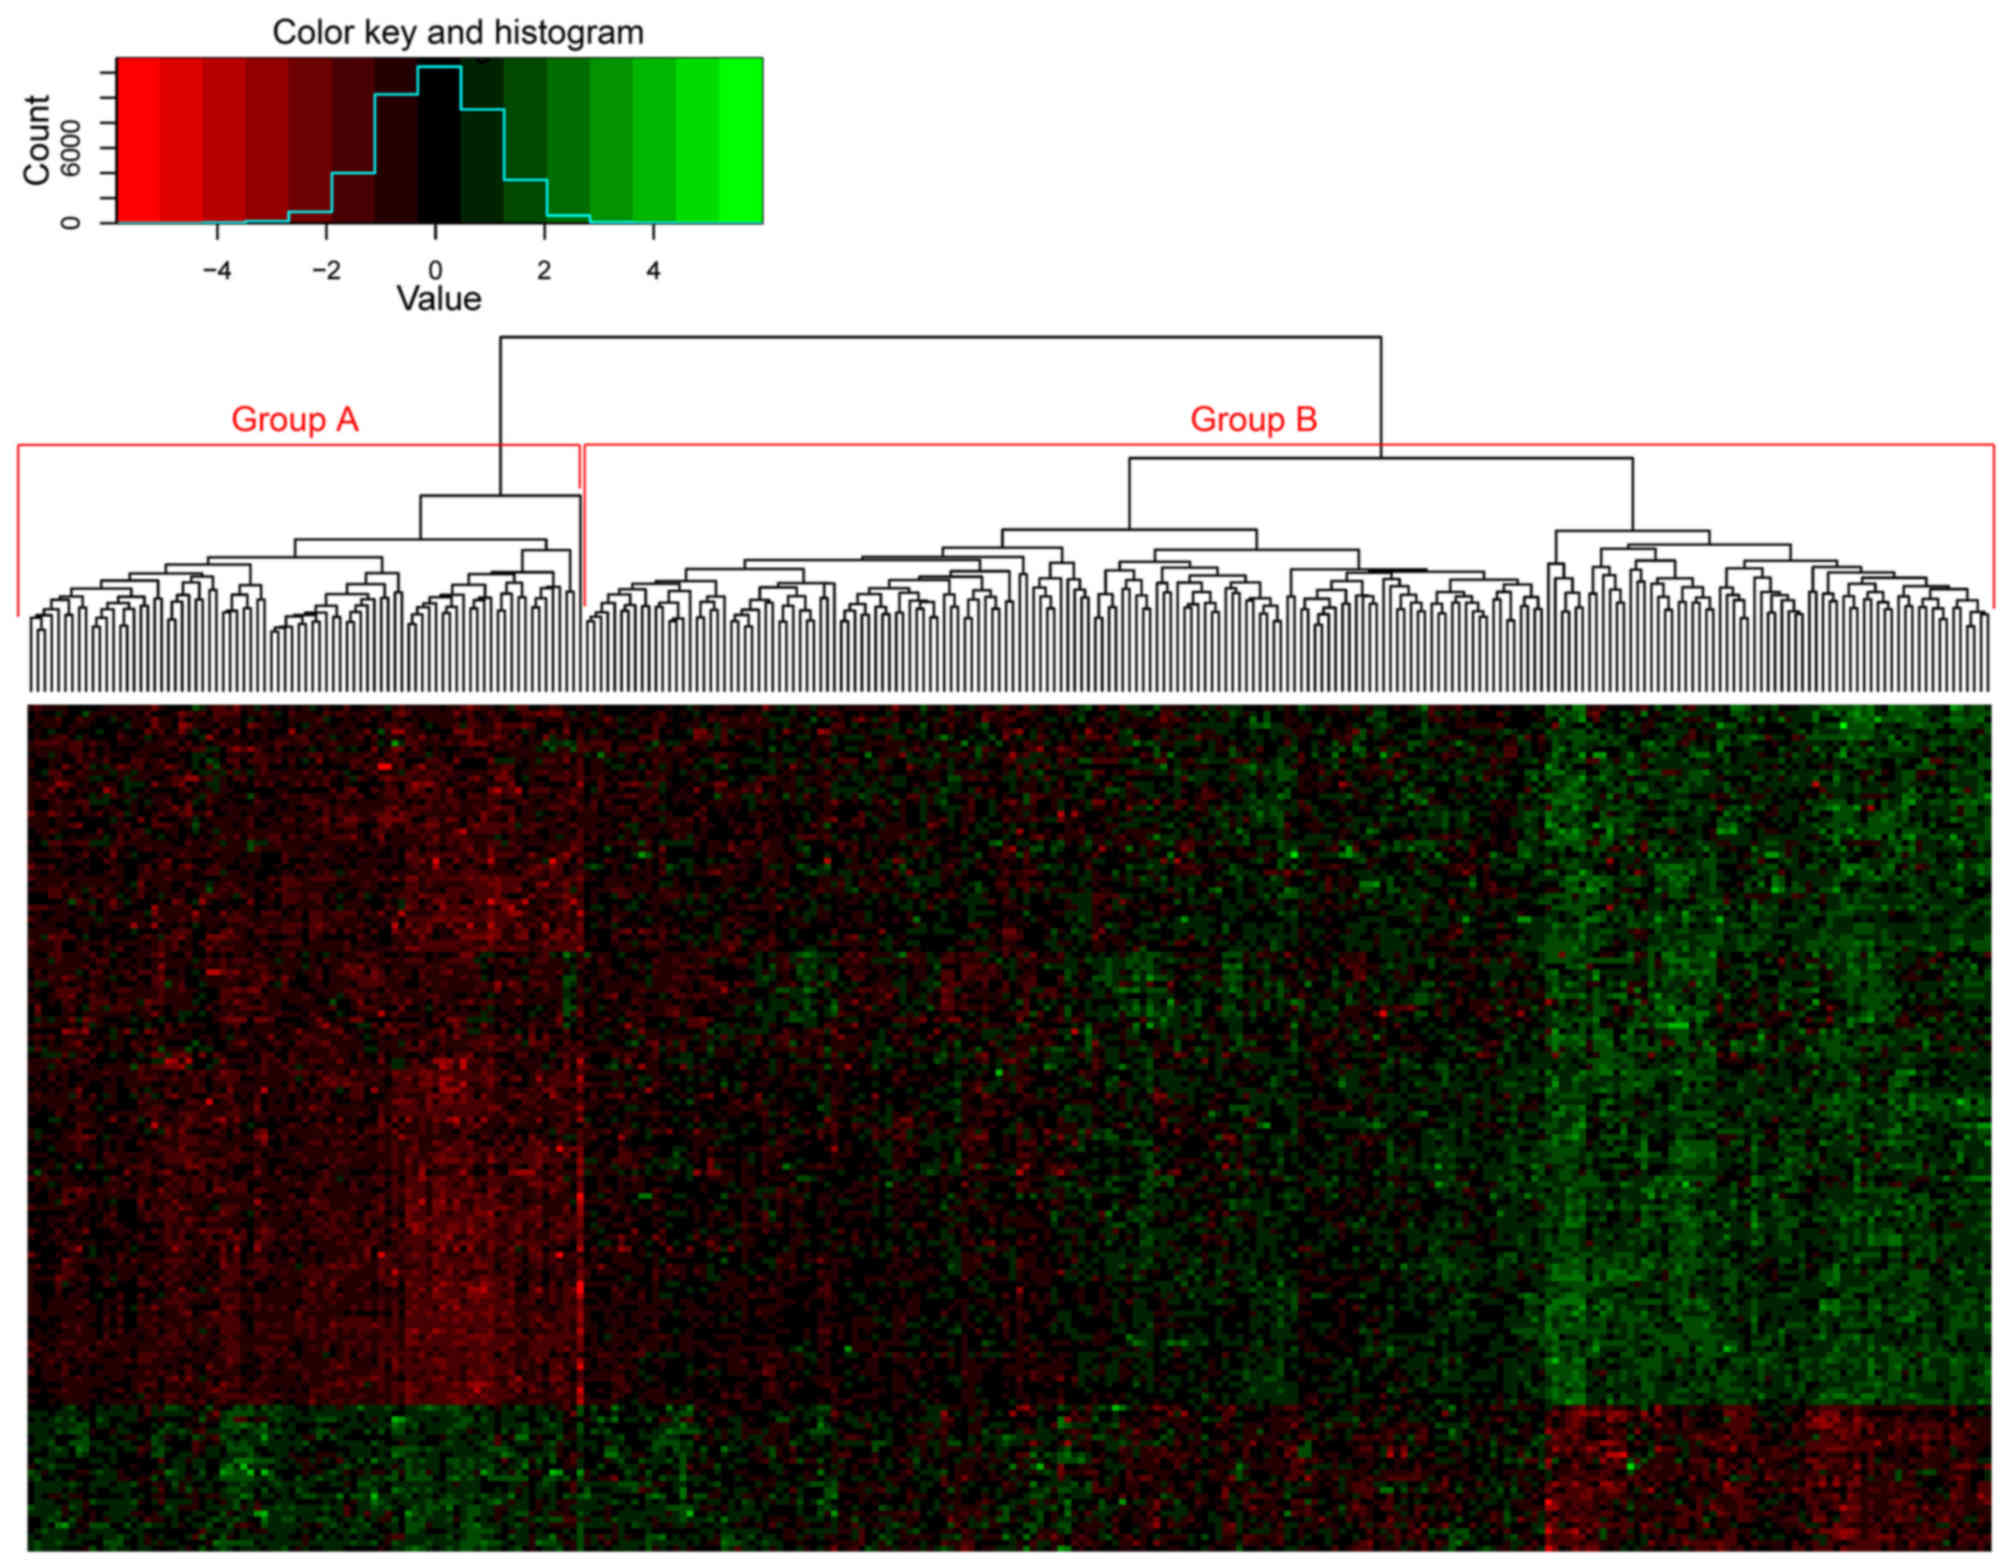
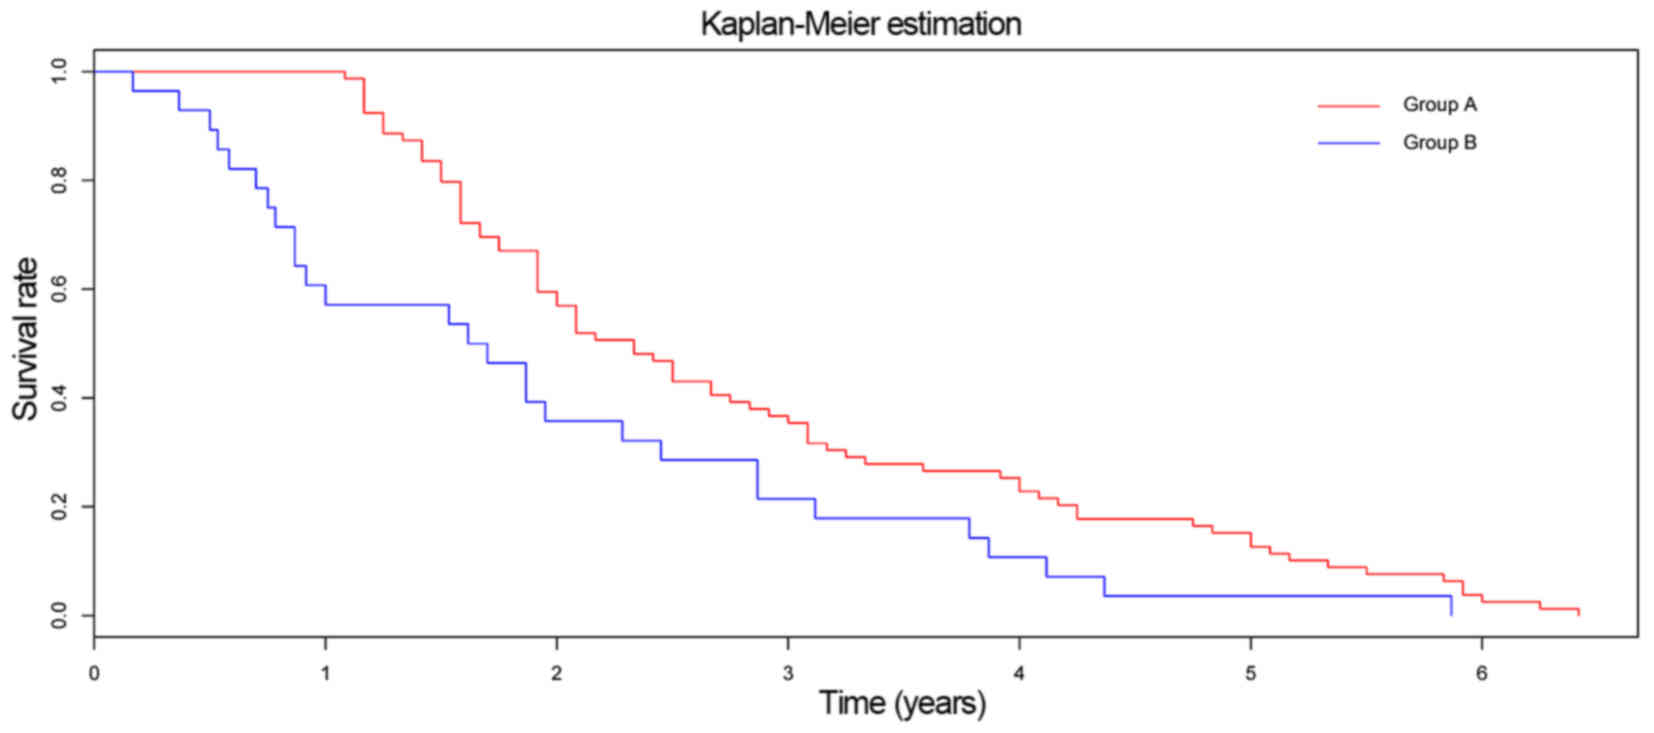
The 144 genes from the yellow module were used in
the cluster analysis of samples from dataset GSE2034, which
separated the patient samples into two groups based on the
expression of these genes (Fig. 6). A
significant difference in survival time was observed between the
two groups (P=0.008; Fig. 7).
Functional enrichment analysis indicated that the 144 genes from
the yellow module were involved in cell cycle, oocyte meiosis, the
tumor protein p53 signaling pathway and progesterone-mediated
oocyte maturation (Table II).
| Table II.KEGG pathways enriched in the 144
genes of the yellow module. |
Table II.
KEGG pathways enriched in the 144
genes of the yellow module.
| ID | Description | P-value | Adjusted
P-value |
|---|
| hsa04110 | Cell cycle |
5.22×10⁻¹⁸ |
3.13×10⁻¹⁷ |
| hsa04114 | Oocyte meiosis |
2.17×10⁻⁹ |
6.50×10⁻⁹ |
| hsa04115 | p53 signaling
pathway |
2.46×10⁻⁵ |
4.91×10⁻⁵ |
| hsa04914 |
Progesterone-mediated oocyte
maturation |
9.19×10⁻⁵ |
1.38×10⁻⁴ |
The top 10 hub genes from the yellow module were
selected (Table III) and included
cyclin B2 (CCNB2), ubiquitin-conjugating enzyme E2C (UBE2C),
protein regulator of cytokinesis 1 (PRC1), cell division cycle 20
(CDC20), abnormal spindle microtubule assembly (ASPM), forkhead box
M1 (FOXM1), kinesin family member 4A (KIF4A), nucleolar and spindle
associated protein 1 (NUSAP1), pituitary tumor-transforming 1
(PTTG1) and centrosomal protein 55 kDa (CEP55). All of these genes
were significantly associated with survival time in the two
datasets.
| Table III.Top 10 hub genes in the yellow
module. |
Table III.
Top 10 hub genes in the yellow
module.
| Dataset | Gene name | Coefficient | P-value |
kTotal |
kWithin |
|---|
| GSE2034 | CCNB2 | 0.3640 | 0.0003 | 14.7998 | 12.4392 |
|
| PRC1 | 0.3868 | 0.0005 | 12.9603 | 11.3677 |
|
| UBE2C | 0.4281 | 0.0006 | 14.1236 | 11.2433 |
|
| ASPM | 0.3442 | 0.0002 | 12.9467 | 10.9328 |
|
| CDC20 | 0.2339 | 0.0065 | 14.6847 | 10.7527 |
|
| FOXM1 | 0.1988 | 0.0168 | 13.7352 | 10.7131 |
|
| CEP55 | 0.3691 | 0.0004 | 12.6988 | 10.6131 |
|
| KIF4A | 0.2648 | 0.0217 | 12.1095 | 10.3165 |
|
| NUSAP1 | 0.3931 | 0.0012 | 11.7988 | 10.2885 |
|
| PTTG1 | 0.4027 | 0.0019 | 12.4981 | 10.2449 |
| GSE25066 | CCNB2 | 0.323932 | 0.3239 | 0.0006 | 9.4109 |
|
| PRC1 | 0.276034 | 0.2760 | 0.0023 | 6.6109 |
|
| UBE2C | 0.381925 | 0.3819 | 0.0003 | 6.1036 |
|
| ASPM | 0.207911 | 0.2079 | 0.0031 | 4.9210 |
|
| CDC20 | 0.329027 | 0.3290 | 0.0000 | 8.5936 |
|
| FOXM1 | 0.170967 | 0.1710 | 0.0091 | 5.9345 |
|
| CEP55 | 0.304415 | 0.3044 | 0.0002 | 6.3694 |
|
| KIF4A | 0.568168 | 0.5682 | 0.0001 | 3.1945 |
|
| NUSAP1 | 0.270014 | 0.2700 | 0.0061 | 6.7332 |
|
| PTTG1 | 0.791755 | 0.7918 | 0.0000 | 4.0029 |
Discussion
Two gene expression datasets of breast cancer were
obtained and the 2,669 differentially expressed genes with a CV
>0.5 were selected. These genes were implicated in the immune
response, cell proliferation and cell migration. These functions
were closely associated with the development and metastasis of
cancer. A breast-cancer-specific gene co-expression network was
constructed for dataset GSE2034, from which 7 modules were
identified. The yellow module was closely associated with survival
time and, as such, the 144 genes from yellow module were
investigated further. These genes were primarily involved in the
cell cycle and tumor protein p53 signaling pathway. The top 10 hub
genes were identified in the yellow module, all of which were
associated with poor patient prognosis.
The majority of the 10 critical genes in the yellow
module are associated with the cell cycle. CCNB2 is an essential
component of the cell-cycle regulatory machinery (20). Elevated CCNB2 expression in invasive
breast cancer is associated with unfavorable clinical outcomes
(21). UBE2C is required for the
degradation of mitotic cyclins and for cell-cycle progression, and
is involved in cancer progression. UBE2C is highly expressed in
breast microcalcification lesions (22). The prognostic value of UBE2C has been
validated in several studies (23–25).
microRNA-196a post-transcriptionally upregulates UBE2C and promotes
cell proliferation in breast cancer (26). Inhibition of UBE2C reduces
proliferation and sensitizes breast cancer cells to radiotherapy
and chemotherapy (27), suggesting
that it could serve as a potential therapeutic target. CDC20 is a
regulatory protein in the cell cycle. Overexpression of CDC20
predicts short-term breast cancer survival (22). ASPM is essential for normal mitotic
spindle function and is a marker for vascular invasion, early
recurrence and poor prognosis of hepatocellular carcinoma (28). Increased ASPM expression is also
associated with enhanced tumor grade and lower survival rates of
epithelial ovarian cancer (29). A
significant correlation between the expression of the CCNB2 and
ASPM proteins is reported (21),
which may serve a role in the development of breast cancer.
FOXM1 is a transcriptional activator involved in
cell proliferation, which is a downstream target and marker of HER2
overexpression in breast cancer (30). FOXM1 is implicated in the
proliferation, migration and invasion of breast cancer cells
(31,32) and serves a role in chemotherapy
resistance (33,34). KIF4A is an ATP-dependent
microtubule-based motor protein that is involved in the
intracellular transport of membranous organelles. KIF4A is
implicated in doxorubicin-induced apoptosis in breast cancer cells
(35). NUSAP1 may be involved in
tumorigenesis and in the processes of invasion and progression of
breast cancer (36); it influences
the DNA damage response by controlling the protein levels of BRCA1
(37). PTTG1 exhibits tumorigenic
activity in vivo and is highly expressed in various tumors;
it is associated with endocrine therapy resistance in breast cancer
(38). PTTG1 may promote tumor
malignancy via the epithelial-to-mesenchymal transition and the
expansion of the cancer stem cell population (39). CEP55 is also involved in breast cancer
progression (40), possibly exerting
an oncogenic function via regulation of the phosphoinositide-3
kinase/protein kinase B pathway and midbody fate (41).
PRC1 encodes a protein involved in cytokinesis,
specifically the polarization of parallel microtubules, whose
expression level changes markedly in the different phases of the
cell cycle. PRC1 has been demonstrated to be a substrate of several
cyclin-dependent kinases (CDKs); its alternative splicing results
in multiple transcript variants (42,43).
Although PRC1 serves an important role in the cell cycle, its role
in breast cancer remains unclear. The results of the present study
indicate that the role of PRC1 in the pathogenesis of breast cancer
necessitates further study.
Gene co-expression network analysis revealed several
genes of prognostic significance in breast cancer. The majority of
these genes have been validated by previous studies; however, the
function of certain critical genes identified by gene co-expression
network analysis in breast cancer remains unclear, thus providing
targets for further studies. These prospective studied may disclose
novel biomarkers or provide targets for breast cancer
therapies.
References
|
1
|
McGuire S: World Cancer Report 2014.
Geneva, Switzerland: World health organization, international
agency for research on cancer, WHO Press, 2015. Adv Nutr.
7:418–419. 2016. View Article : Google Scholar : PubMed/NCBI
|
|
2
|
Takahashi S, Moriya T, Ishida T, Shibata
H, Sasano H, Ohuchi N and Ishioka C: Prediction of breast cancer
prognosis by gene expression profile of TP53 status. Cancer Sci.
99:324–332. 2008. View Article : Google Scholar : PubMed/NCBI
|
|
3
|
Atsushi T, Nagireddy P, Prachi M, Mathé
EA, Dorsey TH, Yi M, Wallace TA, Issaq HJ, Zhou M, Killian JK, et
al: MYC-driven accumulation of 2-hydroxyglutarate is associated
with breast cancer prognosis. J Clin Invest. 124:398–412. 2014.
View Article : Google Scholar : PubMed/NCBI
|
|
4
|
Holmes MD, Chen WY, Schnitt SJ, Collins L,
Colditz GA, Hankinson SE and Tamimi RM: COX-2 expression predicts
worse breast cancer prognosis and does not modify the association
with aspirin. Breast Cancer Res Treat. 130:657–662. 2011.
View Article : Google Scholar : PubMed/NCBI
|
|
5
|
Kontzoglou K, Palla V, Karaolanis G,
Karaiskos I, Alexiou I, Pateras I, Konstantoudakis K and Stamatakos
M: Correlation between Ki67 and Breast Cancer Prognosis. Oncology.
84:219–225. 2013. View Article : Google Scholar : PubMed/NCBI
|
|
6
|
Decock J, Long JR, Laxton RC, Shu XO,
Hodgkinson C, Hendrickx W, Pearce EG, Gao YT, Pereira AC, Paridaens
R, et al: Association of matrix metalloproteinase-8 gene variation
with breast cancer prognosis. Cancer Res. 67:10214–10221. 2007.
View Article : Google Scholar : PubMed/NCBI
|
|
7
|
Manjili MH, Najarian K and Wang XY:
Signatures of tumor-immune interactions as biomarkers for breast
cancer prognosis. Future Oncol. 8:703–711. 2012. View Article : Google Scholar : PubMed/NCBI
|
|
8
|
Zhang Z, Ni C, Chen W, Wu P, Wang Z, Yin
J, Huang J and Qiu F: Expression of CXCR4 and breast cancer
prognosis: A systematic review and meta-analysis. Bmc Cancer.
14:492014. View Article : Google Scholar : PubMed/NCBI
|
|
9
|
Zhang L, Song X, Wang X, Xie Y, Wang Z, Xu
Y, You X, Liang Z and Cao H: Circulating DNA of HOTAIR in serum is
a novel biomarker for breast cancer. Breast Cancer Res Treat.
152:199–208. 2015. View Article : Google Scholar : PubMed/NCBI
|
|
10
|
Lee YH, Liu X, Qiu F, O'Connor TR, Yen Y
and Ann DK: Correction: HP1β is a biomarker for breast cancer
prognosis and PARP inhibitor therapy. PLoS One. 10:e01248532015.
View Article : Google Scholar : PubMed/NCBI
|
|
11
|
Garczyk S, von Stillfried S, Antonopoulos
W, Hartmann A, Schrauder MG, Fasching PA, Anzeneder T, Tannapfel A,
Ergönenc Y, Knüchel R, et al: Agr3 in breast cancer: Prognostic
impact and suitable serum-based biomarker for early cancer
detection. PLoS One. 10:e01221062015. View Article : Google Scholar : PubMed/NCBI
|
|
12
|
Brennan DJ, Kelly C, Rexhepaj E, Dervan
PA, Duffy MJ and Gallagher WM: Contribution of DNA and tissue
microarray technology to the identification and validation of
biomarkers and personalised medicine in breast cancer. Cancer
Genomics Proteomics. 4:121–134. 2007.PubMed/NCBI
|
|
13
|
Miecznikowski JC, Wang D, Liu S, Sucheston
L and Gold D: Comparative survival analysis of breast cancer
microarray studies identifies important prognostic genetic
pathways. BMC Cancer. 10:5732010. View Article : Google Scholar : PubMed/NCBI
|
|
14
|
Wang Y, Klijn JG, Zhang Y, Sieuwerts AM,
Look MP, Yang F, Talantov D, Timmermans M, Meijer-van Gelder ME, Yu
J, et al: Gene-expression profiles to predict distant metastasis of
lymph-node-negative primary breast cancer. Lancet. 365:671–679.
2005. View Article : Google Scholar : PubMed/NCBI
|
|
15
|
Hatzis C, Pusztai L, Valero V, Booser DJ,
Esserman L, Lluch A, Vidaurre T, Holmes F, Souchon E, Wang H, et
al: A genomic predictor of response and survival following
taxane-anthracycline chemotherapy for invasive breast cancer. JAMA.
305:1873–1881. 2011. View Article : Google Scholar : PubMed/NCBI
|
|
16
|
Gautier L, Cope L, Bolstad BM and Irizarry
RA: affy-analysis of Affymetrix GeneChip data at the probe level.
Bioinformatics. 20:307–315. 2004. View Article : Google Scholar : PubMed/NCBI
|
|
17
|
Dennis G Jr, Sherman BT, Hosack DA, Yang
J, Gao W, Lane HC and Lempicki RA: DAVID: Database for annotation,
visualization and integrated discovery. Genome Biol. 4:P32003.
View Article : Google Scholar : PubMed/NCBI
|
|
18
|
Langfelder P and Horvath S: WGCNA: An R
package for weighted correlation network analysis. BMC
Bioinformatics. 9:5592008. View Article : Google Scholar : PubMed/NCBI
|
|
19
|
Becker RA, Chambers JM and Wilks AR: The
New S Language. Wadsworth & Brooks/Cole; Monterey: 1988,
View Article : Google Scholar
|
|
20
|
Nasmyth K: Viewpoint: Putting the cell
cycle in order. Science. 274:1643–1645. 1996. View Article : Google Scholar : PubMed/NCBI
|
|
21
|
Shubbar E, Kovács A, Hajizadeh S, Parris
TZ, Nemes S, Gunnarsdóttir K, Einbeigi Z, Karlsson P and Helou K:
Elevated cyclin B2 expression in invasive breast carcinoma is
associated with unfavorable clinical outcome. Bmc Cancer. 13:12013.
View Article : Google Scholar : PubMed/NCBI
|
|
22
|
Chou CP, Huang NC, Jhuang SJ, Pan HB, Peng
NJ, Cheng JT, Chen CF, Chen JJ and Chang TH: Ubiquitin-conjugating
enzyme UBE2C is highly expressed in breast microcalcification
lesions. PLoS One. 9:e939342014. View Article : Google Scholar : PubMed/NCBI
|
|
23
|
Psyrri A, Kalogeras KT, Kronenwett R,
Wirtz RM, Batistatou A, Bournakis E, Timotheadou E, Gogas H,
Aravantinos G, Christodoulou C, et al: Prognostic significance of
UBE2C mRNA expression in high-risk early breast cancer. A Hellenic
Cooperative Oncology Group (HeCOG) Study. Ann Oncol. 23:1422–1427.
2012. View Article : Google Scholar : PubMed/NCBI
|
|
24
|
Psyrri D, Kronenwett R, Timotheadou E,
Wirtz RM, Onyenadum A, Pentheroudakis GE, Papadimitriou CA, Razis
E, Economopoulos T and Fountzilas G: Evaluation of the prognostic
value of UBE2C mRNA levels in early breast cancer. J Clinical
Oncol. 28 (15 suppl):S105702010. View Article : Google Scholar
|
|
25
|
Loussouarn D, Campion L, Leclair F,
Campone M, Charbonnel C, Ricolleau G, Gouraud W, Bataille R and
Jézéquel P: Validation of UBE2C protein as a prognostic marker in
node-positive breast cancer. Br J Cancer. 101:166–173. 2009.
View Article : Google Scholar : PubMed/NCBI
|
|
26
|
Han Q, Zhou C, Liu F, Xu G, Zheng R and
Zhang X: MicroRNA-196a post-transcriptionally upregulates the UBE2C
proto-oncogene and promotes cell proliferation in breast cancer.
Oncol Rep. 34:877–883. 2015. View Article : Google Scholar : PubMed/NCBI
|
|
27
|
Rawat A, Gopal G, Selvaluxmy G and
Rajkumar T: Inhibition of ubiquitin conjugating enzyme UBE2C
reduces proliferation and sensitizes breast cancer cells to
radiation, doxorubicin, tamoxifen and letrozole. Cell Oncol
(Dordr). 36:459–467. 2013. View Article : Google Scholar : PubMed/NCBI
|
|
28
|
Lin SY, Pan HW, Liu SH, Jeng YM, Hu FC,
Peng SY, Lai PL and Hsu HC: ASPM is a novel marker for vascular
invasion, early recurrence, and poor prognosis of hepatocellular
carcinoma. Clin Cancer Res. 14:4814–4820. 2008. View Article : Google Scholar : PubMed/NCBI
|
|
29
|
Brüning-Richardson A, Bond J, Alsiary R,
Richardson J, Cairns DA, McCormack L, Hutson R, Burns P, Wilkinson
N, Hall GD, et al: ASPM and microcephalin expression in epithelial
ovarian cancer correlates with tumour grade and survival. Br J
Cancer. 104:1602–1610. 2011. View Article : Google Scholar : PubMed/NCBI
|
|
30
|
Francis RE, Myatt SS, Krol J, Hartman J,
Peck B, McGovern UB, Wang J, Guest SK, Filipovic A, Gojis O, et al:
FoxM1 is a downstream target and marker of HER2 overexpression in
breast cancer. Int J Oncol. 35:57–68. 2009.PubMed/NCBI
|
|
31
|
Ahmad A, Wang Z, Kong D, Ali S, Li Y,
Banerjee S, Ali R and Sarkar FH: Foxm1 down-regulation leads to
inhibition of proliferation, migration and invasion of breast
cancer cells through the modulation of extra-cellular matrix
degrading factors. Breast Cancer Res Treat. 122:337–346. 2010.
View Article : Google Scholar : PubMed/NCBI
|
|
32
|
Yang C, Chen H, Tan G, Gao W, Cheng L,
Jiang X, Yu L and Tan Y: FOXM1 promotes the epithelial to
mesenchymal transition by stimulating the transcription of slug in
human breast cancer. Cancer Lett. 340:104–112. 2013. View Article : Google Scholar : PubMed/NCBI
|
|
33
|
Kwok JM, Peck B, Monteiro LJ, Schwenen HD,
Millour J, Coombes RC, Myatt SS and Lam EW: FOXM1 confers acquired
cisplatin resistance in breast cancer cells. Mol Cancer Res.
8:24–34. 2010. View Article : Google Scholar : PubMed/NCBI
|
|
34
|
Millour J, Constantinidou D, Stavropoulou
AV, Wilson MS, Myatt SS, Kwok JM, Sivanandan K, Coombes RC, Medema
RH, Hartman J, et al: FOXM1 is a transcriptional target of ERalpha
and has a critical role in breast cancer endocrine sensitivity and
resistance. Oncogene. 29:2983–2995. 2010. View Article : Google Scholar : PubMed/NCBI
|
|
35
|
Wang H, Lu C, Li Q, Xie J, Chen T, Tan Y,
Wu C and Jiang J: The Role of Kif4A in doxorubicin-induced
apoptosis in breast cancer cells. Mol Cells. 37:812–818. 2014.
View Article : Google Scholar : PubMed/NCBI
|
|
36
|
Colak D, Nofal A, Albakheet A, Nirmal M,
Jeprel H, Eldali A, Al-Tweigeri T, Tulbah A, Ajarim D, Malik OA, et
al: Age-specific gene expression signatures for breast tumors and
cross-species conserved potential cancer progression markers in
young women. PLoS One. 8:e632042013. View Article : Google Scholar : PubMed/NCBI
|
|
37
|
Kotian S, Banerjee T, Lockhart A, Huang K,
Catalyurek UV and Parvin JD: NUSAP1 influences the DNA damage
response by controlling BRCA1 protein levels. Cancer Biol Ther.
15:533–543. 2014. View Article : Google Scholar : PubMed/NCBI
|
|
38
|
Ghayad SE, Vendrell JA, Bieche I, Spyratos
F, Dumontet C, Treilleux I, Lidereau R and Cohen PA: Identification
of TACC1, NOV, and PTTG1 as new candidate genes associated with
endocrine therapy resistance in breast cancer. J Mol Endocrinol.
42:87–103. 2009. View Article : Google Scholar : PubMed/NCBI
|
|
39
|
Yoon CH, Kim MJ, Lee H, Kim RK, Lim EJ,
Yoo KC, Lee GH, Cui YH, Oh YS, Gye MC, et al: PTTG1 promotes tumor
malignancy via epithelial to mesenchymal transition and expansion
of cancer stem cell population. J Biol Chem. 287:19516–19527. 2012.
View Article : Google Scholar : PubMed/NCBI
|
|
40
|
Jeffery J, Sinha D, Srihari S, Kalimutho M
and Khanna KK: Beyond cytokinesis: The emerging roles of CEP55 in
tumorigenesis. Oncogene. 35:683–690. 2016. View Article : Google Scholar : PubMed/NCBI
|
|
41
|
Subramanian R, Wilson-Kubalek EM, Arthur
CP, Bick MJ, Campbell EA, Darst SA, Milligan RA and Kapoor TM:
Insights into antiparallel microtubule crosslinking by PRC1, a
conserved nonmotor microtubule binding protein. Cell. 142:433–443.
2010. View Article : Google Scholar : PubMed/NCBI
|
|
42
|
Shrestha S, Wilmeth LJ, Eyer J and Shuster
CB: PRC1 controls spindle polarization and recruitment of
cytokinetic factors during monopolar cytokinesis. Mol Biol Cell.
23:1196–1207. 2012. View Article : Google Scholar : PubMed/NCBI
|
|
43
|
van den Boom V, Rozenveld-Geugien M,
Bonardi F, Malanga D, van Gosliga D, Heijink AM, Viglietto G,
Morrone G, Fusetti F, Vellenga E and Schuringa JJ: Nonredundant and
locus-specific gene repression functions of PRC1 paralog family
members in human hematopoietic stem/progenitor cells. Blood.
121:2452–2461. 2013. View Article : Google Scholar : PubMed/NCBI
|