Introduction
Breast cancer is the most common malignancy in women
worldwide (1,2). The etiology of breast cancer is
complicated and the prognosis of patients is hard to predict.
Therefore, identifying novel biomarkers to predict prognosis and
determine the treatment method is important. Previous research into
the etiology of breast cancer has focused on the role of the
immunity (3,4). The transcription factor PU.1 is a
critical regulator of cellular communication in the immune system
(5). PU.1 is one of the members of
E-twenty six (ETS) transcription factor family and is encoded by
the spleen focus forming virus proviral integration site 1
(SPI1) gene in humans (6).
PU.1 is able to activate gene expression during myeloid, erythroid
and B-lymphoid cell development (7,8).
Furthermore, two isoforms of the human protein are produced by
alternative splicing (9). Mice
lacking PU.1 do not produce lymphocytes, myeloid cells or the
progenitors for these cells (9,10). High
expression of PU.1 in hematopoietic progenitors directs myeloid
development, and low expression directs B cell development
(11).
Moreover, the loss of cellular communication caused
by reduced PU.1 levels is able to lead to leukemia (5). Mice carrying hypomorphic SPI1
alleles that reduce PU.1 expression exhibit blockade of myeloid
differentiation, leading to the development of acute myeloid
leukemia (12). In classical Hodgkin
lymphoma cells, PU.1 is a potent tumor suppressor, and the
induction of PU.1 expression is a potential therapeutic option for
patients with classical Hodgkin lymphoma (13). It has also been recently reported that
minimal PU.1 reduction induces a preleukemic state and promotes
development of acute myeloid leukemia (14). PU.1 reduces the transcriptional
activity of the p53 tumor suppressor family and thus inhibits the
activation of genes important for cell cycle regulation and
apoptosis (15). It has also been
reported that PU.1 functions as oncogene in Friend virus-induced
erythroleukemia and as a tumor suppressor in acute myeloid leukemia
(15). Therefore, these studies
suggest that PU.1 may have an important role in tumor genesis and
progression, and may be an attractive therapeutic target in
cancer.
However to date, to the best of our knowledge, no
studies have suggested the significance of PU.1 expression in solid
tumors, including breast cancer. For the first time, to the best of
our knowledge, the expression of PU.1 protein was detected by
immunohistochemical (IHC) staining using a tissue microarray (TMA)
and paraffin-embedded sections. In addition, the results were
validated by western blotting using pair-matched breast samples.
PU.1 expression in breast tissues from Tumor Cancer Genome Atlas
(TCGA) database was also analyzed. The associations between PU.1
expression level and clinicopathological features, including
overall survival (OS) of patients, were examined.
Materials and methods
Patients and tissue samples
The formalin-fixed paraffin-embedded specimens with
80 invasive breast cancer samples and paired 50 control breast
tissues used for IHC were collected from patients from the
Department of Pathology at the First Affiliated Hospital of Harbin
Medical University (Harbin, China) from 7 January 2015 to 20
January 2016. Breast tumor TMAs (HBre-Duc150Sur-01 and
HBre-Duc090Sur-01) were obtained from Shanghai Outdo Biotech Co.
(Shanghai, China). The array contains 150 cases of invasive ductal
carcinoma. In parallel, 90 normal breast tissues from the regions
around the tumor were included for control. However, only 60
samples were confirmed as normal breast tissues by pathologists.
None of the patients received adjuvant chemotherapy, immunotherapy
or radiotherapy prior to surgery. According to clinical
requirement, estrogen receptor (ER), progesterone receptor (PR),
human epidermal growth factor receptor 2 (Her-2), Ki67, p53,
androgen receptor (AR) and epidermal growth factor receptor (EGFR)
were also routinely stained for all invasive breast cancer
patients. All tissue specimens and slides were examined by
experienced pathologists. Clinical and pathological information was
extracted from medical charts and pathology reports of the
patients. Samples that exhibited nuclear staining for ER or PR in
>1% of the cells were considered as positive (16). Positive staining for Her-2 was defined
on the basis of the percentage of tumor cells and the intensity of
membrane staining. Her-2 was scored from 0 to 3+ on the basis of
the method recommended for the Dako Hercep test (Dako; Agilent
Technologies, Inc., Santa Clara, CA, USA). Tumors were recognized
as positive for Her-2 if immunostaining was scored as 3+ or when
the Her-2 fluorescence in situ hybridization amplification
ratio was >2.2 (17). Positive
thresholds for p53 and Ki-67 were 20 and 15% (18), respectively. AR was classified as
positive or negative, with no scoring system used (19). For EGFR, positive membrane staining of
≥10% cells was defined as positive tumor expression (20). The Tumor-Node-Metastasis staging
system of breast cancer cases was assessed according to the
American Joint Committee on Cancer Staging Manual, 7th edition
(21). The present study was approved
by the Ethical Committee of the Third Affiliated Hospital of Harbin
Medical University, Harbin, China. All patients provided written
informed consent for participation in the present study.
Follow-up of TMA
All the breast cancer patients from TMA in the
present study were followed-up periodically for survival analysis
until mortality or until the study ended (July 2014). The median
follow-up time among the 150 patients was 111 months, with a range
of 4–162 months. Clinical records of the patients were obtained
from the Shanghai Outdo Biotech Co.
Immunohistochemical staining
All tissue blocks were fixed in 4% formalin for 24 h
at room temperature and were cut in a microtome to 4 µm. The tissue
sections were dried at 60°C for 1 h. The tissue sections were
dewaxed in xylene and rehydrated through graded alcohol
concentrations using standard procedures. Antigen retrieval was
performed in citrate buffer (pH 6.0) and autoclaved at 121°C for 90
sec. Following washing in PBS (three washes with a duration of 3
min for each wash), the sections were blocked with goat serum
(Wuhan Boster Biological Technology, Ltd., Wuhan, China) at room
temperature for 30 min. Then, each section was treated with PU.1
rabbit polyclonal antibodies (1:200; cat. no. sc-352; Santa Cruz
Biotechnology, Inc., Dallas, TX, USA) at 4°C overnight. Following
washing in PBS (three washes with 3 min for each wash), each
section was incubated with Polink-1 HRP DAB Detection system and
One-step Polymer Detection system for rabbit antibody (cat. no.
PV-6001; OriGene Technologies, Inc., Beijing, China) at room
temperature for 20 min. Following washing in PBS (three washes with
3 min for each wash), the slides were counterstained with
hematoxylin for 50 sec at room temperature. For negative controls,
the primary antibody was substituted with PBS. In line with the
study by Cattoretti et al (22), human tonsil tissues (obtained from the
Department of Otorhinolaryngology, The Second Affiliated Hospital
of Harbin Medical University) were used as PU.1 positive controls
(22).
Evaluation of IHC staining
Evaluation of PU.1 staining was performed with
bright-field light microscopy independently by two experienced
pathologists, who had no knowledge of the clinicopathological
information. Staining of PU.1 protein was observed in the
cytoplasm, and the tissues were divided into three groups according
to expression level as follows: 0–24, 25–49 and ≥50% positive
staining of tumor cells. Expression was considered as positive, if
≥25% of the neoplastic cells were stained and as negative if ≤25%
of the neoplastic cells were stained (23). Furthermore, cases with discrepancies
were re-reviewed simultaneously by the two pathologists, and a
senior pathologist until a consensus was reached.
Western blot analysis
Frozen tissue samples were homogenized in
Radioimmunoprecipitation Assay buffer consisting of 1% protease
inhibitor mixture. The mixture was centrifuged at 14,000 × g for 15
min at 4°C, and the supernatant was obtained. Total protein was
quantified using the BCA Protein Assay kit (Beyotime Institute of
Biotechnology, Shanghai, China), and 30 µg protein per sample was
separated by 12% SDS-PAGE and then transferred to a
methanol-activated polyvinylidene difluoride membrane. Prior to
immunodetection, the membranes were blocked with 5% non-fat dried
milk in TBST. The aforementioned PU.1 rabbit polyclonal antibody
(1:200) was diluted in the buffer and incubated at 4°C overnight.
Following subsequent washing with TBST, the membranes were
incubated with secondary antibody [horseradish
peroxidase-conjugated affinipure goat anti-rabbit IgG (H + L);
1:5,000; cat. no. ZB-2301; Origene Technologies, Inc.] for 1 h at
room temperature. Mouse-anti-β-actin antibody was used as reference
(GeneTex, Inc., Irvine, CA, USA). The experiment was repeated in
triplicate. The bands were detected by enhanced chemiluminescence
detection reagents (Applygen Technologies, Inc., Beijing,
China).
Fluorescence in situ hybridization
(FISH)
FISH analysis was performed on paraffin-embedded
sections at 4-µm thickness using the Vysis LSI HER2 Spectrum Orange
and CEP17 Spectrum Green Dual Color DNA Probe kit (cat. no.
36-161060; Vysis PathVysion; Abbot Laboratories, Abbott Park, IL,
USA) in line with the manufacturer's instructions. Pretreated
procedure comprised the following steps: Incubation of sections in
Hemo-De for 10 min at room temperature, (repeated twice), then
deparaffinization, deproteinization and refixation. Then, according
to the protocol, the sections were denatured and hybridized at 42°C
overnight in a hybridization oven. Finally the sections were washed
and counterstained with DAPI (Invitrogen; Thermo Fisher Scientific,
Inc., Waltham, MA, USA). Scoring of Her-2 and CEP17 probe signals
performed using a fluorescence microscope (BX51; Olympus
Corporation, Tokyo, Japan). The slides were re-evaluated by two
independent pathologists, and the invasive areas were identified.
The pathologists assessed Her-2 status following the 2013 American
Society of Clinical Oncology/College of American Pathologists
recommendations (24).
Statistical analysis
All statistical analyses were performed by using
SPSS software (version 17.0; SPSS, Inc., Chicago, IL, USA). The
chi-square test was used to compare PU.1 expression between breast
cancer and normal breast tissue groups. The association between the
PU.1 protein and clinicopathologic parameters was also assessed
using chi-square tests. Furthermore, the correlation between PU.1
expression and Her-2 status was assessed using Pearson's
coefficient. For analysis of the follow-up data, the Kaplan-Meier
method and log-rank test were used to estimate OS. The effects of
different variables on survival were assessed using Cox regression
in univariate and multivariate analyses. P<0.05 was considered
to indicate a statistically significant difference.
Results
Characteristics of patients
The clinical characteristics of the patients were
listed in Table I. The median age of
the patients was 52 years old (range, 23–83). Of all the patients
with available clinical information (n=230), lymph node metastasis
(LNM) was present in 122 patients (122/201; 60.7%), and absent in
79 patients (79/201; 39.3%). A total of 116 (116/169; 68.6%)
patients were classified at TNM stages I and II, and 53 (53/169;
31.4%) patients were at stage III. A total of 180 (180/218; 82.6%)
patients were classified as histological grades I and II, and the
grade III were 38 (38/218; 17.4%).
 | Table I.Clinicopathological characteristics of
patients with breast cancer. |
Table I.
Clinicopathological characteristics of
patients with breast cancer.
| Characteristics | Number of cases
(n=230) |
|---|
| Age, years |
|
|
Median | 52 |
|
Range | 23–83 |
| Tumor size, cm |
|
| ≤2 | 62 |
|
>2 | 143 |
| LNM |
|
|
Negative | 79 |
|
Positive | 122 |
| TNM stage |
|
|
I–II | 116 |
|
III | 53 |
| Histological
grade |
|
|
I–II | 180 |
|
III | 38 |
| ER |
|
|
Negative | 105 |
|
Positive | 118 |
| PR |
|
|
Negative | 121 |
|
Positive | 99 |
| Her-2 |
|
|
Negative | 128 |
|
Positive | 98 |
| Ki67 |
|
|
Negative | 91 |
|
Positive | 119 |
| p53 |
|
|
Negative | 118 |
|
Positive | 85 |
| AR |
|
|
Negative | 70 |
|
Positive | 75 |
| EGFR |
|
|
Negative | 122 |
|
Positive | 72 |
| Subtype |
|
| Luminal
A | 43 |
| Luminal
B | 77 |
|
Her-2 | 49 |
|
Basal-like | 46 |
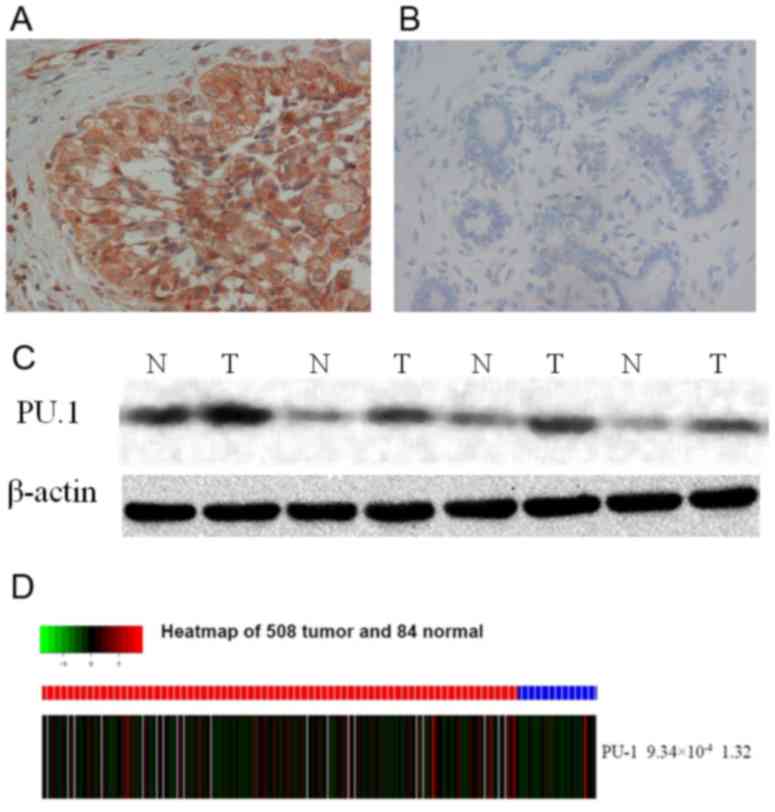
High expression of PU.1 protein in
breast cancer tissues
In the present study, the expression of PU.1 protein
was detected in breast cancer and normal breast tissues by IHC and
western blotting. There was a markedly higher level of PU.1
expression in breast cancer tissues compared with normal tissues
(Fig. 1A and B). The IHC results
indicated that PU.1 expression was detected in the cytoplasm of
invasive breast cancer cells (Fig. 1A and
B). Of the 230 breast cancer specimens, positive PU.1
expression was detected in 139 (139/230; 60.4%) samples, and
positive PU.1 expression was only detected in 31 out of 110 (28.2%)
paired normal tissues (P=2.63×10⁻⁸; Table II). Markedly increased expression of
PU.1 was also detected in breast cancer tissues compared with the
matched normal tissues by western blotting (Fig. 1C). Consistent with these results, PU.1
expression was observed to be significantly higher in breast cancer
tissues compared with non-tumor tissues from the TCGA database
(P=9.34×10⁻⁴) (508 breast tumor samples and 83 adjacent
non-tumor breast tissues) as shown in heat map (Fig. 1D).
| Table II.Expression of PU.1 in normal breast
epithelial and breast cancer tissues. |
Table II.
Expression of PU.1 in normal breast
epithelial and breast cancer tissues.
|
|
| PU.1 expression, n
(%) |
|
|---|
|
|
|
|
|
|---|
| Groups | n | Negative | Positive | P-value |
|---|
| Normal breast
tissue | 110 | 79 (71.8) | 31 (28.2) |
2.63×10⁻⁸ |
| Breast cancer | 230 | 91 (39.6) | 139 (60.4) |
|
Associations between PU.1 protein
immunoreactivity and clinicopathological parameters
The association between PU.1 protein expression and
clinicopathological variables of the 230 breast cancer specimens
was analyzed (Table III). Increased
expression of PU.1 was associated with Her-2 expression, AR
expression and molecular subtypes (Table III). There were 94 out of 98
patients (95.9%) who were Her-2 positive compared with 43 out of
128 (33.6%) who were Her-2 negative. In addition, there was a
significantly higher incidence of PU.1 expression in these patients
that were Her-2 positive compared with patients who were Her-2
negative (P=2.03×10⁻²¹; Table III). Pearson's coefficient analysis
suggested that PU.1 expression was positively correlated with Her-2
status (R=0.632, P=7.31×10⁻²⁶).
| Table III.Associations between PU.1 expression
and clinicopathological factors of patients with breast cancer. |
Table III.
Associations between PU.1 expression
and clinicopathological factors of patients with breast cancer.
|
|
| PU.1
expression |
|
|---|
|
|
|
|
|
|---|
| Variables | n | Negative | Positive | P-value |
|---|
| Age, years |
|
|
|
|
|
≤50 | 108 | 49 (45.4) | 59 (54.6) | 0.068 |
|
>50 | 122 | 41 (33.6) | 81 (66.4) |
|
| Tumor size, cm |
|
|
|
|
| ≤2 | 62 | 21 (33.9) | 41 (66.1) | 0.473 |
|
>2 | 143 | 56 (39.2) | 87 (60.8) |
|
| LNM |
|
|
|
|
|
Negative | 79 | 30 (38.0) | 49 (62.0) | 0.938 |
|
Positive | 122 | 47 (38.5) | 75 (61.5) |
|
| TNM stage |
|
|
|
|
|
I–II | 116 | 48 (41.4) | 68 (58.6) | 0.164 |
|
III | 53 | 16 (30.2) | 37 (69.8) |
|
| Histological
grade |
|
|
|
|
|
I–II | 180 | 70 (38.9) | 110 (61.1) | 0.946 |
|
III | 38 | 15 (39.5) | 23 (60.5) |
|
| ER status |
|
|
|
|
|
Negative | 105 | 38 (36.2) | 67 (63.8) | 0.231 |
|
Positive | 118 | 52 (44.1) | 66 (55.9) |
|
| PR status |
|
|
|
|
|
Negative | 121 | 43 (35.5) | 78 (64.5) | 0.232 |
|
Positive | 99 | 43 (43.4) | 56 (56.6) |
|
| Her-2 status |
|
|
|
|
|
Negative | 128 | 85 (66.4) | 43 (33.6) |
2.033×10⁻²¹ |
|
Positive | 98 | 4 (4.1) | 94 (95.9) |
|
| Ki67 status |
|
|
|
|
|
Negative | 91 | 40 (44.0) | 51 (56.0) | 0.161 |
|
Positive | 119 | 41 (34.5) | 78 (65.5) |
|
| p53 status |
|
|
|
|
|
Negative | 118 | 44 (37.3) | 74 (62.7) | 0.695 |
|
Positive | 85 | 34 (40.0) | 51 (60.0) |
|
| AR |
|
|
|
|
|
Negative | 70 | 32 (45.7) | 38 (54.3) | 0.027 |
|
Positive | 75 | 21 (28.0) | 54 (72.0) |
|
| EGFR |
|
|
|
|
|
Negative | 122 | 47 (38.5) | 75 (61.5) | 0.887 |
|
Positive | 72 | 27 (37.5) | 45 (62.5) |
|
| Molecular
subtypes |
|
|
|
|
| Luminal
A | 43 | 28 (65.1) | 15 (34.9) |
3.508×10⁻¹¹ |
| Luminal
B | 77 | 23 (29.9) | 54 (70.1) |
|
|
Her-2 | 49 | 2 (4.1) | 47 (95.9) |
|
|
Basal-like | 46 | 29 (63.0) | 17 (37.0) |
|
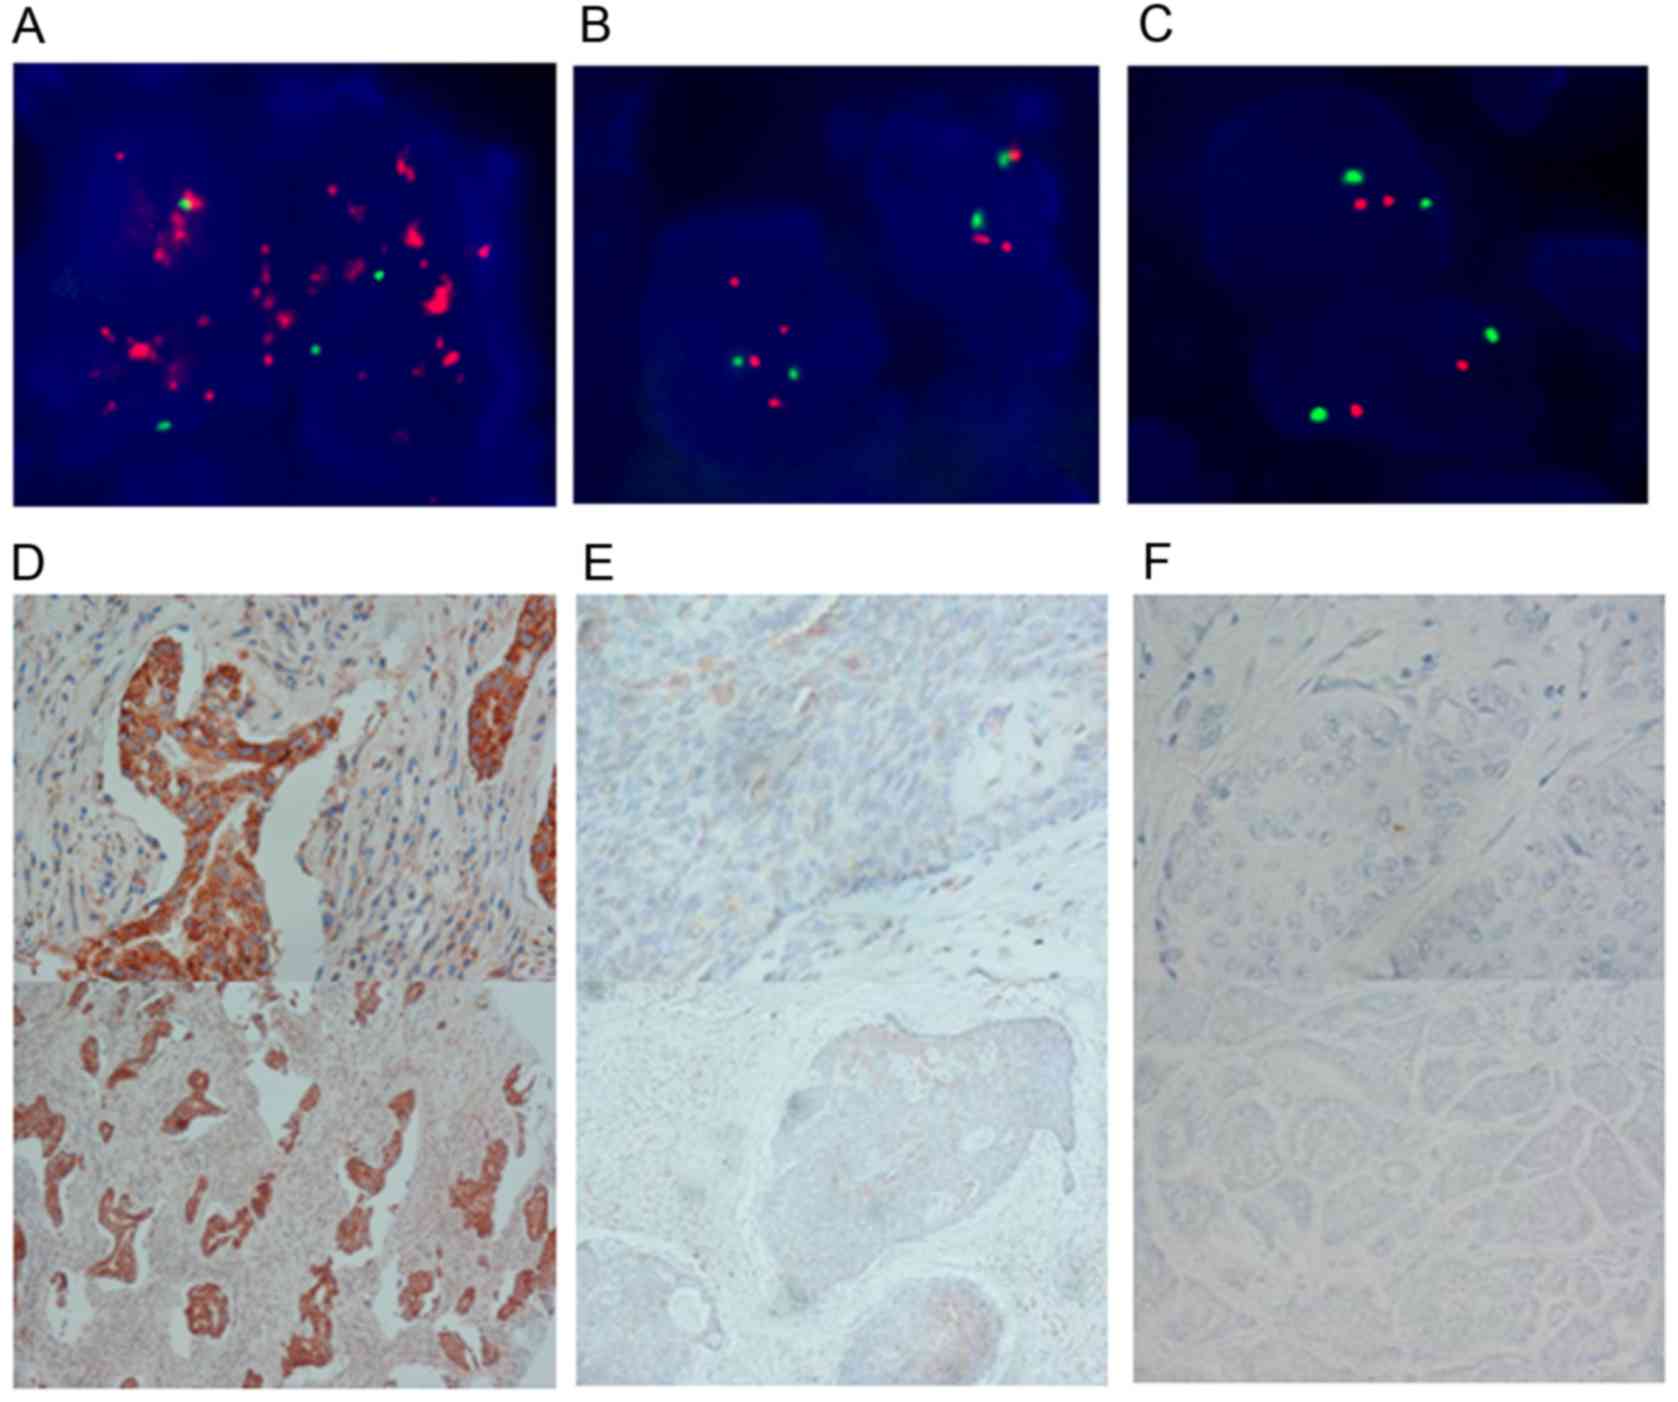
FISH was also performed to confirm the positive
correlation of Her-2 gene status with PU.1 expression (Fig. 2). Moreover, 54.3% (38/70) of the cases
in the AR-negative group were positive for PU.1, and 72.0% (54/75)
of the cases in the AR-positive group were positive for PU.1
(P=0.027; Table III). The
expression of PU.1 was associated with breast cancer subtypes, and
the rate of positive PU.1 expression was higher in cases positive
for Her-2 status (P=3.51×10⁻¹¹). No significant
association was observed between PU.1 expression and other
clinicopathological parameters, including age (P=0.068), tumor size
(P=0.473), lymph node metastasis (LNM) (P=0.938), TNM stage
(P=0.164), histological grade (P=0.946) and status of ER (P=0.231),
PR (P=0.232), p53 (P=0.695), Ki67 (P=0.161) and EGFR (P=0.887)
(Table III).
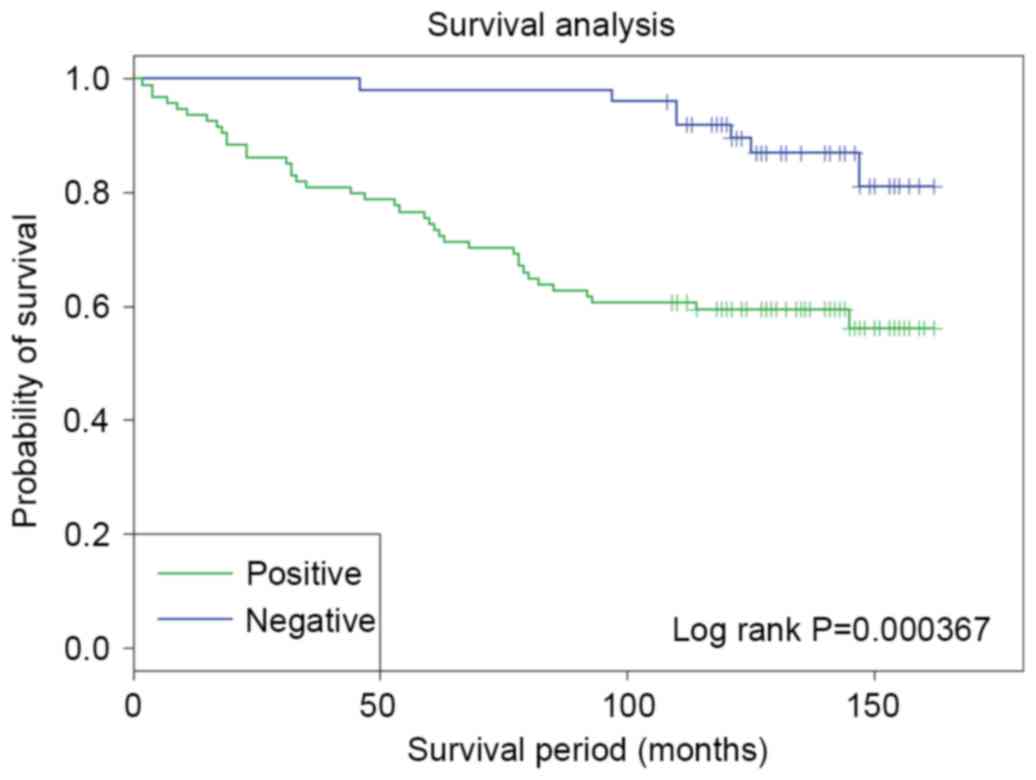
Prognostic significance of PU.1
expression in breast cancer
To further validate the potential clinical
significance of the PU.1 overexpression, the association between
PU.1 protein expression and OS was evaluated in 150 TMA breast
cancer samples with 10-year follow-up information from patients.
Kaplan Meier survival analysis and log-rank test were used. As
shown in Fig. 3, among the 150
patients, patients with PU.1 positive expression exhibited
significantly poorer outcome in terms of OS compared with patients
with negative PU.1 expression (P=3.67×10⁻⁴; log-rank
test).
Univariate and multivariate survival analyses were
also used to evaluate the association between PU.1 expression and
clinicopathological characteristics on prognosis (Table IV). Univariate analyses of OS using
Cox regression analysis identified TNM stage (P=0.007), Her-2
expression (P=0.005) and PU.1 expression (P=0.001) as significant
prognostic predictors. No other parameters were determined to have
statistically significant associations with prognosis. Using
multivariate analysis, it was identified that only TNM (P=0.018)
and PU.1 expression (P=0.034) were independent prognostic factors
(Table IV).
| Table IV.Prognostic factors in the Cox
proportional hazards model. |
Table IV.
Prognostic factors in the Cox
proportional hazards model.
| A, Univariate
analysis |
|---|
|
|---|
| Variables | Risk ratio | 95% CI | P-value |
|---|
| Age, years |
|
|
|
| ≤50 vs.
>50 | 0.697 | 0.385–1.260 | 0.232 |
| Tumor size, cm |
|
|
|
| ≤2 vs.
>2 | 0.770 | 0.382–1.552 | 0.465 |
| LNM |
|
|
|
|
Negative vs. positive | 0.734 | 0.388–1.390 | 0.342 |
| TNM stage |
|
|
|
| I and
II vs. III | 0.444 | 0.248–0.798 | 0.007 |
| Histological
grade |
|
|
|
| I vs.
II and III | 0.825 | 0.417–1.631 | 0.580 |
| ER status |
|
|
|
|
Negative vs. positive | 1.746 | 0.921–3.310 | 0.880 |
| PR status |
|
|
|
|
Negative vs. positive | 0.331 | 0.702–2.522 | 0.381 |
| Her-2 status |
|
|
|
|
Negative vs. positive | 0.398 | 0.211–0.752 | 0.005 |
| Ki67 status |
|
|
|
|
Negative vs. positive | 1.011 | 0.555–1.841 | 0.972 |
| p53 status |
|
|
|
|
Negative vs. positive | 0.999 | 0.537–1.856 | 0.997 |
| AR |
|
|
|
|
Negative vs. positive | 0.907 | 0.498–1.653 | 0.750 |
| EGFR |
|
|
|
|
Negative vs. positive | 0.609 | 0.332–1.118 | 0.110 |
| PU.1 |
|
|
|
|
Negative vs. positive | 0.242 | 0.108–0.543 | 0.001 |
|
| B, Multivariate
analysis |
|
|
Variable | Risk
ratio | 95% CI | P-value |
|
| TNM stage |
|
|
|
| I and
II vs. III | 0.480 | 0.262–0.879 | 0.018 |
| PU.1 |
|
|
|
|
Negative vs. positive | 0.265 | 0.118–0.598 | 0.034 |
Discussion
Studies have suggested that chronic or recurrent
inflammation may have a role in the development of breast cancer
(4,25). The transcription factor PU.1 is highly
expressed in immune cells and exerts key roles in several steps of
the inflammatory pathway (26).
Recently Kueh et al (27)
reported that positive feedback between PU.1 and cell cycle can
control myeloid differentiation.
In the present study, to the best of our knowledge,
the expression of PU.1 protein was analyzed by IHC for the first
time. High PU.1 expression was detected in 139 out of 230 (60.4%)
breast cancer specimens, while 31 out of 110 (28.2%) of normal
breast tissues exhibited high PU.1 expression.
Although there might be differences in PU.1
expression between Asian and American populations, the results are
consistent with analysis of TCGA data from an American population,
which indicates higher PU.1 expression level in breast cancer
tissues compared with normal breast tissues. The results in the
present study suggest that PU.1 may have an oncogenic role, which
contributes to the development of breast cancer. However, the
precise mechanisms underlying the regulation of PU.1 in breast
carcinogenesis was unclear.
To date, there have been a number of studies which
provided clues for the mechanisms of PU.1. Zhou et al
(28) suggested that PU.1 affects
proliferation of the human acute myeloid leukemia U937 cell line by
directly regulating MEIS1 promoter through a conserved binding
motif and Tschan et al (15)
reported the binding of PU.1 to the p53 family, which impairs its
transcriptional activity.
The associations between PU.1 expression with
clinicopathological parameters in breast cancer patients were also
examined. Overall, the findings indicate positive association of
PU.1 expression with AR, Her-2 and molecular subtype. However,
there was no statistically significant association detected between
PU.1 expression and p53 status. Furthermore, positive correlation
between Her-2 status and PU.1 expression was detected by Pearson's
coefficient analysis in the present study.
It has been previously reported that Her-2 status
was associated with malignancy and poor prognosis in breast cancer
(29,30). In the present study, high PU.1
expression was correlated with poorer OS in patients with breast
cancer. These results suggest that PU.1 expression may be used as a
marker to identify subsets of breast cancer patients with high
malignancy and poor prognosis. Therefore, further investigation is
required to elucidate whether combined detection of PU.1 expression
with Her-2 status would be more valuable in improving the
prediction of prognosis of patients with breast cancer. Moreover,
univariate and multivariate Cox regression analysis revealed that
PU.1 expression level and TNM stage were independent prognostic
factors for OS.
In future studies, the present authors will examine
the microRNA regulatory networks and transcription factor-DNA
networks for PU.1 and investigate the mechanisms involved in breast
cancer or subtype-specific breast cancer based on the finding of
positive correlation between PU.1 expression and Her-2 status
identified in the present study.
In conclusion, it was identified that PU.1
expression may be a valuable prognostic factor in patients with
breast cancer. The findings also indicated significant associations
between PU.1 expression and Her-2 and AR status as well as
molecular subtypes in breast cancer. These results suggested that
PU.1 is a potentially important target for the prediction of
prognosis. However, due to the limited sample size, these findings
remain to be confirmed by a larger study. More detailed
understanding of the signaling pathways regulated by PU.1 may
ultimately lead to ideas for novel molecular targeted therapies for
breast cancer.
Acknowledgements
The present study was funded by grants from the
National Natural Science Foundation of China (grant no. 81202074),
the Natural Science Foundation of Heilongjiang (grant no.
QC2016118) and the Foundation for Harbin Science and Technology
Innovation Talents [grant nos. 2016RAXYJ107 (to L.W.) and
2017LCZX74 (to J.L)].
References
|
1
|
Stagl JM, Bouchard LC, Lechner SC,
Blomberg BB, Gudenkauf LM, Jutagir DR, Glück S, Derhagopian RP,
Carver CS and Antoni MH: Long-term psychological benefits of
cognitive-behavioral stress management for women with breast
cancer: 11-year follow-up of a randomized controlled trial. Cancer.
121:1873–1881. 2015. View Article : Google Scholar : PubMed/NCBI
|
|
2
|
DeSantis C, Ma J, Bryan L and Jemal A:
Breast cancer statistics, 2013. CA Cancer J Clin. 64:52–62. 2014.
View Article : Google Scholar : PubMed/NCBI
|
|
3
|
Malladi S, Macalinao DG, Jin X, He L,
Basnet H, Zou Y, de Stanchina E and Massague J: Metastatic latency
and immune evasion through autocrine inhibition of WNT. Cell.
165:45–60. 2016. View Article : Google Scholar : PubMed/NCBI
|
|
4
|
Grivennikov SI, Greten FR and Karin M:
Immunity, inflammation, and cancer. Cell. 140:883–899. 2010.
View Article : Google Scholar : PubMed/NCBI
|
|
5
|
Turkistany SA and DeKoter RP: The
transcription factor PU.1 is a critical regulator of cellular
communication in the immune system. Arch Immunol Ther Exp (Warsz).
59:431–440. 2011. View Article : Google Scholar : PubMed/NCBI
|
|
6
|
Verbiest T, Bouffler S, Nutt SL and Badie
C: PU.1 downregulation in murine radiation-induced acute myeloid
leukaemia (AML): From molecular mechanism to human AML.
Carcinogenesis. 36:413–419. 2015. View Article : Google Scholar : PubMed/NCBI
|
|
7
|
Chen HM, Zhang P, Voso MT, Hohaus S,
Gonzalez DA, Glass CK, Zhang DE and Tenen DG: Neutrophils and
monocytes express high levels of PU.1 (Spi-1) but not Spi-B. Blood.
85:2918–2928. 1995.PubMed/NCBI
|
|
8
|
Cantor AB and Orkin SH: Hematopoietic
development: A balancing act. Curr Opin Genet Dev. 11:513–519.
2001. View Article : Google Scholar : PubMed/NCBI
|
|
9
|
McKercher SR, Torbett BE, Anderson KL,
Henkel GW, Vestal DJ, Baribault H, Klemsz M, Feeney AJ, Wu GE,
Paige CJ, et al: Targeted disruption of the PU.1 gene results in
multiple hematopoietic abnormalities. EMBO J. 15:5647–5658.
1996.PubMed/NCBI
|
|
10
|
Scott EW, Simon MC, Anastasi J and Singh
H: Requirement of transcription factor PU.1 in the development of
multiple hematopoietic lineages. Science. 265:1573–1577. 1994.
View Article : Google Scholar : PubMed/NCBI
|
|
11
|
DeKoter RP and Singh H: Regulation of B
lymphocyte and macrophage development by graded expression of PU.1.
Science. 288:1439–1441. 2000. View Article : Google Scholar : PubMed/NCBI
|
|
12
|
Rosenbauer F, Wagner K, Kutok JL, Iwasaki
H, Le Beau MM, Okuno Y, Akashi K, Fiering S and Tenen DG: Acute
myeloid leukemia induced by graded reduction of a lineage-specific
transcription factor, PU.1. Nat Genet. 36:624–630. 2004. View Article : Google Scholar : PubMed/NCBI
|
|
13
|
Yuki H, Ueno S, Tatetsu H, Niiro H, Iino
T, Endo S, Kawano Y, Komohara Y, Takeya M, Hata H, et al: PU.1 is a
potent tumor suppressor in classical Hodgkin lymphoma cells. Blood.
121:962–970. 2013. View Article : Google Scholar : PubMed/NCBI
|
|
14
|
Will B, Vogler TO, Narayanagari S,
Bartholdy B, Todorova TI, da Silva Ferreira M, Chen J, Yu Y, Mayer
J, Barreyro L, et al: Minimal PU.1 reduction induces a preleukemic
state and promotes development of acute myeloid leukemia. Nat Med.
21:1172–1181. 2015. View
Article : Google Scholar : PubMed/NCBI
|
|
15
|
Tschan MP, Reddy VA, Ress A, Arvidsson G,
Fey MF and Torbett BE: PU.1 binding to the p53 family of tumor
suppressors impairs their transcriptional activity. Oncogene.
27:3489–3493. 2008. View Article : Google Scholar : PubMed/NCBI
|
|
16
|
Hammond ME, Hayes DF, Dowsett M, Allred
DC, Hagerty KL, Badve S, Fitzgibbons PL, Francis G, Goldstein NS,
Hayes M, et al: American society of clinical oncology/college of
American pathologists guideline recommendations for
immunohistochemical testing of estrogen and progesterone receptors
in breast cancer. J Clin Oncol. 28:2784–2795. 2010. View Article : Google Scholar : PubMed/NCBI
|
|
17
|
Wolff AC, Hammond ME, Hicks DG, Dowsett M,
McShane LM, Allison KH, Allred DC, Bartlett JM, Bilous M,
Fitzgibbons P, et al: Recommendations for human epidermal growth
factor receptor 2 testing in breast cancer: American society of
clinical oncology/college of American pathologists clinical
practice guideline update. Arch Pathol Lab Med. 138:241–256. 2014.
View Article : Google Scholar : PubMed/NCBI
|
|
18
|
Yerushalmi R, Woods R, Ravdin PM, Hayes MM
and Gelmon KA: Ki67 in breast cancer: Prognostic and predictive
potential. Lancet Oncol. 11:174–183. 2010. View Article : Google Scholar : PubMed/NCBI
|
|
19
|
Gonzalez-Sistal A, Baltasar-Sanchez A,
Menendez P, Arias JI and Ruibal A: Breastfeeding and
immunohistochemical expression of ki-67, p53 and BCL2 in
infiltrating lobular breast carcinoma. PloS One. 11:e01510932016.
View Article : Google Scholar : PubMed/NCBI
|
|
20
|
Agboola AO, Banjo AA, Anunobi CC, Salami
B, Agboola MD, Musa AA, Nolan CC, Rakha EA, Ellis IO and Green AR:
Cell proliferation (KI-67) expression is associated with poorer
prognosis in Nigerian compared to British breast cancer women. ISRN
Oncol. 2013:6750512013.PubMed/NCBI
|
|
21
|
Edge SB and Compton CC: The American joint
committee on cancer: The 7th edition of the AJCC cancer staging
manual and the future of TNM. Ann Surg Oncol. 17:1471–1474. 2010.
View Article : Google Scholar : PubMed/NCBI
|
|
22
|
Cattoretti G, Shaknovich R, Smith PM, Jack
HM, Murty VV and Alobeid B: Stages of germinal center transit are
defined by B cell transcription factor coexpression and relative
abundance. J Immunol. 177:6930–6939. 2006. View Article : Google Scholar : PubMed/NCBI
|
|
23
|
Hoefnagel JJ, Mulder MM, Dreef E, Jansen
PM, Pals ST, Meijer CJ, Willemze R and Vermeer MH: Expression of
B-cell transcription factors in primary cutaneous B-cell lymphoma.
Mod Pathol. 19:1270–1276. 2006. View Article : Google Scholar : PubMed/NCBI
|
|
24
|
Wolff AC, Hammond ME, Hicks DG, Dowsett M,
McShane LM, Allison KH, Allred DC, Bartlett JM, Bilous M,
Fitzgibbons P, et al: Recommendations for human epidermal growth
factor receptor 2 testing in breast cancer: American society of
clinical oncology/college of American pathologists clinical
practice guideline update. J Clin Oncol. 31:3997–4013. 2013.
View Article : Google Scholar : PubMed/NCBI
|
|
25
|
Cole SW: Chronic inflammation and breast
cancer recurrence. J Clin Oncol. 27:3418–3419. 2009. View Article : Google Scholar : PubMed/NCBI
|
|
26
|
Chang HC, Sehra S, Goswami R, Yao W, Yu Q,
Stritesky GL, Jabeen R, McKinley C, Ahyi AN, Han L, et al: The
transcription factor PU.1 is required for the development of
IL-9-producing T cells and allergic inflammation. Nat Immunol.
11:527–534. 2010. View
Article : Google Scholar : PubMed/NCBI
|
|
27
|
Kueh HY, Champhekar A, Nutt SL, Elowitz MB
and Rothenberg EV: Positive feedback between PU.1 and the cell
cycle controls myeloid differentiation. Science. 341:670–673. 2013.
View Article : Google Scholar : PubMed/NCBI
|
|
28
|
Zhou J, Zhang X, Wang Y and Guan Y: PU.1
affects proliferation of the human acute myeloid leukemia U937 cell
line by directly regulating MEIS1. Oncol Lett. 10:1912–1918.
2015.PubMed/NCBI
|
|
29
|
Chou S, Khan T, Mahajan H and Pathmanathan
N: Predicting discordant HER2 results in ipsilateral synchronous
invasive breast carcinomas: Experience from a single institution.
Pathology. 47:637–640. 2015. View Article : Google Scholar : PubMed/NCBI
|
|
30
|
Yarden Y: Biology of HER2 and its
importance in breast cancer. Oncology. 61 Suppl 2:S1–S13. 2001.
View Article : Google Scholar
|