Introduction
Renal cell carcinoma (RCC) is a urological
malignancy with increasing incidence in countries with a high Human
Development Index (HDI) (i.e. with a HDI of >0.8) (1,2). Clear
cell RCC (ccRCC) is the predominant histological type, representing
75–80% of all cases (3). A total of
~20% of patients are initially diagnosed with metastatic ccRCC
(mRCC) and ~20% of primary localized cases become metastatic during
follow-up (4,5). The management of mRCC has markedly
changed in recent years with the introduction of novel therapies
leading to substantial improvements in the survival and quality of
life of patients (6).
Antiangiogenic tyrosine kinase inhibitors (TKIs), immune checkpoint
inhibitors (ICIs) and their combination represent novel systemic
therapies in mRCC (7,8). The expanding horizons of systemic
therapies suitable for mRCC require predictive and prognostic
molecular biomarkers for the selection of optimal therapy
approaches for patients in personalized medicine.
Long non-coding RNAs (lncRNAs) have emerged as one
of the key regulators of gene expression in cancer, and they may
exhibit tumor-suppressive or oncogenic functions based on their
interacting partners. Their expression is highly tissue- and
condition-specific, and they have been found to be involved in
various cancer-associated processes, including tumorigenesis,
progression and metastatic spread (9). Thus, lncRNAs hold promise as novel
biomarkers and therapeutic targets for cancer.
Previous studies have shown several differentially
expressed lncRNAs in ccRCC tissue, as well as in ccRCC cell lines,
including CRNDE (10), H19
(11), HOTAIR (12), TUG1 (13), MEG3 (14) and GAS5 (15) as summarized by Li et al
(16). Moreover, MALAT1 (17), PVT1 (18), LINC00152 (19) and LUCAT1 (20) have been suggested as lncRNAs
associated with poor prognosis and decreased overall survival (OS)
in patients with ccRCC. A potential predictive role of several
lncRNAs has previously been suggested in experimental studies
(21–23). The lncRNA ARSR promotes resistance
to sunitinib by serving as competing endogenous RNA (22), whereas high expression of lncRNA
SARCC increases its efficacy (23).
In mRCC specifically, mostly protein-coding genes have been studied
(24,25). Genes for transmembrane protein
programmed death-ligand 1 and serine/threonine-protein kinase
p21-activating kinase 1 serve a prognostic role in mRCC (26,27).
Nevertheless, the association between lncRNA profiles and outcomes
of patients with mRCC treated with a specific type of systemic
therapy remains unclear.
The present study evaluated the expression profile
of 84 cancer-associated lncRNAs in patients with mRCC treated with
sunitinib as the first-line treatment. Differences in lncRNA
expression levels between primary tumors and adjacent non-malignant
tissue were analyzed. The present study also evaluated associations
of lncRNA expression profile with clinical data, including
objective response and patient survival. The role of clinically
relevant lncRNAs in the context of mRNA transcriptome profile was
investigated to reveal their mutual interactions and biological
importance.
Materials and methods
Patients and tissue samples
The present study included 38 patients with mRCC
treated with sunitinib (SUTENT®; Pfizer, Inc.) as
first-line therapy at the Department of Oncology and
Radiotherapeutics, University Hospital Pilsen (Pilsen, Czech
Republic). Only patients with ccRCC histology and those with
favorable or intermediate risk according to the Memorial
Sloan-Kettering Cancer Center (MSKCC) prognostic model were
included (28,29). All patients had distant metastases
at the start of sunitinib therapy. Sunitinib was administered
orally at the standard approved dosing (30) until disease progression,
unacceptable toxicity or patient refusal. The clinical data,
including baseline clinical characteristics, treatment course and
outcomes, were obtained from medical records.
Physical examination and routine laboratory tests
were performed every <6 weeks and CT was performed every 3–4
months during treatment with sunitinib. The objective response was
assessed by an independent experienced radiologist using Response
Evaluation Criteria in Solid Tumors version 1.1 (31). The objective response was classified
in terms of complete response (CR), partial response (PR), stable
disease (SD) and progressive disease (PD) (2).
Fresh-frozen tissue samples, including primary ccRCC
tumor and adjacent non-neoplastic kidney tissue, were obtained
during radical or cytoreductive nephrectomy surgery and were stored
in RNAlater (cat. no. AM7020; Thermo Fisher Scientific, Inc.) at
−80°C until processing.
All patients signed an informed consent for
participation. The Ethics Committee of the Faculty of Medicine and
University Hospital Pilsen, Charles University (approval no.
302/2020) approved the informed consent form and study protocol for
samples collected during the project. The present study was
performed in accordance with the Declaration of Helsinki.
Baseline clinical data for all patients with mRCC
included in the present study (n=38) and the subgroup (n=20)
profiled by RNA sequencing (RNASeq) are summarized in Table I. The median age of patients at the
time of sunitinib initiation was 64.5±8.8 years. The study included
26 male and 12 female patients. The majority of patients (>80%)
belonged to the intermediate risk group according to the MSKCC
criteria, and 50% of patients were evaluated as good responders to
sunitinib as first-line systemic therapy. The median
progression-free survival (PFS) and OS for the entire cohort were 7
and 36 months, respectively.
 | Table I.Baseline clinical characteristics of
patients with metastatic renal cell carcinoma. |
Table I.
Baseline clinical characteristics of
patients with metastatic renal cell carcinoma.
| Characteristic | lncRNA profiling
(n=38) | mRNA profiling
(n=20) |
|---|
| Median age at
treatment initiation, years | 64.5±8.8 | 64.5±8.5 |
| Sex (%) |
|
|
|
Male | 26 (68) | 15 (75) |
|
Female | 12 (32) | 5 (25) |
| Histopathological
grade (%) |
|
|
| G1 | 8 (21) | 4 (20) |
| G2 | 12 (32) | 6 (30) |
| G3 | 16 (42) | 9 (45) |
| Not
available | 2 (5) | 1 (5) |
| Stage at diagnosis
(%) |
|
|
| I | 3 (8) | 1 (5) |
| II | 0 (0) | 0 (0) |
|
III | 18 (47) | 8 (40) |
| IV | 17 (45) | 11 (55) |
| Distant metastasis
(%) |
|
|
|
Synchronous | 16 (42) | 11 (55) |
|
Metachronous | 22 (58) | 9 (45) |
| MSKCC risk (%) |
|
|
|
Favorable | 7 (18) | 3 (15) |
|
Intermediate | 31 (82) | 17 (85) |
| First-line
objective response to sunitinib |
|
|
|
Complete response | 6 (16) | 5 (25) |
| Partial
response | 14 (37) | 5 (25) |
|
Progressive disease | 18 (47) | 10 (50) |
Isolation of total RNA and preparation
of cDNA
Tissue samples were removed from RNAlater and ground
to powder by mortar and pestle under liquid nitrogen. RNA was
isolated using AllPrep DNA/RNA/Protein Mini kit (cat. no. 80004;
Qiagen GmbH) according to the manufacturer's protocol. Total RNA
was quantified with Quant-it™ RiboGreen RNA Assay kit (cat. no.
R11490; Thermo Fisher Scientific, Inc.) on Microplate
Reader-Infinite M200 (Tecan Group, Ltd.). RNA quality was
determined by estimation of the RNA Integrity Number (32) with Agilent RNA 6000 Nano kit (cat.
no. 5067-1511; Agilent Technologies, Inc.) on Bioanalyzer 2100
(cat. no. G2939BA; Agilent Technologies, Inc.). cDNA was
synthesized using RT2 First Strand kit (cat. no. 330404;
Qiagen GmbH) with 0.5 µg total RNA, according to the manufacturer's
protocol. cDNA was stored at −20°C until quantitative PCR (qPCR)
was performed.
qPCR
To quantify relative gene expression, ViiA7
Real-Time PCR System (Thermo Fisher Scientific, Inc.) was used.
qPCR study design adhered to the Minimum Information for
Publication of the guidelines for qPCR experiments (33). The reaction mixture contained 650 µl
2X RT2 SYBR Green Mastermix (cat. no. 330502; Qiagen
GmbH), 102 µl cDNA synthesis reaction (cDNA diluted with
nuclease-free water according to the manufacturer's protocol) and
548 µl nuclease-free water. PCR components were dispensed into
384-well RT2 lncRNA PCR Array (cat. no. 330721; Qiagen
GmbH) according to the manufacturer's protocol. Each RT2
lncRNA PCR Array Human Cancer PathwayFinder (cat. no. 330721;
Qiagen GmbH; GeneGlobe ID: LAHS-002Z) included control elements for
data normalization, detection of genomic DNA contamination, RNA
sample quality and general PCR performance check (Table SI). Thermocycling conditions were
as follows: Initial step at 95°C for 10 min followed by 40 cycles
of denaturation at 95°C for 15 sec and annealing at 60°C for 60
sec. The samples were analyzed in duplicate. The ACTB, B2M,
RPLP0, R7SK and SNORA73A genes were used as reference
genes for the normalization of results. For statistical analyses,
the expression data were normalized and the 2−ΔΔCq
method was used to determine relative expression (34).
RNASeq
RNASeq was performed in 20 pairs of primary tumor
and adjacent non-malignant renal tissue. Libraries were prepared
using 0.5 µg total RNA with QuantSeq 3′mRNA-Seq Library Prep kit
FWD and PCR Add-on kit for Illumina (cat. no. 015.96 and 020.96,
respectively; both Lexogen GmbH) according to the manufacturer's
protocol. Bioanalyzer 2100 and High Sensitivity DNA kit (cat. no.
5067-4626; Agilent Technologies, Inc.) were used for quality
control of prepared libraries. Libraries were quantified by qPCR,
KAPA Library Quantification kit Illumina® Platforms
(cat. no. 07960140001; Fritz Hoffman-La Roche Ltd). The equimolar
pool (4 nM) of prepared libraries was sequenced on NextSeq 500
platform (Illumina, Inc.) with NextSeq 500/550 High Output kit v2.5
(1×75 bp, single read; cat. no. 20024906; Illumina, Inc.) in one
run [seeding concentration 1.8 pM measured on Quibit 4.0 with dsDNA
High Sensitivity Assay kit (cat. no. Q32851; Thermo Fisher
Scientific, Inc.)]. RNASeq of all samples was performed in
sufficient depth (~10 million reads/sample) for the detection of
lowly expressed genes. Quality control of raw RNASeq data was
performed with the FastQC v0.11.9 package (35).
Statistical analysis
lncRNA expression analysis
Statistical analysis of associations between lncRNA
expression and clinical data of patients were performed by SPSS
(v16.0; SPSS, Inc.) or GraphPad Prism (v6.0; Dotmatics). The
distribution of most lncRNAs deviated from normality, and
non-parametric statistical tests were used. Kruskal-Wallis test was
used for evaluation of association between lncRNA expression
profile and clinical parameters such as clinical stage, primary
tumor size, histopathological grading and MSKCC risk. Mann-Whitney
test was used for evaluation of associations between lncRNA
expression profile and response to sunitinib, sex, presence of
regional lymph node metastasis, type of distant metastatic spread
(synchronous or metachronous) and comparison of lncRNA profile
between primary tumor and paired non-neoplastic tissue. Spearman
rank test was used for evaluating the correlation between the
lncRNA expression levels and age of patients. Log-rank test and
Kaplan-Meier plots were used to identify associations of lncRNA
expression levels with PFS and OS in months. Patients were divided
according to the median expression of a given lncRNA. PFS was
defined as time between sunitinib treatment initiation and first
documented progression or death or patient censoring. OS was
defined as time from sunitinib treatment initiation until the date
of death or patient censoring. All patients with OS >60 months
were censored at this time point. Cox regression was performed to
assess the hazard ratio (HR) with a 95% confidence interval (CI).
Two-sided P-value was calculated for all statistical analyses. The
false discovery rate (FDR) test was applied according to Benjamini
and Hochberg (36) and Q-values
were computed for each comparison. Q<0.05 was considered to
indicate a statistically significant difference. The ‘good
responders group’ was defined as patients who achieved CR or PR,
while ‘poor responders group’ was defined as patients who achieved
PD.
mRNA expression analysis
For gene annotation, Ensembl v101 (genome assembly
GRCh38.p13) was used (37). A
pseudoaligment approach for gene quantification by kallisto v0.46.1
was used (38). Differential
expression analysis was carried out with the edgeR v3.42.2 package
in R (39). Differentially
expressed genes with log fold-change (FC)>2 and Q<0.001
(Benjamini Hochberg FDR correction) were considered statistically
significant for comparison of tumor vs. non-malignant tissue, while
for good vs. poor responders, Q<0.05 (Benjamini Hochberg FDR
correction) was considered statistically significant. Expression
data in the normalized format (transcripts per million) were used
for analysis of associations between mRNA expression and clinical
data of patients only for significantly differentially expressed
protein-coding genes. The statistical tests used for these analyses
were the same as those for lncRNAs.
Spearman correlation analysis was used to evaluate
correlation between mRNA and lncRNA expression. R>0.8 and
Q<0.001 [Bonferroni correction (40)] were considered to indicate a
statisitcally significant difference. The complete set of 84
examined lncRNAs and 11,342 protein-coding transcripts with an
interquartile range of expression values >0.1, with the
exception of pseudogenes and uncharacterized proteins, were
incorporated into the analysis.
Pathway annotation of protein-coding genes
associated with lncRNAs was performed with the Reactome database
(41). Q<0.05 (Benjamini
Hochberg FDR correction) was considered to indicate a statistically
significant difference.
Results
lncRNA profile between the primary
tumor and paired non-neoplastic tissues
The levels of lncRNAs were detected by qPCR in 20
pairs of primary tumor and adjacent non-neoplastic tissue samples.
Comparison of lncRNA expression profile revealed 50 differentially
expressed lncRNAs (Table II). A
significantly higher expression of 13 lncRNAs in carcinoma compared
with paired non-neoplastic tissue was observed. By contrast, the
levels of 37 lncRNAs were significantly decreased in carcinoma. In
addition, four differentially expressed lncRNAs (GACAT1, HEIH,
MIR155HG and POU5F1P5) passed the P-value cut-off (P<0.05) but
not the FDR correction (Benjamini and Hochberg) (Table II).
| Table II.Significant differences in expression
of cancer-associated lncRNAs between primary tumor and adjacent
non-malignant tissue (n=20 pairs). |
Table II.
Significant differences in expression
of cancer-associated lncRNAs between primary tumor and adjacent
non-malignant tissue (n=20 pairs).
| lncRNA | Expression
change | P-value | Q-value |
|---|
| ADAMTS9-AS2 | Downregulated | 0.011 | 0.021 |
| AIRN | Downregulated | 0.021 | 0.035 |
| BANCR | Downregulated | <0.001 | <0.001 |
| BLACAT1 | Downregulated | 0.021 | 0.035 |
| CAHM | Downregulated | <0.001 | <0.001 |
| CBR3-AS1 | Downregulated | <0.001 | <0.001 |
| CDKN2B-AS1 | Upregulated | <0.001 | <0.001 |
| CRNDE | Upregulated | 0.003 | 0.006 |
| DGCR5 | Upregulated | <0.001 | <0.001 |
| EMX2OS | Downregulated | <0.001 | <0.001 |
| FTX | Downregulated | <0.001 | <0.001 |
| GACAT1 | Downregulated | 0.040 | 0.063a |
| GAS6-AS1 | Upregulated | 0.001 | 0.002 |
| H19 | Downregulated | 0.006 | 0.012 |
| HAND2-AS1 | Downregulated | <0.001 | <0.001 |
| HEIH | Downregulated | 0.046 | 0.072a |
| HIF1A-AS1 | Downregulated | 0.020 | 0.035 |
| HIF1A-AS2 | Upregulated | <0.001 | <0.001 |
| HNF1A-AS1 | Downregulated | <0.001 | <0.001 |
| HOTAIRM1 | Downregulated | <0.001 | <0.001 |
| HOXA11-AS | Downregulated | <0.001 | <0.001 |
| HOXA-AS2 | Downregulated | <0.001 | <0.001 |
| HULC | Downregulated | <0.001 | <0.001 |
| IPW | Downregulated | <0.001 | <0.001 |
| KCNQ1OT1 | Downregulated | <0.001 | <0.001 |
| KRAASP1 | Downregulated | 0.002 | 0.035 |
| LINC00152 | Upregulated | 0.001 | 0.002 |
| LINC00887 | Upregulated | <0.001 | <0.001 |
| LINC00963 | Downregulated | <0.001 | <0.001 |
| LINC01233 | Downregulated | <0.001 | <0.001 |
| LINC01234 | Upregulated | 0.007 | 0.014 |
| LUCAT1 | Upregulated | <0.001 | <0.001 |
| MALAT1 | Downregulated | 0.008 | 0.015 |
| MEG3 | Downregulated | <0.001 | <0.001 |
| MIR155HG | Downregulated | 0.040 | 0.063a |
| MIR17HG | Upregulated | <0.001 | <0.001 |
| MIR31HG | Downregulated | 0.001 | 0.002 |
| MRPL23-AS1 | Downregulated | 0.001 | 0.002 |
| NAMA | Downregulated | 0.002 | 0.004 |
| NBR2 | Downregulated | <0.001 | <0.001 |
| NEAT1 | Downregulated | <0.001 | <0.001 |
| NRON | Downregulated | 0.013 | 0.024 |
| POU5F1P5 | Downregulated | 0.038 | 0.063a |
| PRNCR1 | Downregulated | <0.001 | <0.001 |
| PTCSC3 | Downregulated | <0.001 | <0.001 |
| PVT1 | Upregulated | <0.001 | <0.001 |
| RMRP | Downregulated | 0.006 | 0.012 |
| RMST | Downregulated | <0.001 | <0.001 |
| SNHG16 | Upregulated | 0.006 | 0.012 |
| SUMO1P3 | Downregulated | 0.001 | 0.002 |
| TUG1 | Downregulated | <0.001 | <0.001 |
| WT1-AS | Downregulated | <0.001 | <0.001 |
| ZFAS1 | Upregulated | 0.002 | 0.004 |
Associations of lncRNA expression
profile with baseline clinical data
The levels of the lncRNAs in tumors from 38 patients
were evaluated for their associations with the clinical data. The
association of lncRNA expression profile with sex, grade, MSKCC
risk, primary tumor size and synchronous or metachronous distant
metastatic spread is shown in Table
SII. However, only higher lncRNA TSIX and XIST levels in
females were significant after FDR correction.
Associations of lncRNA expression
profile with objective response and survival
The expression of 10 lncRNAs (ADAMTS9-AS2,
CDKN2B-AS1, CRNDE, EMX2OS, HEIH, HNF1A-AS1, IPW, LINC00963, NRON
and PTENP1) was upregulated, while the expression of LINC00261,
LINC01234, TUG1 and TUSC7 was downregulated in good compared with
poor responders (Table III). The
downregulation of TUSC7 lncRNA, which remained significant after
FDR correction, was the most important finding.
| Table III.Association of expression levels of
cancer-associated lncRNAs with the objective response to sunitinib
in good (n=20) vs. poor (n=18) responders. |
Table III.
Association of expression levels of
cancer-associated lncRNAs with the objective response to sunitinib
in good (n=20) vs. poor (n=18) responders.
| lncRNA | Expression
change | P-value | Q-value |
|---|
| ADAMTS9-AS2 | Upregulated | 0.026 | 0.196a |
| CDKN2B-AS1 | Upregulated | 0.019 | 0.196a |
| CRNDE | Upregulated | 0.011 | 0.154a |
| EMX2OS | Upregulated | 0.024 | 0.196a |
| HEIH | Upregulated | 0.047 | 0.288a |
| HNF1A-AS1 | Upregulated | 0.028 | 0.196a |
| IPW | Upregulated | 0.002 | 0.084a |
| LINC00261 | Downregulated | 0.010 | 0.154a |
| LINC00963 | Upregulated | 0.024 | 0.196a |
| LINC01234 | Downregulated | 0.011 | 0.154a |
| NRON | Upregulated | 0.024 | 0.196a |
| PTENP1 | Upregulated | 0.011 | 0.154a |
| TUG1 | Downregulated | 0.033 | 0.213a |
| TUSC7 | Downregulated | <0.001 | <0.001 |
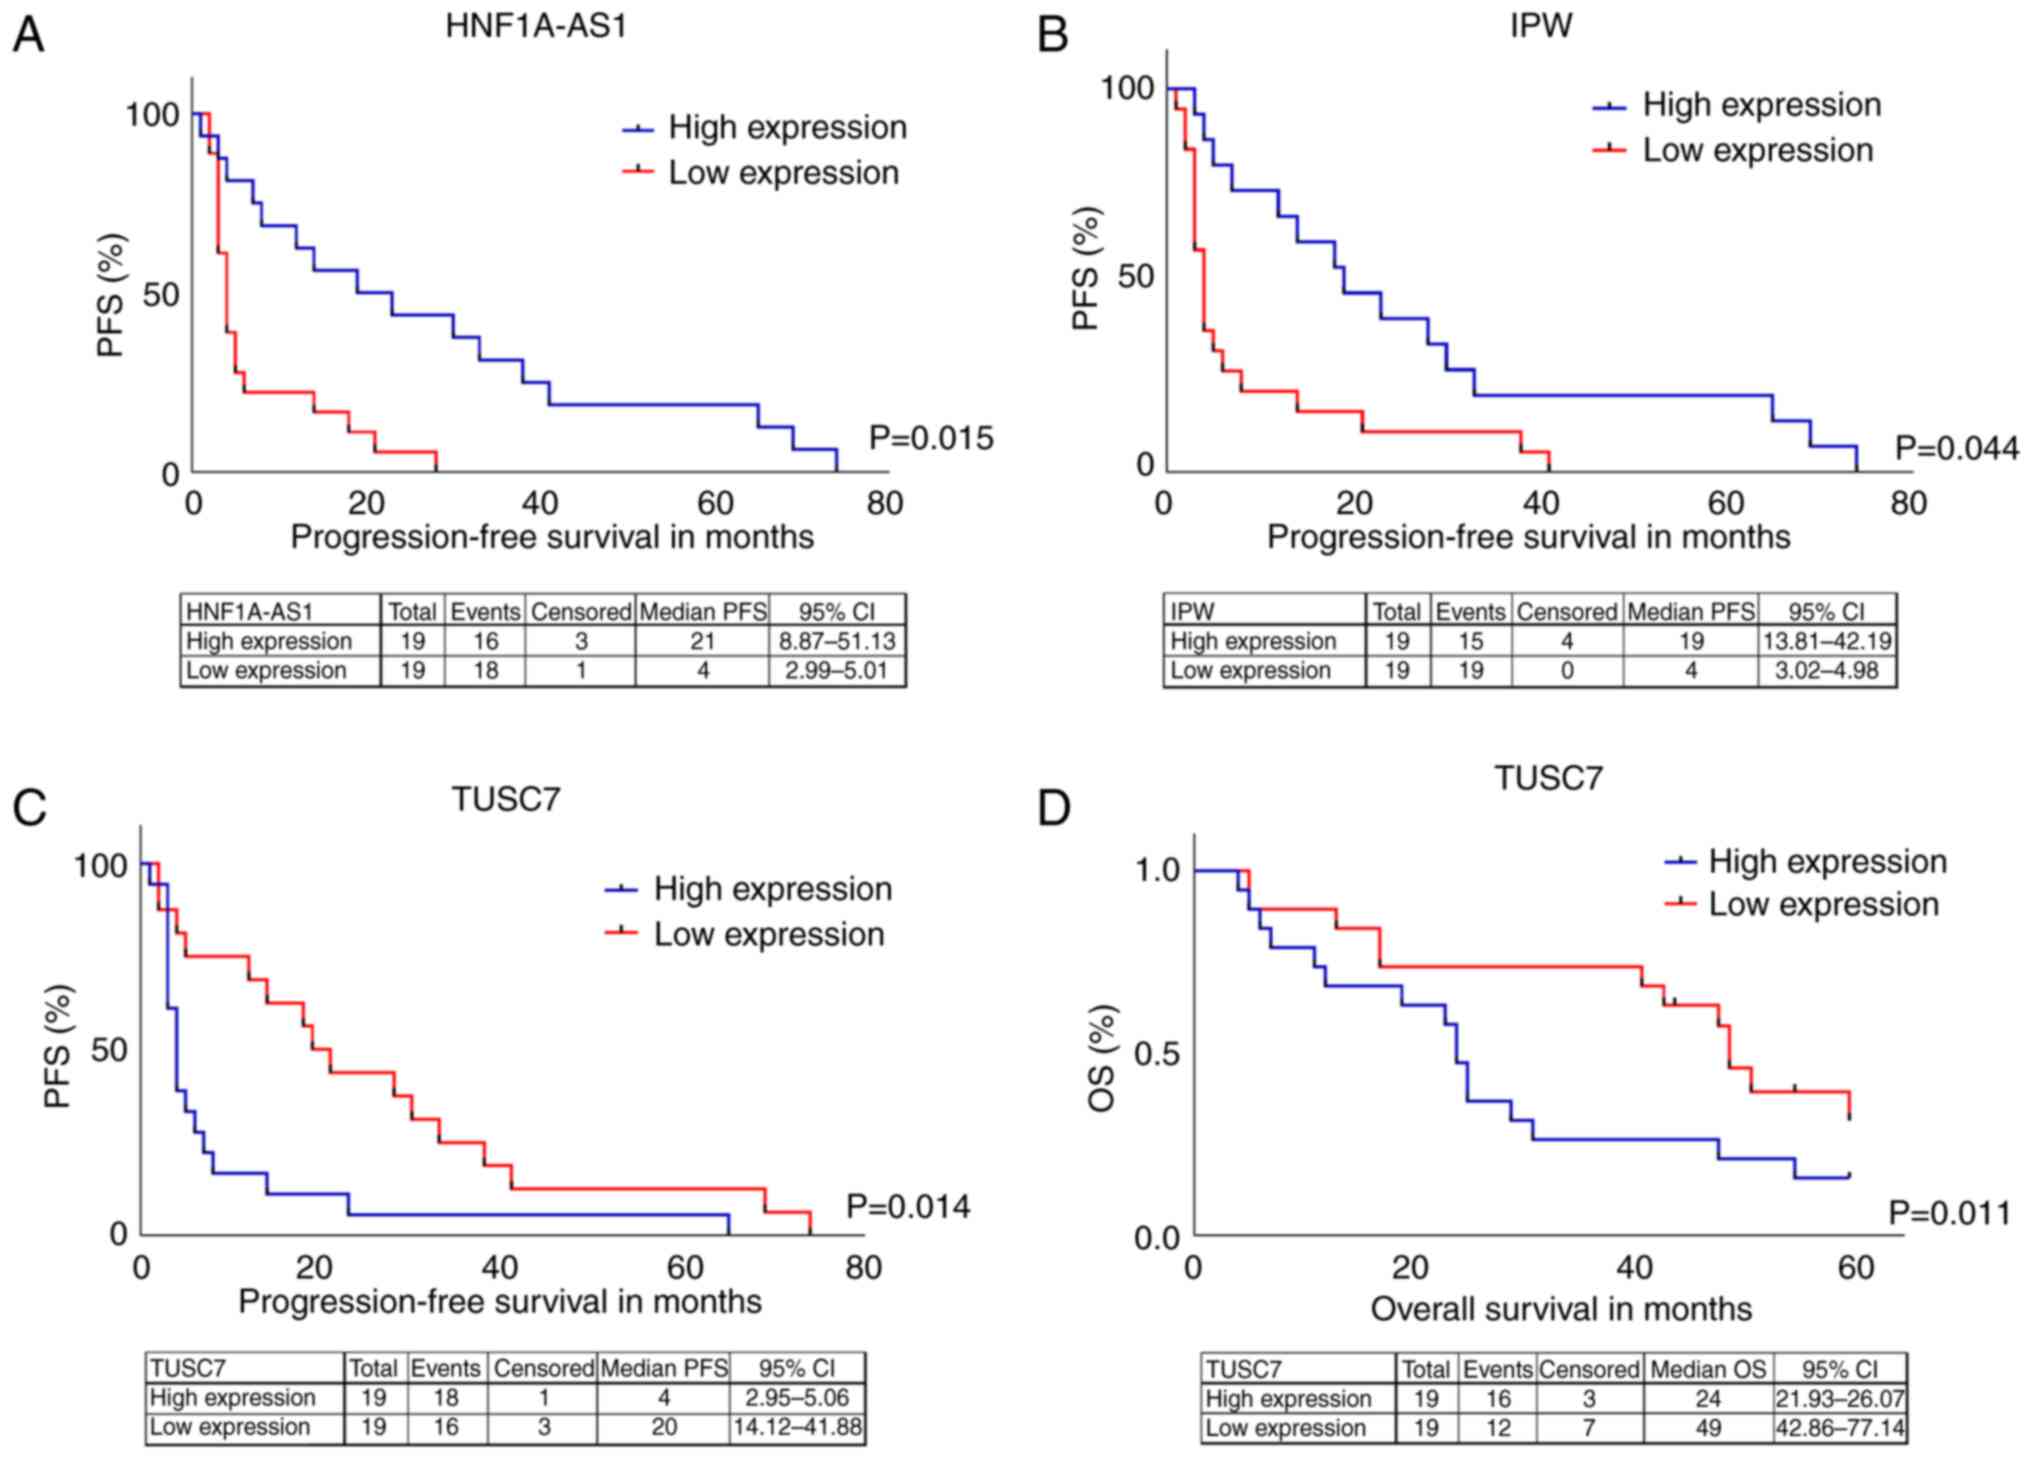
Association of lncRNA expression profile with PFS
and OS showed that patients with expression levels of HNF1A-AS1
(HR=0.193; 95% CI=0.051-0.724) and IPW (HR=0.18; 95% CI=0.03–0.95)
above the median (high expression) had prolonged PFS compared with
those with levels below the median (Fig. 1A and B). Expression levels of TUSC7
above the median (high expression) were associated with poor PFS
(HR=4.3; 95% CI=1.35–13.70; Fig.
1C) and OS (HR=4.15; 95% CI=1.38–12.48; Fig. 1D).
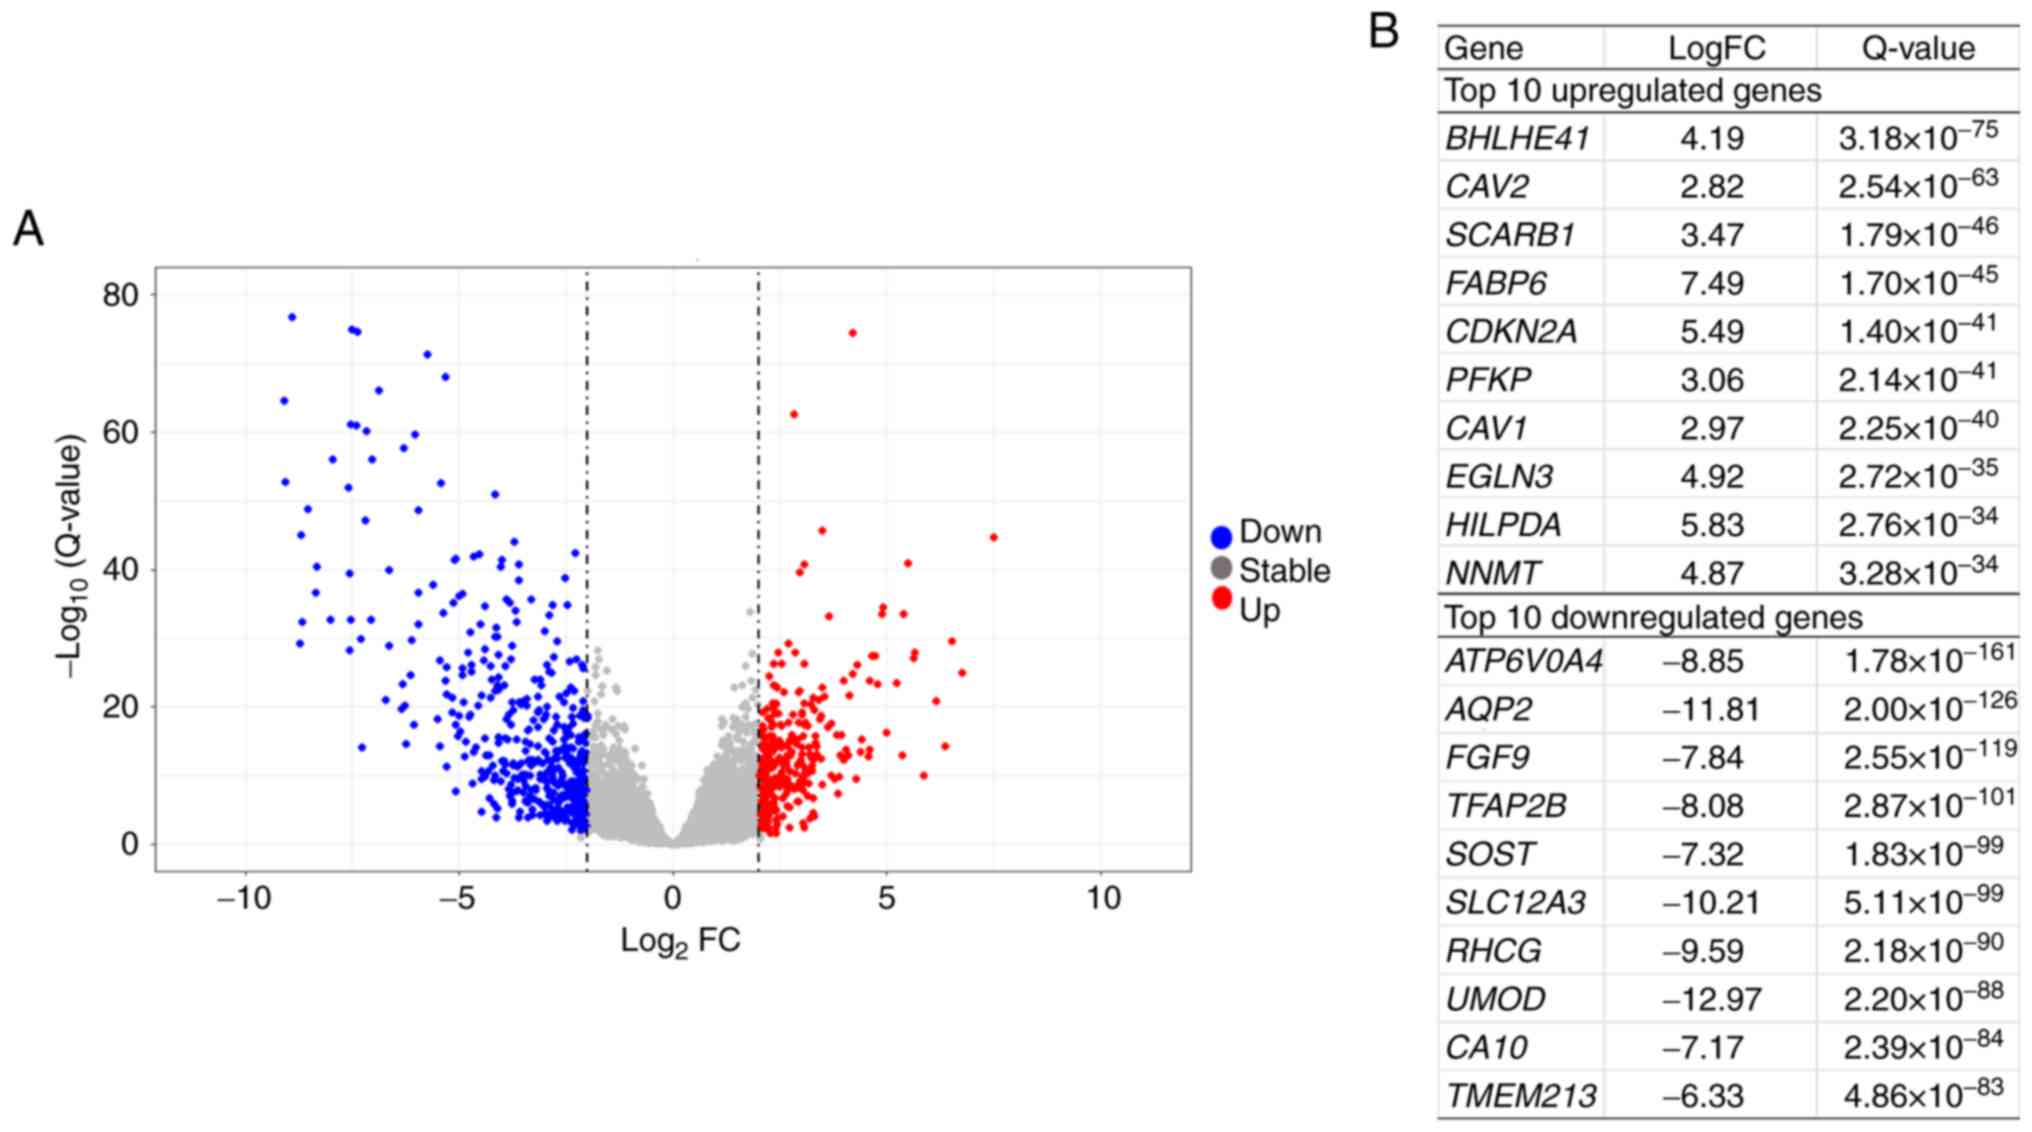
mRNA transcriptome profile between
primary tumor and adjacent non-neoplastic tissues
Analysis of differential expression between primary
tumors and paired adjacent non-neoplastic tissues was performed in
20 patients, whose baseline clinical data are summarized in
Table I. In total, 768
significantly differentially expressed genes were identified. A
total of 462 and 306 genes were down- and upregulated,
respectively, in tumor compared with non-neoplastic tissue
(Table SIII). The volcano plot and
top 10 down- and upregulated genes are shown in Fig. 2A and B.
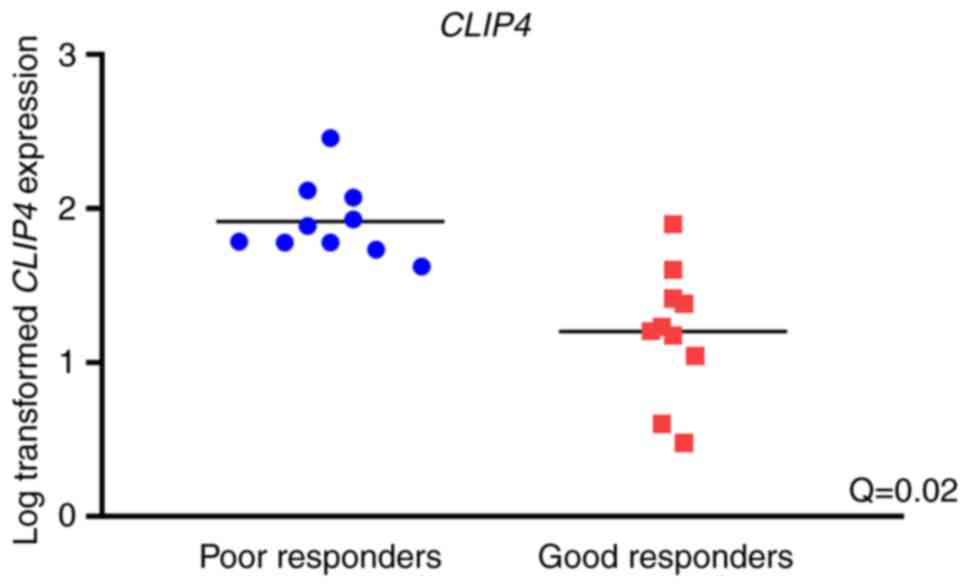
Association of mRNA expression profile
with objective response and survival
Among all protein-coding genes, only one significant
association with objective response to sunitinib was identified:
Significantly upregulated CLIP4 expression was observed in
primary tumor tissues of poor responders compared with good
responders (logFC=−1.9; Q=0.02; Fig.
3).
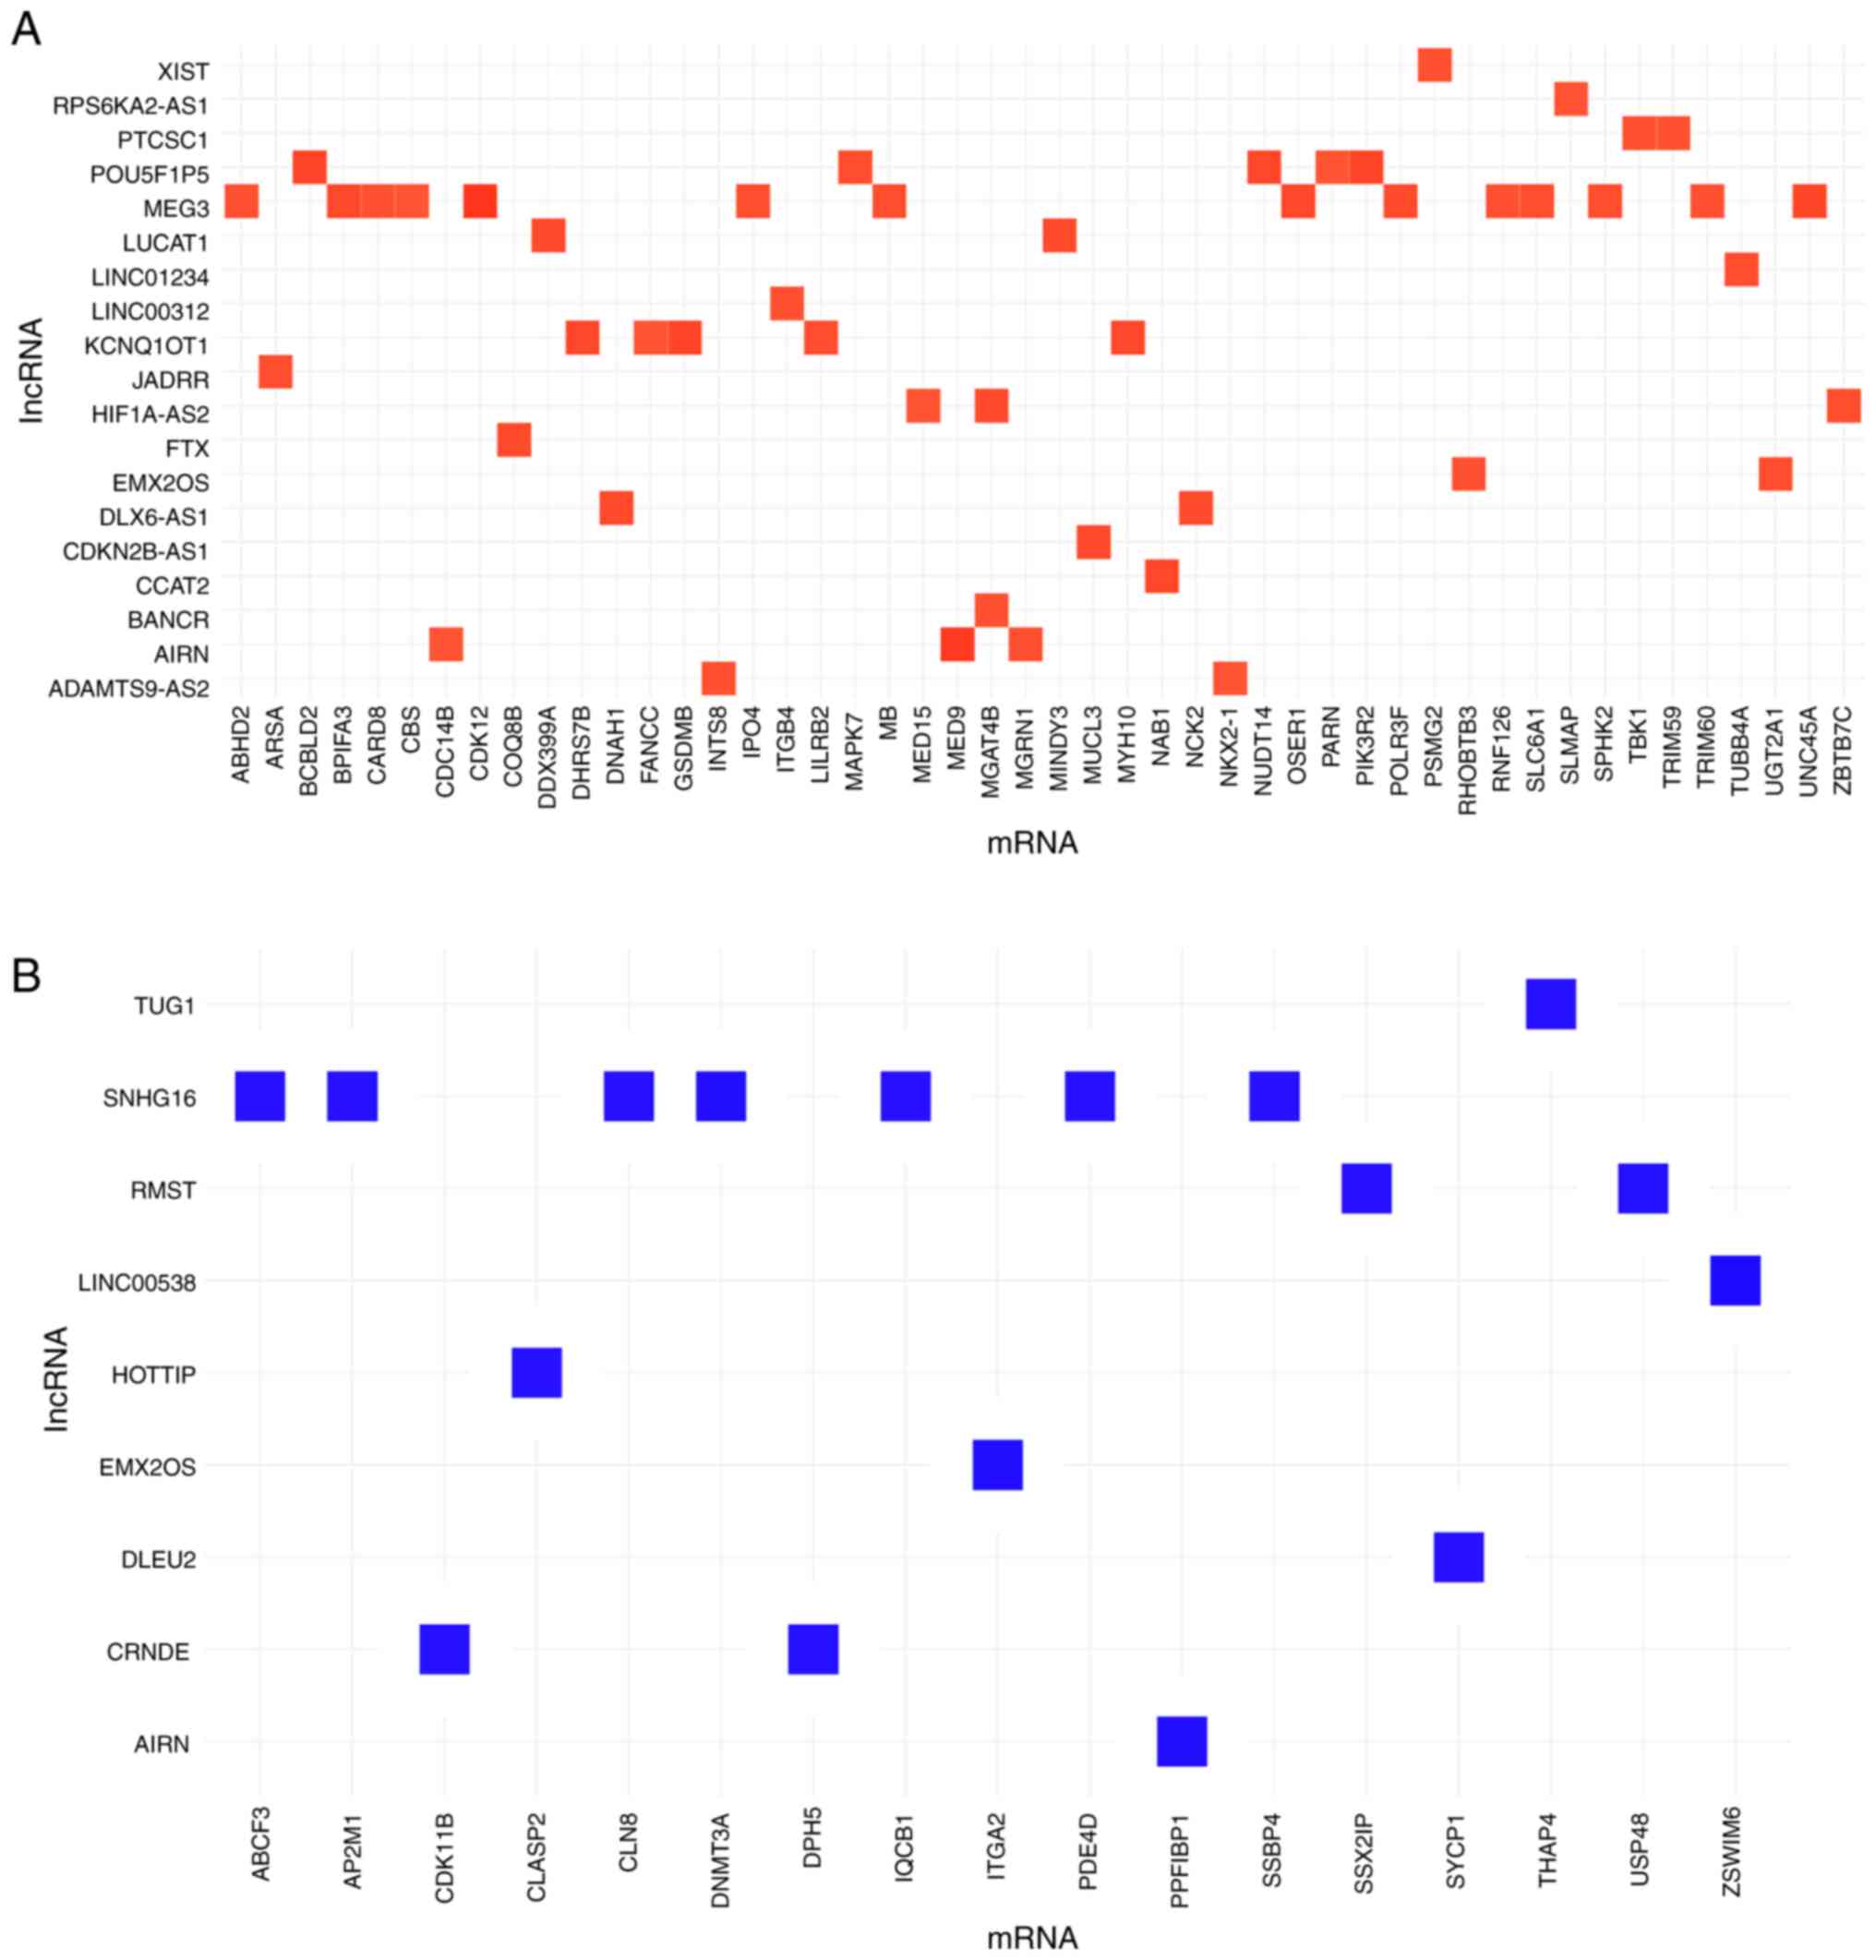
mRNA-lncRNA co-expression
networks
The complete mRNA expression profile was compared
with 84 cancer-associated lncRNA in 20 primary tumor tissues. This
revealed 107 significant associations (R>0.8 and Q<0.001). In
total, levels of 26 lncRNAs were significantly correlated with mRNA
expression levels of 65 protein-coding genes (Fig. 4). The lncRNAs with the highest
number of correlations with protein-coding genes were MEG3 (14
positive correlations) and SNHG16 (7 negative correlations;
Fig. 4; Table SIV). MEG3 was positively correlated
with expression of ABHD2, BPIFA3, CARD8, CBS, CDK12, IPO4, MB,
OSER1, POLR3F, RNF126, SLC6A1, SPHK2, TRIM60 and UNC45A
(Table SV). SNHG16 was negatively
correlated with the expression of ABCF3, AP2M1, CLN8, DNMT3A,
IQCB1, PDE4D and SSBP4.
Among the deregulated lncRNAs in poor responders to
sunitinib, lncRNA ADAMTS9-AS2 was positively correlated with
expression of NKX2-1 and INTS8 mRNAs (R=0.83 and
R=0.84, respectively). By contrast, CRNDE lncRNA displayed only
negative correlations, namely with the expression of DPH5
and CDK11B mRNAs (R=−0.84 and R=−0.84, respectively). The
expression of lncRNA EMX2OS was positively correlated with that of
RHOBTB3 and UGT2A1 and negatively correlated with
that of ITGA2 mRNA (R=0.84, R=0.85 and R=−0.87,
respectively), while LINC01234 was positively correlated with the
expression of TUBB4A mRNA (R=0.85).
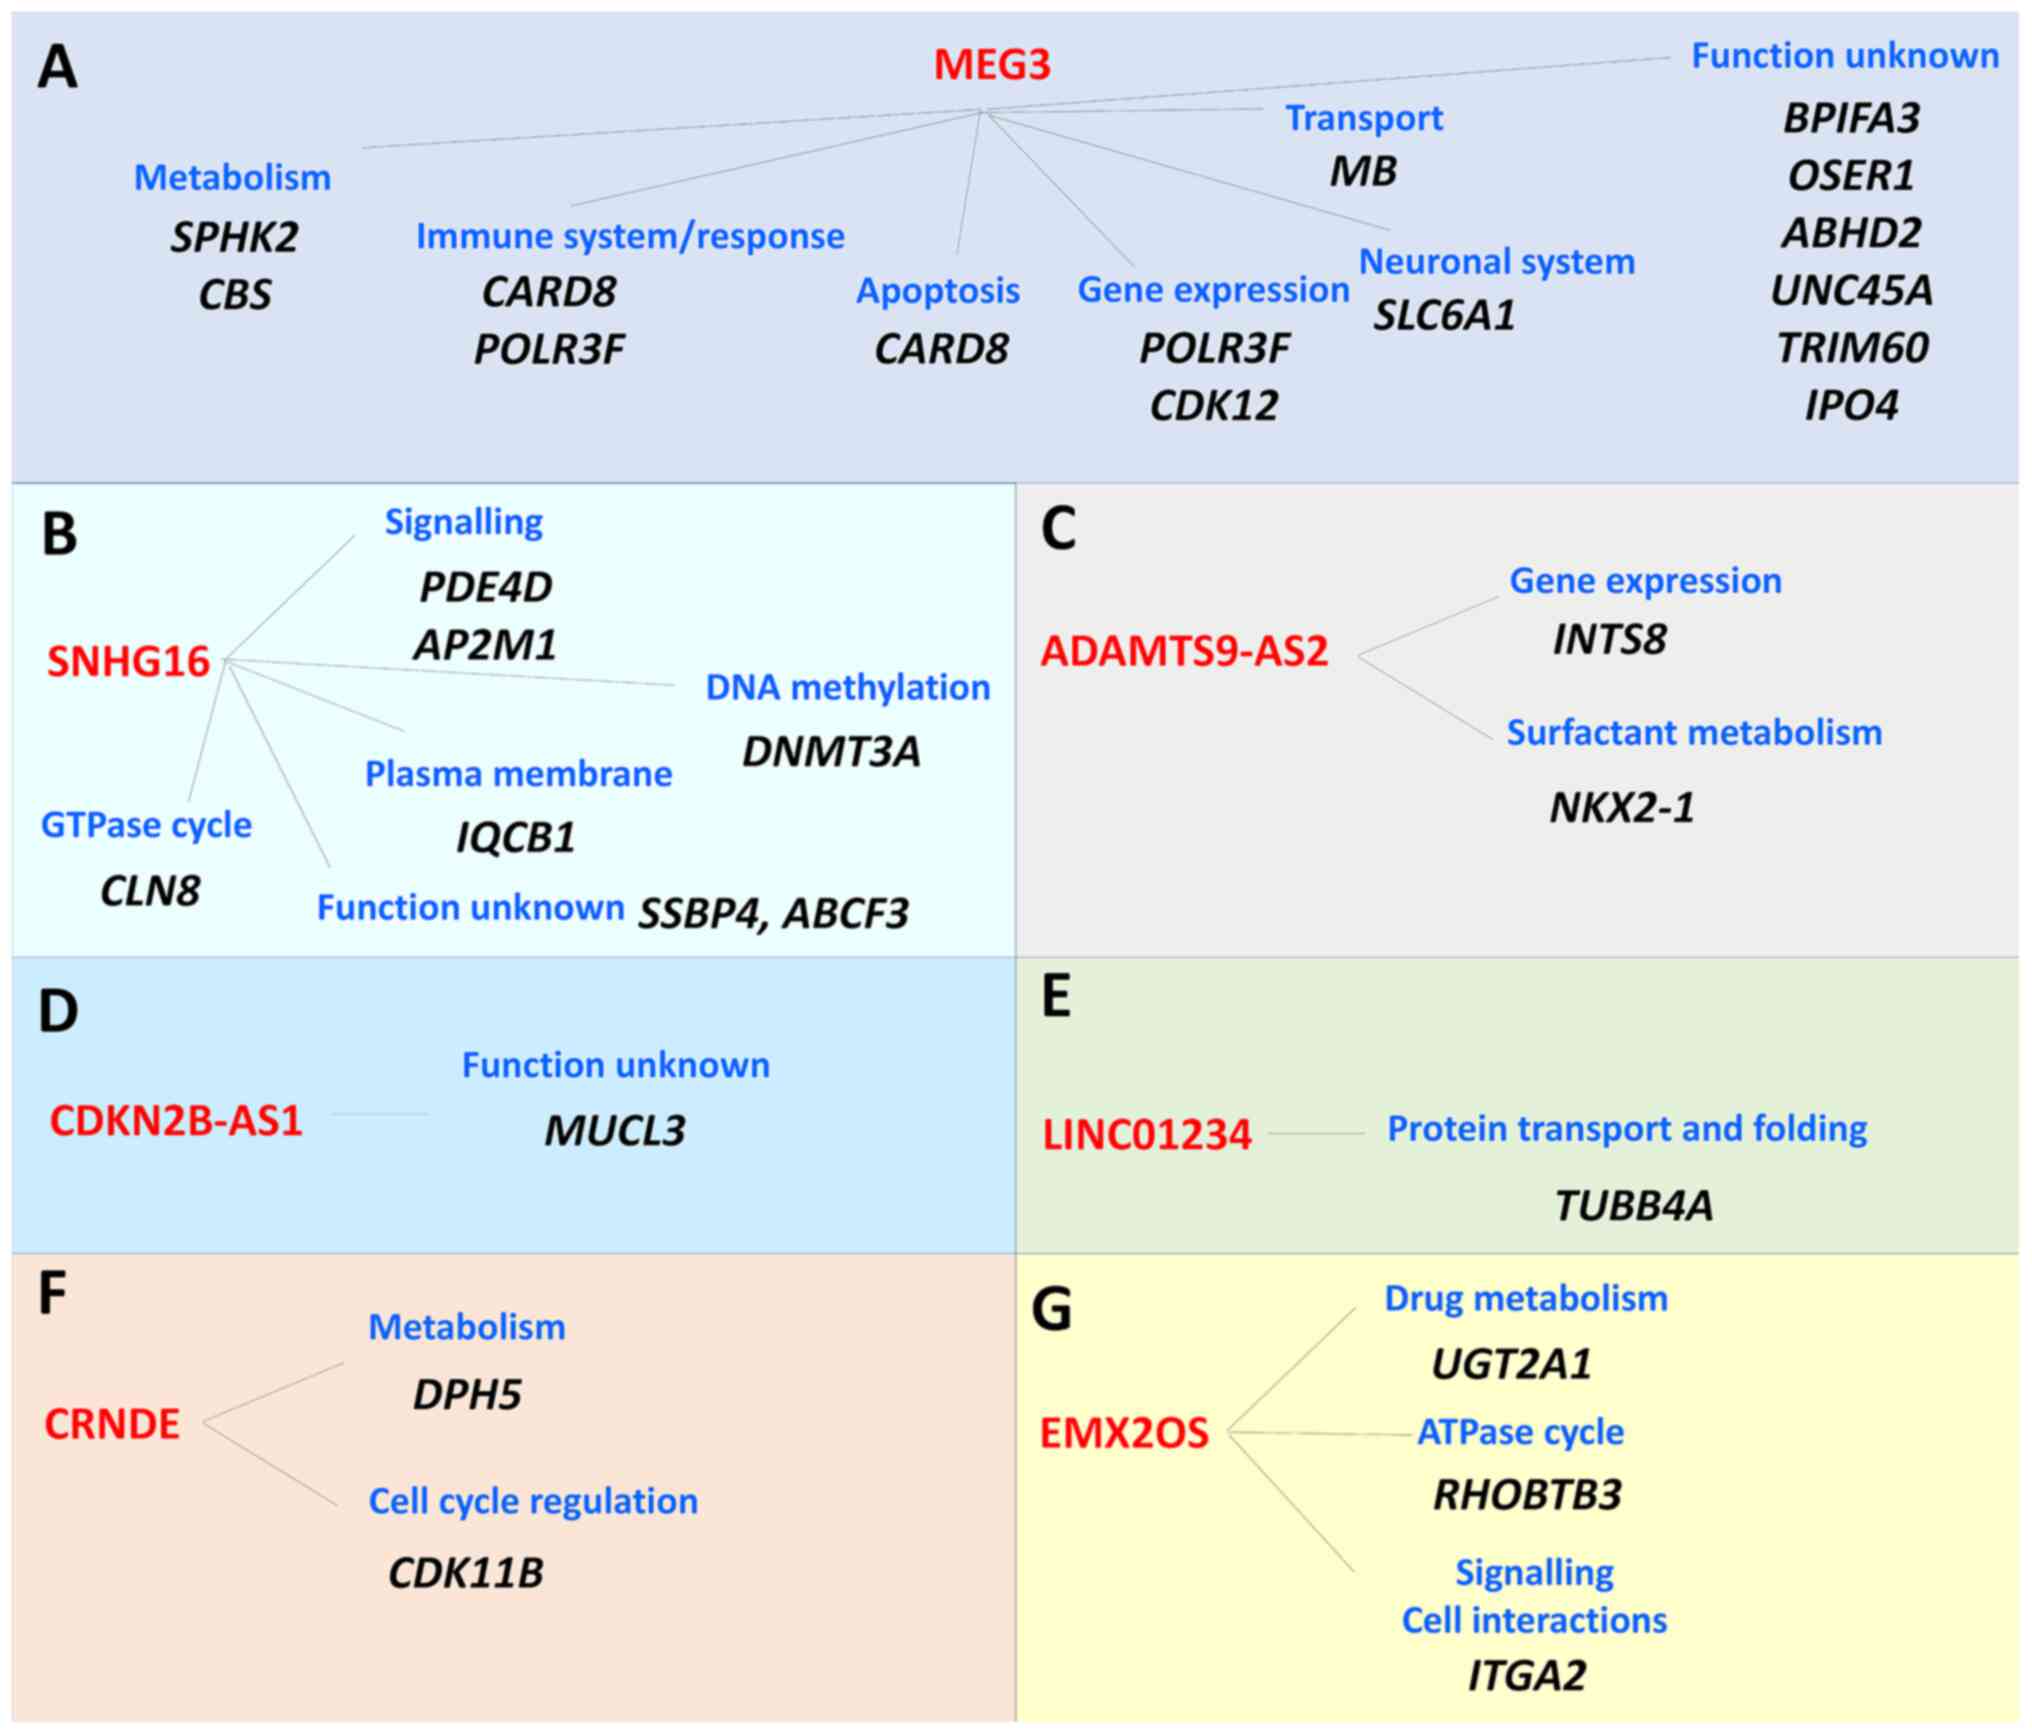
Pathway analysis was performed with the Reactome
database for the aforementioned lncRNAs (Fig. 5). Genes correlated with the lncRNA
MEG3 were significantly enriched in metabolism (SPHK2 and
CBS), immune system/response (CARD8 and
POLR3F), apoptosis (CARD8), gene expression
(POLR3F and CDK12), neuronal system (SLC6A1)
and transport (MB) pathways. The function of other genes
correlated with MEG3 (BPIFA3, OSER1, ABHD2, UNC45A, TRIM60
and IPO4) has not been identified to date (Fig. 5A). SNHG16 lncRNA-correlated genes
were significantly enriched in GTPase cycle (CLN8),
signaling (PDE4D and AP2M1), DNA methylation
(DNMT3A) and plasma membrane (IQCB1), and two genes
had unknown function (SSBP4 and ABCF3; Fig. 5B). Genes correlating with
ADAMTS9-AS2 lncRNA were significantly enriched in gene expression
(INTS8) and surfactant metabolism (NKX2-1; Fig. 5C). MUCL3 gene correlating
with CDKN2B-AS1 lncRNA has an unknown function (Fig. 5D). TUBB4A correlating with
LINC01234 lncRNA was significantly enriched in protein transport
and folding (Fig. 5E). Genes
correlating with CRNDE lncRNA were significantly enriched in
metabolic pathways (DPH5) and cell cycle regulation
(CDK11B; Fig. 5F), while
genes correlating with lncRNA EMX2OS were enriched in drug
metabolism (UGT2A1), ATPase cycle (RHOBTB3) and
signaling pathways/cell interactions (ITGA2; Fig. 5G). Results are summarized in
Table SVI.
Discussion
lncRNAs play a complex role in cancer biology
(9). Although the value of lncRNAs
as potential prognostic or predictive biomarker in patients with
mRCC has already been suggested (16), associations between lncRNA profile
and outcome focused on specific types of systemic targeted therapy
remain underexplored.
The present study analyzed associations between the
expression profile of cancer-specific lncRNAs selected using Human
Cancer PathwayFinder and the outcome of patients with mRCC treated
with sunitinib as first-line therapy. The results suggested a
potential prognostic and/or predictive role of HNF1A-AS1, IPW and
TUSC7 among 84 cancer-specific lncRNAs. Moreover, full
transcriptome analysis protein-coding genes was performed;
CLIP4 was associated with objective response. Furthermore,
MEG3 and SNHG16 lncRNAs were not only dysregulated in mRCC, but
also strongly associated with the expression levels of several
protein-coding genes, suggesting a complex functional significance
and potential use in targeted therapies.
Thus, according to the present study, downregulated
expression of the TUSC7 lncRNA may serve as a negative prognostic
and predictive biomarker candidate in follow-up studies on mRCC and
other malignancies. It was downregulated in tumors compared with
non-malignant renal tissue and upregulated in tumors of poor
responders and patients with worse survival (both PFS and OS). To
the best of our knowledge, TUSC7 has not been previously reported
in connection with renal malignancies. In non-malignant tissues,
TUSC7 expression is upregulated in testes (42). TUSC7-regulated cellular processes
play a tumor-suppressor function in various types of cancer, for
example, inhibiting the proliferation rate and migration of tumor
cells in epithelial-mesenchymal transition (EMT) in colorectal
cancer cell lines and tissue (43)
or osteosarcoma cells (44).
According to a previous study, TUSC7 downregulation is an
independent biomarker of poor prognosis in patients with
triple-negative breast cancer (45), which contradicts the observations of
the present study; this is probably due to the different nature of
tumors of individual tissue types. TUSC7 is regulated by p53 in
vitro (45) and thus, the
functional status of the p53 pathway may affect the TUSC7
prognostic significance. Patients with triple-negative breast
cancer have a high prevalence (~75%) of TP53 mutation (46). Thus, TUSC7 may have different
tissue-specific functions reflecting the p53 status in a specific
type and histological subtype of carcinoma, which may partly
explain discordant results.
HNF1A-AS1 and IPW served as positive predictive
biomarkers in the present study as their upregulation in tumors was
associated with good response and prolonged PFS. HNF1A-AS1 lncRNA
is upregulated mainly in gastrointestinal, liver and kidney tissues
(47). HNF1A-AS1 expression is
often deregulated in cancer and it serves roles in cell
proliferation, invasion, migration and apoptosis primarily via
cooperation with microRNAs (miRs) or by regulating the EMT process
(48–51). HNF1A-AS1 serves as a tumor promoter,
but also as a tumor suppressor, as shown by Zhang et al
(51). Upregulation of HNF1A-AS1 is
demonstrated in numerous tumors, such as osteosarcoma,
gastrointestinal, breast, lung or cervical carcinoma, while it is
downregulated in gastroenteropancreatic and neuroendocrine neoplasm
and oral squamous cell carcinoma (48,51).
In the present study, HNF1A-AS1 was significantly downregulated in
patients with mRCC. In connection with development of tumors and
tumor progression, HNF1A-AS1 promotes lung cancer cell
proliferation and invasion via regulating miR-17-5p (49). Expression of miR-149-5p negatively
correlated with HNF1A-AS1 in tissue of patients with non-small cell
lung cancer (NSCLC) and in NSCLC cell lines (50). In a meta-analysis focusing on the
usefulness of HNF1A-AS1 as a prognostic marker in malignant tumor,
high HNF1A-AS1 expression correlated with poor OS and disease-free
survival in patients with colorectal, bladder and lung cancer and
osteosarcoma (52). On the other
hand, HNF1A-AS1 serves as a tumor suppressor in other studies
(53,54), in accordance with the present study.
Dang et al (55) showed that
downregulation of HNF1A-AS1 in gastric cancer is associated with
tumor size and concentration of the protein serum biomarkers
carcinoembryonic antigen and carbohydrate antigen 19–9, as well as
with the protein expression of ribonucleotide reductase subunit M1
in tissue samples. In liver cancer, HNF1A-AS1 is downregulated, and
could inhibit the proliferative and metastatic abilities of
hepatocellular carcinoma xenograft tumors (54). Thus, the function and mechanism of
action of HNF1A-AS1 depends on cell specificity and tumor type.
IPW is a nuclear lncRNA with tissue-specific
expression. It has been shown to regulate genomic imprinting, a
subject for a study of transcriptional and
post-transcriptional-based gene regulation (56). The highest levels of IPW are
identified in the nervous system, based on estimation by BioGPS
microarray (57). IPW forms part of
a six-lncRNA prognostic signature in gastric cancer (58) and recently it was reported to be
downregulated in head and neck squamous cell cancer (HNSCC) cells
in comparison with normal keratinocyte cells in vitro
(59). In addition, downregulation
of expression of IPW is associated with worse OS in patients with
HNSCC (59). The present study
found an association between downregulation of IPW expression and
poor objective response and worse PFS in patients with mRCC, but
not with OS, suggesting predictive, rather than prognostic, value.
To the best of our knowledge, the role of IPW in ccRCC has not been
investigated to date.
To address the complexity of lncRNA-mRNA interacting
networks, the present study complemented the targeted lncRNA
analyses with assessment of the coding transcriptome in a subset of
patients with mRCC. The analysis revealed upregulation of
CLIP4 in patients with mRCC with poor response to sunitinib.
CLIP4 encodes the intracellular CAP-Gly domain containing
linker protein family member 4, a protein involved in cytoplasmic
microtubule organization (Gene Ontology:0031122) (60). Park et al (61) analyzed the transcriptome of patients
with early-stage ccRCC (n=24) using RNASeq and subsequently
suggested and validated the association of CLIP4
upregulation with poor prognosis. In addition, CLIP4
mutations are enriched 3-fold in patients with aggressive ccRCC
defined as tumors exhibiting synchronous metastasis, early
recurrence or cancer-specific mortality, compared with patients
without aggressive ccRCC (61). Ahn
et al (62) noted that
upregulation of CLIP4 expression was associated with
synchronous metastasis in ccRCC, and an in vitro functional
study showed that CLIP4 significantly increases cell
migration and viability in ccRCC (62). Taken together, several studies,
including the current one, suggest CLIP4 upregulation as a
poor prognosis biomarker in patients with ccRCC.
In the present study, two lncRNAs (MEG3 and SNHG16)
were significantly associated with individual gene expression
profile of tumors from patients with mRCC. MEG3 expression was
positively correlated with expression of 14 protein-coding genes,
and pathway enrichment analysis suggested an involvement of genes
from biological processes such as cell metabolism, apoptosis,
transport and immune system regulation. A network involving MEG3
lncRNA may serve a role in prognosis and therapy response. Gong
et al (63) revealed a
positive correlation of ST3 β-galactoside α-2,3-sialyltransferase 1
(ST3Gal1) expression with MEG3 in ccRCC, and suggested a potential
role of the MEG3/ST3Gal1/epidermal growth factor receptor axis in
ccRCC progression. Upregulation of MEG3 induces apoptosis via the
reduction of Bcl-2 and procaspase-9 protein and the promotion of
cytochrome c release into the cytoplasm (14). The present study found a significant
downregulation of MEG3 in ccRCC, confirming the results of previous
studies (14,63,64)
reporting downregulation of MEG3 in tumors of patients with ccRCC
and ccRCC cell lines compared with non-malignant renal tissues.
SNHG16 lncRNA was upregulated in tumors and
negatively correlated with the expression of seven protein-coding
genes in the present study. Functionally, SNHG16 promotes cell
proliferation and suppresses apoptosis via interaction with
miR-1301-3p, leading to the upregulation of STAR expression
in ccRCC cells (65). In agreement
with a previous study (65), the
present study confirmed that SNHG16 may serve a role as an oncogene
in ccRCC.
There are limitations to the present study,
including a small sample size and a retrospective design.
Nevertheless, the current study focused on the metastatic stage of
ccRCC, which is not as common as the early stages of ccRCC and
there are limited options to obtain fresh frozen tissue samples
from patients with mRCC, particularly those with synchronous
metastatic disease. The next limitation is that qPCR for lncRNA
profile measures only the expression of a limited number of
pre-selected lncRNAs. Another limitation is that sunitinib
monotherapy is no longer the first choice of first-line treatment
and it has been replaced with immunotherapy combination regimens,
represented by combinations of TKI plus ICI or ICI plus ICI.
Finally, the lack of functional studies of the identified candidate
lncRNA biomarkers is another limitation.
On the other hand, TKIs are still widely used in the
treatment of mRCC, and a search for candidate predictive biomarkers
for these agents could bring progress in the personalized use of
TKIs in monotherapy, even in combination with immunotherapy
(7,8). Moreover, the followed-up group of
patients with mRCC was clinically well-characterized, particulary
during first-line systemic treatment and represented a uniquely
homogenous group of patients with mRCC, coupled with the
prospectively updated outcome data. Furthermore, high-throughput
RNASeq methodology was used for estimation of the whole coding
transcriptome in 20 patients with mRCC, and the data of the current
study may serve as a hypothesis-generating screening for larger
functional and replication studies in independent cohorts of
patients with mRCC to confirm the observations of the present
study. Functional studies of the candidate lncRNA biomarkers
identified in the present study are ongoing.
In conclusion, the present study provided novel
information within the lncRNA field and their clinical role as
molecular biomarkers of therapeutic response in patients with mRCC.
Among 84 cancer-associated lncRNAs, HNF1A-AS1, IPW and TUSC7
dysregulation was associated with outcome of patients with mRCC
treated with sunitinib. Moreover, the predictive association was
revealed for the CLIP4 protein-coding transcript.
Additionally, significant associations of MEG3 and SNHG16 with
several protein-coding transcripts, creating complex interactive
networks, were identified and confirmed by in silico
predictions of molecular and biological function. The
aforementioned molecules represent putative candidates for
predictive and prognostic biomarkers in precision and personalized
therapy of mRCC.
Supplementary Material
Supporting Data
Acknowledgements
Not applicable.
Funding
The present study was supported by the Ministry of Education,
Youth and Sports of the Czech Republic (project INTER-ACTION; grant
no. LUAUS23164), National Institute for Cancer Research (program
EXCELES; grant no. LX22NPO5102) funded by the European Union
(EU)-Next Generation EU, Grant Agency of Charles University
(project GAUK; grant no. 1074120), Charles University (project
COOPERATIO Surgical Disciplines; grant no. 207043) and by the EU
Horizon 2020 research and innovation program (grant no.
856620).
Availability of data and materials
The datasets used and/or analyzed during the current
study are available from the corresponding author on reasonable
request. RNASeq data are available in the National Center for
Biotechnology Information database's Sequence Read Archive
repository, BioProject no. PRJNA932699
(ncbi.nlm.nih.gov/bioproject/PRJNA932699/).
Authors' contributions
RV, OF, PS and TT conceptualized the study. TT, KK
and KS performed experiments. TT and KS performed data analysis.
MH, OH and KP provided and characterized tissue resources, and
described all clinical parameters and characteristics included in
this paper. KS and TT visualized the data. TT, KK, KS and OF wrote
the manuscript. OF, RV and PS reviewed and edited the manuscript.
PS supervised the study and created essential parts of the
discussion section. TT and KS confirm the authenticity of all the
raw data. All authors have read and approved the final
manuscript.
Ethics approval and consent to
participate
The present study involving human subjects was
conducted according to the guidelines of the Declaration of
Helsinki and approved by The Ethics Committee of the Faculty of
Medicine and University Hospital Pilsen, Charles University
(approval no. 302/2020). Written informed consent was obtained from
all subjects involved in the study.
Patient consent for publication
Not applicable.
Competing interests
Ondrej Fiala received payment or honoraria for
lectures, presentations, speakers' bureaus, or educational events
from Roche, Janssen, GSK, MSD, Pierre Fabre, BMS and Pfizer
unrelated to this project.
References
|
1
|
Znaor A, Lortet-Tieulent J, Laversanne M,
Jemal A and Bray F: International variations and trends in renal
cell carcinoma incidence and mortality. Eur Urol. 67:519–530. 2015.
View Article : Google Scholar : PubMed/NCBI
|
|
2
|
Therasse P, Arbuck SG, Eisenhauer EA,
Wanders J, Kaplan RS, Rubinstein L, Verweij J, Van Glabbeke M, van
Oosterom AT, Christian MC and Gwyther SG: New Guidelines to
evaluate the response to treatment in solid tumors. European
Organization for Research and Treatment of Cancer, National Cancer
Institute of the United States, National Cancer Institute of
Canada. J Natl Cancer Inst. 92:205–216. 2000. View Article : Google Scholar : PubMed/NCBI
|
|
3
|
National Cancer Institure (NCI), . Clear
Cell Renal Cell Carcinoma-NCI. https://www.cancer.gov/pediatric-adult-rare-tumor/rare-tumors/rare-kidney-tumors/clear-cell-renal-cell-carcinomaFebruary
1–2023
|
|
4
|
Xue J, Chen W, Xu W, Xu Z, Li X, Qi F and
Wang Z: Patterns of distant metastases in patients with clear cell
renal cell carcinoma - - A population-based analysis. Cancer Med.
10:173–187. 2020. View Article : Google Scholar : PubMed/NCBI
|
|
5
|
Dabestani S, Thorstenson A, Lindblad P,
Harmenberg U, Ljungberg B and Lundstam S: Renal cell carcinoma
recurrences and metastases in primary non-metastatic patients: A
population-based study. World J Urol. 34:1081–1086. 2016.
View Article : Google Scholar : PubMed/NCBI
|
|
6
|
Eggers H, Schünemann C, Grünwald V,
Rudolph L, Tiemann ML, Reuter C, Anders-Meyn MF, Ganser A and
Ivanyi P: Improving survival in metastatic renal cell carcinoma
(MRCC) patients: Do elderly patients benefit from expanded targeted
therapeutic options? World J Urol. 40:2489–2497. 2022. View Article : Google Scholar : PubMed/NCBI
|
|
7
|
Sheng IY and Ornstein MC: Ipilimumab and
nivolumab as first-line treatment of patients with renal cell
carcinoma: The evidence to date. Cancer Manag Res. 12:4871–4881.
2020. View Article : Google Scholar : PubMed/NCBI
|
|
8
|
Motzer RJ, Jonasch E, Agarwal N, Alva A,
Baine M, Beckermann K, Carlo MI, Choueiri TK, Costello BA, Derweesh
IH, et al: Kidney cancer, Version 3.2022, NCCN clinical practice
guidelines in oncology. J Natl Compr Canc Netw. 20:71–90. 2022.
View Article : Google Scholar : PubMed/NCBI
|
|
9
|
Statello L, Guo CJ, Chen LL and Huarte M:
Gene regulation by long Non-Coding RNAs and Its biological
functions. Nat Rev Mol Cell Biol. 22:96–118. 2021. View Article : Google Scholar : PubMed/NCBI
|
|
10
|
Shao K, Shi T, Yang Y, Wang X, Xu D and
Zhou P: Highly expressed LncRNA CRNDE promotes cell proliferation
through Wnt/β-Catenin signaling in renal cell carcinoma. Tumour
Biol. Oct 6–2016.(Epub ahead of print). View Article : Google Scholar
|
|
11
|
Wang L, Cai Y, Zhao X, Jia X, Zhang J, Liu
J, Zhen H, Wang T, Tang X, Liu Y and Wang J: Down-regulated long
non-coding RNA H19 inhibits carcinogenesis of renal cell carcinoma.
Neoplasma. 62:412–418. 2015. View Article : Google Scholar : PubMed/NCBI
|
|
12
|
Wu Y, Liu J, Zheng Y, You L, Kuang D and
Liu T: Suppressed expression of long Non-coding RNA HOTAIR inhibits
proliferation and tumourigenicity of renal carcinoma cells. Tumour
Biol. 35:11887–11894. 2014. View Article : Google Scholar : PubMed/NCBI
|
|
13
|
Zhang M, Lu W, Huang Y, Shi J, Wu X, Zhang
X, Jiang R, Cai Z and Wu S: Downregulation of the long noncoding
RNA TUG1 inhibits the proliferation, migration, invasion and
promotes apoptosis of renal cell carcinoma. J Mol Histol.
47:421–428. 2016. View Article : Google Scholar : PubMed/NCBI
|
|
14
|
Wang M, Huang T, Luo G, Huang C, Xiao XY,
Wang L, Jiang GS and Zeng FQ: Long Non-Coding RNA MEG3 induces
renal cell carcinoma cells apoptosis by activating the
mitochondrial pathway. J Huazhong Univ Sci Technolog Med Sci.
35:541–545. 2015. View Article : Google Scholar : PubMed/NCBI
|
|
15
|
Qiao HP, Gao WS, Huo JX and Yang ZS: Long
Non-Coding RNA GAS5 functions as a tumor suppressor in renal cell
carcinoma. Asian Pac J Cancer Prev. 14:1077–1082. 2013. View Article : Google Scholar : PubMed/NCBI
|
|
16
|
Li M, Wang Y, Cheng L, Niu W, Zhao G, Raju
JK, Huo J, Wu B, Yin B, Song Y and Bu R: Long Non-Coding RNAs in
renal cell carcinoma: A systematic review and clinical
implications. Oncotarget. 8:48424–48435. 2017. View Article : Google Scholar : PubMed/NCBI
|
|
17
|
Zhang H, Yang F, Chen SJ, Che J and Zheng
J: Upregulation of Long Non-Coding RNA MALAT1 correlates with tumor
progression and poor prognosis in clear cell renal cell carcinoma.
Tumour Biol. 36:2947–2955. 2015. View Article : Google Scholar : PubMed/NCBI
|
|
18
|
Posa I, Carvalho S, Tavares J and Grosso
AR: A Pan-cancer analysis of MYC-PVT1 Reveals CNV-Unmediated
deregulation and poor prognosis in renal carcinoma. Oncotarget.
7:47033–47041. 2016. View Article : Google Scholar : PubMed/NCBI
|
|
19
|
Wang Y, Liu J, Bai H, Dang Y, Lv P and Wu
S: Long Intergenic Non-Coding RNA 00152 promotes renal cell
carcinoma progression by epigenetically suppressing P16 and
negatively regulates MiR-205. Am J Cancer Res. 7:312–322.
2017.PubMed/NCBI
|
|
20
|
Xiao H, Bao L, Xiao W, Ruan H, Song Z, Qu
Y, Chen K, Zhang X and Yang H: Long Non-Coding RNA Lucat1 is a poor
prognostic factor and demonstrates malignant biological behavior in
clear cell renal cell carcinoma. Oncotarget. 8:113622–113634. 2017.
View Article : Google Scholar : PubMed/NCBI
|
|
21
|
Song EL, Xing L, Wang L, Song WT, Li DB,
Wang Y, Gu YW, Liu MM, Ni WJ, Zhang P, et al: LncRNA ADAMTS9-AS2
inhibits cell proliferation and decreases chemoresistance in clear
cell renal cell carcinoma via the MiR-27a-3p/FOXO1 axis. Aging
(Albany NY). 11:5705–5725. 2019. View Article : Google Scholar : PubMed/NCBI
|
|
22
|
Qu L, Ding J, Chen C, Wu ZJ, Liu B, Gao Y,
Chen W, Liu F, Sun W, Li XF, et al: Exosome-Transmitted LncARSR
promotes sunitinib resistance in renal cancer by acting as a
competing endogenous RNA. Cancer Cell. 29:653–668. 2016. View Article : Google Scholar : PubMed/NCBI
|
|
23
|
Zhai W, Sun Y, Guo C, Hu G, Wang M, Zheng
J, Lin W, Huang Q, Li G, Zheng J and Chang C: LncRNA-SARCC
suppresses renal cell carcinoma (RCC) progression via altering the
androgen receptor(AR)/MiRNA-143-3p signals. Cell Death Differ.
24:1502–1517. 2017. View Article : Google Scholar : PubMed/NCBI
|
|
24
|
Saad OA, Li WT, Krishnan AR, Nguyen GC,
Lopez JP, McKay RR, Wang-Rodriguez J and Ongkeko WM: The Renal
clear cell carcinoma immune landscape. Neoplasia. 24:145–154. 2022.
View Article : Google Scholar : PubMed/NCBI
|
|
25
|
Roldán FL, Izquierdo L, Ingelmo-Torres M,
Lozano JJ, Carrasco R, Cuñado A, Reig O, Mengual L and Alcaraz A:
Prognostic gene expression-based signature in clear-cell renal cell
carcinoma. Cancers (Basel). 14:37542022. View Article : Google Scholar : PubMed/NCBI
|
|
26
|
Flaifel A, Xie W, Braun DA, Ficial M,
Bakouny Z, Nassar AH, Jennings RB, Escudier B, George DJ, Motzer
RJ, et al: PD-L1 expression and clinical outcomes to cabozantinib,
everolimus and sunitinib in patients with metastatic renal cell
carcinoma: Analysis of the randomized clinical trials METEOR and
CABOSUN. Clin Cancer Res. 25:6080–6088. 2019. View Article : Google Scholar : PubMed/NCBI
|
|
27
|
Qu Y, Lin Z, Qi Y, Qi Y, Chen Y, Zhou Q,
Zeng H, Liu Z, Wang Z, Wang J, et al: PAK1 expression determines
poor prognosis and immune evasion in metastatic renal cell
carcinoma patients. Urol Oncol. 38:293–304. 2020. View Article : Google Scholar : PubMed/NCBI
|
|
28
|
Motzer RJ, Bacik J, Murphy BA, Russo P and
Mazumdar M: Interferon-Alfa as a comparative treatment for clinical
trials of new therapies against advanced renal cell carcinoma. J
Clin Oncol. 20:289–296. 2002. View Article : Google Scholar : PubMed/NCBI
|
|
29
|
Fiala O, Finek J, Poprach A, Melichar B,
Kopecký J, Zemanova M, Kopeckova K, Mlcoch T, Dolezal T, Capkova L
and Buchler T: Outcomes according to MSKCC risk score with focus on
the Intermediate-Risk Group in metastatic renal cell carcinoma
patients treated with first-line sunitinib: A Retrospective
analysis of 2390 Patients. Cancers (Basel). 12:8082020. View Article : Google Scholar : PubMed/NCBI
|
|
30
|
European Medicines Agency (EMA), . Sutent.
European Medicines Agency; Amsterdam: 2021, https://www.ema.europa.eu/en/medicines/human/EPAR/sutentMay
23–2023
|
|
31
|
Eisenhauer EA, Therasse P, Bogaerts J,
Schwartz LH, Sargent D, Ford R, Dancey J, Arbuck S, Gwyther S,
Mooney M, et al: New response evaluation criteria in solid tumours:
Revised RECIST guideline (Version 1.1). Eur J Cancer. 45:228–247.
2009. View Article : Google Scholar : PubMed/NCBI
|
|
32
|
Schroeder A, Mueller O, Stocker S,
Salowsky R, Leiber M, Gassmann M, Lightfoot S, Menzel W, Granzow M
and Ragg T: The RIN: An RNA integrity number for assigning
integrity values to RNA measurements. BMC Mol Biol. 7:32006.
View Article : Google Scholar : PubMed/NCBI
|
|
33
|
Bustin SA, Benes V, Garson JA, Hellemans
J, Huggett J, Kubista M, Mueller R, Nolan T, Pfaffl MW, Shipley GL,
et al: The MIQE guidelines: Minimum information for publication of
quantitative real-Time PCR Experiments. Clin Chem. 55:611–622.
2009. View Article : Google Scholar : PubMed/NCBI
|
|
34
|
Livak KJ and Schmittgen TD: Analysis of
relative gene expression data using real-time quantitative PCR and
the 2(−Delta Delta C(T)) method. Methods. 25:402–408. 2001.
View Article : Google Scholar : PubMed/NCBI
|
|
35
|
Babraham Bioinformatics, . FastQC: A
Quality Control Tool for High Throughput Sequence Data. https://www.bioinformatics.babraham.ac.uk/projects/fastqc/November
2–2021
|
|
36
|
Benjamini Y and Hochberg Y: Controlling
the false discovery rate: A practical and powerful approach to
multiple testing. J Royal Statistical Soc Series B
(Methodological). 57:289–300. 1995. View Article : Google Scholar
|
|
37
|
Ensembl, . Human (GRCh38.p13). http://www.ensembl.org/Homo_sapiens/Info/IndexMay
25–2023
|
|
38
|
Bray NL, Pimentel H, Melsted P and Pachter
L: Near-optimal probabilistic RNA-Seq quantification. Nat
Biotechnol. 34:525–527. 2016. View Article : Google Scholar : PubMed/NCBI
|
|
39
|
McCarthy DJ, Chen Y and Smyth GK:
Differential expression analysis of multifactor RNA-Seq experiments
with respect to biological variation. Nucleic Acids Res.
40:4288–4297. 2012. View Article : Google Scholar : PubMed/NCBI
|
|
40
|
Bonferroni CE: Il Calcolo Delle
Assicurazioni Su Gruppi Di Teste. Studi in onore del Professore
Salvatore Ortu Carboni. 1935.
|
|
41
|
Gillespie M, Jassal B, Stephan R, Milacic
M, Rothfels K, Senff-Ribeiro A, Griss J, Sevilla C, Matthews L,
Gong C, et al: The reactome pathway knowledgebase 2022. Nucleic
Acids Res. 50:D687–D692. 2022. View Article : Google Scholar : PubMed/NCBI
|
|
42
|
GTEx Portal: TUSC7. https://www.gtexportal.org/home/gene/TUSC7October
12–2022
|
|
43
|
Ren W, Chen S, Liu G, Wang X, Ye H and Xi
Y: TUSC7 acts as a tumor suppressor in colorectal cancer. Am J
Transl Res. 9:4026–4035. 2017.PubMed/NCBI
|
|
44
|
Cong M, Li J, Jing R and Li Z: Long
Non-Coding RNA tumor suppressor candidate 7 functions as a tumor
suppressor and inhibits proliferation in osteosarcoma. Tumour Biol.
37:9441–9450. 2016. View Article : Google Scholar : PubMed/NCBI
|
|
45
|
Zheng BH, He ZX, Zhang J, Ma JJ, Zhang HW,
Zhu W, Shao ZM and Ni XJ: The biological function of
TUSC7/MiR-1224-3p axis in triple-negative breast cancer. Cancer
Manag Res. 13:5763–5774. 2021. View Article : Google Scholar : PubMed/NCBI
|
|
46
|
Darb-Esfahani S, Denkert C, Stenzinger A,
Salat C, Sinn B, Schem C, Endris V, Klare P, Schmitt W, Blohmer JU,
et al: Role of TP53 mutations in triple negative and HER2-Positive
breast cancer treated with neoadjuvant Anthracycline/Taxane-Based
chemotherapy. Oncotarget. 7:67686–67698. 2016. View Article : Google Scholar : PubMed/NCBI
|
|
47
|
GTEx Portal: HNF1A-AS1. https://www.gtexportal.org/home/gene/HNF1A-AS1February
1–2023
|
|
48
|
Liu Y, Zhao F, Tan F, Tang L, Du Z, Mou J,
Zhou G and Yuan C: HNF1A-AS1: A Tumor-associated long non-coding
RNA. Curr Pharm Des. 28:1720–1729. 2022. View Article : Google Scholar : PubMed/NCBI
|
|
49
|
Zhang G, An X and Zhao H, Zhang Q and Zhao
H: Long non-coding RNA HNF1A-AS1 promotes cell proliferation and
invasion via regulating MiR-17-5p in Non-Small cell lung cancer.
Biomed Pharmacother. 98:594–599. 2018. View Article : Google Scholar : PubMed/NCBI
|
|
50
|
Liu L, Chen Y, Li Q and Duan P: LncRNA
HNF1A-AS1 modulates non-small cell lung cancer progression by
targeting MiR-149-5p/Cdk6. J Cell Biochem. 120:18736–18750. 2019.
View Article : Google Scholar : PubMed/NCBI
|
|
51
|
Zhang Y, Shi J, Luo J, Liu C and Zhu L:
Regulatory mechanisms and potential medical applications of
HNF1A-AS1 in cancers. Am J Transl Res. 14:4154–4168.
2022.PubMed/NCBI
|
|
52
|
Zhou X, Fan YH, Wang Y and Liu Y:
Prognostic and clinical significance of long non-coding RNA
HNF1A-AS1 in solid cancers: A systematic review and meta-analysis.
Medicine (Baltimore). 98:e182642019. View Article : Google Scholar : PubMed/NCBI
|
|
53
|
Shi Y, Zhang Q, Xie M, Feng Y, Ma S, Yi C,
Wang Z, Li Y, Liu X, Liu H, et al: Aberrant Methylation-mediated
decrease of LncRNA HNF1A-AS1 contributes to malignant progression
of laryngeal squamous cell carcinoma via EMT. Oncol Rep.
44:2503–2516. 2020. View Article : Google Scholar : PubMed/NCBI
|
|
54
|
Ding CH, Yin C, Chen SJ, Wen LZ, Ding K,
Lei SJ, Liu JP, Wang J, Chen KX, Jiang HL, et al: The
HNF1α-Regulated LncRNA HNF1A-AS1 reverses the malignancy of
hepatocellular carcinoma by enhancing the phosphatase activity of
SHP-1. Mol Cancer. 17:632018. View Article : Google Scholar : PubMed/NCBI
|
|
55
|
Dang Y, Lan F, Ouyang X, Wang K, Lin Y, Yu
Y, Wang L, Wang Y and Huang Q: Expression and clinical significance
of long Non-Coding RNA HNF1A-AS1 in human gastric cancer. World J
Surg Oncol. 13:3022015. View Article : Google Scholar : PubMed/NCBI
|
|
56
|
Kanduri C: Long Noncoding RNAs: Lessons
from genomic imprinting. Biochim Biophys Acta. 1859:102–111. 2016.
View Article : Google Scholar : PubMed/NCBI
|
|
57
|
BioGPS, . IPW (Imprinted in Prader-Willi
Syndrome). http://biogps.org/#goto=genereport&id=3653October
12–2022
|
|
58
|
Ma B, Li Y and Ren Y: Identification of a
6-lncRNA prognostic signature based on microarray Re-annotation in
gastric cancer. Cancer Med. 9:335–349. 2019. View Article : Google Scholar : PubMed/NCBI
|
|
59
|
Tang SJ, You GR, Chang JT and Cheng AJ:
Systematic analysis and identification of dysregulated panel
LncRNAs contributing to poor prognosis in Head-neck cancer. Front
Oncol. 11:7317522021. View Article : Google Scholar : PubMed/NCBI
|
|
60
|
GeneCards - The Human Gene Database.
CLIP4. https://www.genecards.org/cgi-bin/carddisp.pl?gene=CLIP4&keywords=CLIP4February
2–2023
|
|
61
|
Park JS, Pierorazio PM, Lee JH, Lee HJ,
Lim YS, Jang WS, Kim J, Lee SH, Rha KH, Cho NH and Ham WS: Gene
expression analysis of aggressive clinical T1 stage clear cell
renal cell carcinoma for identifying potential diagnostic and
prognostic biomarkers. Cancers (Basel). 12:E2222020. View Article : Google Scholar
|
|
62
|
Ahn J, Han KS, Heo JH, Bang D, Kang YH,
Jin HA, Hong SJ, Lee JH and Ham WS: FOXC2 and CLIP4: A potential
biomarker for synchronous metastasis of ≤7-Cm clear cell renal cell
carcinomas. Oncotarget. 7:51423–51434. 2016. View Article : Google Scholar : PubMed/NCBI
|
|
63
|
Gong A, Zhao X, Pan Y, Qi Y, Li S, Huang
Y, Guo Y, Qi X, Zheng W and Jia L: The LncRNA MEG3 mediates renal
cell cancer progression by regulating ST3Gal1 transcription and
EGFR sialylation. J Cell Sci. 133:jcs2440202020. View Article : Google Scholar : PubMed/NCBI
|
|
64
|
He H, Dai J, Zhuo R, Zhao J, Wang H, Sun
F, Zhu Y and Xu D: Study on the mechanism behind LncRNA MEG3
affecting clear cell renal cell carcinoma by regulating
MiR-7/RASL11B signaling. J Cell Physiol. 233:9503–9515. 2018.
View Article : Google Scholar : PubMed/NCBI
|
|
65
|
Cheng T, Shuang W, Ye D, Zhang W, Yang Z,
Fang W, Xu H, Gu M, Xu W and Guan C: SNHG16 promotes cell
proliferation and inhibits cell apoptosis via regulation of the
MiR-1303-p/STARD9 Axis in clear cell renal cell carcinoma. Cell
Signal. 84:1100132021. View Article : Google Scholar : PubMed/NCBI
|