Introduction
Carbonyl reductase 1 (CBR1), an NADPH-dependent
monomeric cytosolic enzyme with wide specificity for carbonyl
compounds (1), is expressed in the
intestinal tract, liver, kidneys, skin, and ovaries (2,3), where
it reduces carbonyl compounds such as anthracyclines, daunorubicin,
doxorubicin, and prostaglandins (3). Studies suggest that its primary
function is regulation of fatty acid metabolism (3).
CBR1 expression levels are associated with cancer
cell malignancy; for example, reduced expression is accompanied by
a fall in expression of E-cadherin along with activation of matrix
metalloproteinases, which promotes cell proliferation and
tumorigenesis of ovarian, cervical, and endometrial cancers in
vivo (4–6). Previously, we reported that the
prognosis for patients with ovarian cancer showing low expression
of CBR1 is worse than that of those with ovarian cancer
overexpressing CBR1 (4). In
addition, increased expression of CBR1 suppresses growth of ovarian
cancer cells (6), whereas decreased
expression promotes growth and metastasis (5). Our previous study also suggests that
increased expression of CBR1 in ovarian cancer cells may exert
antitumor effects by activating caspase pathways (6). CBR1 suppresses development of cervical
cancer, uterine sarcoma, and non-small cell lung carcinoma
(7–9). Taken together, these data suggest that
CBR1 regulates fatty acid metabolism and suppresses tumor growth
via different molecular mechanisms; however, the signaling cascades
affected by changes in CBR1 expression have not been examined in
detail.
Proteomics analysis involves systematic,
comprehensive, and quantitative identification of the proteins
(i.e., the proteome) present in a biological system (e.g., cells,
tissues, organs, fluids, and whole organisms) at a specific point
in time (10–12). The three main branches of proteomics
used to characterize the function and location of proteins are (I)
functional proteomics, (II) structural proteomics, and (III)
expression proteomics. The information obtained can be used to
predict new proteins involved in signal transduction and disease
pathogenesis (13). Therefore,
proteomics should be useful for elucidating the molecular
mechanisms affected by increased or decreased expression of
CBR1.
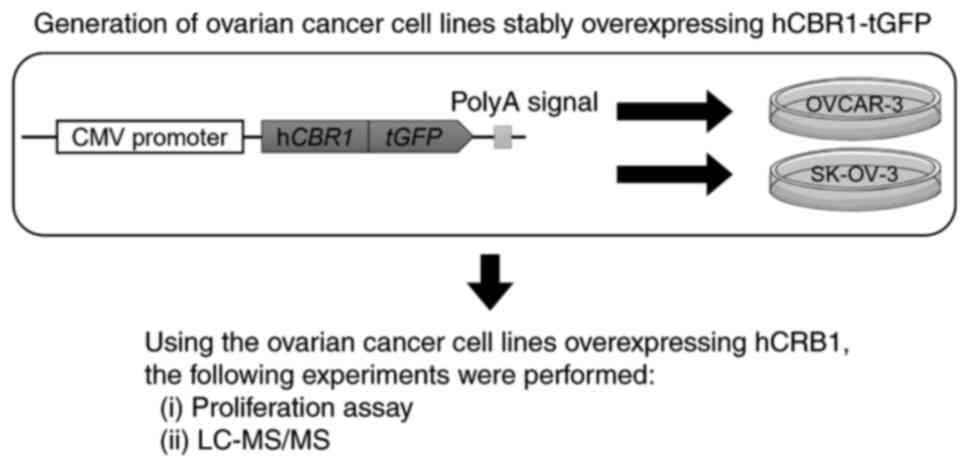
In this study, we used a proteomics analysis
approach to examine signaling cascades altered by stable
overexpression of CBR1 in ovarian cancer cells. The workflow of the
study is shown in Fig. 1. We
generated human ovarian cancer cell lines stably expressing human
CBR1 (hCBR1), and then investigated whether their growth was
inhibited. We then used liquid chromatography followed by mass
spectrometry (LC-MS/MS) to identify the molecules/signaling
pathways affected.
Materials and methods
Cell lines and cell culture
OVCAR-3 and SK-OV-3 cell lines were purchased from
the American Type Culture Collection (HTB-161 and HTB-77,
respectively; Rockville, MD, USA). These cell lines are derived
from human ovarian cancer cell tissue and are often used to
generate solid tumor xenografts (10,14–18).
The cells were cultured in RPMI-1640 medium (Sigma-Aldrich, St
Louis, MO, USA) at 37°C in a water-saturated atmosphere containing
5% CO2/95% air. The culture medium was supplemented with 10% fetal
bovine serum (NICHIREI Biosciences, Tokyo, Japan), 100 U/ml
penicillin, and 100 µg/ml streptomycin.
Preparation of plasmid DNA
The pCMV6-AC-GFP-hCBR1 plasmid (RG204950, OriGene
Technologies, Inc., Rockville, MD, USA) was used to generate
hCBR1-overexpressing cells. This plasmid encodes hCBR1 fused to
turbo green fluorescent protein (hCBR1-tGFP), which is expressed
under the control of the CMV promoter. Plasmid pCMV6-AC-GFP
(PS100010, OriGene Technologies, Inc.), which expresses tGFP, was
used to generate negative control cell lines.
Transfection of ovarian cancer
cells
Ovarian cancer cells were plated into a 10 cm dish
and cultured to 70–80% confluence. Cells were then transfected with
24 µg of pCMV6-AC-GFP-hCBR1 or pCMV6-AC-GFP using Lipofectamine
3000 (Life Technologies, Rockville, MD, USA) for 24 h at 37°C.
Then, G418 (NACALAI TESQUE, Inc., Kyoto, Japan) was added (0.4
mg/ml) to the culture medium to select cell lines possessing the
plasmid DNA in their genome.
Immunoblot analysis
Cells were homogenized on ice in
radio-immunoprecipitation assay (RIPA) buffer (Fujifilm Wako,
Osaka, Japan) containing cOmplete Mini EDTA-free Protease Inhibitor
Cocktail Tablets provided in EASY packs (Roche, Basel,
Switzerland). Protein measurements were performed using Bio-Rad
Protein Assay Dye Reagent Concentrate (Bio-Rad Laboratories,
Hercules, CA, USA). Proteins (8 µg) were loaded into the wells of
5–20% SDS-polyacrylamide gels (Fujifilm Wako), electrophoresed, and
transferred to polyvinylidene difluoride membranes. The membranes
were blocked for 1 h at room temperature with Tris-buffered saline
(TBS) containing 0.05% Tween-20/1% skim milk or 2% bovine serum
albumin [for the anti-phospho-translation initiation factor 2
(eIF2)α blot] and then incubated overnight at 4°C with a polyclonal
rabbit anti-hCBR1 antibody (Ab) (1:1,000; ab-186825; Abcam,
Cambridge, UK), an anti-β-actin Ab (1:5,000; M177-3; MBL, Tokyo,
Japan), an anti-eIF2α Ab (1:5,000; 9722, Cell Signaling Technology,
Danvers, MA, USA), an anti-phospho-eIF2α (p-eIF2α) Ab (1:5,000;
9721, Cell Signaling Technology), and an anti-activating
transcription factor 4 (ATF4) Ab (1:1,000; ab-216839; Abcam). After
washing with TBS/0.05% Tween-20, the membranes were incubated for 1
h at room temperature with an appropriate horseradish peroxidase
(HRP)-conjugated secondary Ab [either anti-mouse IgG-HRP (NA9310V;
GE Healthcare, Pittsburgh, PA, USA) or anti-rabbit IgG-HRP
(NA9340V; GE Healthcare)]. Protein bands were detected using
enhanced chemiluminescence (Image Quant LAS4000 system; GE
Healthcare). The detected bands were quantified using Image J
(19).
Evaluation of ovarian cancer cell
proliferation
Wild-type, negative control, and
hCBR1-tGFP-overexpressing ovarian cancer cells were plated in 6 cm
dishes (1.0×10⁴ cells/dish) and cultured at 37°C for 24, 48, 72,
96, or 120 h. Cells were then washed with 1 ml of Dulbecco's
phosphate-buffered saline and detached with 0.5 g/l-Trypsin/0.53
mmol/l-EDTA Solution (NACALAI TESQUE, Inc., Kyoto, Japan). Trypan
blue solution (0.1%; NACALAI TESQUE, Inc.) was used to discriminate
living from dead cells; cells were counted using a hemocytometer
(Bio Medical Science, Tokyo, Japan). The rate of cell growth was
calculated as the slope of a linear fit created by plotting the
natural logarithm of the cell number against culture time.
LC-MS/MS
Wild-type OVCAR-3 and five lots of OVCAR-3-derived
cells overexpressing CBR1 were cultured and sampled in triplicate.
Cell lysates were prepared as described for immunoblot analysis.
Label-free whole cell proteomic analysis was performed as described
previously (20). Briefly, cell
lysates containing 20 µg of total protein, as determined by the
bicinchoninic acid (BCA) method, were denatured with acetone. The
precipitates were then denatured with 50% trifluoroethanol.
Disulfide bonds were reduced with dithiothreitol (DTT) and
alkylated with iodoacetamide followed by trypsin digestion. After
desalting and purification of the resulting peptides using MonoSpin
C18 columns (GL Sciences Inc., Tokyo, Japan), the samples were
subjected to LC-MS/MS using a nanoLC system (Eksigent 400, AB
Sciex, Framingham, MA, USA) coupled online to a mass spectrometer
(TripleTOF6600, AB Sciex). Peptide separation was performed using
LC on a nano C18 reverse-phase capillary tip column (75 µm × 125
mm, 3 µm, Nikkyo Technos CO., Tokyo, Japan) at 300 nl/min with a 90
min linear gradient of 8–30% acetonitrile in 0.1% FA, and then,
with a 10 min linear gradient of 30 to 40% acetonitrile in 0.1% FA.
The mass spectrometer was operated in information-dependent
acquisition (IDA) and data-independent acquisition (SWATH) while in
positive ion mode, scanning full spectra (400-1,500 m/z) for 250
msec, followed by up to 30 MS/MS scans (100-1,800 m/z for 50 msec
each), for a cycle time of 1.8 sec. Candidate ions with a charge
state between +2 and +5 and counts above a minimum threshold of 125
counts per second were isolated for fragmentation, and one MS/MS
spectrum was collected before adding those ions to the exclusion
list for 12 sec. For SWATH acquisition, the parameters were set as
follows: 100 msec TOF MS scan, followed by 200 variable SWATH
windows each at 50 msec accumulation time for m/z 400-1,250. MS/MS
SWATH scans were set at 5 Da window overlapping by 1 Da for m/z
400-1,250 and varied on each side of the mass range. The total
cycle time was 9.6 sec. A rolling collision energy parameters
script was used to automatically control the collision energy.
Database searching for acquired spectra was performed using
ProteinPilot 5.0.1 software (AB Sciex). The positive identification
threshold was set at a false discovery rate of 1% or less. The
resulting library file and SWATH (data independent acquisition)
files were processed by PeakView (ver. 2.2.0, AB Sciex) and
exported to MarkerView (ver. 1.3.0.1; AB Sciex). The peak area of
individual proteins was normalized relative to the sum of the peak
areas of all detected proteins.
Statistical analysis and
reproducibility
Experiments were performed in triplicate for
immunoblot analysis and evaluation of ovarian cancer cell
proliferation. Normal distribution was tested by Shapiro-Wilk test.
Statistical differences between the three groups
(hCBR1-tGFP-overexpressing, negative control, and wild-type cells)
were analyzed using one-way ANOVA followed by Tukey's test
(parametric data) or Kruskal-Wallis test (non-parametric data).
P<0.05 was considered to indicate a statistically significant
difference. All statistical analyses were performed using IBM SPSS
ver. 29.0 statistics software (IBM, Chicago, Illinois).
Regarding the statistical analysis of the proteome
data, principal component analysis using SIMCA software (version
15.0.2, Infocom Corp., Tokyo, Japan) confirmed that there was no
outlier proteome in any of the samples. Since the cell lines used
show endogenous CBR1 expression, proteins covarying with CBR1 were
subjected to Spearman's rank correlation analysis and Pearson's
correlation analysis (R version 4.1.0 software) to capture
proteomic variations due to CBR1 transfection. Proteins with
FDR-adjusted P<0.05 were identified as proteins covarying with
CBR1 and subjected to pathway enrichment and network analysis by
Ingenuity Pathway Analysis (IPA) software (Qiagen, Venlo,
Netherland).
Results
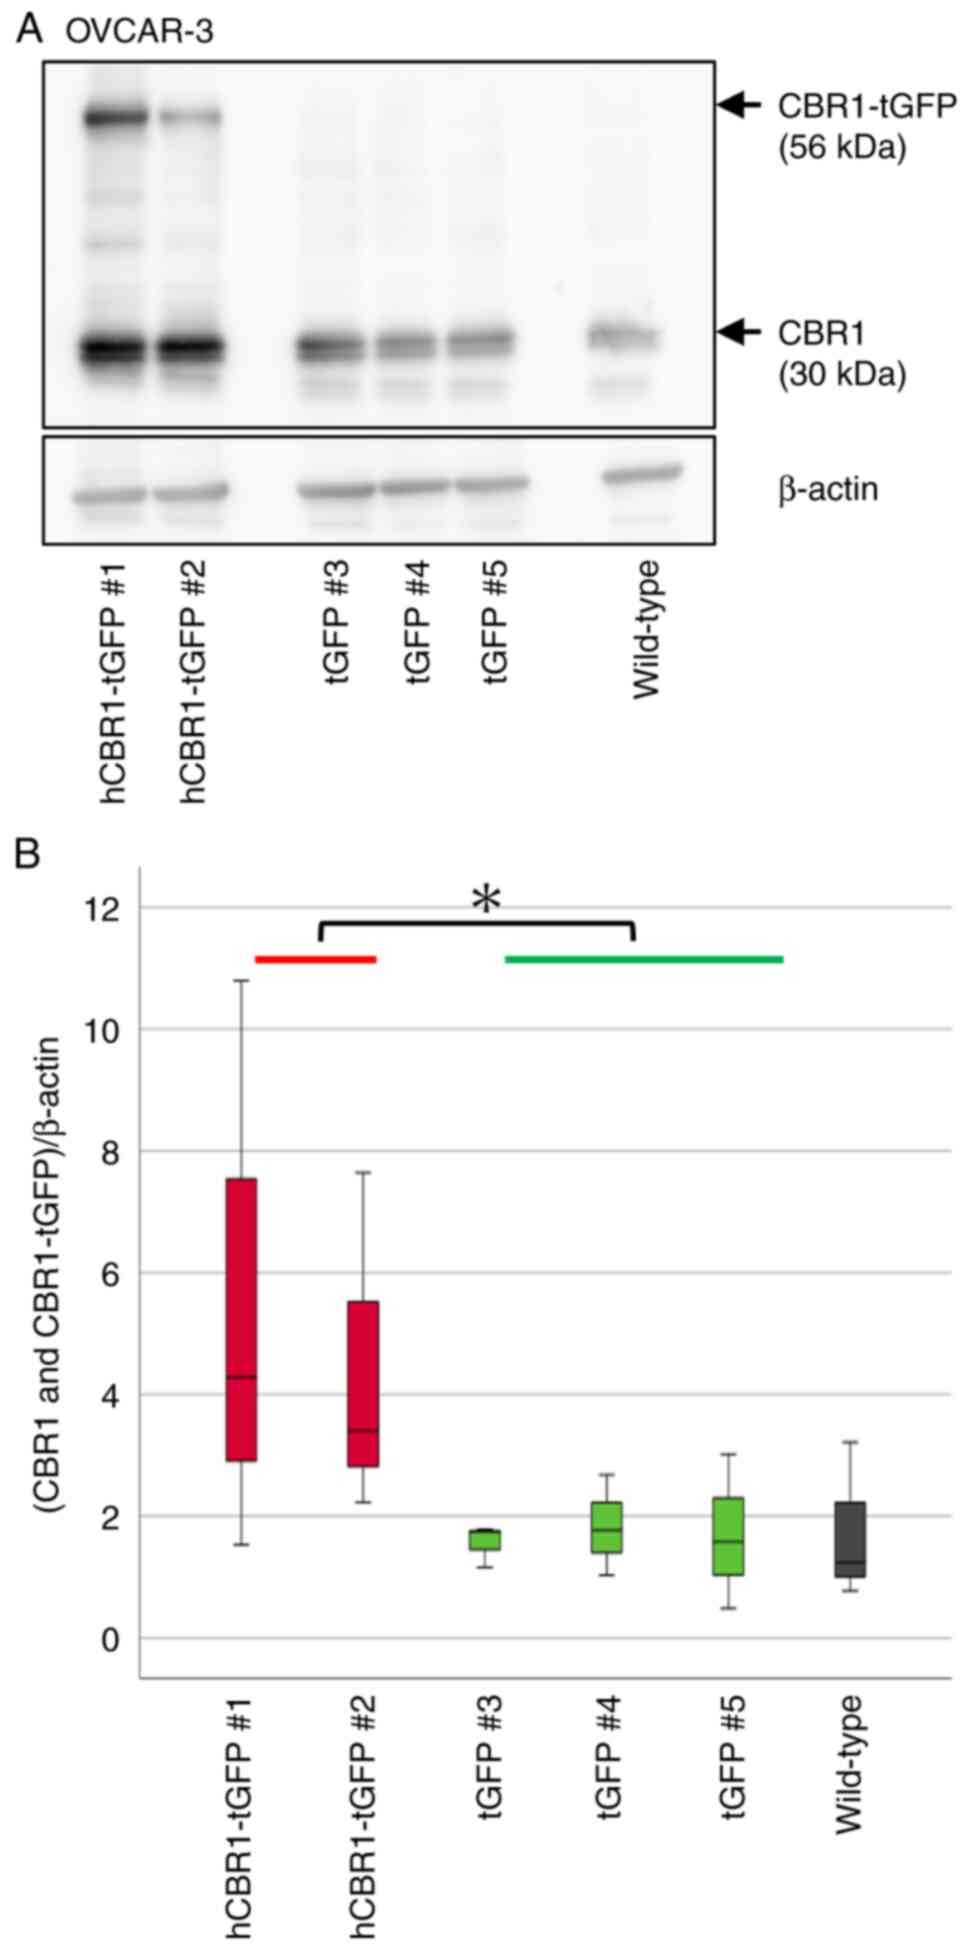
Generation of ovarian cancer cells
stably expressing hCBR1-tGFP
To investigate the role of CBR1 on the malignancy of
ovarian cancer cells, we first generated OVCAR-3 and SK-OV-3 cell
lines stably expressing hCBR1-tGFP. We also generated ovarian
cancer cells expressing only tGFP as a control (negative control
cells). Immunoblot analysis using an anti-CBR1 Ab revealed stable
expression of hCBR1-tGFP (Figs. 2A
and 3A). A band corresponding to
hCBR1-tGFP was not observed in the negative control and wild-type
cell samples. We measured CBR1 protein expression levels (i.e., the
combined expression levels of hCBR1-tGFP and CBR1) in OVCAR-3 and
SK-OV-3 cells using image analysis software (Figs. 2B and 3B). The results confirmed that expression
of CBR1 protein in hCBR1-tGFP-overexpressing OVCAR-3 cells was
significantly higher than that in wild-type and negative control
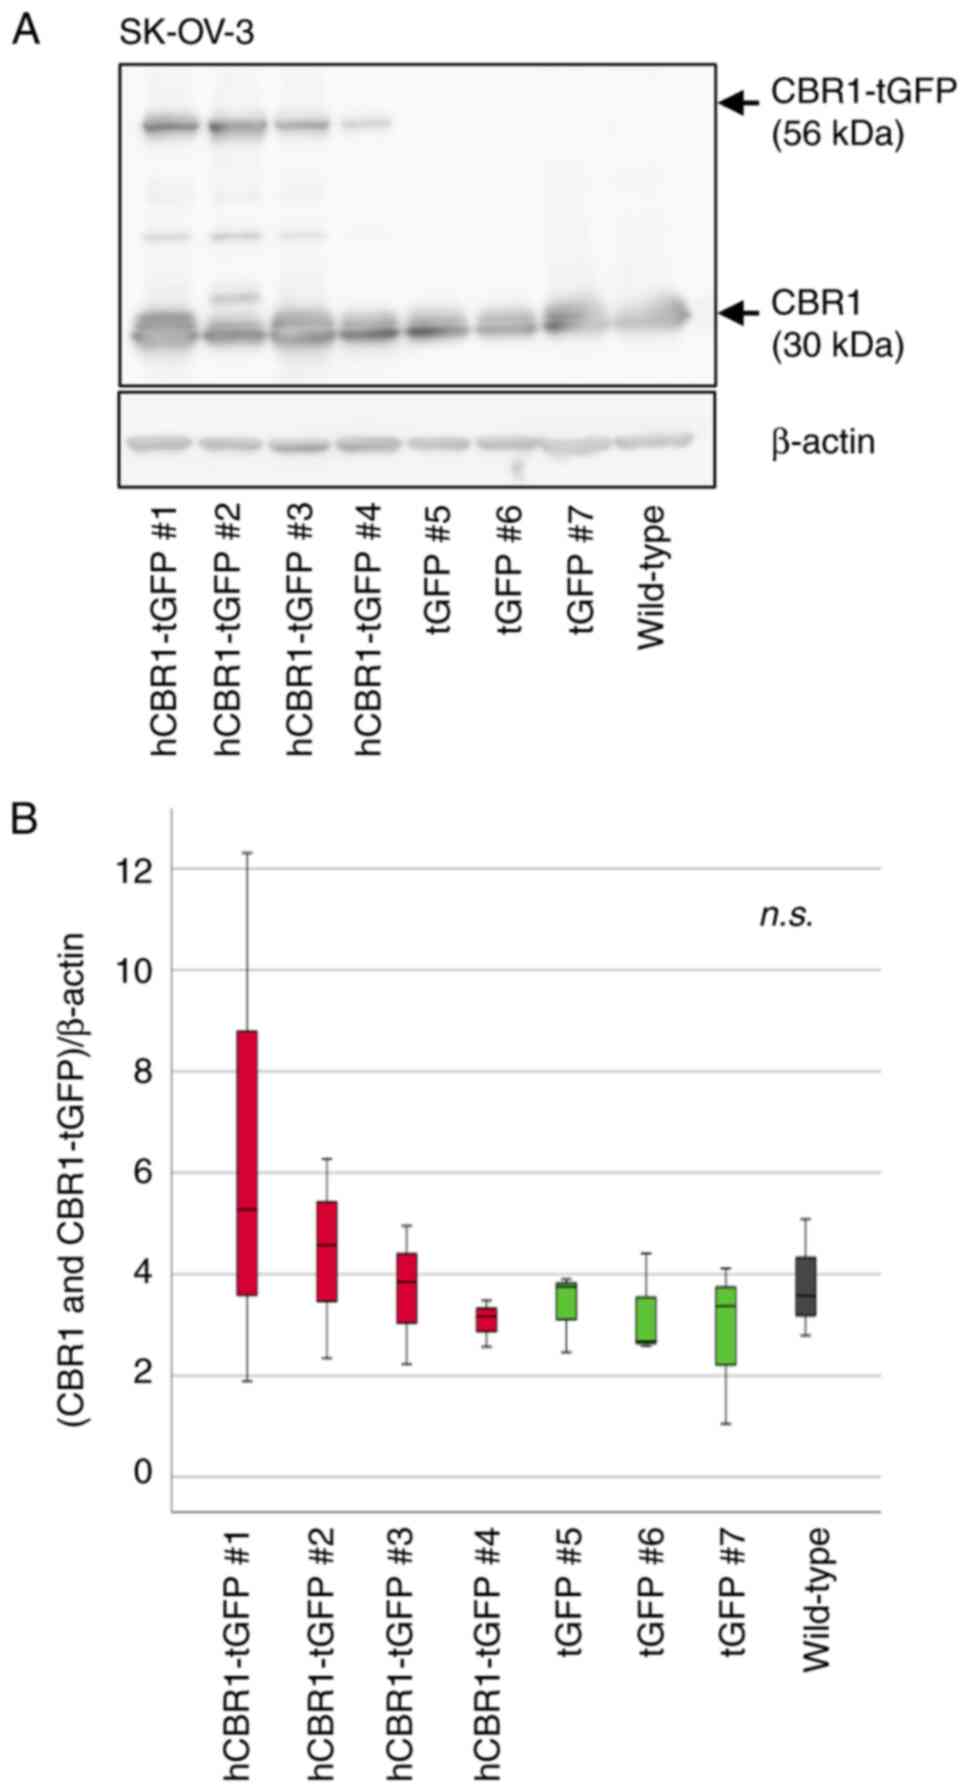
cells (Fig. 2B). As to SK-OV-3
cells, hCBR1-tGFP-overexpressing cell #1 and #2 showed the highest
and relatively high expression of CBR1 protein, respectively
(Fig. 3B). Although all
hCBR1-tGFP-overexpressing SK-OV-3 cells showed hCBR1-tGFP
expression (Fig. 3A), the
expression was slight in the cell line #4. Therefore, statistical
significance on the total CBR1 amount was not observed among cell
groups (Fig. 3B). Nevertheless,
hCBR1-tGFP was visibly expressed in the cell line #4, and the other
hCBR1-tGFP-expressing cells show a tendency of upregulation of
total hCBR1 protein. To examine the importance of the CBR1 protein
in ovarian cancer cells, these established SK-OV-3 cells were also
used for subsequent experiments.
Antiproliferative effects of CBR1
To evaluate the effect of CBR1 overexpression on
tumor cell growth, we measured proliferation of OVCAR-3 and SK-OV-3
cells expressing hCBR1-tGFP. As shown in Fig. 4A and B, growth of OVCAR-3 and
SK-OV-3 cells expressing hCBR1-tGFP was slower than that of
wild-type or negative control cells. These results suggest that
overexpression of hCBR1 strongly inhibits growth of ovarian cancer
cells, although it should be noted that overexpression of tGFP
alone moderately affected growth of SK-OV-3 cells (Fig. 4B). hCBR1-tGFP-overexpressing OVCAR-3
cells showed significant suppression of cell proliferation
(P<0.05, vs. negative control or wild-type) (Fig. 4A). hCBR1-tGFP-overexpressing SK-OV-3
cells also showed significant suppression of cell proliferation
(P<0.05, vs. negative control or wild-type, Fig. 4B). As to SK-OV-3 cells, differences
in cellular growth were also observed between wild-type and
negative control cells (P<0.05, Fig.
4B). Because tGFP is potentially cytotoxic (21), expression of tGFP may also affect
the growth of SK-OV-3 cells.
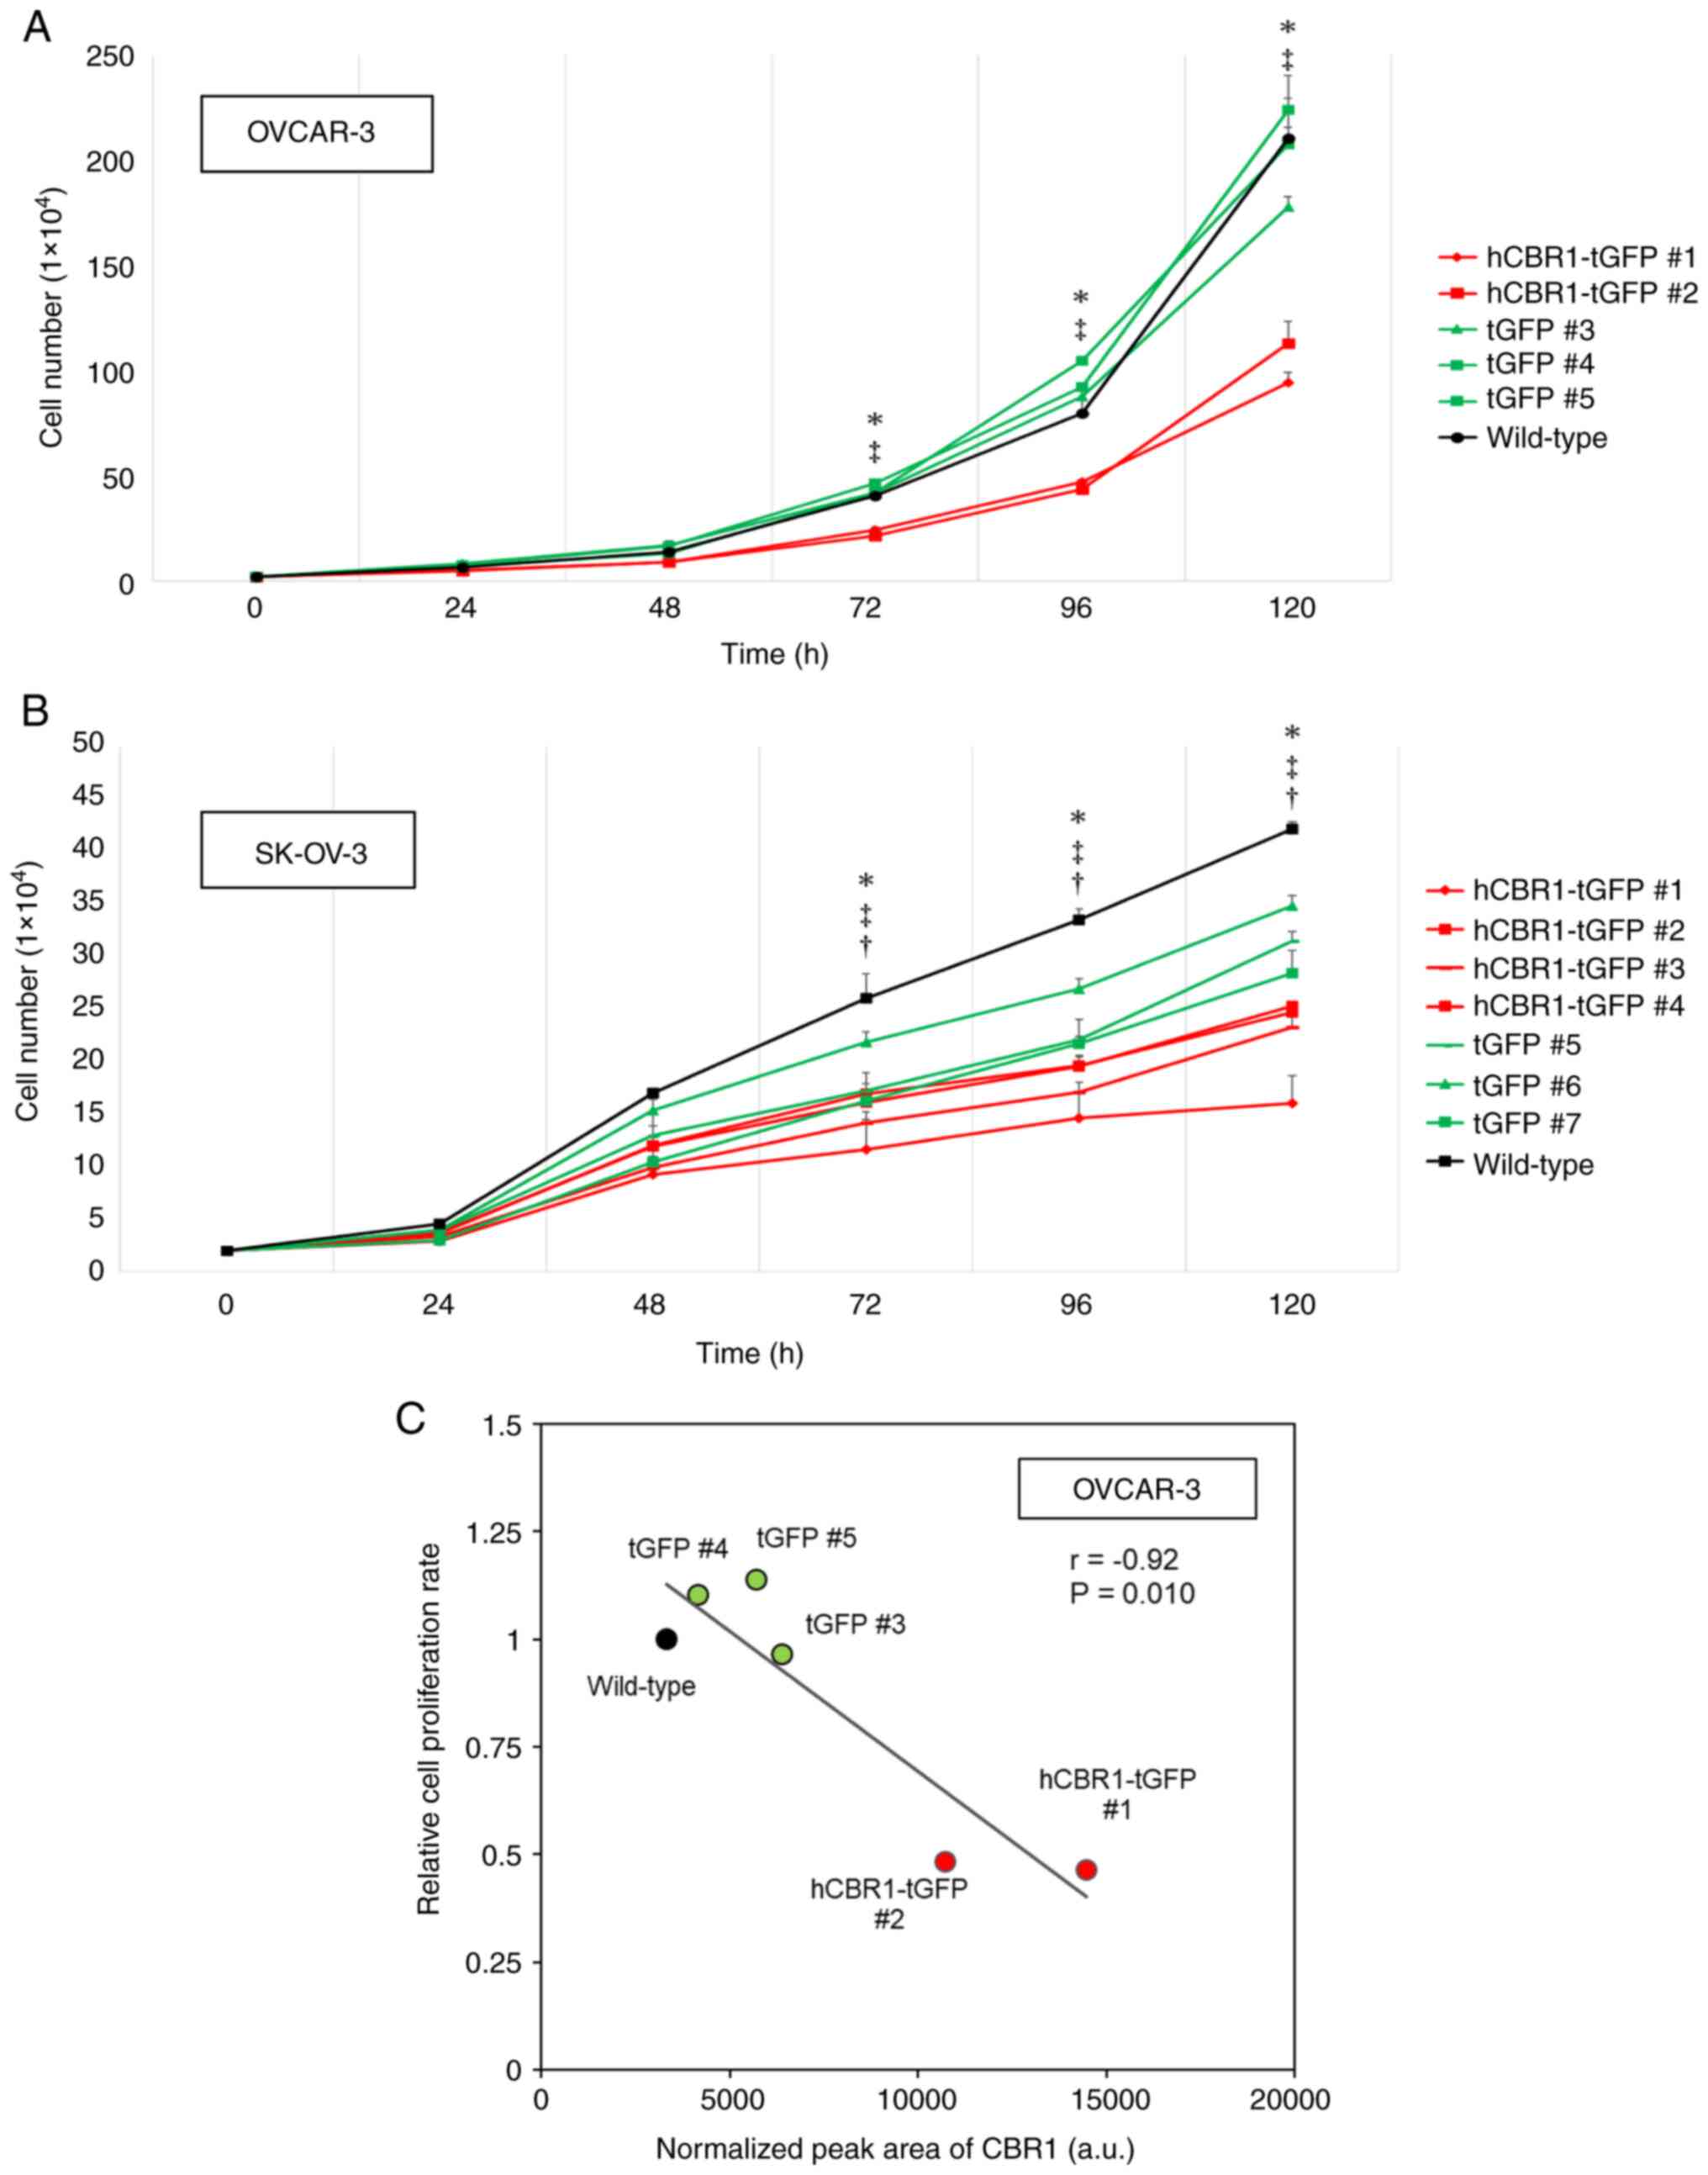 | Figure 4.Inhibitory effects of CBR1 on growth
of ovarian cancer cells. (A and B) Proliferation of
hCBR1-tGFP-overexpressing (A) OVCAR-3 and (B) SK-OV-3 cells. Cell
numbers were counted at each time point. *P<0.05, hCBR1-tGFP (#1
and #2) vs. tGFP (#3-#5) for OVCAR-3, or hCBR1-tGFP (#1-#4) vs.
tGFP (#5-#7) for SK-OV-3, ‡P<0.05, hCBR1-tGFP (#1 and #2) vs.
Wild-type for OVCAR-3, or hCBR1-tGFP (#1-#4) vs. Wild-type for
SK-OV-3, †P<0.05, tGFP (#5-#7) vs. Wild-type. (C) Correlation
between the normalized peak area of CBR1 measured in proteome
analysis and cell proliferation rate relative to wild-type. The X
and Y axes depict arbitrary values. The semi-quantitative amount of
CBR1 is shown as the sum of endogenous CBR1 expression and
exogenous hCBR1-tGFP expression. Cell proliferation rate was
represented as the number of cells increased per hour relative to
wild-type. a.u., arbitrary unit. CBR1, carbonyl reductase 1; hCBR1,
human CBR1; tGFP, turbo green fluorescent protein. |
In hCBR1-tGFP-overexpressing OVCAR-3, we confirmed
an inverse correlation between hCBR1 overexpression and cell
proliferation (Fig. 4C). In the
hCBR1-tGFP-overexpressing lines (#1, #2), CBR1 expression levels
were high, and the cell proliferation rate was reduced. By
contrast, negative control cells (#3-#5) and wild-type cells
expressed low levels of CBR1 and showed higher proliferation rates.
In these experiments, CBR1 expression is the sum of endogenous CBR1
and exogenous hCBR1-tGFP, and the higher levels of CBR1 protein in
hCBR1-tGFP-overexpressing lines are consistent with the results
shown in Fig. 1B. Thus, these
results support the above data showing that
hCBR1-tGFP-overexpressing lines grow more slowly than negative
control and wild-type cells (Fig.
4A). Previously, we showed that transient expression of CBR1 in
a xenograft mouse model may induce apoptosis through activation of
caspase pathways (6). Thus, stable
overexpression of hCBR1-tGFP may induce apoptosis in OVCAR-3 and
SK-OV-3 cells.
Altered intracellular signaling in
hCBR1-tGFP-overexpressing cancer cell lines
To elucidate the CBR1-mediated molecular mechanism
underlying growth inhibition, we performed LC-MS/MS of OVCAR-3 cell
lysates, followed by IPA. Whole cell proteomics analysis using a
label-free quantification method plus MS resulted in quantification
of 939 proteins, with no samples showing outliers upon principal
component analysis (Fig. S1). Of
these, the abundance of 155 proteins correlated significantly with
expression of hCBR1 (FDR-adjusted P-value <0.05, Spearman's rank
correlation, Fig. S2). We then
performed IPA to identify enriched canonical pathways associated
with hCBR1-correlated proteins; the top 20 pathways are shown in
Table I. Expression of proteins
involved in various signaling pathways, whose role in controlling
tumor progression is suggested, correlated with expression of
hCBR1. Among these, the eIF2 signaling pathway was the most
enriched.
 | Table I.Top 20 signaling pathways affected by
overexpression of CBR1 in OVCAR-3 cells. |
Table I.
Top 20 signaling pathways affected by
overexpression of CBR1 in OVCAR-3 cells.
| Ingenuity canonical
pathway | -log (P-value) | Ratio |
|---|
| eIF2 signaling | 20.3 | 0.103 |
| mTOR signaling | 6.77 | 0.052 |
| Regulation of eIF4
and p70S6K signaling | 6.50 | 0.056 |
| Coronavirus
pathogenesis pathway | 5.08 | 0.044 |
| Mitochondrial
dysfunction | 4.74 | 0.047 |
| CSDE1 signaling
pathway | 4.47 | 0.089 |
| Spliceosomal
cycle | 3.52 | 0.082 |
| Pentose phosphate
pathway (Oxidative Branch) | 3.37 | 0.400 |
| FAT10 signaling
pathway | 3.29 | 0.071 |
| Gluconeogenesis
I | 3.19 | 0.115 |
| Leukocyte
extravasation signaling | 2.75 | 0.031 |
| tRNA charging | 2.67 | 0.077 |
| Pentose phosphate
pathway | 2.64 | 0.182 |
| BAG2 signaling
pathway | 2.64 | 0.048 |
| Sirtuin signaling
pathway | 2.49 | 0.024 |
| VEGF signaling | 2.38 | 0.040 |
| Inhibition of
ARE-mediated mRNA degradation pathway | 2.37 | 0.031 |
| Virus entry via
endocytic pathways | 2.30 | 0.039 |
| Germ cell-sertoli
cell junction signaling | 2.26 | 0.029 |
| Oxidative
phosphorylation | 2.20 | 0.036 |
The z-score for the eIF2 signaling pathway, as
calculated by IPA, was +1.387. The z-score indicates whether the
detected signal is biased toward activation or inactivation, with
positive values indicating activation and negative values
indicating inactivation (Fig. S3).
Table I shows that eIF2 signaling
is highly affected by overexpression of hCBR1. Proteins associated
with eIF2 signaling are listed in Table II. Of the 23 proteins associated
with eIF2 signaling, 17 had positive correlation coefficients.
| Table II.Proteins associated with eIF2
signaling. |
Table II.
Proteins associated with eIF2
signaling.
| Gene symbol | UniProt ID | Protein name | Correlation
coefficient | -log10
(P-value) |
|---|
| EIF1AX | Q8BMJ3 | Eukaryotic
translation initiation factor 1A | 0.344 | 1.8 |
| EIF3F | Q9DCH4 | Eukaryotic
translation initiation factor 3 subunit F | 0.414 | 2.5 |
| PTBP1 | P17225 | Polypyrimidine
tract-binding protein 1 | −0.349 | 1.8 |
| RPL10 | Q6ZWV3 | 60S ribosomal
protein L10 | 0.399 | 2.3 |
| RPL11 | Q9CXW4 | 60S ribosomal
protein L11 | 0.404 | 2.4 |
| RPL13 | P47963 | 60S ribosomal
protein L13 | 0.328 | 1.6 |
| RPL14 | Q9CR57 | 60S ribosomal
protein L14 | −0.291 | 1.3 |
| RPL18A | P62717 | 60S ribosomal
protein L18a | 0.340 | 1.7 |
| RPL23 | P62830 | 60S ribosomal
protein L23 | 0.392 | 2.2 |
| RPL23A | P62751 | 60S ribosomal
protein L23a | 0.286 | 1.3 |
| RPL24 | Q8BP67 | 60S ribosomal
protein L24 | 0.418 | 2.5 |
| RPL27A | P14115 | 60S ribosomal
protein L27a | 0.337 | 1.7 |
| RPL31 | P62900 | 60S ribosomal
protein L31 | −0.315 | 1.5 |
| RPL34 | Q9D1R9 | 60S ribosomal
protein L34 | 0.497 | 3.5 |
| RPL7A | P12970 | 60S ribosomal
protein L7a | −0.465 | 3.1 |
| RPS10 | P63325 | 40S ribosomal
protein S10 | 0.320 | 1.6 |
| RPS12 | P63323 | 40S ribosomal
protein S12 | 0.422 | 2.6 |
| RPS15 | P62843 | 40S ribosomal
protein S15 | 0.324 | 1.6 |
| RPS15A | P62245 | 40S ribosomal
protein S15a | 0.285 | 1.3 |
| RPS25 | P62852 | 40S ribosomal
protein S25 | 0.333 | 1.7 |
| RPS29 | P62274 | 40S ribosomal
protein S29 | 0.392 | 2.2 |
| RPS9 | Q6ZWN5 | 40S ribosomal
protein S9 | −0.341 | 1.8 |
| RRAS2 | P62071 | Ras-related protein
R-Ras2 | −0.299 | 1.4 |
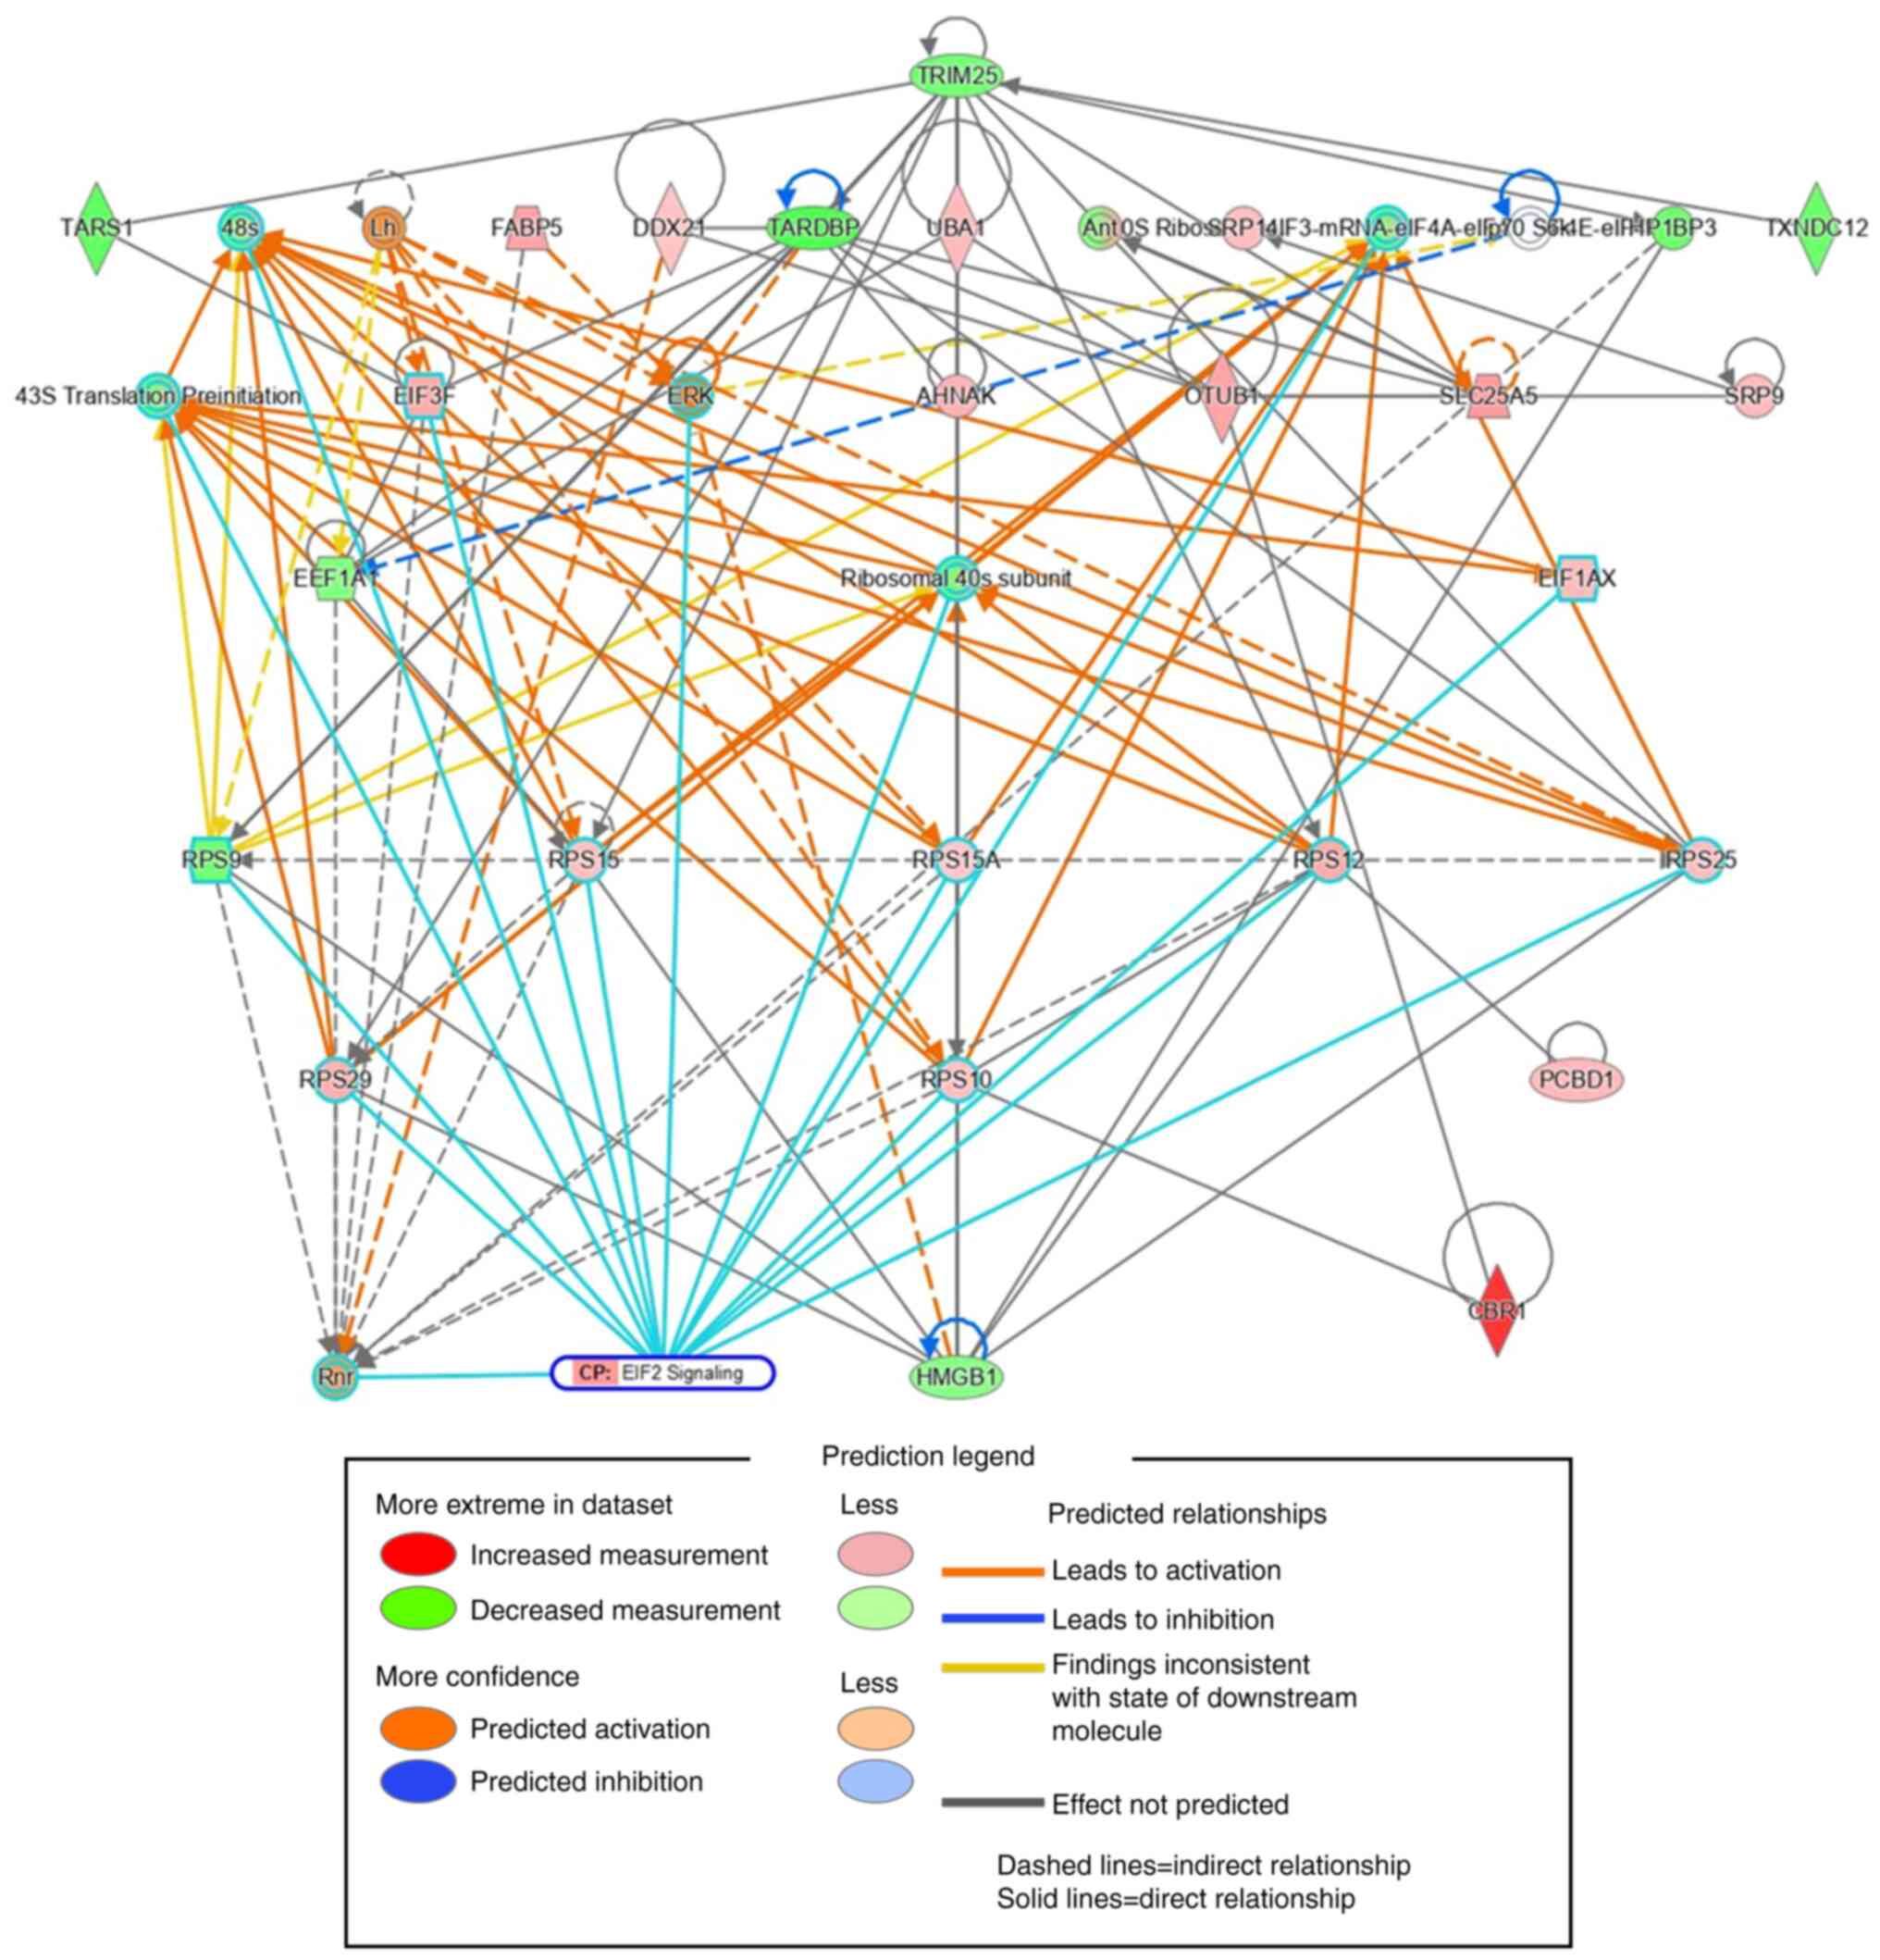
We also used IPA to perform a protein-protein
interaction network analysis of hCBR1-correlated proteins. The top
35 out of the 155 proteins whose expression correlated with that of
CBR1 were extracted in the order of interaction network robustness
and presented as a subnetwork (Fig.
5). Among the 35 proteins, 15 formed a subnetwork related to
eIF2 signaling, as shown by the cyan borders. These results suggest
that the eIF2 signaling pathway may be involved in suppressing cell
growth.
eIF2 phosphorylation status in OVCAR-3
cells stably expressing hCBR1-tGFP
Next, we investigated whether the eIF2 signaling
pathway is actually altered by overexpression of hCBR1-tGFP.
Considering the magnitude of changes in eIF2 signaling, and the
critical importance of phosphorylation status of eIF2 during
regulation of the pathway (Fig. 6A,
see also the Discussion section) (22), we performed immunoblot analysis to
examine phosphorylation of eIF2α, a subunit of eIF2. A clear band
corresponding to p-eIF2α was observed in lysates prepared from
hCBR1-tGFP-expressing cells (#1, #2) (Fig. 6B-a), confirming that overexpression
of hCBR1 induces phosphorylation of eIF2α. Expression and
phosphorylation of eIF2α protein in OVCAR-3 cells were quantified
using image analysis software. The results confirmed that the
phosphorylation levels of eIF2α in hCBR1-tGFP-overexpressing cells
were higher than those in wild-type and negative control cells
(Fig. 6B-b).
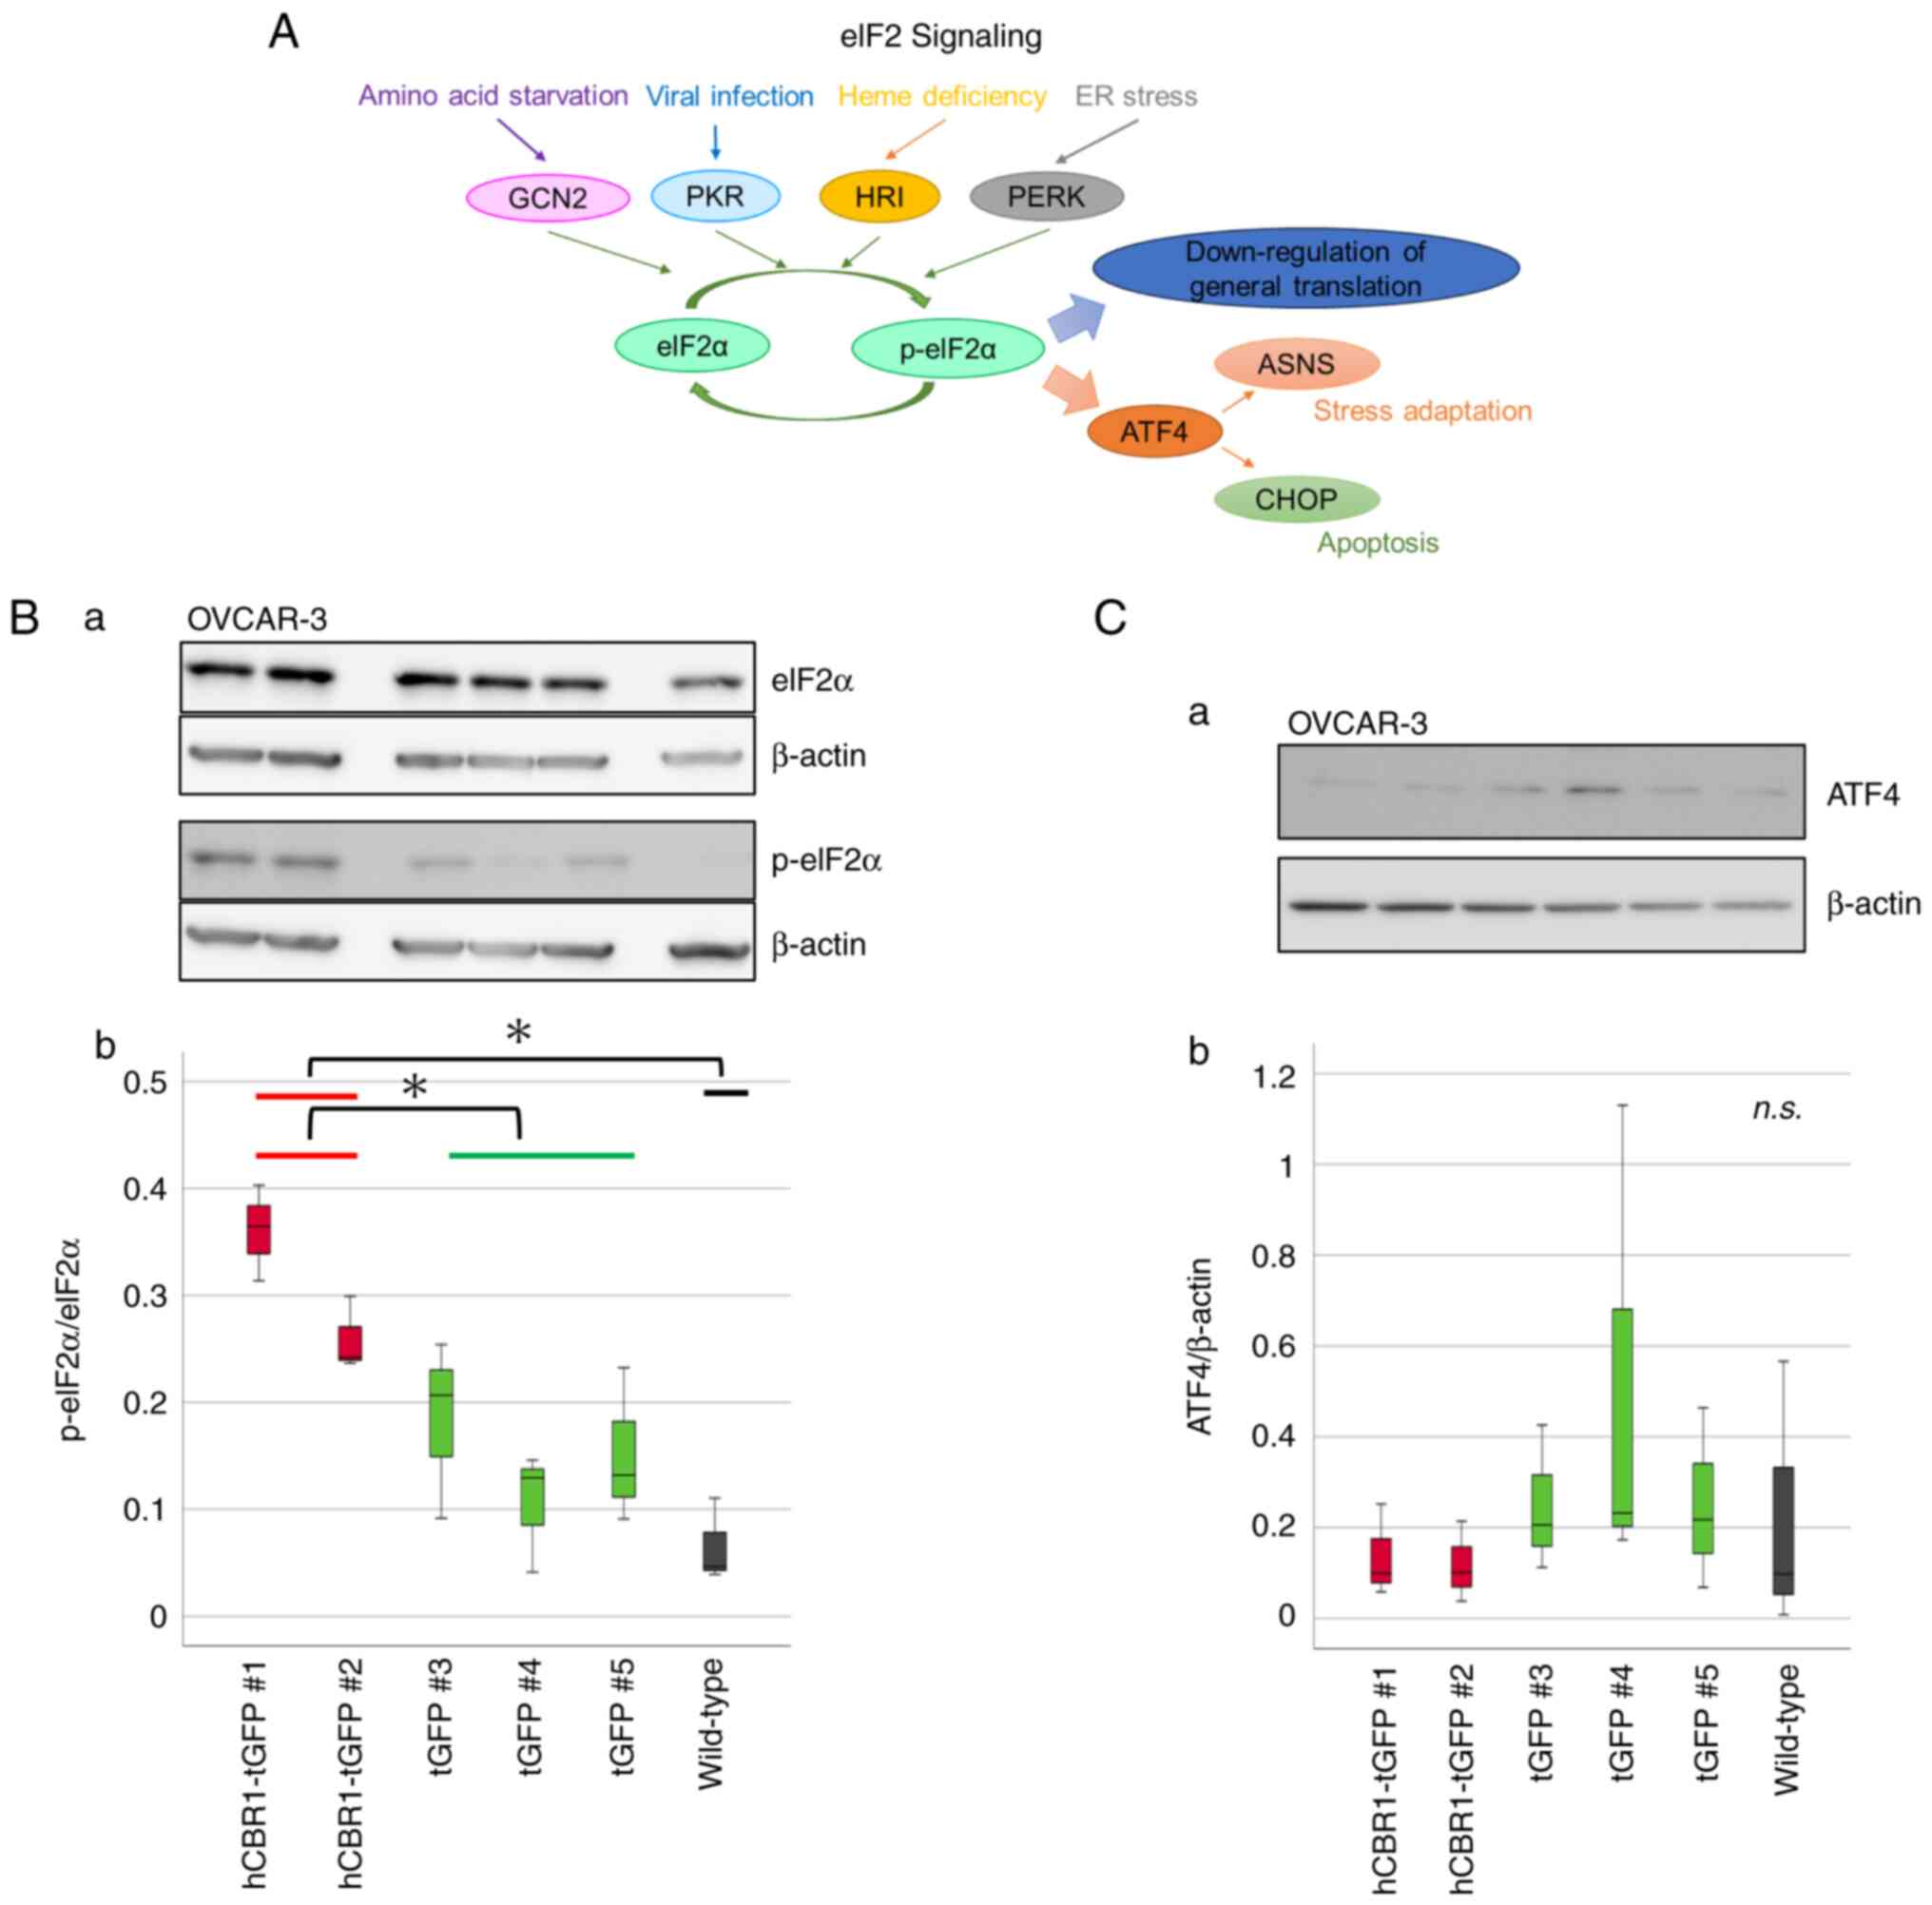 | Figure 6.The eIF2 signaling pathway and
phosphorylation of eIF2α in hCBR1-tGFP-overexpressing OVCAR-3
cells. (A) Schematic diagram of the eIF2 signaling pathway. Four
kinases of eIF2α have been identified in humans: GCN2, PKR, HRI,
and PERK. Phosphorylation of eIF2α leads to apoptosis and autophagy
via ASNS or CHOP. (B-a) Immunoblot analysis to detect
phosphorylation of the eIF2α protein. (B-b) The detected bands were
quantified using ImageJ. The ratio of the band intensity (i.e.,
p-eIF2α: eIF2α) is shown. *P<0.05. (C-a) Immunoblot analysis of
ATF-4 protein expression. (C-b) The ratio of the band intensity
(i.e., ATF-4: β-actin) is shown. n.s., not significant. Each
antibody reaction was performed on each membrane. eIF2, eukaryotic
translation initiation factor 2; hCBR1, human carbonyl reductase 1;
tGFP, turbo green fluorescent protein; GCN2, general control
nonderepressible-2; PKR, protein kinase R; HRI, heme-regulated
inhibitor; PERK, protein kinase RNA-like endoplasmic reticulum
kinase; ASNS, aspartate synthetase; CHOP, C/EBP homologous protein;
p-eIF2, phosphorylated-eIF2; ATF-4, activating transcription factor
4. |
Phosphorylation of eIF2α downregulates general
translation and upregulates expression of ATF4 (Fig. 6A) (22). Although we examined involvement of
ATF4 downstream of eIF2α, we found that expression of ATF4 was not
upregulated in hCBR1-tGFP-expressing cells (Fig. 6C). Therefore, overexpression of
hCBR1 may induce downregulation of general translation via
phosphorylation of eIF2α.
Discussion
In this study, we generated ovarian cancer cells
stably expressing hCBR1-tGFP. Proliferation of
hCBR1-tGFP-overexpressing cells was slower than that of negative
control and wild-type cells. To elucidate the mechanism of cell
growth suppression by CBR1 overexpression, we used proteomics
together with IPA. The results showed marked differences in the
expression of proteins involved in eIF2 signaling in
hCBR1-tGFP-overexpressing cells. Concordantly, constitutive
phosphorylation of eIF2α, which plays a critical role in eIF2
signaling, suggests that CBR1 regulates cell growth via the eIF2
signaling pathway.
Generally, it is accepted that protein synthesis
drives the cell cycle (23). The
relationship between regulation of protein synthesis and cancer
cell growth has attracted considerable attention because regulation
of mRNA translation is a convergence point for many oncogenic
signals (24). The eIF2 signaling
pathway plays a central role in regulating general translation in
response to stress. eIF2 comprises three subunits: α, β, and γ.
GTP-bound eIF2 interacts with the initiating methionyl-tRNA
(ternary complex, TC) and transports it to the 40S ribosome
(25). The elF2 translation
initiation complex integrates a variety of stress-related signals
to downregulate general translation, but it upregulates translation
of specific mRNAs such as that encoding ATF4 (26). In this regard, because we did not
show upregulation of ATF4 protein, it may be that overexpression of
CBR1 downregulates general translation.
Phosphorylation of eIF2α is induced by a diverse
family of four stress-activated kinases: protein kinase R (PKR)
[induced by dsRNA], protein kinase RNA-like endoplasmic reticulum
kinase (PERK) [induced by endoplasmic reticulum (ER) stress],
general control nonderepressible-2 (GCN2) [induced by amino acid
starvation], and heme-regulated inhibitor (HRI) [induced by heme
deficiency] (Fig. 6A). As a
limitation of this study, we could not confirm how CBR1 induces
phosphorylation of eIF2α. Therefore, it would be interesting to
examine this issue in future. We examined only one downstream eIF2α
pathway-related molecule (ATF4) in this study. Therefore, we would
like to examine the other downstream molecules and related
physiological changes, including oxidative stress-induced reactive
oxygen species generation, in a future study. On the other hand, in
addition to OVCAR-3, hCBR1-tGFP-overexpressing SK-OV-3 cells were
established in this study. Although all hCBR1-tGFP-overexpressing
cells showed hCBR1-tGFP expression, statistical significance was
not achieved as a group, which may also be a limitation of this
study.
Initiation of protein synthesis is regulated by two
rate-limiting steps: assembly of eukaryotic translation initiation
factor 4F (eIF4F) and formation of the TC. Assembly of eIF4F is
promoted by mechanistic target of rapamycin (mTOR) signaling
(27). It is interesting to note
that IPA revealed that within the proteome of
hCBR1-tGFP-overexpressing cells, factors involved in mTOR signaling
were among those whose levels changed (Table I), although it is unclear whether
mTOR signaling fluctuates upwards or downwards (Fig. S3). Since the eIF2 signaling pathway
and mTOR signaling are exquisitely coordinated to provide a robust
response to cellular stress (28–30),
overexpression of CBR1 may affect both pathways to suppress growth
of ovarian cancer cells.
In this study, we demonstrated regulation of the
eIF2 signaling pathway by CBR1. Although further studies are
needed, our data suggest a new therapeutic strategy for ovarian
cancer based on targeting CBR1 and related signaling cascades. This
could be achieved by developing molecularly targeted drugs directed
at components of the eIF2 signaling pathway, as well as CBR1
itself. In addition, CBR1 may be a potential biomarker of medical
prognosis.
Supplementary Material
Supporting Data
Acknowledgements
The authors would like to thank Dr Hodaka Fujii
(Hirosaki University Graduate School of Medicine), for helpful
discussion and critical reading of the manuscript. They also would
like to thank Ms. Miyu Miyazaki (Center for Scientific Equipment
Management, Hirosaki University Graduate School of Medicine), for
technical support with mass spectrometry.
Funding
This work was supported by a JSPS KAKENHI grant (grant no.
20K09589, to YY).
Availability of data and materials
The proteomics data generated in the present study
may be found in the Proteome Xchange and jPOST Repositor databases
under accession numbers PXD039299 and JPST001979, respectively or
at the following URLs: https://proteomecentral.proteomexchange.org/cgi/GetDataset?ID=PXD039299
and https://repository.jpostdb.org/entry/JPST001979.2. The
other data generated in the present study may be requested from the
corresponding author.
Authors' contributions
YK, MY and YY conceived the project. TF and YY
designed and supervised the project. YT performed LC-MS/MS
analysis. YK and MY performed the other experiments. YK, MY, TF and
YY wrote the manuscript. YK and MY confirm the authenticity of all
the raw data. All authors read and approved the final version of
the manuscript.
Ethics approval and consent to
participate
Not applicable.
Patient consent for publication
Not applicable.
Competing interests
The authors declare that they have no competing
interests.
Glossary
Abbreviations
Abbreviations:
|
CBR1
|
carbonyl reductase 1
|
|
hCBR1
|
human CBR1
|
|
eIF
|
eukaryotic translation initiation
factor
|
|
tGFP
|
turbo green fluorescent protein
|
|
LC-MS/MS
|
liquid chromatography followed by mass
spectrometry
|
|
p-eIF2
|
phosphorylated-eIF2
|
|
HRP
|
horseradish peroxidase
|
|
IPA
|
Ingenuity Pathway Analysis
|
|
TC
|
ternary complex
|
|
PKR
|
protein kinase R
|
|
PERK
|
protein kinase RNA-like endoplasmic
reticulum kinase
|
|
GCN2
|
general control nonderepressible-2
|
|
HRI
|
heme-regulated inhibitor
|
|
ATF4
|
activating transcription factor 4
|
|
mTOR
|
mechanistic target of rapamycin
|
|
Ab
|
antibody
|
References
|
1
|
Mindnich RD and Penning TM: Aldo-keto
reductase (AKR) superfamily: Genomics and annotation. Hum Genomics.
3:362–370. 2009. View Article : Google Scholar : PubMed/NCBI
|
|
2
|
Fagerberg L, Hallström BM, Oksvold P,
Kampf C, Djureinovic D, Odeberg J, Habuka M, Tahmasebpoor S,
Danielsson A, Edlund K, et al: Analysis of the human
tissue-specific expression by genome-wide integration of
transcriptomics and antibody-based proteomics. Mol Cell Proteomics.
13:397–406. 2014. View Article : Google Scholar : PubMed/NCBI
|
|
3
|
Wermuth B, Bohren KM, Heinemann G, von
Wartburg JP and Gabbay KH: Human carbonyl reductase. Nucleotide
sequence analysis of a cDNA and amino acid sequence of the encoded
protein. J Biol Chem. 263:16185–16188. 1988. View Article : Google Scholar : PubMed/NCBI
|
|
4
|
Umemoto M, Yokoyama Y, Sato S, Tsuchida S,
Al-Mulla F and Saito Y: Carbonyl reductase as a significant
predictor of survival and lymph node metastasis in epithelial
ovarian cancer. Br J Cancer. 85:1032–1036. 2001. View Article : Google Scholar : PubMed/NCBI
|
|
5
|
Osawa Y, Yokoyama Y, Shigeto T, Futagami M
and Mizunuma H: Decreased expression of carbonyl reductase 1
promotes ovarian cancer growth and proliferation. Int J Oncol.
46:1252–1258. 2015. View Article : Google Scholar : PubMed/NCBI
|
|
6
|
Miura R, Yokoyama Y, Shigeto T, Futagami M
and Mizunuma H: Inhibitory effect of carbonyl reductase 1 on
ovarian cancer growth via tumor necrosis factor receptor signaling.
Int J Oncol. 47:2173–2180. 2015. View Article : Google Scholar : PubMed/NCBI
|
|
7
|
Nishimoto Y, Murakami A, Sato S, Kajimura
T, Nakashima K, Yakabe K, Sueoka K and Sugino N: Decreased carbonyl
reductase 1 expression promotes tumor growth via epithelial
mesenchymal transition in uterine cervical squamous cell
carcinomas. Reprod Med Biol. 17:173–181. 2018. View Article : Google Scholar : PubMed/NCBI
|
|
8
|
Kajimura T, Sato S, Murakami A,
Hayashi-Okada M, Nakashima K, Sueoka K and Sugino N: Overexpression
of carbonyl reductase 1 inhibits malignant behaviors and epithelial
mesenchymal transition by suppressing TGF-β signaling in uterine
leiomyosarcoma cells. Oncol Lett. 18:1503–1512. 2019.PubMed/NCBI
|
|
9
|
Takenaka K, Ogawa E, Oyanagi H, Wada H and
Tanaka F: Carbonyl reductase expression and its clinical
significance in non-small-cell lung cancer. Cancer Epidemiol
Biomarkers Prev. 14:1972–1975. 2005. View Article : Google Scholar : PubMed/NCBI
|
|
10
|
Graves PR and Haystead TA: Molecular
biologist's guide to proteomics. Microbiol Mol Biol Rev. 66:39–63.
2002. View Article : Google Scholar : PubMed/NCBI
|
|
11
|
Chandramouli K and Qian PY: Proteomics:
Challenges, techniques and possibilities to overcome biological
sample complexity. Hum Genomics Proteomics. 8:2392042009.PubMed/NCBI
|
|
12
|
Wang D, Eraslan B, Wieland T, Hallström B,
Hopf T, Zolg DP, Zecha J, Asplund A, Li LH, Meng C, et al: A deep
proteome and transcriptome abundance atlas of 29 healthy human
tissues. Mol Syst Biol. 15:e85032019. View Article : Google Scholar : PubMed/NCBI
|
|
13
|
Martínez-Rodríguez F, Limones-González JE,
Mendoza-Almanza B, Esparza-Ibarra EL, Gallegos-Flores PI,
Ayala-Luján JL, Godina-González S, Salinas E and Mendoza-Almanza G:
Understanding cervical cancer through proteomics. Cells.
10:18542021. View Article : Google Scholar : PubMed/NCBI
|
|
14
|
Shigeto T, Yokoyama Y, Xin B and Mizunuma
H: Peroxisome proliferator-activated receptor α and γ ligands
inhibit the growth of human ovarian cancer. Oncol Rep. 18:833–840.
2007.PubMed/NCBI
|
|
15
|
Wakui M, Yokoyama Y, Wang H, Shigeto T,
Futagami M and Mizunuma H: Efficacy of a methyl ester of
5-aminolevulinic acid in photodynamic therapy for ovarian cancers.
J Cancer Res Clin Oncol. 136:1143–1150. 2010. View Article : Google Scholar : PubMed/NCBI
|
|
16
|
Cebulla J, Huuse EM, Pettersen K, van der
Veen A, Kim E, Andersen S, Prestvik WS, Bofin AM, Pathak AP,
Bjørkøy G, et al: MRI reveals the in vivo cellular and vascular
response to BEZ235 in ovarian cancer xenografts with different
PI3-kinase pathway activity. Br J Cancer. 112:504–513. 2015.
View Article : Google Scholar : PubMed/NCBI
|
|
17
|
Zalewski M, Kulbacka J, Saczko J,
Drag-Zalesinska M and Choromanska A: Valspodar-modulated
chemotherapy in human ovarian cancer cells SK-OV-3 and MDAH-2774.
Bosn J Basic Med Sci. 19:234–241. 2019.PubMed/NCBI
|
|
18
|
Lu T, Tang J, Shrestha B, Heath BR, Hong
L, Lei YL, Ljungman M and Neamati N: Up-regulation of
hypoxia-inducible factor antisense as a novel approach to treat
ovarian cancer. Theranostics. 10:6959–6976. 2020. View Article : Google Scholar : PubMed/NCBI
|
|
19
|
Ohgane K and Yoshioka H: Quantification of
gel bands by an image J Macro, Band/Peak Quantification Tool v1.
Protocols.io. 2019.doi:/10.17504/protocols.io.7vghn3w.
|
|
20
|
Yokoyama M, Fujita T, Kadonosawa Y, Tatara
Y, Motooka D, Ikawa M, Fujii H and Yokoayama Y: Development of
transgenic mice overexpressing mouse carbonyl reductase 1. Mol Biol
Rep. 50:531–540. 2023. View Article : Google Scholar : PubMed/NCBI
|
|
21
|
Costantini LM, Fossati M, Francolini M and
Snapp EL: Assessing the tendency of fluorescent proteins to
oligomerize under physiologic conditions. Traffic. 13:643–649.
2013. View Article : Google Scholar
|
|
22
|
Boye E and Grallert B: eIF2α
phosphorylation and the regulation of translation. Curr Genet.
66:293–297. 2020. View Article : Google Scholar : PubMed/NCBI
|
|
23
|
Johnston GC, Pringle JR and Hartwell LH:
Coordination of growth with cell division in the yeast
Saccharomyces cerevisiae. Exp Cell Res. 105:79–98. 1977. View Article : Google Scholar : PubMed/NCBI
|
|
24
|
Kovalski JR, Kuzuoglu-Ozturk D and Ruggero
D: Protein synthesis control in cancer: selectivity and therapeutic
targeting. EMBO J. 41:e1098232022. View Article : Google Scholar : PubMed/NCBI
|
|
25
|
Clemens MJ and Bommer UA: Translational
control: The cancer connection. Int J Biochem Cell Biol. 31:1–23.
1999. View Article : Google Scholar : PubMed/NCBI
|
|
26
|
Hinnebusch AG: Molecular mechanism of
scanning and start codon selection in eukaryotes. Microbiol Mol
Biol Rev. 75:434–467. 2011. View Article : Google Scholar : PubMed/NCBI
|
|
27
|
Harris AL: Hypoxia-a key regulatory factor
in tumour growth. Nat Rev Cancer. 2:38–47. 2002. View Article : Google Scholar : PubMed/NCBI
|
|
28
|
Hinnebusch AG: The scanning mechanism of
eukaryotic translation initiation. Annu Rev Biochem. 83:779–812.
2014. View Article : Google Scholar : PubMed/NCBI
|
|
29
|
Gandin V, Masvidal L, Cargnello M, Gyenis
L, McLaughlan S, Cai Y, Tenkerian C, Morita M, Balanathan P,
Jean-Jean O, et al: mTORC1 and CK2 coordinate ternary and eIF4F
complex assembly. Nat Commun. 7:111272016. View Article : Google Scholar : PubMed/NCBI
|
|
30
|
Wengrod J, Wang D, Weiss S, Zhong H, Osman
I and Gardner LB: Phosphorylation of eIF2α triggered by mTORC1
inhibition and PP6C activation is required for autophagy and is
aberrant in PP6C-mutated melanoma. Sci Signal. 8:ra272015.
View Article : Google Scholar : PubMed/NCBI
|