Introduction
Colorectal cancer (CRC) is a prevalent malignant
tumor that ranks as the third most frequently diagnosed malignant
tumor globally, according to statistical data (1). Despite advancements in available
treatment options, the prognosis for CRC remains unfavorable. A
total of 50–60% of patients are diagnosed with metastasis,
primarily in the liver, making them unsuitable candidates for
surgical intervention and resulting in mortality (2). Furthermore, although there is an
ongoing introduction of innovative pharmaceuticals and therapeutic
approaches, CRC continues to exhibit a high mortality rate
worldwide (13.7/100,000) (3).
Consequently, CRC presents a substantial risk to human health,
emphasizing the crucial and urgent requirement to elucidate the
molecular mechanisms that contribute to the onset and progression
of CRC (4).
The transforming growth factor-β (TGF-β) signaling
pathway serves a crucial role in a multitude of biological
processes, including but not limited to proliferation, migration,
apoptosis, differentiation and immune responses (5,6).
Consequently, the dysregulation of the TGF-β signaling pathway,
caused by genetic mutations or abnormal expression, has been
implicated in the pathogenesis of several malignancies, including
CRC (7–9). Numerous studies have reported that the
dysfunction of the TGF-β signaling pathway exhibits a dual
functionality, acting as a suppressor during the early stages and
as a promoter during the late stages of CRC (10). Additionally, the TGF-β signaling
pathway serves a significant role in the initiation and progression
of cancer through its regulation of several cellular processes,
such as epithelial-mesenchymal transition (EMT) (11,12).
EMT is the process by which epithelial cells undergo a
transformation into a mesenchymal phenotype, increasing their
ability to migrate (13). Several
studies have reported that EMT can cause epithelial tumor cells to
take on the characteristics of stromal cells, leading to increased
invasion and migration (14,15).
Therefore, TGF-β-induced EMT is crucial for the TGF-β signaling
pathway to promote tumor progression in patients with CRC (16).
Furthermore, accumulating evidence indicates that
metabolic reprogramming is prevalent in the majority of cancers,
including CRC. It has been established in previous studies that
cancer is a metabolic disease characterized by abnormal metabolic
alterations (17–19). In recent years, there has been
significant progress in the field of tumor metabolism, surpassing
the understanding of the Warburg effect and recognizing the
intricate metabolic complexity of tumors (20). Increasing evidence suggests that
tumor cells have the ability to independently alter their metabolic
pathways to fulfill the increased requirements for tumor growth,
recurrence, metastasis and resistance to therapy (21).
Recently, there is substantial evidence supporting
the role of the TGF-β signaling pathway as a metabolic modulator,
capable of remodeling the metabolism of glucose, lipids and amino
acids in several cell types, including tumor cells (22–24).
Consequently, during the process of TGF-β-induced EMT, tumor cells
may modulate their metabolism to meet the increased demand for EMT
(25,26). Nevertheless, the precise metabolic
reprogramming and essential metabolites which are critical for
TGF-β-induced EMT in CRC have not been thoroughly explored. The
present study assessed the impact of TGF-β1 on the metabolism of
CRC cells and identified the purine metabolite inosine responsible
for regulating the EMT induced by the TGF-β1. The present study
also provided insights into the regulation of inosine and
demonstrated its significance in EMT phenotypes.
Materials and methods
Cell culture and transfection
Human colonic carcinoma SW480 cells (American Type
Culture Collection) were maintained in RPMI 1640 medium (Gibco;
Thermo Fisher Scientific, Inc.) supplemented with 10% fetal bovine
serum (Gibco; Thermo Fisher Scientific, Inc.). The cells were
incubated at 37°C in a humidified atmosphere with 5%
CO2. Once the cells reached 80–90% confluency, they were
subcultured. The SW480 cells were exposed to recombinant human
TGF-β1 protein (Abcam) at varying concentrations (10 and 20 ng/ml)
for 72 h. The images of cell morphology were captured using a light
microscope (Leica Microsystems GmbH).
SW480 cells were transfected with 5 µg pCDNA3.1
plasmids (Invitrogen™; Thermo Fisher Scientific, Inc.) using
Lipofectamine™ Transfection Reagent (Invitrogen™; Thermo Fisher
Scientific, Inc.) to upregulate the expression levels of LACC1, and
SW480 cells were transfected with 5 µg small hairpin (sh)RNAs
lentiviral vectors pLKO.1 (Sigma-Aldrich) using Lipofectamine™
Transfection Reagent (Invitrogen™; Thermo Fisher Scientific, Inc.)
to downregulate the expression levels of LACC1. Cells were
incubated at 37°C for 4 h and harvested 48 h after transfection for
analysis. For the lentiviral transfection procedure, pLVpro-MSCV
(Takara Biotechnology Co. Ltd.) overexpressing vectors and pLKO.1
(Sigma-Aldrich) shRNA vectors were used for lentivirus packing
(lentivirus plasmids, packaging plasmids and envelope plasmids in a
ratio of 4:3:1). The lentiviruses were then co-transfected into
293T cells (American Type Culture Collection) using Lipofectamine™
Transfection Reagent (Invitrogen™; Thermo Fisher Scientific, Inc.).
The cell culture medium was replaced 12 h post-transfection. After
48 h, the lentiviruses were harvested and centrifuged at 4°C, 250 ×
g for 5 min to remove cell debris. The resulting supernatant was
collected and centrifuged at 4°C, 9,000 × g for 2 h. Subsequently,
SW480 cells were infected with the lentiviruses at a multiplicity
of infection of 30. The cell culture medium was changed after 12 h
post-infection. Following 48 h of infection, the cells were
subjected to stable selection with 1 µg/ml puromycin (Invitrogen™;
Thermo Fisher Scientific, Inc.). Resistant cells were harvested
after 5 days for further cultivation, with a maintenance
concentration of 0.5 µg/ml puromycin.
SW480 cells treated with TGF-β1 (20 ng/ml) were
utilized for the cloning of LACC1. The total RNA from the cells was
isolated using TRIzol™ (Invitrogen; Thermo Fisher Scientific,
Inc.), followed by cDNA synthesis employing the PrimeScript™ RT
reagent Kit (Takara Biotechnology Co. Ltd.). The reaction was
conducted at 37°C for 15 min and 85°C for 5 sec. PCR amplification
was carried out using clone PCR primers and PrimeSTAR®
HS DNA Polymerase (Takara Biotechnology Co. Ltd.). The
thermocycling conditions were as follows: (98°C, 10 sec; 68°C, 5
min) 30 cycles. The resulting PCR product was then analyzed through
agarose electrophoresis (1%), and the gel block containing the
LACC1 gene fragment was excised for gel recovery. Clone PCR primers
were designed using SnapGene 4.1.8 (GSL Biotech LLC.). The sequence
used for cloning LACC1 was as follows: Forward,
5′-ATGGCAGAAGCTGTTTTGAT-3′ and reverse, 5′-TCATTCTTTAATTGATATGA-3′.
Moreover, sequences for enzyme cleavage sites and protective bases
were added. The sequences of the clone PCR primers were as follows:
LACC1 clone PCR primers: Forward,
5′-ATGGCGAGCTCATGGCAGAAGCTGTTTTGAT-3′ and reverse,
5′-ATGGCGGGCCCTCATTCTTTAATTGATATGA-3′.
shRNAs were designed using SnapGene 4.1.8 (GSL
Biotech LLC.). The sequence used for interfering LACC1 was as
follows: 5′-GGAAGACATTGTTGTTGTACT-3′. The designed sequences were
as follows: Left, 5′-CCGG-3′; sense, 5′-GGAAGACATTGTTGTTGTACT-3′;
loop, 5′-CTCGAG-3′; antisense, 5′-AGTACAACAACAATGTCTTCC-3′; right,
5′-TTTTTG-3′. The sequences of the shRNAs were as follows: LACC1
shRNA,
5′-CCGGGGAAGACATTGTTGTTGTACTCTCGAGAGTACAACAACAATGTCTTCCTTTTTG-3′
and control shRNA,
5′-CCGGCAACAAGATGAAGAGCACCAACTCGAGTTGGTGCTCTTCATCTTGTTGTTTTTG-3′.
Metabolomics assay
The samples (SW480 cells and SW480 cells treated
with 20 ng/ml TGF-β1) were thawed on ice and then 100 µl of each
sample was transferred into 1.5 ml centrifuge tubes using a
pipette. Protein extraction and precipitation were performed by
adding 300 µl methanol to all samples, followed by the addition of
10 µl of an internal standard (DL-p-Chlorophenylalanine; Shanghai
Aladdin Biochemical Technology Co., Ltd.; 2.9 mg/ml). The samples
were then vortexed for 30 sec and centrifuged at 13,400 × g at 4°C
for 15 min. Subsequently, 200 µl of the supernatant was transferred
to a vial for analysis. Metabolite profiling was performed using a
liquid chromatography-mass spectrometry system consisting of a
Waters Acquity UPLC (Waters Corporation) and a Q Exactive™ (Thermo
Fisher Scientific, Inc.). Column: ACQUITY UPLC HSS T3 (2.1×100 mm;
1.8 µm; Waters Corporation); Column temperature: 40°C; flow rate:
0.3 ml/min; mobile phase A: Water + 0.05% formic acid; mobile phase
B: Acetonitrile; injection volume: 5 µl; automatic injector
temperature: 4°C. The Q Exactive platform used an electric spray
ionization source and operated in both positive ion mode (POS) and
negative ion mode (NEG). The following conditions were used for
ESI+: Heater Temp 300°C; curtained Air: 30 psi; sheath gas flow
rate, 45 arb; aux gas flow rate, 15 arb; sweep gas flow rate, 1
arb; spray voltage, 3.0 KV; capillary temp, 350°C; S-Lens RF level,
30%. The following conditions were used for ESI-: Heater Temp
300°C; curtained air: 30 psi; sheath gas flow rate, 45 arb; aux gas
flow rate, 15 arb; sweep gas flow rate, 1 arb; spray voltage, 3.2
KV; capillary temp, 350°C; S-Lens RF level, 60%. The details for
the scanning mode included: First level full scan (m/z 70-1,050);
resolution, 70,000 (primary mass spectrometry) and 17,500
(secondary mass spectrometry); collision mode: high energy
collision dissociation (HCD). In the subsequent data analysis
process, the POS and NEG data was analyzed separately, including
the retention time, compound molecular weight observations
(samples) and peak intensity. The metabolites were characterized by
matching their retention times and m/z values with the National
Institute of Science and Technology database (https://www.nist.gov). The original metabolite
profiling results are deposited in figshare (https://doi.org/10.6084/m9.figshare.25661646).
RNA sequencing (RNA-Seq) assay
In the present study, total RNA was extracted from
cells using a RNeasy mini kit (cat. no. 74104; Qiagen GmbH). The
concentration and quality of the RNA were assessed using the Qubit
2.0 Fluorometer and the NanoDrop™ One Microvolume UV–Vis
spectrophotometer (Thermo Fisher Scientific, Inc.). The integrity
of the total RNA was evaluated using the Agilent 2100 Bioanalyzer
(Agilent Technologies, Inc.) and only samples with RNA integrity
number values >7.0 were included for sequencing. For the RNA
sample preparations, 1 µg RNA was used as input material.
Strand-specific RNA-seq libraries were constructed using the VAHTS
Universal V6 RNA-seq Library Prep Kit for Illumina®
(cat. no. NR604-02; Vazyme Biotech Co., Ltd.) following the
manufacturer's instructions. The purified libraries were quantified
and validated using the Qubit 2.0 Fluorometer and Agilent 2100
Bioanalyzer to confirm the insert size and calculate the mole
concentration. The library was diluted to 10 pmol (quantified using
the Qubit 2.0 Fluorometer (Invitrogen™; Thermo Fisher Scientific,
Inc.) and then subjected to cluster generation using cBot
(Illumina, Inc.). Subsequently, the libraries were sequenced on the
Illumina NovaSeq 6000 Sequencing System (Illumina, Inc.), and the
paired-end 150 bp program was chosen for the purpose of conducting
dual end sequencing. The resulting paired RNA reads were mapped to
the human GRCh38 genome. Differential expression analysis for mRNA
was performed using the R package ‘EdgeR 3.30.3’ (27). Genes showing differential expression
with an absolute log2(fold change) >1 and P<0.05
were considered for further analysis. The original sequencing
results have been deposited in the Sequence Read Archive under
accession number PRJNA1040341.
Integrative pathway analyses
The construction of an integrated pathway analysis
involving metabolites and genes was performed using the R package
‘Pathview 1.28.1’ (28). This
analysis utilized the Kyoto Encyclopedia of Genes and Genomes
database (https://www.kegg.jp) to create a
knowledge graph representation, and this representation formed a
pathway graph that connected the query of metabolites and
genes.
Measurements of metabolites
levels
To quantify inosine levels, 5×10⁶ cells
were homogenized in ice-cold perchloric acid. The resulting
extracts were subsequently centrifuged at 10,000 × g at 4°C for 10
min, and the supernatant was neutralized by the addition of
ice-cold potassium carbonate for a duration of 10 min. Following
another round of centrifugation, the inosine levels within the
cells were assessed using the Inosine Quantification Assay Kit
(cat. no. ab126286; Abcam) in accordance with the provided
guidelines.
Cell migration assay
The migration of cells was detected using
Transwell-chamber culture systems (Becton, Dickinson and Company).
After a 48-h incubation at 37°C, the cells were transferred into
the upper Transwell chamber (1×10⁵ cells/well in an 8 µm
24-well Transwell insert). Following a 24-h incubation in
serum-free RPMI 1640 medium (Gibco; Thermo Fisher Scientific, Inc.;
both upper and lower chamber), cells on the upper surface of the
upper chamber (non-migrated cells) were removed using cotton swabs
and air-dried, and cells on the lower surface of the filters were
fixed and stained with Giemsa stain at room temperature for 30 min.
A total of three random views were selected and the number of
migrated cells were counted using a light microscope (Leica
Microsystems GmbH).
Reverse transcription(RT)-quantitative
(q)PCR assay
Total RNA of cells were extracted using TRIzol™
(Invitrogen; Thermo Fisher Scientific, Inc.). A total of 1 µg total
RNA was used for cDNA synthesis using a PrimeScript™ RT reagent Kit
(cat. no. RR037A; Takara Biotechnology Co. Ltd.). The reaction was
conducted at 37°C for 15 min and 85°C for 5 sec. Subsequently, the
cDNA was used for qPCR using the SYBR® Green Realtime
PCR Master Mix (Toyobo Life Science). qPCR was performed by using
Applied Biosystems ViiA™ 7 Real-Time PCR System (Thermo Fisher
Scientific, Inc.). The thermocycling conditions were as follows:
50°C, 2 min; 95°C, 10 min; (95°C, 15 sec; 60°C, 1 min) 40 cycles.
The mRNA expression levels were normalized to GAPDH and quantified
using the 2−ΔΔCq method (29).
The mRNA qPCR primers were as follows: E-cadherin:
Forward, 5′-GGGGTCTGTCATGGAAGGTG-3′ and reverse,
5′-CAAAATCCAAGCCCGTGGTG-3′; Vimentin: Forward,
5′-AAGTCCGCACATTCGAGCAA-3′ and reverse, 5′-GGTGGACGTAGTCACGTAGC-3′;
zonula occludents-1 (ZO-1): Forward, 5′-AGCCATTCCCGAAGGAGTTG-3′ and
reverse, 5′-ATCACAGTGTGGTAAGCGCA-3′; N-cadherin: Forward,
5′-GCGTCTGTAGAGGCTTCTGG-3′ and reverse, 5′-GCCACTTGCCACTTTTCCTG-3′;
LACC1: Forward, 5′-GCCGAGGCGGGTGATTTATT-3′ and reverse,
5′-CCATGCTGGGACAGCTAACA-3′; and GAPDH: Forward,
5′-TGACTTCAACAGCGACACCCA-3′ and reverse,
5′-CACCCTGTTGCTGTAGCCAAA-3′.
Western blotting assay
The cells were harvested and lysed by RIPA buffer
(cat. no. ab288006; Abcam) for 30 min at 4°C. The resulting
extracts were subsequently centrifuged at 13,400 × g at 4°C for 20
min, and the supernatant was transferred to a vial for analysis.
The protein concentration was determined using a BCA kit (Beyotime
Institute of Biotechnology). A total of 50 µg heat-denatured
proteins per lane were loaded onto 15% gel for SDS-PAGE, and then
transferred to polyvinylidene difluoride membranes for western
blotting analysis. After blocking nonspecific binding sites with 5%
(wt/vol) nonfat milk at room temperature for 1 h and 0.1% (vol/vol)
Tween-20 diluted in Tris (pH 7.8)-buffered saline at room
temperature for 15 min, the membranes were incubated overnight at
4°C with the following primary antibodies: Anti-E-cadherin
(1:1,000; cat. no. 14472; Cell Signaling Technology, Inc.),
anti-Vimentin (1:1,000; cat. no. 3390; Cell Signaling Technology,
Inc.), anti-ZO-1 (1:1,000; cat. no. 15652; Cell Signaling
Technology, Inc.), anti-N-cadherin (1:1,000; cat. no. 14215; Cell
Signaling Technology, Inc.), anti-LACC1 (1:500; cat. no. sc-374553;
Santa Cruz Biotechnology, Inc.) and anti-GAPDH (1:1,000; cat. no.
97166; Cell Signaling Technology, Inc.). Subsequently, they were
incubated with horseradish peroxidase-conjugated secondary
antibodies (1:2,000; cat. no. 7076; Cell Signaling Technology,
Inc.) at room temperature for 4 h. The bound antibodies were
visualized using the ECL Plus Western Blotting Detection system
(Cytiva). GAPDH was used as an internal control. The images were
analyzed using ImageJ v1.49 (National Institutes of Health).
Statistical analyses
Data are presented as mean ± standard deviation from
at least three separate experiments. A comparison of metabolites
between the TGF-β1 and control groups was performed using the
Student's unpaired t-test. Other comparisons between two groups
were assessed using the Student's unpaired t-test and multiple
comparisons between the groups were performed using one-way ANOVA,
followed by the Bonferroni method. All statistical analyses were
performed using R 4.0.3 (CRAN) software (https://cran.r-project.org). P<0.05 was considered
to indicate statistically significant difference.
Results
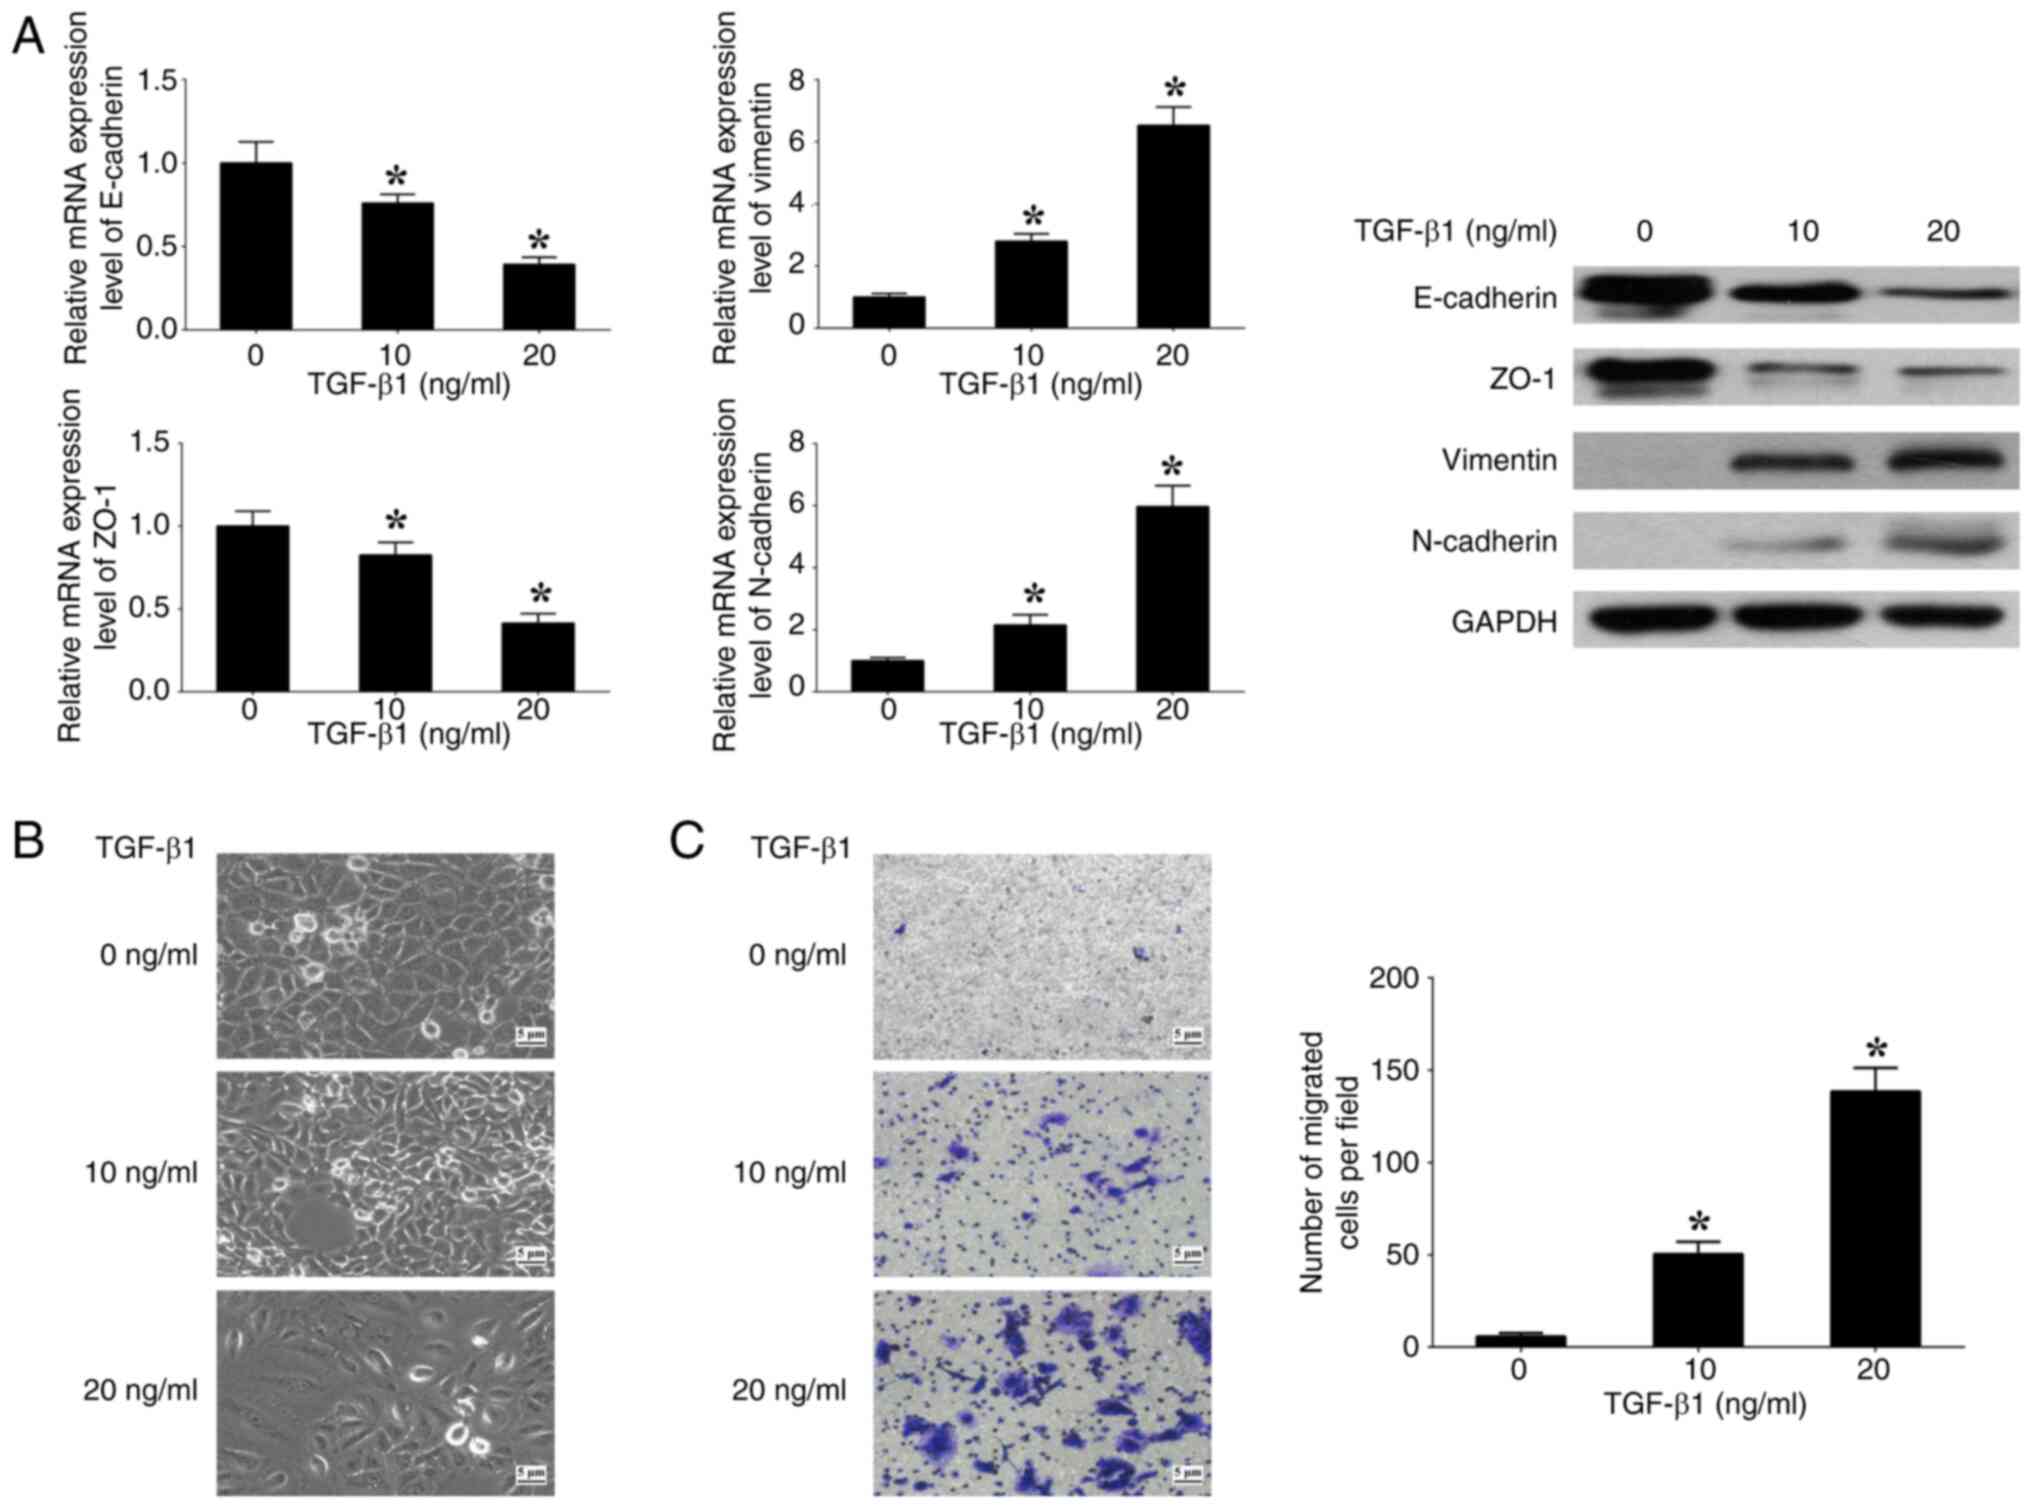
TGF-β1 induces EMT in CRC cells
To assess the impact of the TGF-β signaling pathway
on EMT, SW480 cells were cultured with varying concentrations (0,
10 and 20 ng/ml) of human recombinant TGF-β1. At 20 ng/ml TGF-β1,
the expression levels of E-cadherin and ZO-1 (epithelial markers)
were significantly decreased, whilst the expression levels of
N-cadherin and Vimentin (mesenchymal markers) were significantly
increased, in comparison with at 0 ng/ml TGF-β1 (Fig. 1A). Spindle-like alterations in
morphology and a significant increase in cell migration were also
observed at 20 ng/ml TGF-β1 in comparison with at 0 ng/ml TGF-β1
(Fig. 1B and C). The results
demonstrate that the induction of EMT in SW480 cells by TGF-β1 is
contingent upon the concentration of TGF-β1. Consequently, a
concentration of 20 ng/ml TGF-β1 was used for further experiments
performed in the present study.
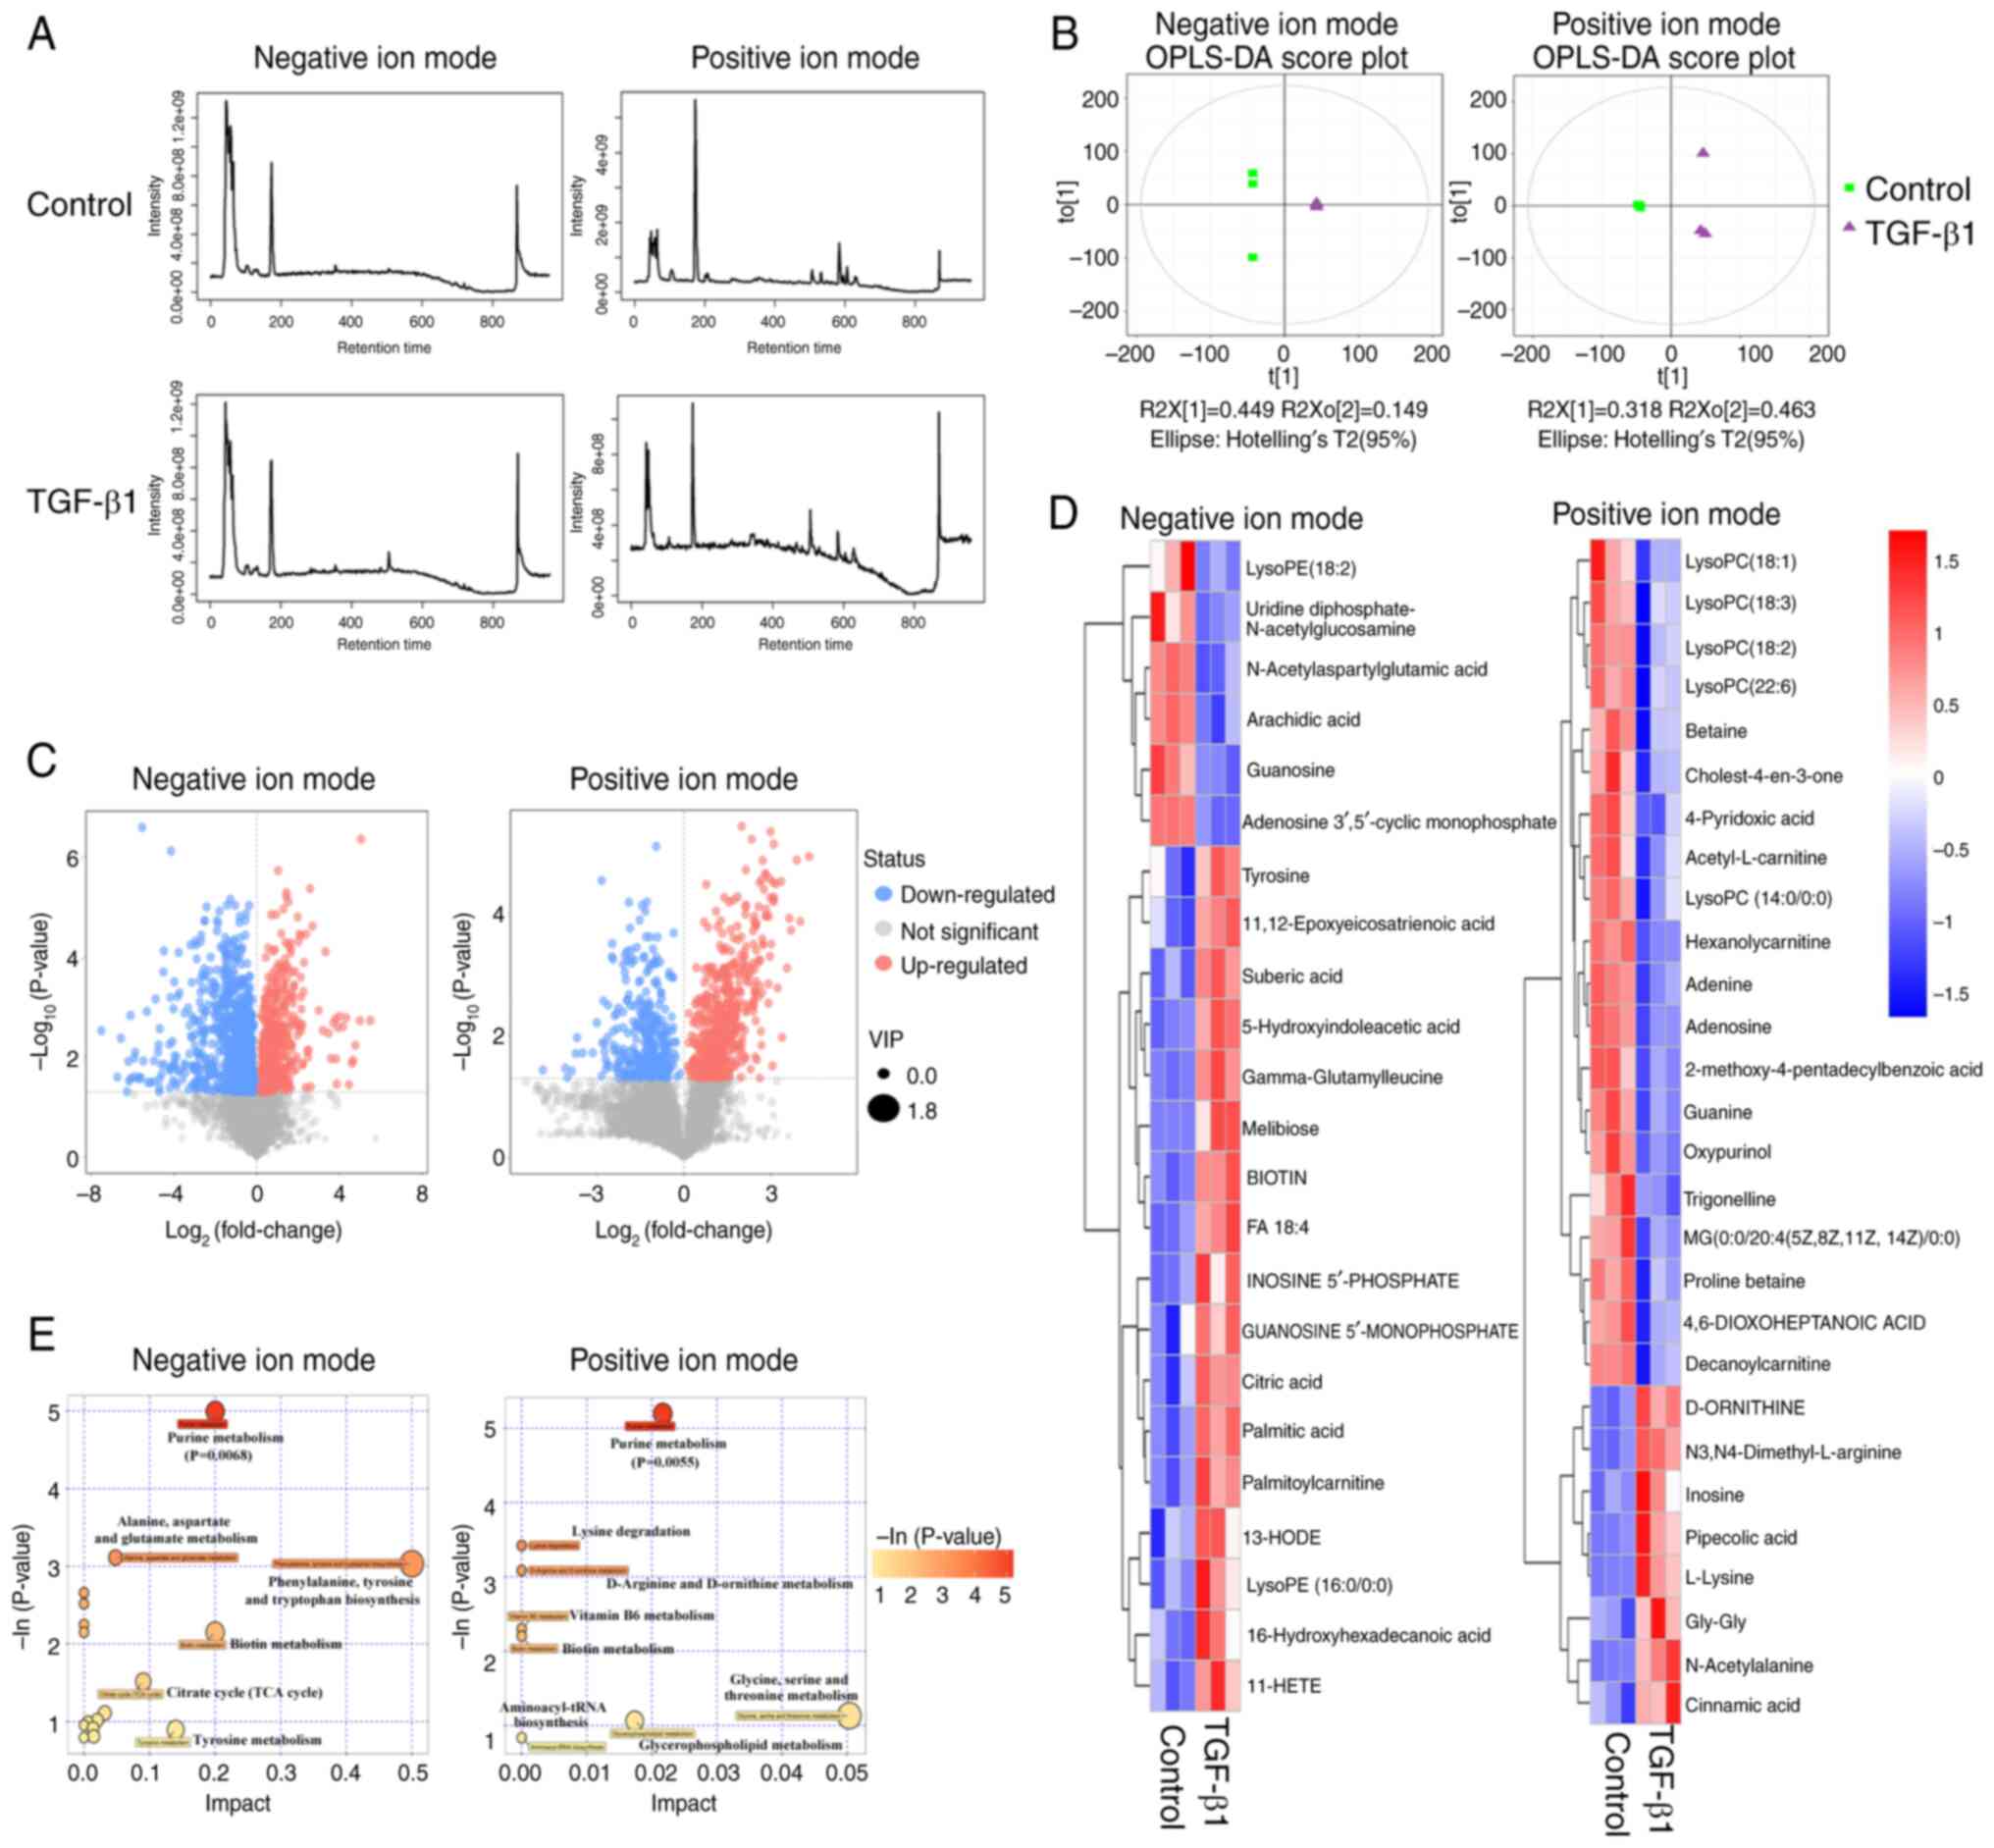
TGF-β1 induces alteration of purine
metabolism in CRC cells
To evaluate the influence of the TGF-β signaling
pathway on cellular metabolism, exogenous TGF-β1 was introduced to
SW480 cells, and subsequent metabolic profiling was performed to
identify any differential metabolites (Fig. 2A). Orthogonal projections to latent
structures-discriminant analysis (OPLS-DA) plots were generated to
visualize the separation of metabolite profiles between the TGF-β1
group and the control group in both the POS and NEG modes (Fig. 2B). By utilizing the variable
importance in the projection (VIP) score obtained from the OPLS-DA
and Student's t-test analysis, differential metabolites (VIP>1
and P<0.05) were identified between the TGF-β1 group and the
control group (Fig. 2C).
Furthermore, the differential metabolites were characterized by
matching their retention times and m/z values with the National
Institute of Science and Technology database, resulting in the
identification of 28 and 23 differential metabolites in the POS and
NEG modes, respectively (Fig. 2D
and Table SI). Among these, 8
metabolites were upregulated and 20 metabolites were downregulated
in the POS mode, whilst in the NEG mode, 17 metabolites were
upregulated and 6 metabolites were downregulated. Metabolic pathway
enrichment analysis was also performed for the differential
metabolites induced by TGF-β1, and the bubble plots generated
indicated that purine metabolism was the top significant pathway in
both the POS and NEG modes (Fig.
2E). These findings indicate that TGF-β1 influences purine
metabolism.
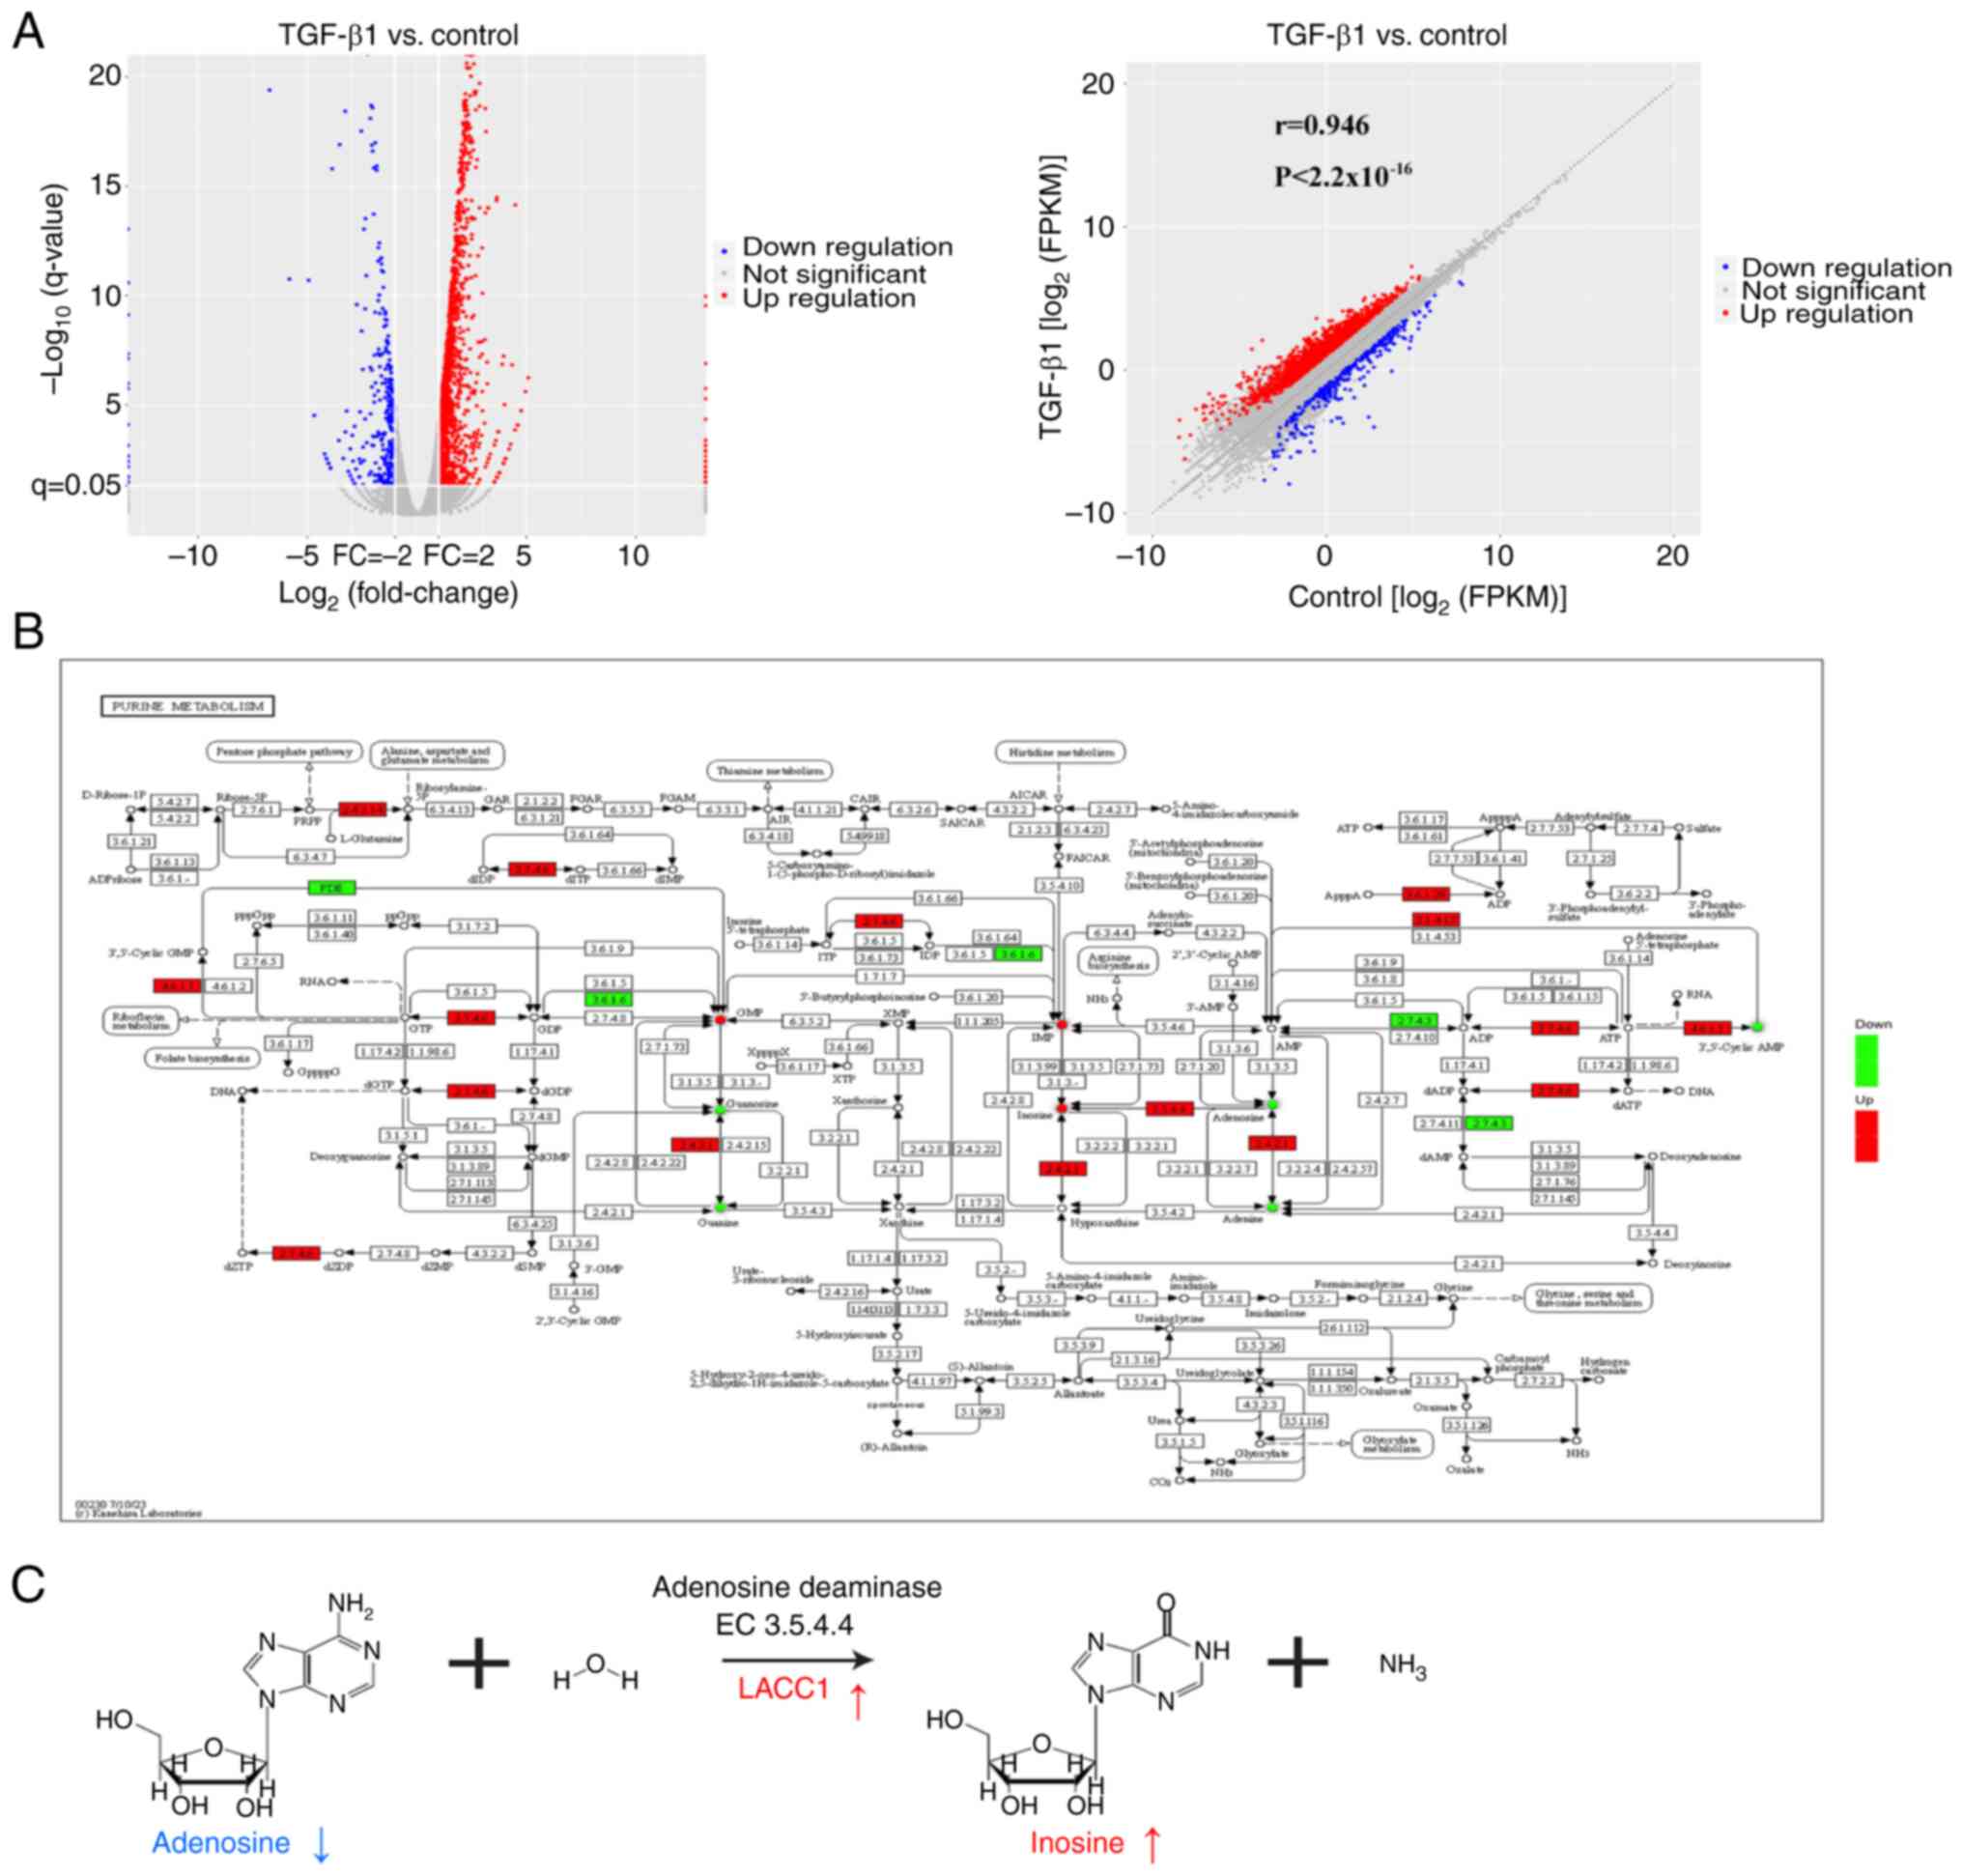
TGF-β1 elevates purine metabolite
inosine levels via LACC1
In general, the regulation of metabolite production
can be controlled by signaling pathways through the regulation of
enzyme gene expression (30). In
the present study, integrated analysis of metabolites and
transcripts were used to assess the relationship between
metabolites and enzyme genes affected by the TGF-β signaling
pathway. Firstly, transcriptomic analysis revealed 1,963
differentially expressed genes (log2(fold change)>1
and P<0.05), with 1,640 upregulated and 323 downregulated genes,
between the TGF-β1 and control groups (Fig. 3A). To further evaluate the data, the
Pathview tool was used to visually represent the differential
metabolites and genes involved in purine metabolism between the
TGF-β1 and control groups (Fig.
3B). The visualization revealed a notably elevated expression
of LACC1, which is an adenosine deaminase (enzyme 3.5.4.4) and is
involved in the process of metabolizing adenosine to inosine
(31) (Fig. 3C). Additionally, the metabolites
inosine and adenosine demonstrated corresponding notable increases
and decreases, supporting this finding (Fig. 3C).
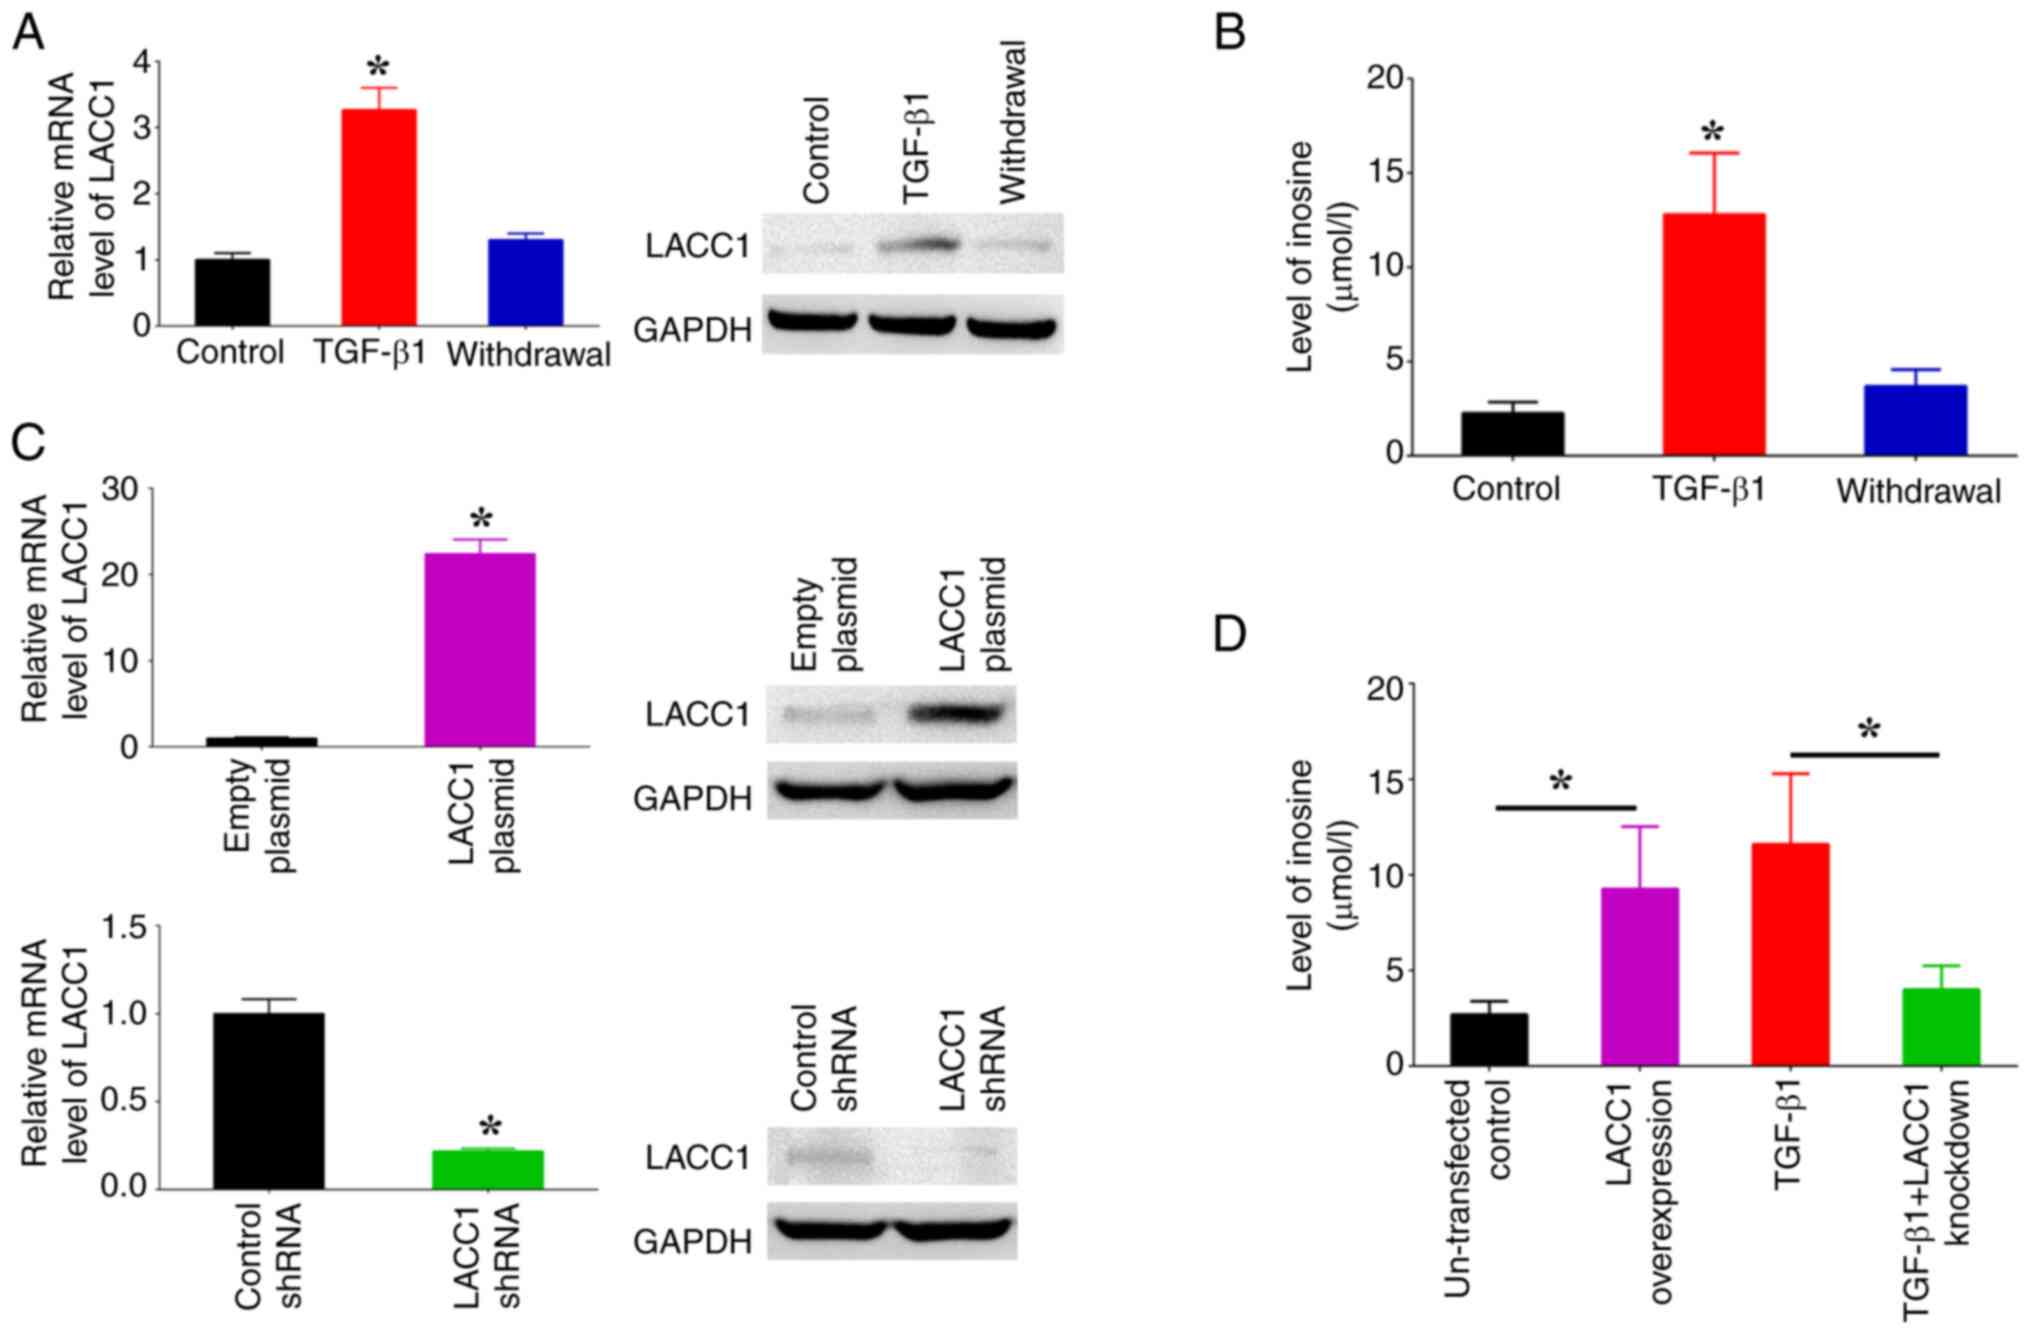
Subsequently, the influence of TGF-β1 on the control
of LACC1 gene expression and inosine levels was assessed using the
introduction of TGF-β1. Moreover, the potential for the reversal of
changes instigated by TGF-β1 was evaluated by withdrawing the
administration of TGF-β1 following a predetermined period. The
findings from RT-qPCR and western blotting indicated that the
presence of TGF-β1 led to a significant increase in LACC1
expression, whilst its absence resulted in a significant decrease,
in comparison with controls (Fig.
4A). Furthermore, the observed significant increase in inosine
levels in cells treated with TGF-β1 was reversed after TGF-β1 was
withdrawn (Fig. 4B). To further
assess the influence of LACC1 on the accumulation of inosine
induced by TGF-β1, overexpression plasmids and shRNAs targeting
LACC1 were transfected into SW480 cells to induce overexpression
and knockdown of LACC1, respectively (Fig. 4C). The results demonstrated that
overexpressing LACC1 significantly increased inosine levels, whilst
knockdown of LACC1 expression abolished the TGF-β1-induced increase
in inosine levels, in comparison with controls (Fig. 4D). These findings suggest that the
upregulation of inosine, a purine metabolite, is mediated by TGF-β1
through the modulation of LACC1 expression.
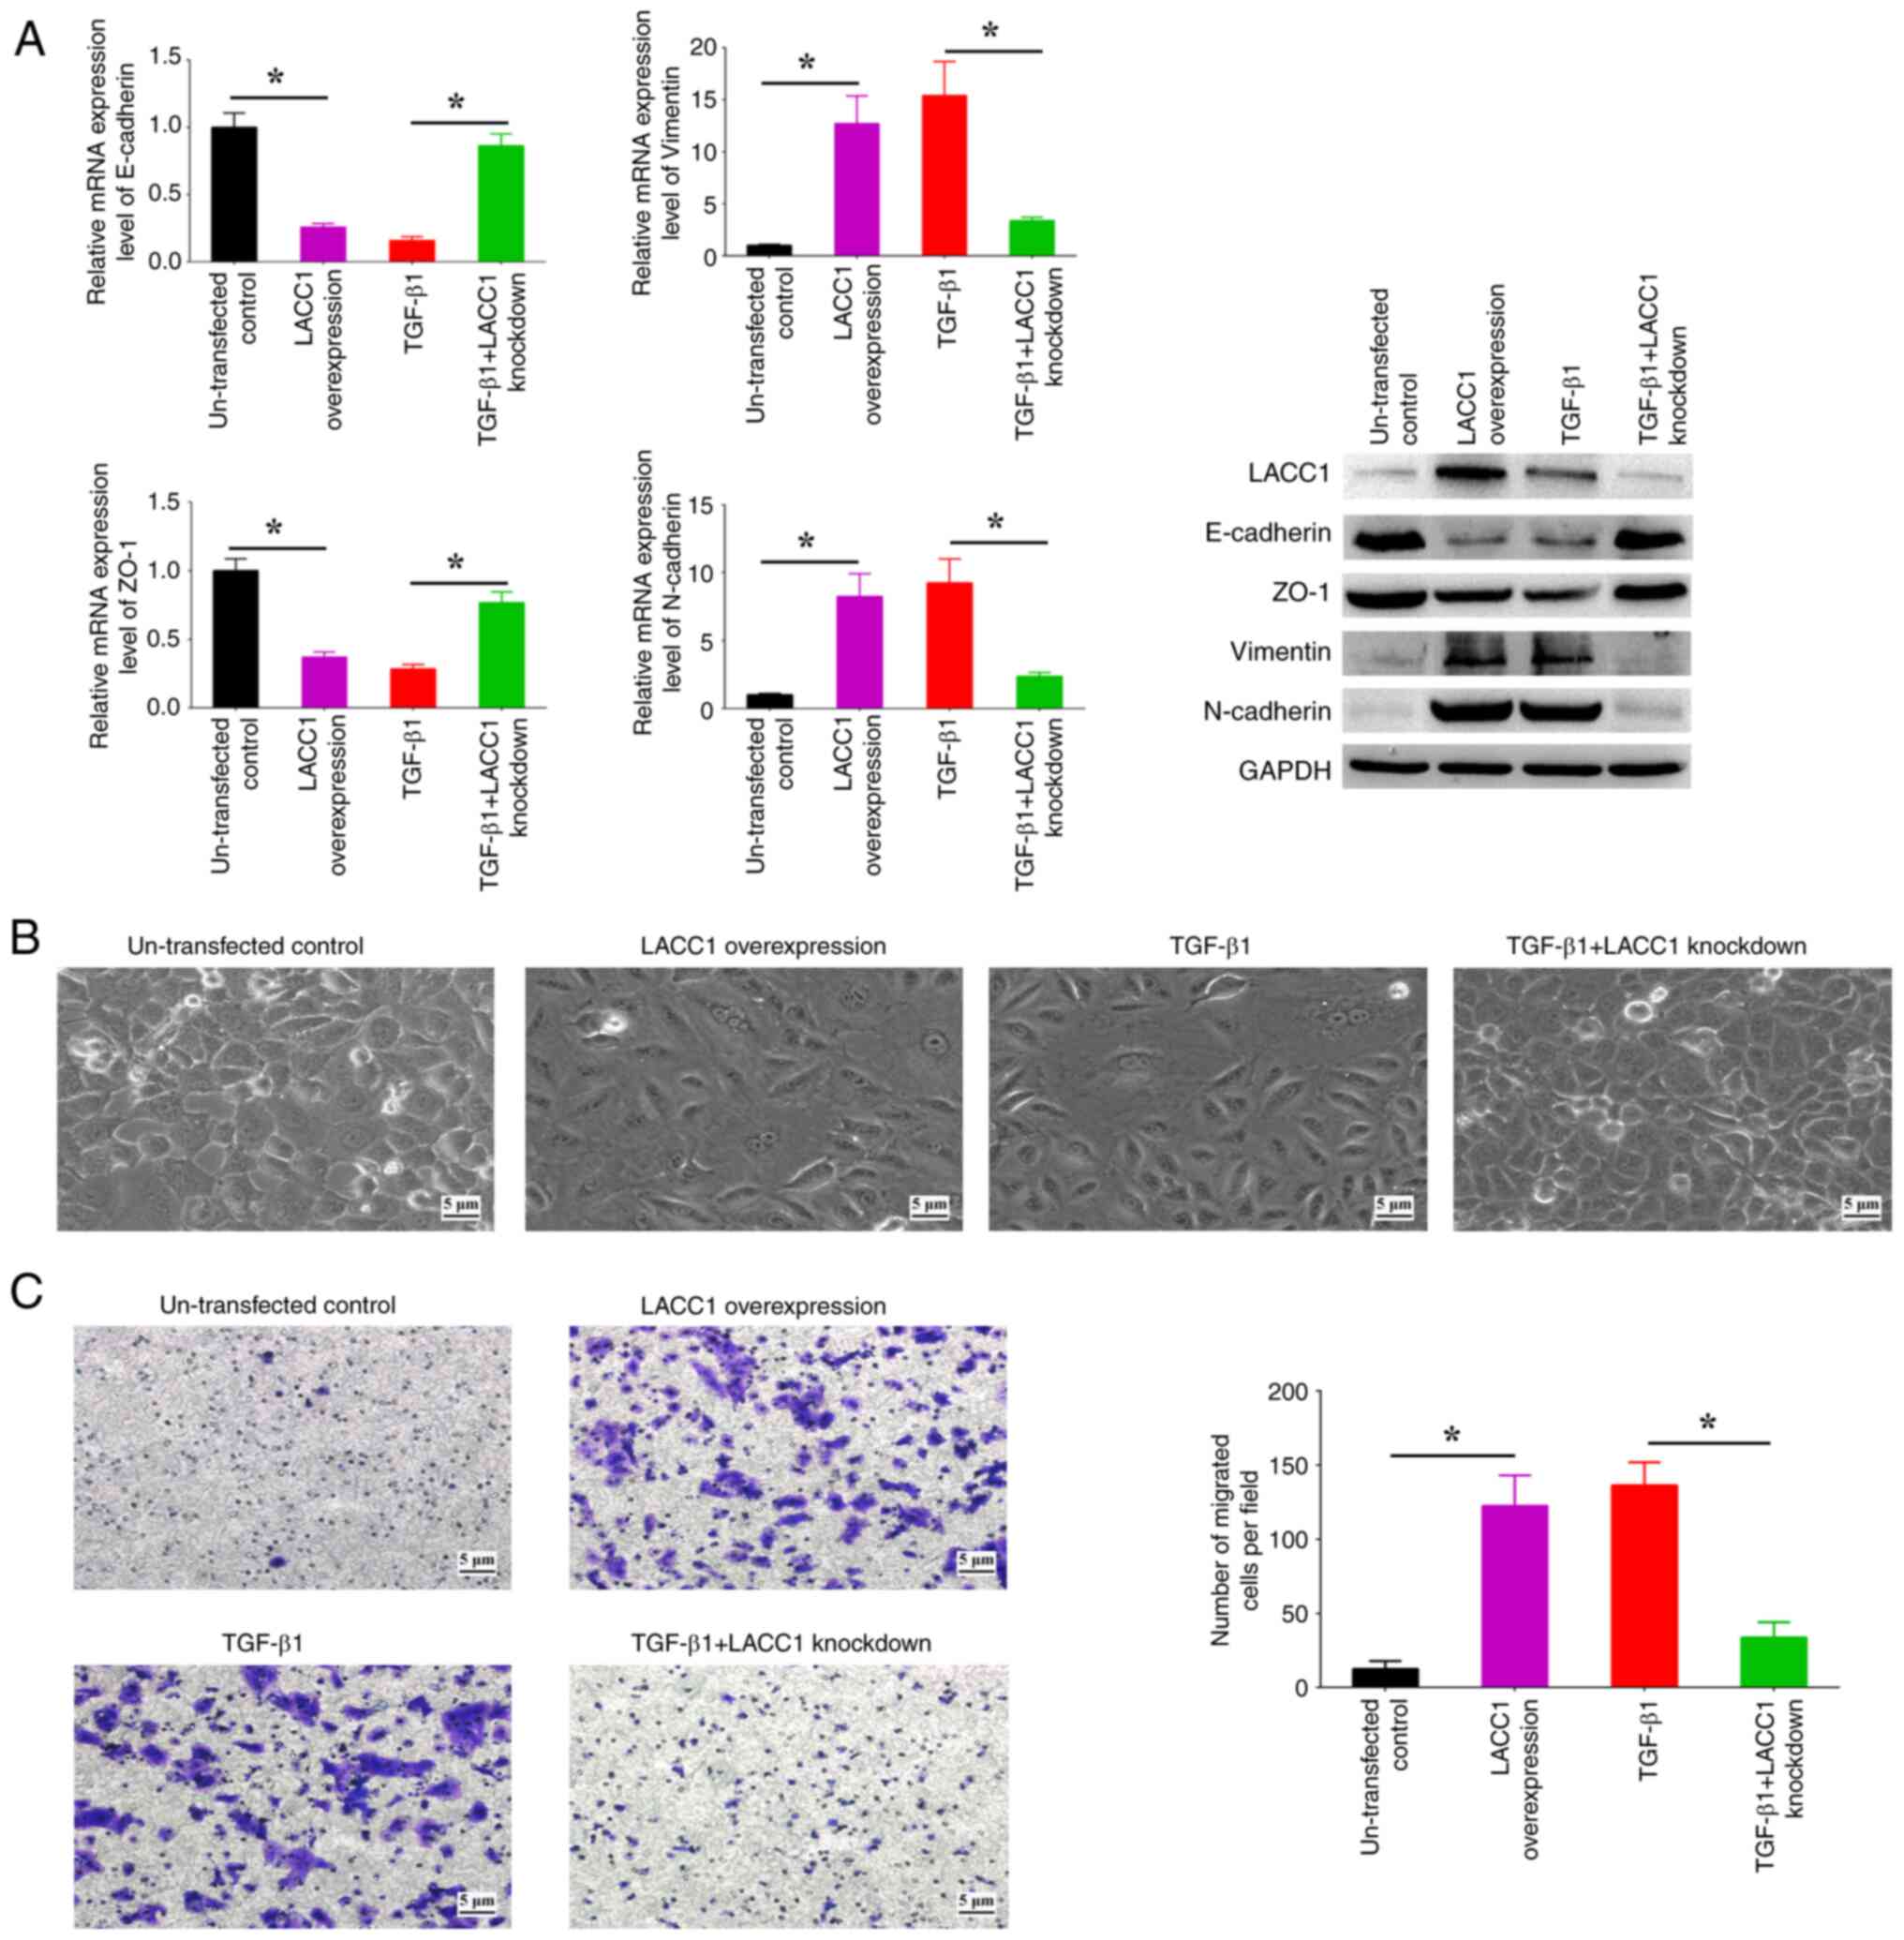
LACC1-controlled inosine accumulation
is involved in the regulation of EMT
The present study aimed to assess the role of LACC1
in the EMT process induced by TGF-β1. Upon upregulation of LACC1,
there was a significant increase in the expression levels of
N-cadherin and Vimentin, and a significant decrease in the
expression levels of E-cadherin and ZO-1, in comparison with
controls (Fig. 5A). This was
accompanied by observable spindle-like alterations in morphology
and a significant increase in cell migration in comparison with
controls (Fig. 5B and C).
Conversely, the suppression of LACC1 expression abolished the
increased/decreased EMT marker profiles, morphological alterations
and increased cell migration induced by TGF-β1 (Fig. 5A-C). These findings indicate the
critical involvement of LACC1 in TGF-β-induced EMT.
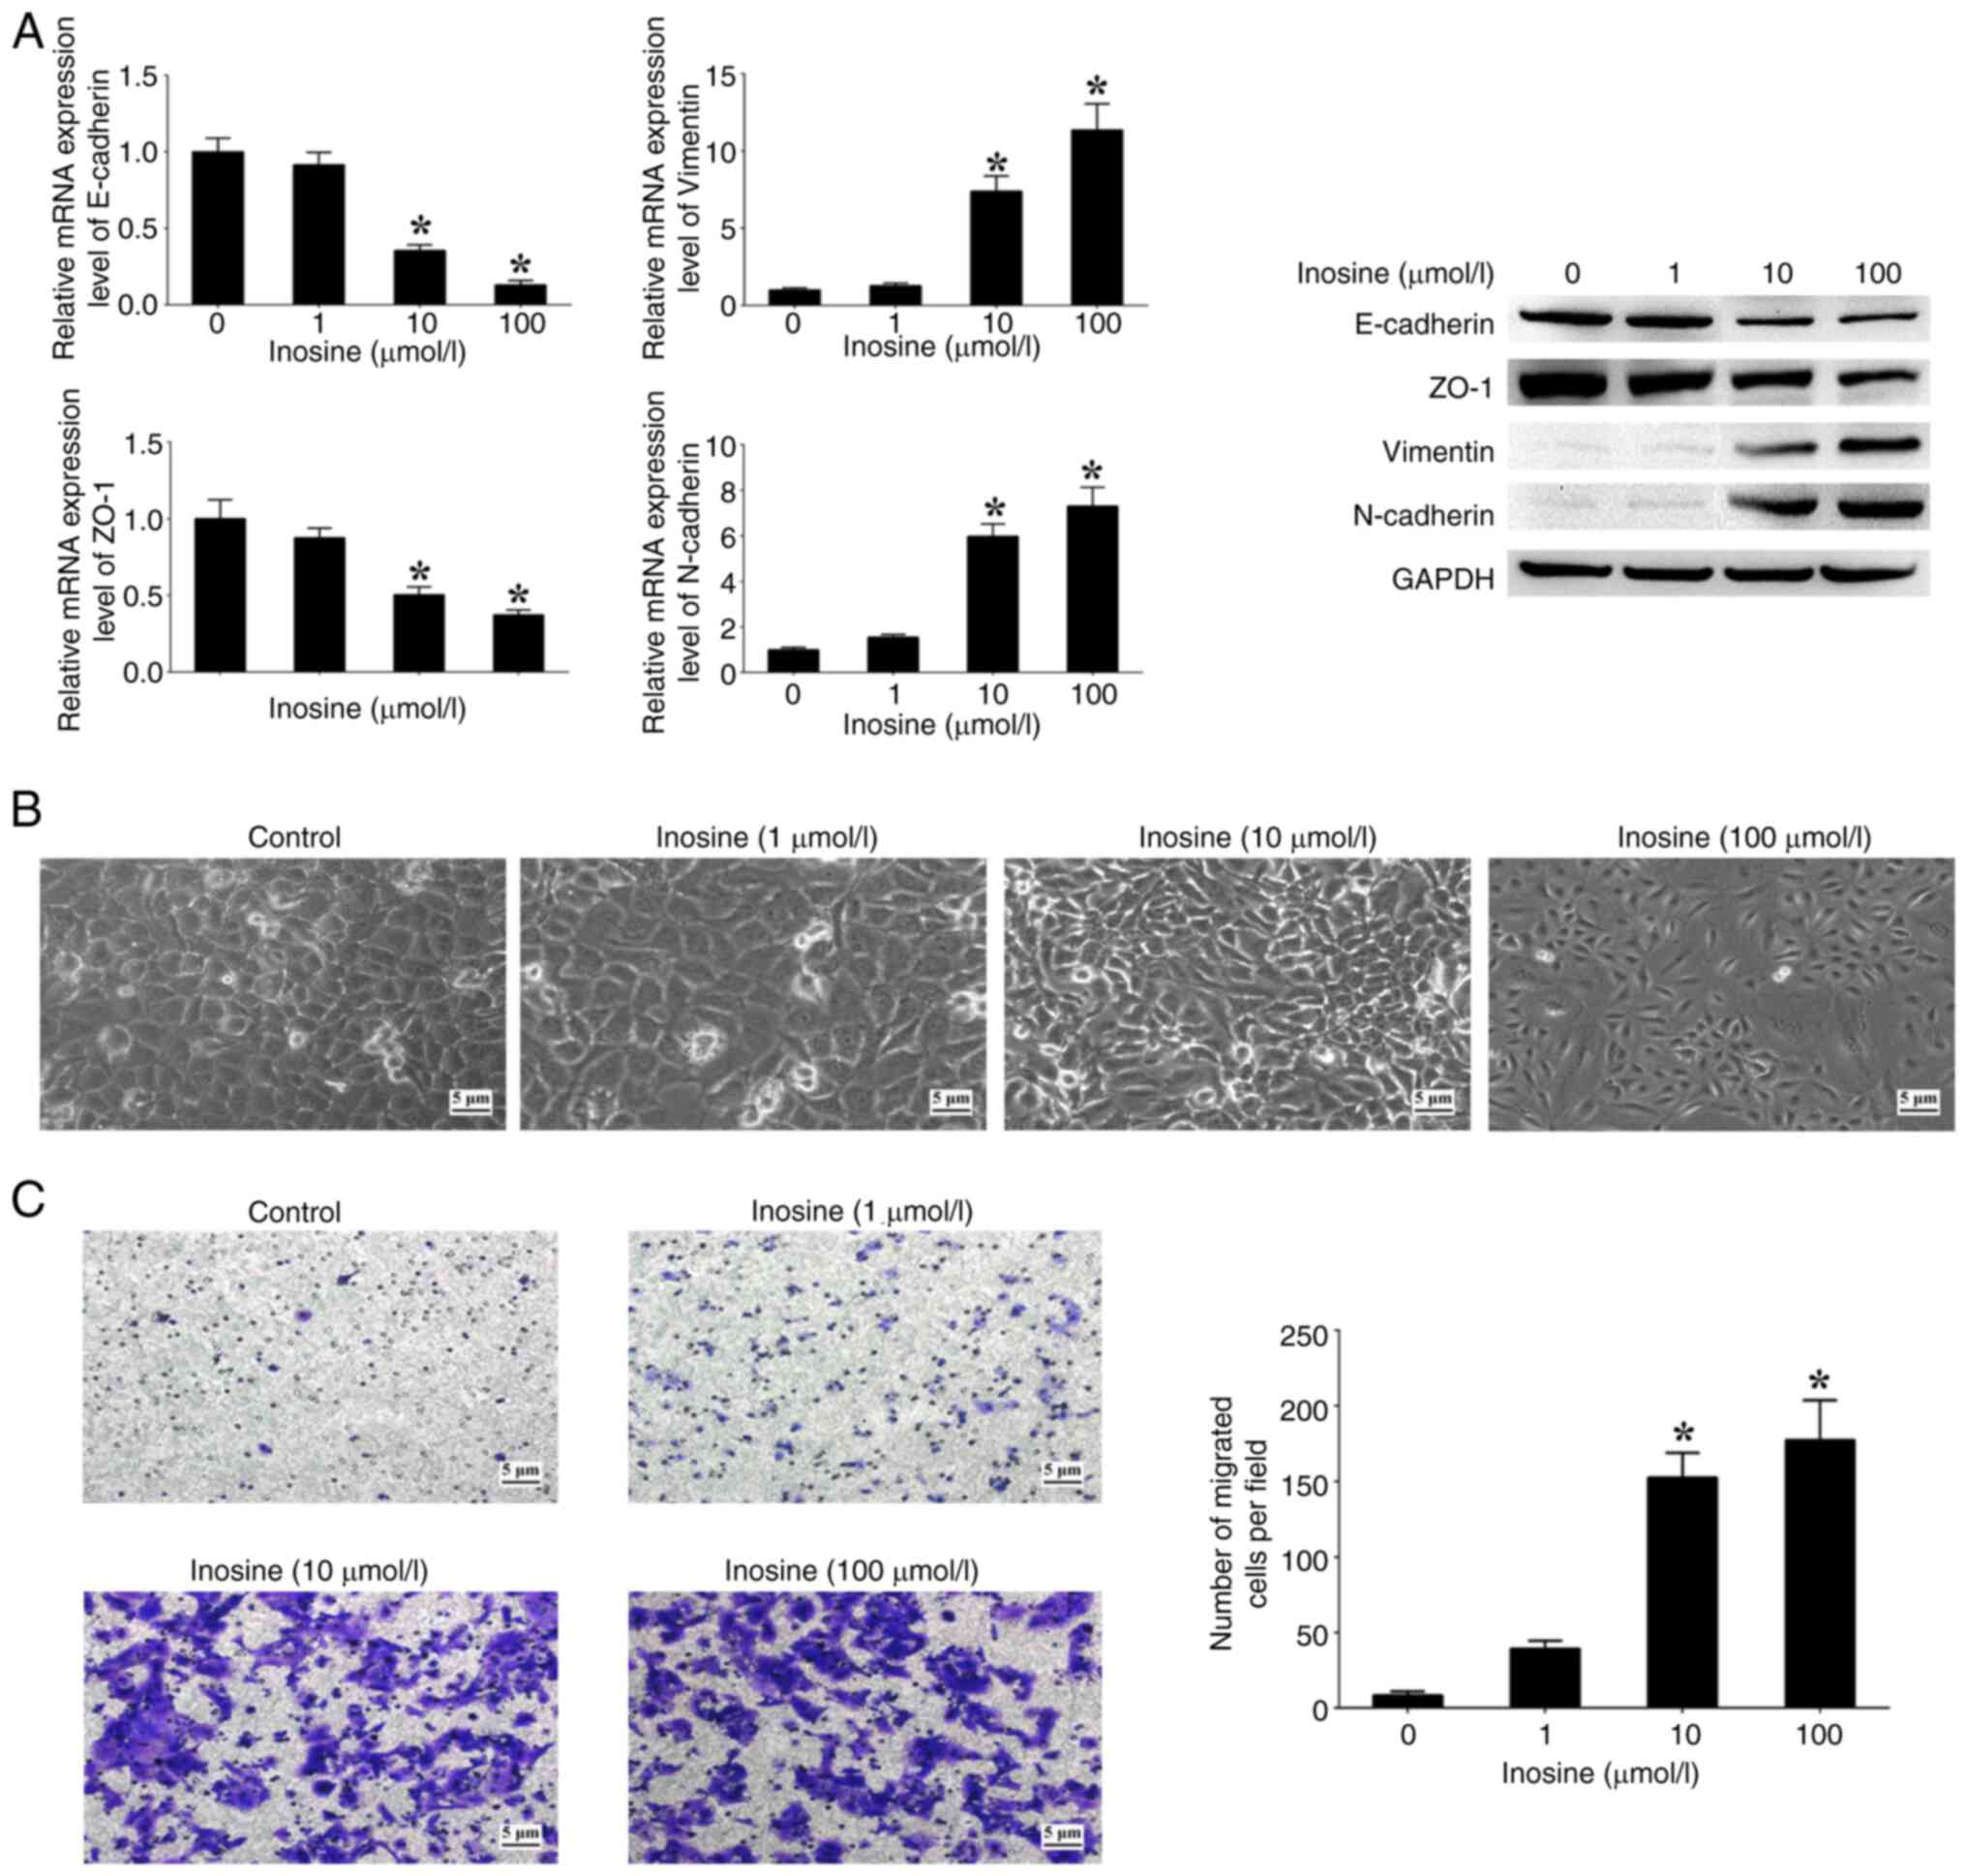
Moreover, the effects of varying concentrations of
inosine on patterns of EMT markers, morphological alterations and
cell migration were assessed. The analysis revealed an association
between the concentration of inosine and the expression levels of
N-cadherin and Vimentin, which exhibited a notable increase in a
dose-dependent manner when compared with cells not treated with
inosine (Fig. 6A). Conversely, the
expression levels of E-cadherin and ZO-1 showed a significant
decrease with increasing concentrations of inosine in comparison
with the untreated cells (Fig. 6A).
In addition, an increased concentration of inosine led to a higher
proportion of cells displaying a spindle-like morphology, along
with a notable increase in the number of migrated cells in
comparison with the untreated cells (Fig. 6B and C). These findings suggest a
functional association between inosine accumulation regulated by
LACC1 and EMT processes in CRC cells.
Discussion
The TGF-β signaling pathway has been extensively
studied in relation to its role in several cancers, including CRC
(32). Numerous research
investigations have shown that the malfunction of the TGF-β
signaling pathway is a key factor in the development and
advancement of cancer by controlling a range of cellular functions,
including EMT, proliferation, angiogenesis and immune evasion
(33,34). The present assessed the influence of
the TGF-β signaling pathway on EMT through the introduction of
human recombinant TGF-β1. As the concentration of TGF-β1 increased,
the expression levels of epithelial markers (E-cadherin and ZO-1)
decreased, whilst those of mesenchymal markers (N-cadherin and
Vimentin) increased, and spindle-like alterations in morphology and
an increased in cell migration were also observed. This overall
indicated that TGF-β1 triggers EMT in CRC cells when exposed to
sufficiently elevated concentrations of TGF-β1.
In general, the TGF-β signaling pathway exerts an
influence on the synthesis or functional activity of intracellular
metabolites and metabolic proteins through its ability to modulate
the expression of genes encoding metabolite-related enzymes, as
well as regulate the abundance or post-translational modification
of enzyme proteins (35,36). However, there are still numerous
unresolved inquiries regarding the intricate relationship between
the TGF-β signaling pathway and metabolism, such as a lack of
knowledge regarding the number of metabolites and enzyme genes that
can act as signaling effectors in response to TGF-β signaling
pathway in CRC.
The present research, which combined metabolomics
and transcriptomics data, demonstrated that the activation of
TGF-β1 led to an increase in the expression of LACC1, which in turn
affected the levels of the metabolites inosine and adenosine in CRC
cells. LACC1 is a multifunctional purine enzyme found in several
organisms, and it serves a role in several purine nucleotide
metabolic reactions, including the conversion of adenosine to
inosine (37). Mutations in LACC1
have been linked to several human diseases, such as inflammatory
bowel disease, Behcet's disease, leprosy, ulcerative colitis,
early-onset Crohn's disease and systemic juvenile idiopathic
arthritis (38–40). The present study demonstrated that
LACC1 has a regulatory function in the accumulation of inosine and
is involved in the process of EMT induced by TGF-β1. Therefore, the
TGF-β signaling pathway affects purine metabolism by increasing
LACC1 expression, potentially contributing to the metastatic
properties of CRC.
In recent times, there has been a growing number of
studies focusing on the roles of purine metabolites in cell biology
and disease, including in cancer (41,42).
Several studies have demonstrated that purine metabolites, such as
adenosine and inosine, function as modulators to influence cancer
development and therapy (43,44).
In the present study, it was demonstrated that the TGF-β signaling
pathway can trigger the expression of the enzyme LACC1, which in
turn activates adenosine deaminase to convert adenosine into
inosine. Inosine, a versatile purine compound, acts as a carbon
source and facilitates signal transmission with several functional
capabilities in different physiological and pathological conditions
(45,46). The present research revealed that
the accumulation of inosine contributes to EMT and cell migration
in CRC cells, indicating that inosine serves a significant role in
EMT and the spread of cancer. However, the impact of LACC1 on CRC
progression has not been examined, and further investigations are
required using in vivo experiments to validate the findings
derived from the present study in CRC.
In summary, the TGF-β signaling pathway is
significantly involved in regulating the expression of LACC1,
thereby influencing the purine metabolism associated with EMT
phenotypes by producing the biologically active metabolite inosine.
The assessment of the interplay between the TGF-β signaling pathway
and purine metabolism in the present study offers valuable
understanding of the role of the TGF-β signaling pathway in CRC.
Furthermore, LACC1, serving as a link between TGF-β signaling and
purine metabolism, holds clinical significance and potential
therapeutic implications for CRC treatment.
Supplementary Material
Supporting Data
Acknowledgements
Not applicable.
Funding
The present work was supported by the Guangdong Basic and
Applied Basic Research Foundation (grant nos. 2019A1515010680 and
2022A1515012134) and the Guangzhou Science and Technology Program
(grant no. 202102010043).
Availability of data and materials
The original sequencing data generated in the
present study may be found in the Sequence Read Archive under
accession number PRJNA1040341 or at the following URL: https://www.ncbi.nlm.nih.gov/sra/?term=PRJNA1040341.
The original metabolite profiling data generated in the present
study may be found in figshare under accession number
10.6084/m9.figshare.25661646 or at the following URL: https://doi.org/10.6084/m9.figshare.25661646. All
other data generated in the present study may be requested from the
corresponding author.
Authors' contributions
WH, YL and JY conceived and designed the study. WH
and LC performed the experiments. WH, YL, JZ and YW collated and
analyzed the data. WH and LC drafted the manuscript. YL and JY
revised and finalized the manuscript. WH and JY confirm the
authenticity of all the raw data. All authors have read and
approved the final manuscript.
Ethics approval and consent to
participate
Not applicable.
Patient consent for publication
Not applicable.
Competing interests
The authors declare that they have no competing
interests.
References
|
1
|
Siegel RL, Miller KD, Wagle NS and Jemal
A: Cancer statistics, 2023. CA Cancer J Clin. 73:17–48. 2023.
View Article : Google Scholar : PubMed/NCBI
|
|
2
|
Dekker E, Tanis PJ, Vleugels JLA, Kasi PM
and Wallace MB: Colorectal cancer. Lancet. 394:1467–1480. 2019.
View Article : Google Scholar : PubMed/NCBI
|
|
3
|
Patel SG, Karlitz JJ, Yen T, Lieu CH and
Boland CR: The rising tide of early-onset colorectal cancer: A
comprehensive review of epidemiology, clinical features, biology,
risk factors, prevention, and early detection. Lancet Gastroenterol
Hepatol. 7:262–274. 2022. View Article : Google Scholar : PubMed/NCBI
|
|
4
|
Harada S and Morlote D: Molecular
pathology of colorectal cancer. Adv Anat Pathol. 27:20–26. 2020.
View Article : Google Scholar : PubMed/NCBI
|
|
5
|
Derynck R and Budi EH: Specificity,
versatility, and control of TGF-β family signaling. Sci Signal.
12:eaav51832019. View Article : Google Scholar : PubMed/NCBI
|
|
6
|
Peng D, Fu M, Wang M, Wei Y and Wei X:
Targeting TGF-β signal transduction for fibrosis and cancer
therapy. Mol Cancer. 21:1042022. View Article : Google Scholar : PubMed/NCBI
|
|
7
|
Ali S, Rehman MU, Yatoo AM, Arafah A, Khan
A, Rashid S, Majid S, Ali A and Ali MN: TGF-β signaling pathway:
Therapeutic targeting and potential for anti-cancer immunity. Eur J
Pharmacol. 947:1756782023. View Article : Google Scholar : PubMed/NCBI
|
|
8
|
Colak S and Ten Dijke P: Targeting TGF-β
signaling in cancer. Trends Cancer. 3:56–71. 2017. View Article : Google Scholar : PubMed/NCBI
|
|
9
|
Derynck R, Turley SJ and Akhurst RJ: TGFβ
biology in cancer progression and immunotherapy. Nat Rev Clin
Oncol. 18:9–34. 2021. View Article : Google Scholar : PubMed/NCBI
|
|
10
|
Itatani Y, Kawada K and Sakai Y:
Transforming growth factor-β signaling pathway in colorectal cancer
and its tumor microenvironment. Int J Mol Sci. 20:58222019.
View Article : Google Scholar : PubMed/NCBI
|
|
11
|
Liu A, Yu C, Qiu C, Wu Q, Huang C, Li X,
She X, Wan K, Liu L, Li M, et al: PRMT5 methylating SMAD4 activates
TGF-β signaling and promotes colorectal cancer metastasis.
Oncogene. 42:1572–1584. 2023. View Article : Google Scholar : PubMed/NCBI
|
|
12
|
Perez LG, Kempski J, McGee HM, Pelzcar P,
Agalioti T, Giannou A, Konczalla L, Brockmann L, Wahib R, Xu H, et
al: TGF-β signaling in Th17 cells promotes IL-22 production and
colitis-associated colon cancer. Nat Commun. 11:26082020.
View Article : Google Scholar : PubMed/NCBI
|
|
13
|
Dongre A and Weinberg RA: New insights
into the mechanisms of epithelial-mesenchymal transition and
implications for cancer. Nat Rev Mol Cell Biol. 20:69–84. 2019.
View Article : Google Scholar : PubMed/NCBI
|
|
14
|
Yang J, Antin P, Berx G, Blanpain C,
Brabletz T, Bronner M, Campbell K, Cano A, Casanova J, Christofori
G, et al: Guidelines and definitions for research on
epithelial-mesenchymal transition. Nat Rev Mol Cell Biol.
21:341–352. 2020. View Article : Google Scholar : PubMed/NCBI
|
|
15
|
Lambert AW and Weinberg RA: Linking EMT
programmes to normal and neoplastic epithelial stem cells. Nat Rev
Cancer. 21:325–338. 2021. View Article : Google Scholar : PubMed/NCBI
|
|
16
|
Lu J, Kornmann M and Traub B: Role of
epithelial to mesenchymal transition in colorectal cancer. Int J
Mol Sci. 24:148152023. View Article : Google Scholar : PubMed/NCBI
|
|
17
|
Stine ZE, Schug ZT, Salvino JM and Dang
CV: Targeting cancer metabolism in the era of precision oncology.
Nat Rev Drug Discov. 21:141–162. 2022. View Article : Google Scholar : PubMed/NCBI
|
|
18
|
Gyamfi J, Kim J and Choi J: Cancer as a
Metabolic Disorder. Int J Mol Sci. 23:11552022. View Article : Google Scholar : PubMed/NCBI
|
|
19
|
La Vecchia S and Sebastián C: Metabolic
pathways regulating colorectal cancer initiation and progression.
Semin Cell Dev Biol. 98:63–70. 2020. View Article : Google Scholar : PubMed/NCBI
|
|
20
|
Pan C, Li B and Simon MC: Moonlighting
functions of metabolic enzymes and metabolites in cancer. Mol Cell.
81:3760–3774. 2021. View Article : Google Scholar : PubMed/NCBI
|
|
21
|
Martínez-Reyes I and Chandel NS: Cancer
metabolism: Looking forward. Nat Rev Cancer. 21:669–680. 2021.
View Article : Google Scholar : PubMed/NCBI
|
|
22
|
Shi X, Yang J, Deng S, Xu H, Wu D, Zeng Q,
Wang S, Hu T, Wu F and Zhou H: TGF-β signaling in the tumor
metabolic microenvironment and targeted therapies. J Hematol Oncol.
15:1352022. View Article : Google Scholar : PubMed/NCBI
|
|
23
|
Hua W, Ten Dijke P, Kostidis S, Giera M
and Hornsveld M: TGFβ-induced metabolic reprogramming during
epithelial-to-mesenchymal transition in cancer. Cell Mol Life Sci.
77:2103–2123. 2020. View Article : Google Scholar : PubMed/NCBI
|
|
24
|
Nakasuka F, Tabata S, Sakamoto T, Hirayama
A, Ebi H, Yamada T, Umetsu K, Ohishi M, Ueno A, Goto H, et al:
TGF-β-dependent reprogramming of amino acid metabolism induces
epithelial-mesenchymal transition in non-small cell lung cancers.
Commun Biol. 4:7822021. View Article : Google Scholar : PubMed/NCBI
|
|
25
|
Soukupova J, Malfettone A, Bertran E,
Hernández-Alvarez MI, Peñuelas-Haro I, Dituri F, Giannelli G,
Zorzano A and Fabregat I: Epithelial-Mesenchymal Transition (EMT)
Induced by TGF-β in hepatocellular carcinoma cells reprograms lipid
metabolism. Int J Mol Sci. 22:55432021. View Article : Google Scholar : PubMed/NCBI
|
|
26
|
Corbet C, Bastien E, Santiago de Jesus JP,
Dierge E, Martherus R, Vander Linden C, Doix B, Degavre C, Guilbaud
C, Petit L, et al: TGFβ2-induced formation of lipid droplets
supports acidosis-driven EMT and the metastatic spreading of cancer
cells. Nat Commun. 11:4542020. View Article : Google Scholar : PubMed/NCBI
|
|
27
|
Robinson MD, McCarthy DJ and Smyth GK:
edgeR: A Bioconductor package for differential expression analysis
of digital gene expression data. Bioinformatics. 26:139–140. 2010.
View Article : Google Scholar : PubMed/NCBI
|
|
28
|
Luo W and Brouwer C: Pathview: An
R/Bioconductor package for pathway-based data integration and
visualization. Bioinformatics. 29:1830–1831. 2013. View Article : Google Scholar : PubMed/NCBI
|
|
29
|
Livak KJ and Schmittgen TD: Analysis of
relative gene expression data using real-time quantitative PCR and
the 2(-Delta Delta C(T)) method. Methods. 25:402–408. 2001.
View Article : Google Scholar : PubMed/NCBI
|
|
30
|
Vaghari-Tabari M, Ferns GA, Qujeq D,
Andevari AN, Sabahi Z and Moein S: Signaling, metabolism, and
cancer: An important relationship for therapeutic intervention. J
Cell Physiol. 236:5512–5532. 2021. View Article : Google Scholar : PubMed/NCBI
|
|
31
|
Cristalli G, Costanzi S, Lambertucci C,
Lupidi G, Vittori S, Volpini R and Camaioni E: Adenosine deaminase:
Functional implications and different classes of inhibitors. Med
Res Rev. 21:105–128. 2001. View Article : Google Scholar : PubMed/NCBI
|
|
32
|
Tzavlaki K and Moustakas A: TGF-β
Signaling. Biomolecules. 10:4872020. View Article : Google Scholar : PubMed/NCBI
|
|
33
|
Batlle E and Massagué J: Transforming
growth factor-β signaling in immunity and cancer. Immunity.
50:924–940. 2019. View Article : Google Scholar : PubMed/NCBI
|
|
34
|
Jaykumar AB, Plumber S, Barry DM, Binns D,
Wichaidit C, Grzemska M, Earnest S, Goldsmith EJ, Cleaver O and
Cobb MH: WNK1 collaborates with TGF-β in endothelial cell junction
turnover and angiogenesis. Proc Natl Acad Sci USA.
119:e22037431192022. View Article : Google Scholar : PubMed/NCBI
|
|
35
|
Zaiatz-Bittencourt V, Finlay DK and
Gardiner CM: Canonical TGF-β signaling pathway represses human NK
cell metabolism. J Immunol. 200:3934–3941. 2018. View Article : Google Scholar : PubMed/NCBI
|
|
36
|
Guido C, Whitaker-Menezes D, Capparelli C,
Balliet R, Lin Z, Pestell RG, Howell A, Aquila S, Andò S,
Martinez-Outschoorn U, et al: Metabolic reprogramming of
cancer-associated fibroblasts by TGF-β drives tumor growth:
Connecting TGF-β signaling with ‘Warburg-like’ cancer metabolism
and L-lactate production. Cell Cycle. 11:3019–3035. 2012.
View Article : Google Scholar : PubMed/NCBI
|
|
37
|
Cader MZ, de Almeida Rodrigues RP, West
JA, Sewell GW, Md-Ibrahim MN, Reikine S, Sirago G, Unger LW,
Iglesias-Romero AB, Ramshorn K, et al: FAMIN is a multifunctional
purine enzyme enabling the purine nucleotide cycle. Cell.
180:278–295.e23. 2020. View Article : Google Scholar : PubMed/NCBI
|
|
38
|
Assadi G, Saleh R, Hadizadeh F, Vesterlund
L, Bonfiglio F, Halfvarson J, Törkvist L, Eriksson AS, Harris HE,
Sundberg E and D'Amato M: LACC1 polymorphisms in inflammatory bowel
disease and juvenile idiopathic arthritis. Genes Immun. 17:261–264.
2016. View Article : Google Scholar : PubMed/NCBI
|
|
39
|
Wakil SM, Monies DM, Abouelhoda M,
Al-Tassan N, Al-Dusery H, Naim EA, Al-Younes B, Shinwari J,
Al-Mohanna FA, Meyer BF and Al-Mayouf S: Association of a mutation
in LACC1 with a monogenic form of systemic juvenile idiopathic
arthritis. Arthritis Rheumatol. 67:288–295. 2015. View Article : Google Scholar : PubMed/NCBI
|
|
40
|
Kallinich T, Thorwarth A, von Stuckrad SL,
Rösen-Wolff A, Luksch H, Hundsdoerfer P, Minden K and Krawitz P:
Juvenile arthritis caused by a novel FAMIN (LACC1) mutation in two
children with systemic and extended oligoarticular course. Pediatr
Rheumatol Online J. 14:632016. View Article : Google Scholar : PubMed/NCBI
|
|
41
|
Linden J, Koch-Nolte F and Dahl G: Purine
release, metabolism, and signaling in the inflammatory response.
Annu Rev Immunol. 37:325–347. 2019. View Article : Google Scholar : PubMed/NCBI
|
|
42
|
Yin J, Ren W, Huang X, Deng J, Li T and
Yin Y: Potential mechanisms connecting purine metabolism and cancer
therapy. Front Immunol. 9:16972018. View Article : Google Scholar : PubMed/NCBI
|
|
43
|
Zhang C, Wang K and Wang H: Adenosine in
cancer immunotherapy: Taking off on a new plane. Biochim Biophys
Acta Rev Cancer. 1878:1890052023. View Article : Google Scholar : PubMed/NCBI
|
|
44
|
Huo A and Xiong X: PAICS as a potential
target for cancer therapy linking purine biosynthesis to cancer
progression. Life Sci. 331:1220702023. View Article : Google Scholar : PubMed/NCBI
|
|
45
|
Kim IS and Jo EK: Inosine: A bioactive
metabolite with multimodal actions in human diseases. Front
Pharmacol. 13:10439702022. View Article : Google Scholar : PubMed/NCBI
|
|
46
|
Srinivasan S, Torres AG and Ribas de
Pouplana L: Inosine in biology and disease. Genes (Basel).
12:6002021. View Article : Google Scholar : PubMed/NCBI
|