Introduction
The composition and proportion of infiltrating
immune cells varies across tumors, and may be associated with the
specific biological properties of the tumor and its response to
immunotherapy (1,2). Based on the characteristics of the
tumor microenvironment (TME), tumors can be divided into ‘cold’ and
‘hot’ types (3,4). Hot tumors often exhibit immune cell
infiltration and immune activation, whereas cold tumors exhibit
significant features of low immune cell infiltration (4). At present, colorectal cancer (CRC)
with high microsatellite instability is generally considered to be
a hot tumor, and thus, patients may benefit from anti-PD-1/PD-L1
therapy (5–7). Conversely, microsatellite-stable (MSS)
CRC exhibits profound heterogeneity regarding the immune ecosystem,
and only a small percentage of patients are likely to benefit from
immune-based combination therapy (8,9).
Although there is an in-depth understanding of the molecular basis
of CRC, the important contributing factors to the tumor immune
microenvironment of CRC remain unclear (10). Therefore, further exploration is
required to reveal the causes and characteristics of hot and cold
colorectal tumors, which may be beneficial for the development of
novel therapeutic strategies.
The infiltration of immune cells into tumors
involves multiple processes and is influenced by intricate factors,
such as tumor mutation burden (TMB), the presence of immune cells
and the cytokines present (11,12).
In general, tumors with a higher TMB are considered to carry a
higher neoantigen load that is essential for immune recognition and
priming (13,14), whereas cold tumors are relatively
incapable of initiating tumor immunity and being infiltrated due to
a lower TMB and fewer neoantigens (15–18).
Antigen-presenting cells (APCs) also serve a vital role in tumor
immunity. Defects and alterations in tumor antigen processing and
presentation machinery, such as the downregulated expression of the
MHC-I molecule, limit antigen presentation in the face of tumor
antigens (19–21). Dendritic cells, a type of APC,
recruit T cells into the TME by secreting cytokines, such as
CXCL10, the lack of which may lead to infiltration deficiency in
cold tumors (22–24). Deficient T-cell homing to the tumor
bed also accounts for immune infiltration deficiency in cold tumors
(25). Previous studies have
illustrated the association between the abnormal activation of the
tumor cell-intrinsic oncogenic pathway and the absence of T-cell
infiltration in melanoma (26) and
CRC (27). The aberrant production
and interactions of chemokines (28) and the extensive tumor vasculature
(29) have been confirmed to
increase T-cell infiltration in the tumor bed. In addition,
immunosuppressive cells and cytokines can lead to T-cell exclusion
from the tumor bed; for example, cancer-associated fibroblasts
reduce T-cell responses and exert immunosuppressive effects through
the production of the extracellular matrix, CXCL12, TGFβ and IL-6
(30–33).
Patients with CRC exhibit varying responses to
different treatment regimens based on clinical stage. The prognosis
of patients generally worsens as the cancer stage advances,
particularly if the cancer is initially diagnosed at an advanced
stage, with patients with early-stage CRC typically experiencing
more favorable outcomes (34,35).
For certain early-stage patients, there is no need for adjuvant
chemotherapy and the intervals of postoperative follow-up
surveillance can be adjusted appropriately. However, there are a
few patients with early-stage CRC (stage I and stage II) that are
at a high risk of recurrence and distant metastasis, resulting in a
poorer prognosis, and this is related to the T stage, particularly
T3 and T4 (36). Currently,
prediction models for the prognosis of these patients with
early-stage CRC are limited. In the present study, differential
analyses were performed on hot and cold MSS CRC tumors using
digital spatial profiling (DSP) and mass spectrometry (MS).
Combined with CRC genomic expression profile data from The Cancer
Genome Atlas (TCGA) database, a predictive risk model for the
prognosis of early-stage CRC was developed, which may have
potential guiding significance for treating early-stage CRC in the
clinic.
Materials and methods
Patients
A total of 60 patients with MSS CRC, diagnosed
between January 2010 and December 2012, were retrospectively
enrolled in the present study. The clinicopathological data are
shown in Table SI. The inclusion
criteria were as follows: i) Patients who underwent surgical
treatment at The Second Affiliated Hospital, Zhejiang University
School of Medicine (Hangzhou, China), and were diagnosed with CRC
by pathological, immunohistochemical and clinical examination; ii)
patients with surgical specimens still available for paraffin
sectioning; and iii) patients with complete case data and complete
pathological data. The exclusion criteria were as follows: i)
Patients suffering from primary tumors other than CRC or ii)
patients undergoing primary lesion resection in an external
hospital. The formalin-fixed paraffin-embedded (FFPE; fixed in 10%
formalin at room temperature for 24–48 h) tissue sections (5 µm)
were used for MS and DSP. Information on 378 patients with CRC with
complete prognostic data was obtained from TCGA (https://cancergenome.nih.gov/; data were downloaded on
July 27, 2023), and the entire cohort was randomly divided into the
training cohort and the validation cohort at a ratio of 1:1 using R
(version 4.3.0; http://www.r-project.org/) (Table SII).
MS-based proteomics
The proteomics data were obtained from our in-house
CRC proteomics database. FFPE samples from patients were punched
(weight range: 0.8–1.0 mg; diameter: 1.5 mm) using a Manual Tissue
Arrayer MTA-1 (Beecher Instruments, Inc.), after which they were
assessed to confirm that they contained both tumor tissue and
stromal tissue with the guidance of hematoxylin and eosin (H&E)
staining (10% hematoxylin staining for 5 min, 1% eosin solution
staining for 2 min, at room temperature with a light microscope) by
two senior pathologists. Pressure cycling technology coupled with
data-independent acquisition (PCT-DIA) analysis of FFPE tissues was
performed as described previously (37,38).
Briefly, after dewaxing, rehydration and hydrolysis, FFPE tissues
were digested using LysC and trypsin (Hualishi Tech. Ltd.)
(39) with PCT assistance. Purified
peptides were analyzed using an LTQ Orbitrap XL mass spectrometer
(Thermo Q Exactive™ HF; Thermo Fisher Scientific, Inc.). DIA data
were analyzed using DIA-NN software (version 1.7.4) (40).
DSP
Spatially resolved quantitation of 59
immunologically relevant proteins (including three normalization
controls and three negative controls) were measured using the DSP
platform (NanoString Technologies, Inc.; Table SIII). Previously prepared FFPE
tissue microarray slides were stained with immunofluorescent
antibodies to facilitate the identification of tissue morphology:
Pan-cytokeratin (PanCK; 1:40; cat. no. NBP2-33200; Novus
Biologicals, LLC; staining for 30 min at room temperature) for
epithelial cells, CD45 (1:40; cat. no. NBP2-34528; Novus
Biologicals, LLC; staining for 30 min at room temperature) for
leukocytes, and SYTO13 (1:10; cat. no. S7575; Thermo Fisher
Scientific, Inc.; staining for 15 min at room temperature) for
nuclei. In each tissue core, at least one circular region of
interest (ROI; measuring 300 µm in diameter) of cancerous tissue
and one ROI of stromal tissue were selected. Upon exposure to
ultraviolet light, the barcoded oligonucleotides corresponding to
the 59 aforementioned antigen targets were released. They were
collected via microcapillary aspiration and then dispensed into a
96-well plate. Digital counting was performed with the nCounter
system (GeoMx DSP Control Center using the Data Analysis module
V.2.4.0.421; NanoString, Inc.) and the data were normalized to
internal controls.
Data processing
Only patients with CRC with adequate prognostic data
were extracted from TCGA data. Log2 transformation using
R was used to process raw microarray data. The DSP and MS result
data were standardized and de-batched using R.
Identification of hot and cold
tumors
Tumor-infiltrating lymphocytes (TILs) of MSS CRC
tumors were assessed by three senior pathologists using
H&E-stained slides. A total of 60 patients were enrolled and
divided into two groups: Cold CRC group (37 patients, TIL count
≤5%) and hot CRC group (23 patients, TIL count ≥20%).
Identification of DEPs between hot and
cold tumors
The DEPs from the DSP cohorts and the MS cohorts
between cold and hot tumors were analyzed using the Limma package
(41) in R, and P<0.05 and
|log2-fold change|>0.5 were set as the cutoff
criteria.
Construction and validation of the
prognostic model
Firstly, DEP IDs were converted into gene IDs to
obtain differentially expressed genes (DEGs). Subsequently, the R
package ‘survival’ (https://cran.r-project.org/web/packages/survival/index.html)
was used to further construct the prognostic model. The prognostic
value of each DEG was identified using univariate Cox regression
analysis from R package. Next, LASSO regression analysis revealed
potential risk genes and established an optimized polygenic risk
score model. In the present study, bioinformatics software (X-Tile,
3.6.1) (42) was applied to
identify the most optimal outcome-based cut-off value of the risk
score. This method provides a graphical presentation of substantial
subpopulations and presents the discovery of population cut-points
based on biomarker expression. On the basis of this, the TCGA
cohorts were divided into two groups (low-risk and high-risk
groups). The performance and effectiveness of the model were
assessed by Kaplan-Meier curve analysis and receiver operating
characteristic (ROC) curve analysis. Furthermore, univariate and
multivariate Cox regression analyses were performed with the risk
scores as the independent variable. In addition, the
clinicopathological features, including sex, age, pathological T
stage, pathological N stage, pathological M stage and clinical
stage, were divided into two groups, and Kaplan-Meier survival
analysis was performed for each subgroup.
Establishment of a nomogram
The independence of the prognostic signature was
assessed using univariate and multivariate Cox analyses in
conjunction with clinical factors, including age and sex. The
nomogram was established using the package ‘rms’ (https://hbiostat.org/r/rms/). Additionally, ROC curve
analysis was performed to assess the prognostic value of the
nomogram for predicting overall survival (OS).
Immune infiltration and immune
checkpoint genes
The R package Estimation of STromal and Immune cells
in MAlignant Tumor tissues using Expression data (ESTIMATE;
http://bioinformatics.mdanderson.org/estimate/rpackage.html)
was used to calculate the immune score, stromal score and ESTIMATE
score between the high-risk group and the low-risk groups of
patients with stage II CRC in the data obtained from TCGA.
CIBERSORT (https://cibersortx.stanford.edu/) was used to
calculate the proportions of immune cells. In addition, the
relationships between the prognostic model and 15 important immune
checkpoint genes were also studied using R.
Statistical analysis
SPSS Statistics version 22.0 (IBM Corp.) and R
version 4.3.0 were used for statistical analysis. The Wilcoxon
rank-sum test was used for comparison of two groups. Gene Ontology
(GO) enrichment analysis and gene set enrichment analysis (GSEA)
were performed using the R package clusterProfiler (https://bioconductor.org/packages/release/bioc/html/clusterProfiler.html)
with a Fisher's exact test, and the P-values were adjusted using
the Benjamini-Hochberg method. *P<0.05 was considered to
indicate a statistically significant difference.
Results
DSP and MS-based proteomics analysis
for identification of DEPs between hot and cold MSS CRC tumors
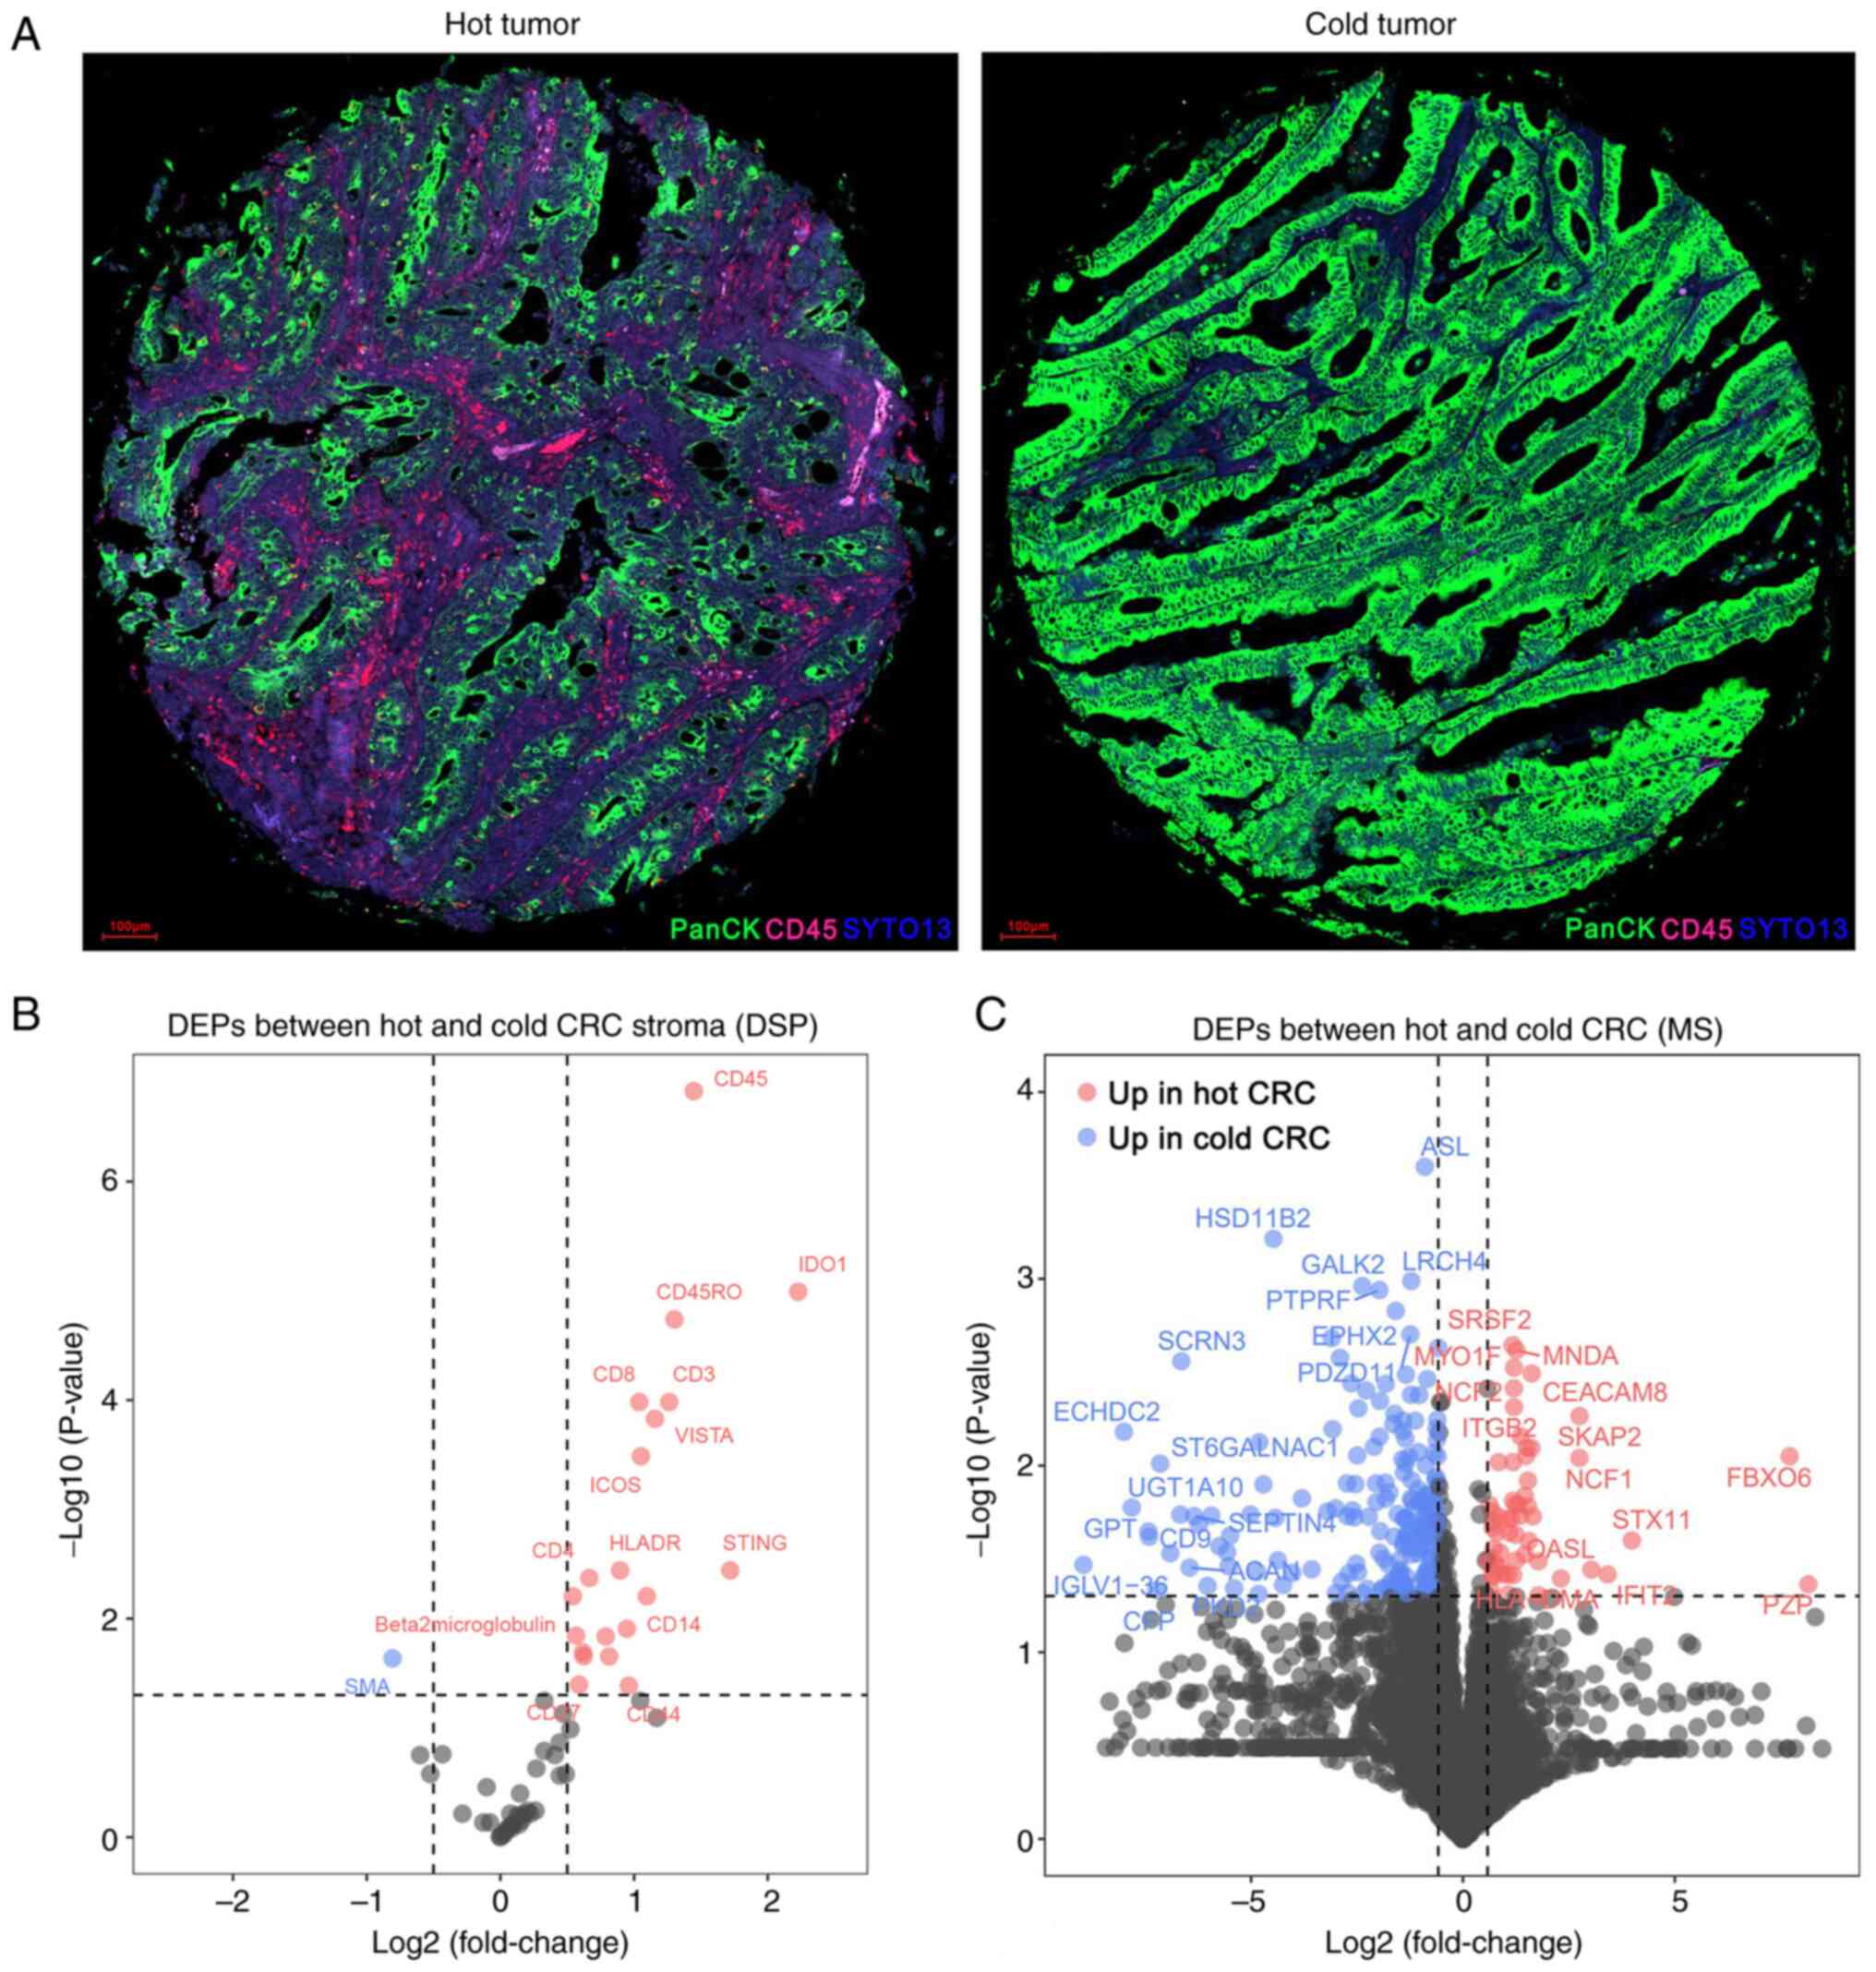
A total of 60 patients were enrolled and divided
into two groups: The cold CRC group (37 patients, TIL count ≤5%)
and the hot CRC group (23 patients, TIL count ≥20%).
To evaluate the immune features of the TME, DSP
analysis was performed on the 60 primary MSS CRC specimens. Based
on the tumor (PanCK) and stroma (CD45) compartments, ROIs were
identified (Fig. 1A). Comparing the
hot CRC group with the cold CRC group: 20 upregulated proteins and
one downregulated protein were identified (Fig. 1B; Table
SIV).
Next, MS-based proteomics analysis was used to
further identify DEPs between the two groups. As shown in Fig. 1C and Table SV, 57 proteins were upregulated and
191 proteins were downregulated in the hot CRC group compared with
in the cold CRC group.
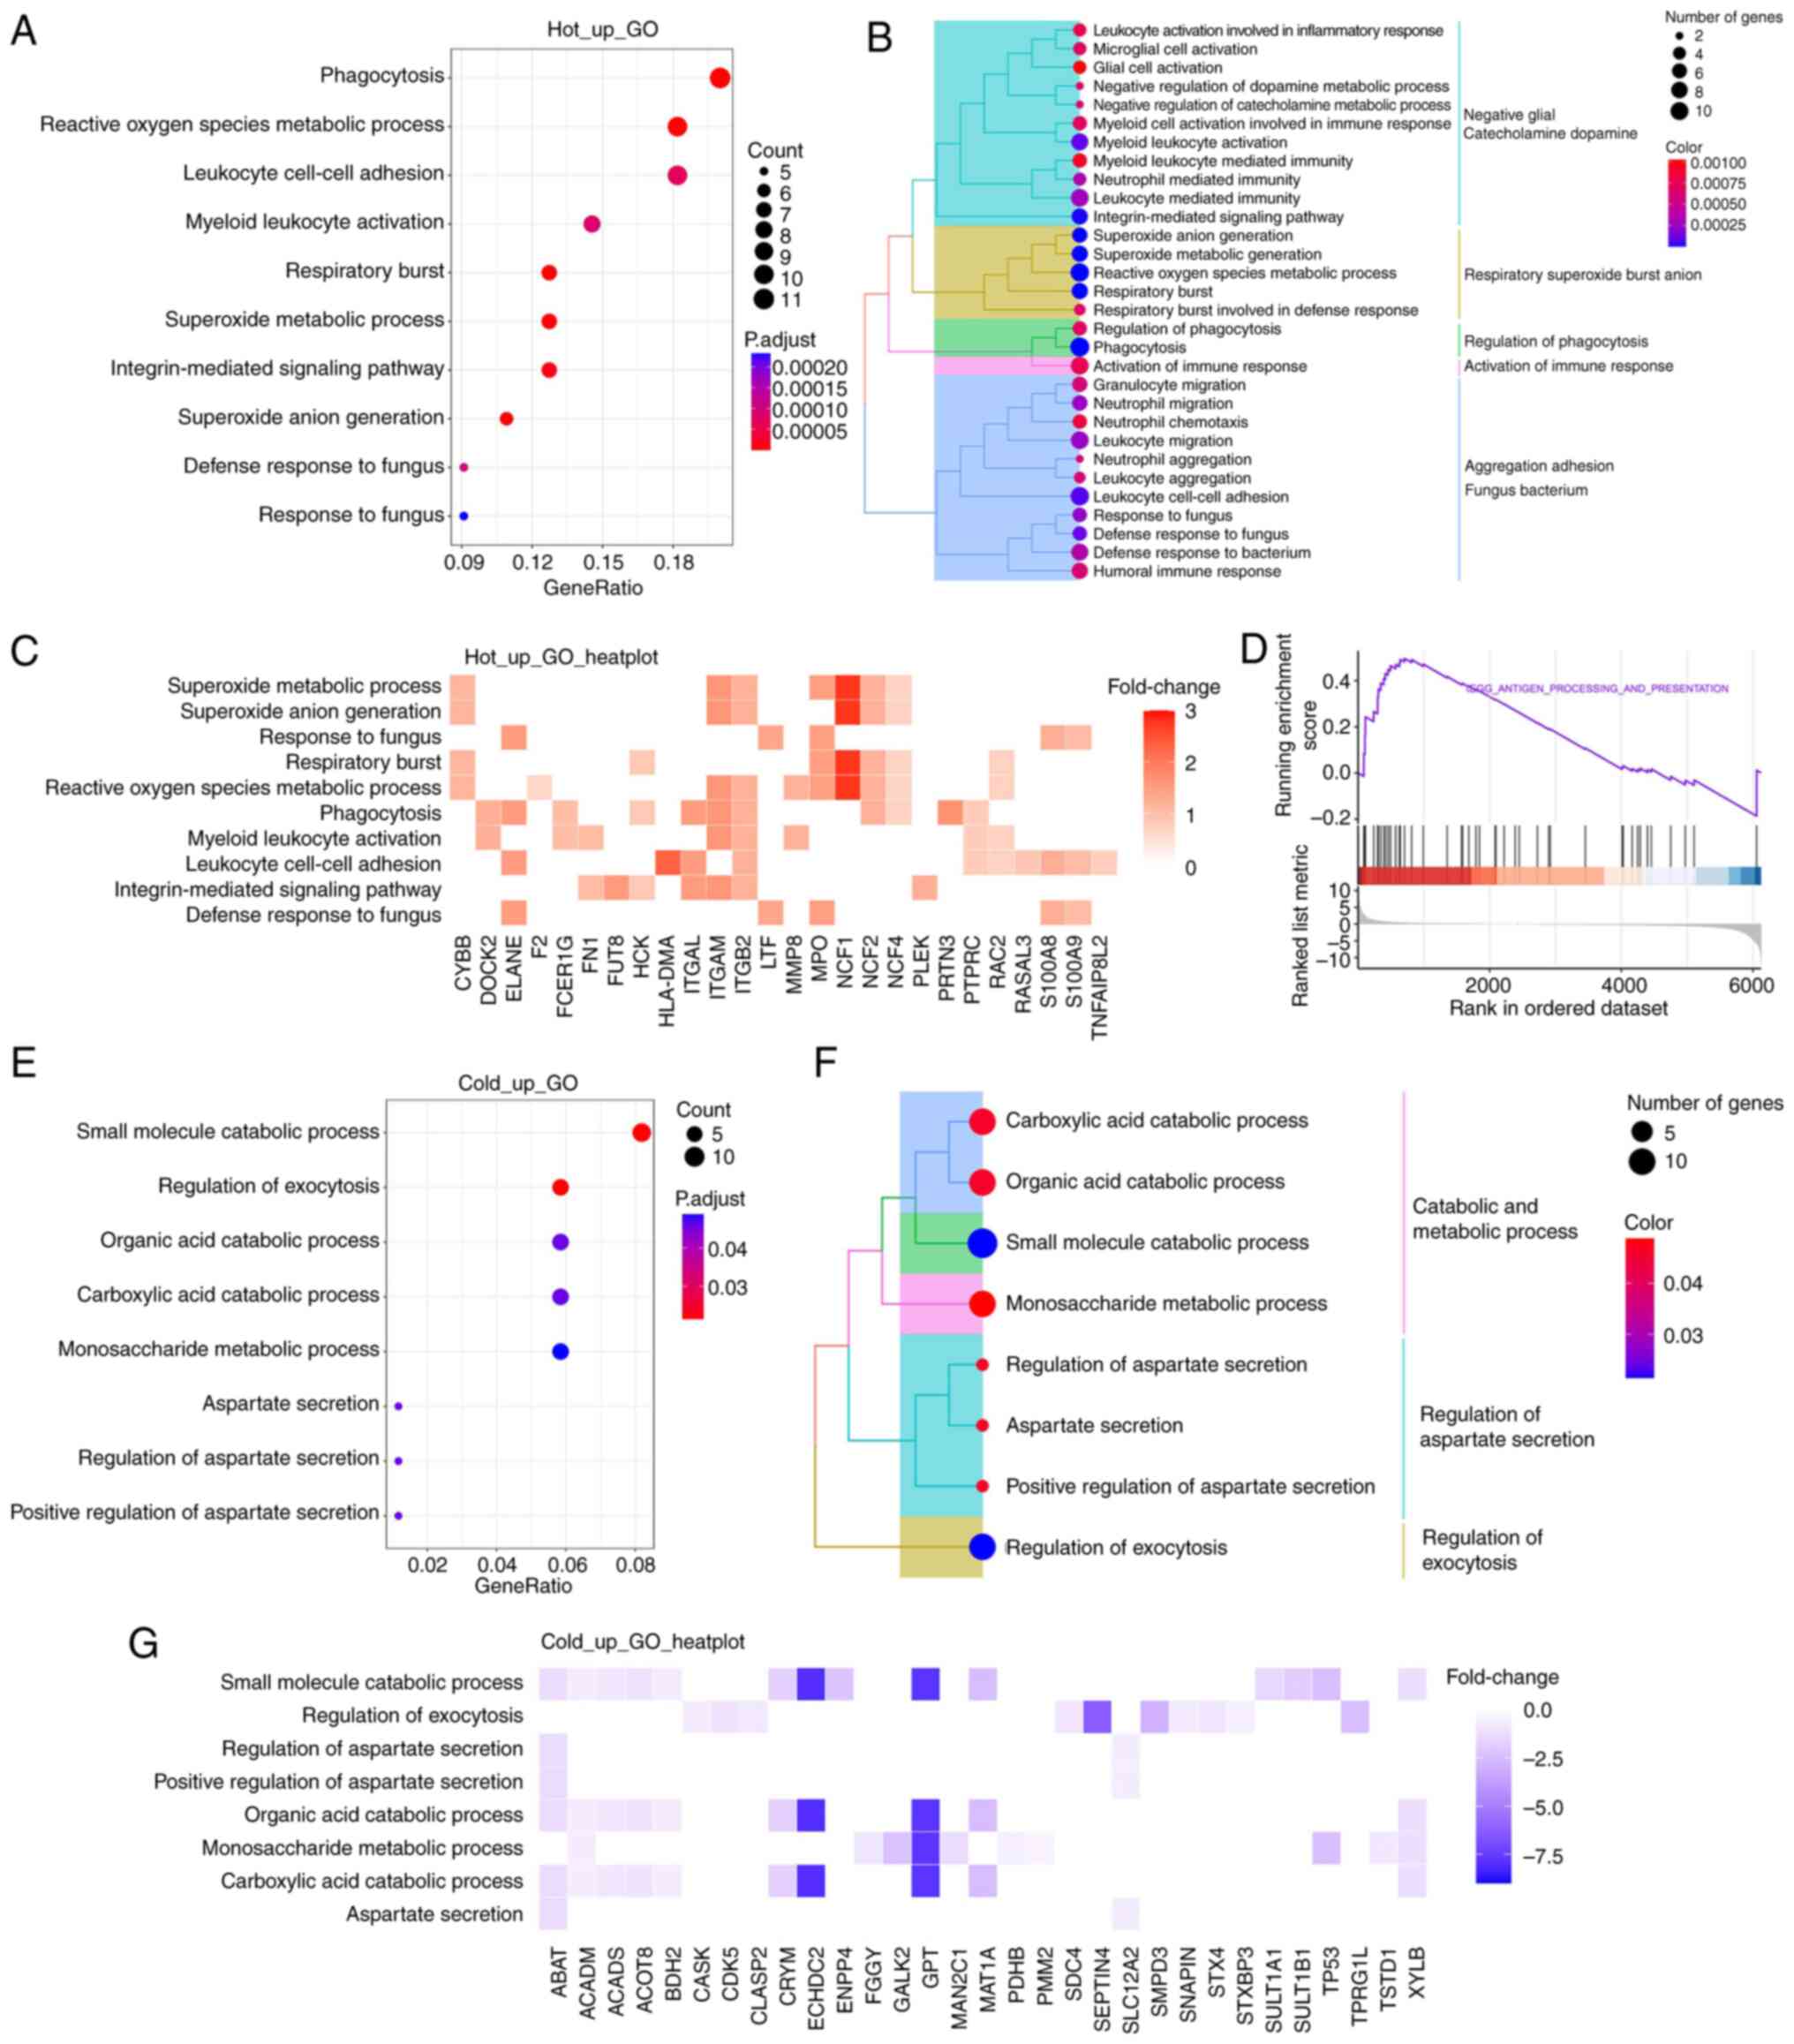
Functional enrichment analysis reveals
the different functional pathways between hot and cold CRC
To gain a more comprehensive understanding of the
functional significance of DEPs between the two groups, GO
enrichment analysis was performed on the MS proteomics data. As
shown in Fig. 2A, the upregulated
proteins were primarily involved in biological processes, such as
‘phagocytosis’, ‘myeloid leukocyte activation’ and
‘integrin-mediated signaling pathway’. To show more specific items
in the biological processes, tree diagrams were employed, which
revealed that most items were related to immune response (Fig. 2B). Neutrophil cytosol factor (NCF)1
was one of the most upregulated proteins that contributed to these
biological processes (Fig. 2C), as
well as NCF2 and NCF4, which belong to the NADPH oxidase complex.
Additionally, integrin family members, including ITGAL, ITGAM and
ITGB2, were upregulated and were involved in the aforementioned
biological processes. Furthermore, GSEA revealed that the antigen
processing and presentation pathway was prominently upregulated in
hot CRC tissues (Fig. 2D).
The downregulated proteins were primarily involved
in the various small molecule catabolic processes, such as ‘organic
acid catabolic process’, ‘carboxylic acid catabolic process’ and
‘monosaccharide metabolic process’ (Fig. 2E and F). Enoyl coenzyme A hydratase
domain-containing 2 and glutamate-pyruvate transaminase were the
most significantly downregulated proteins of those involved in
‘small molecule catabolic process’ (Fig. 2G).
Construction and validation of a
prognostic risk model of the eight-gene signature
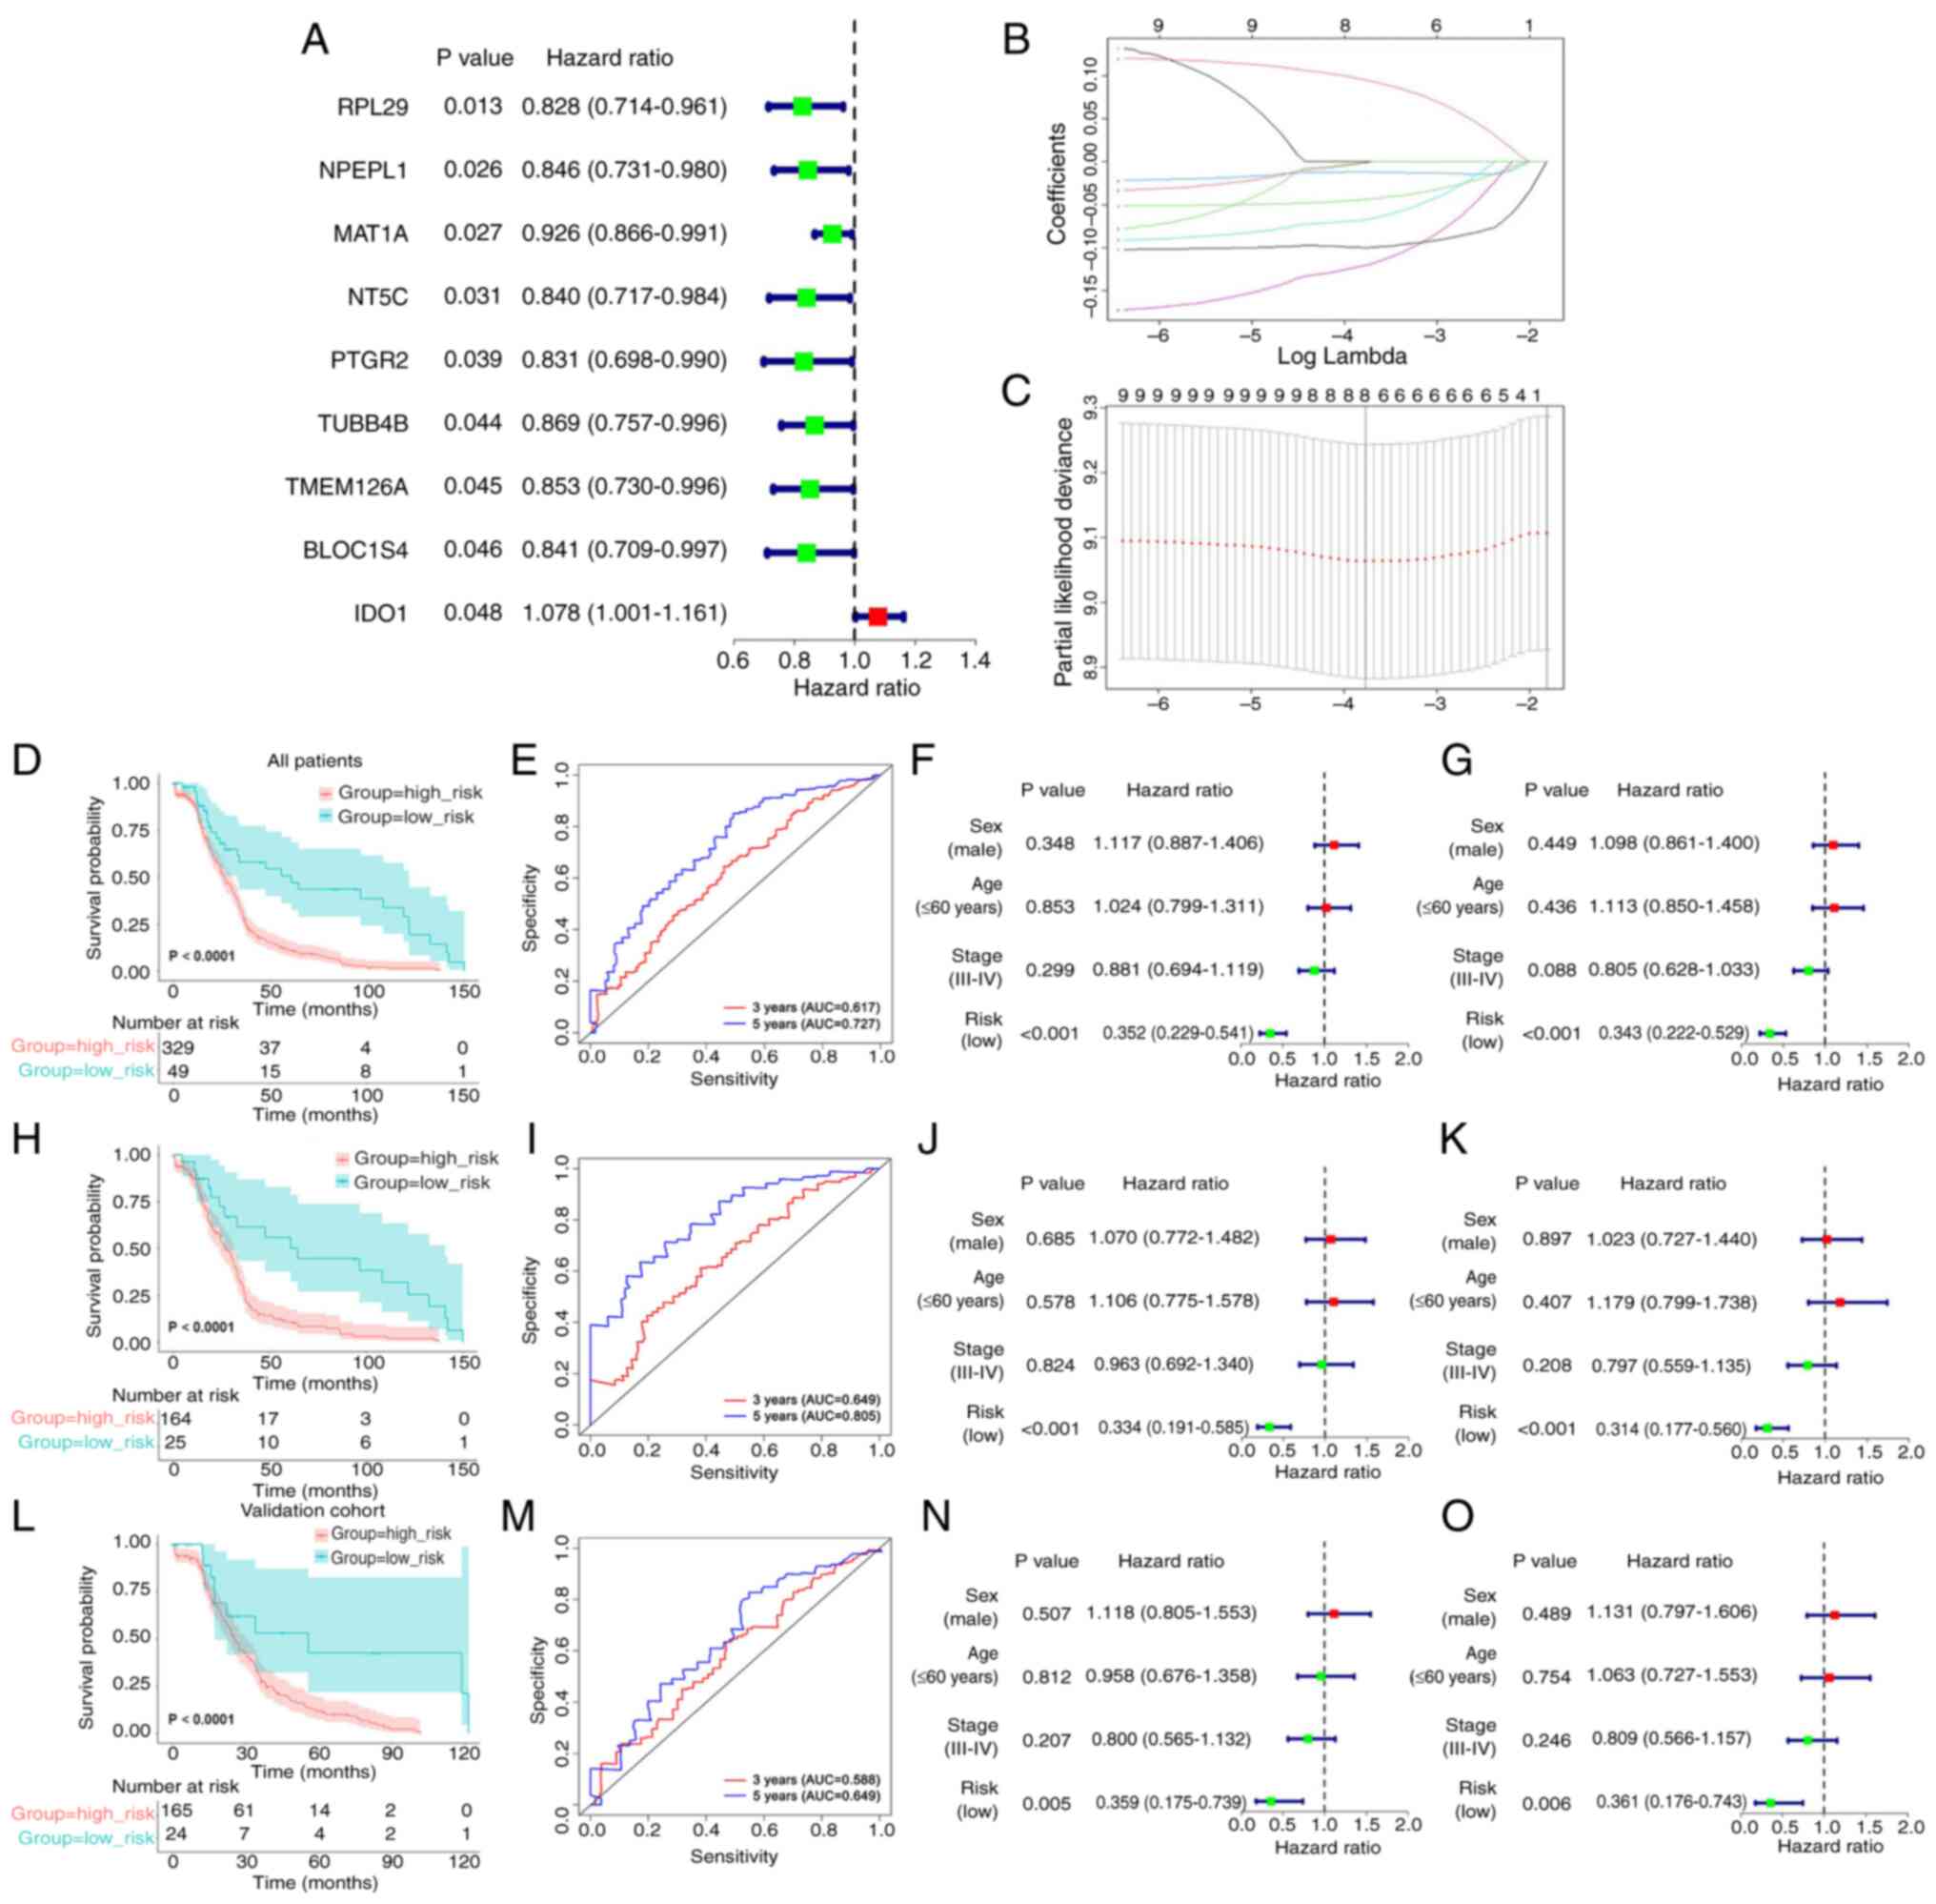
The protein IDs of the DEPs obtained from
differential analysis of the DSP- and MS-based proteomics data were
converted into gene IDs. Notably, some protein IDs matched with
multiple gene IDs and a total of 274 DEGs were identified (Table SVI). Univariate Cox regression
analysis revealed that nine genes were markedly associated with
prognosis in 189 patients from the data obtained from TCGA in the
training cohort (Fig. 3A).
To guarantee the stability and viability of the
clinical prognosis, eight genes (IDO1, MAT1A, NPEPL1, NT5C,
PTGR2, RPL29, TMEM126A and TUBB4B) were identified after
LASSO Cox analysis, which was used to further narrow the list of
effective genes (Fig. 3B and C).
Based on the products of mRNA expression levels and relative
coefficients of each gene in the LASSO regression, the following
predictive model was developed: Risk score=0.0968736 ×
IDO1−0.0445986 × MAT1A−0.0119460 ×
NPEPL1−0.0684733 × NT5C−0.1227449 ×
PTGR2−0.0994621 × RPL29−0.0026656 ×
TMEM126A−0.0018182 × TUBB4B.
To evaluate the validity of the prognostic model,
the risk score, as determined by the eight-gene signature was
calculated, and the most optimal cut-off value for the 189 patients
in the training cohort from TCGA was identified with X-tile
software. According to the most optimal cut-off value of the risk
score (−2.70), the training cohort, the validation cohort and the
full TCGA dataset were divided into low- and high-risk groups.
Subsequently, through Kaplan-Meier analysis, it was noted that
there was a difference between the two groups; the survival time
was notably reduced in the high-risk score group (Fig. 3D, H and L). Moreover, the
time-dependent ROC curves were plotted to verify that the
prognostic model was accurate (Fig. 3E,
I and M). Subsequently, the risk score was combined with other
clinicopathological features, including sex, age and clinical
stage, for the univariate (Fig. 3F, J
and N) and multivariate (Fig. 3G, K
and O) Cox analyses to explore its independence. Taken
together, the results demonstrated that the risk score may be an
independent prognostic factor.
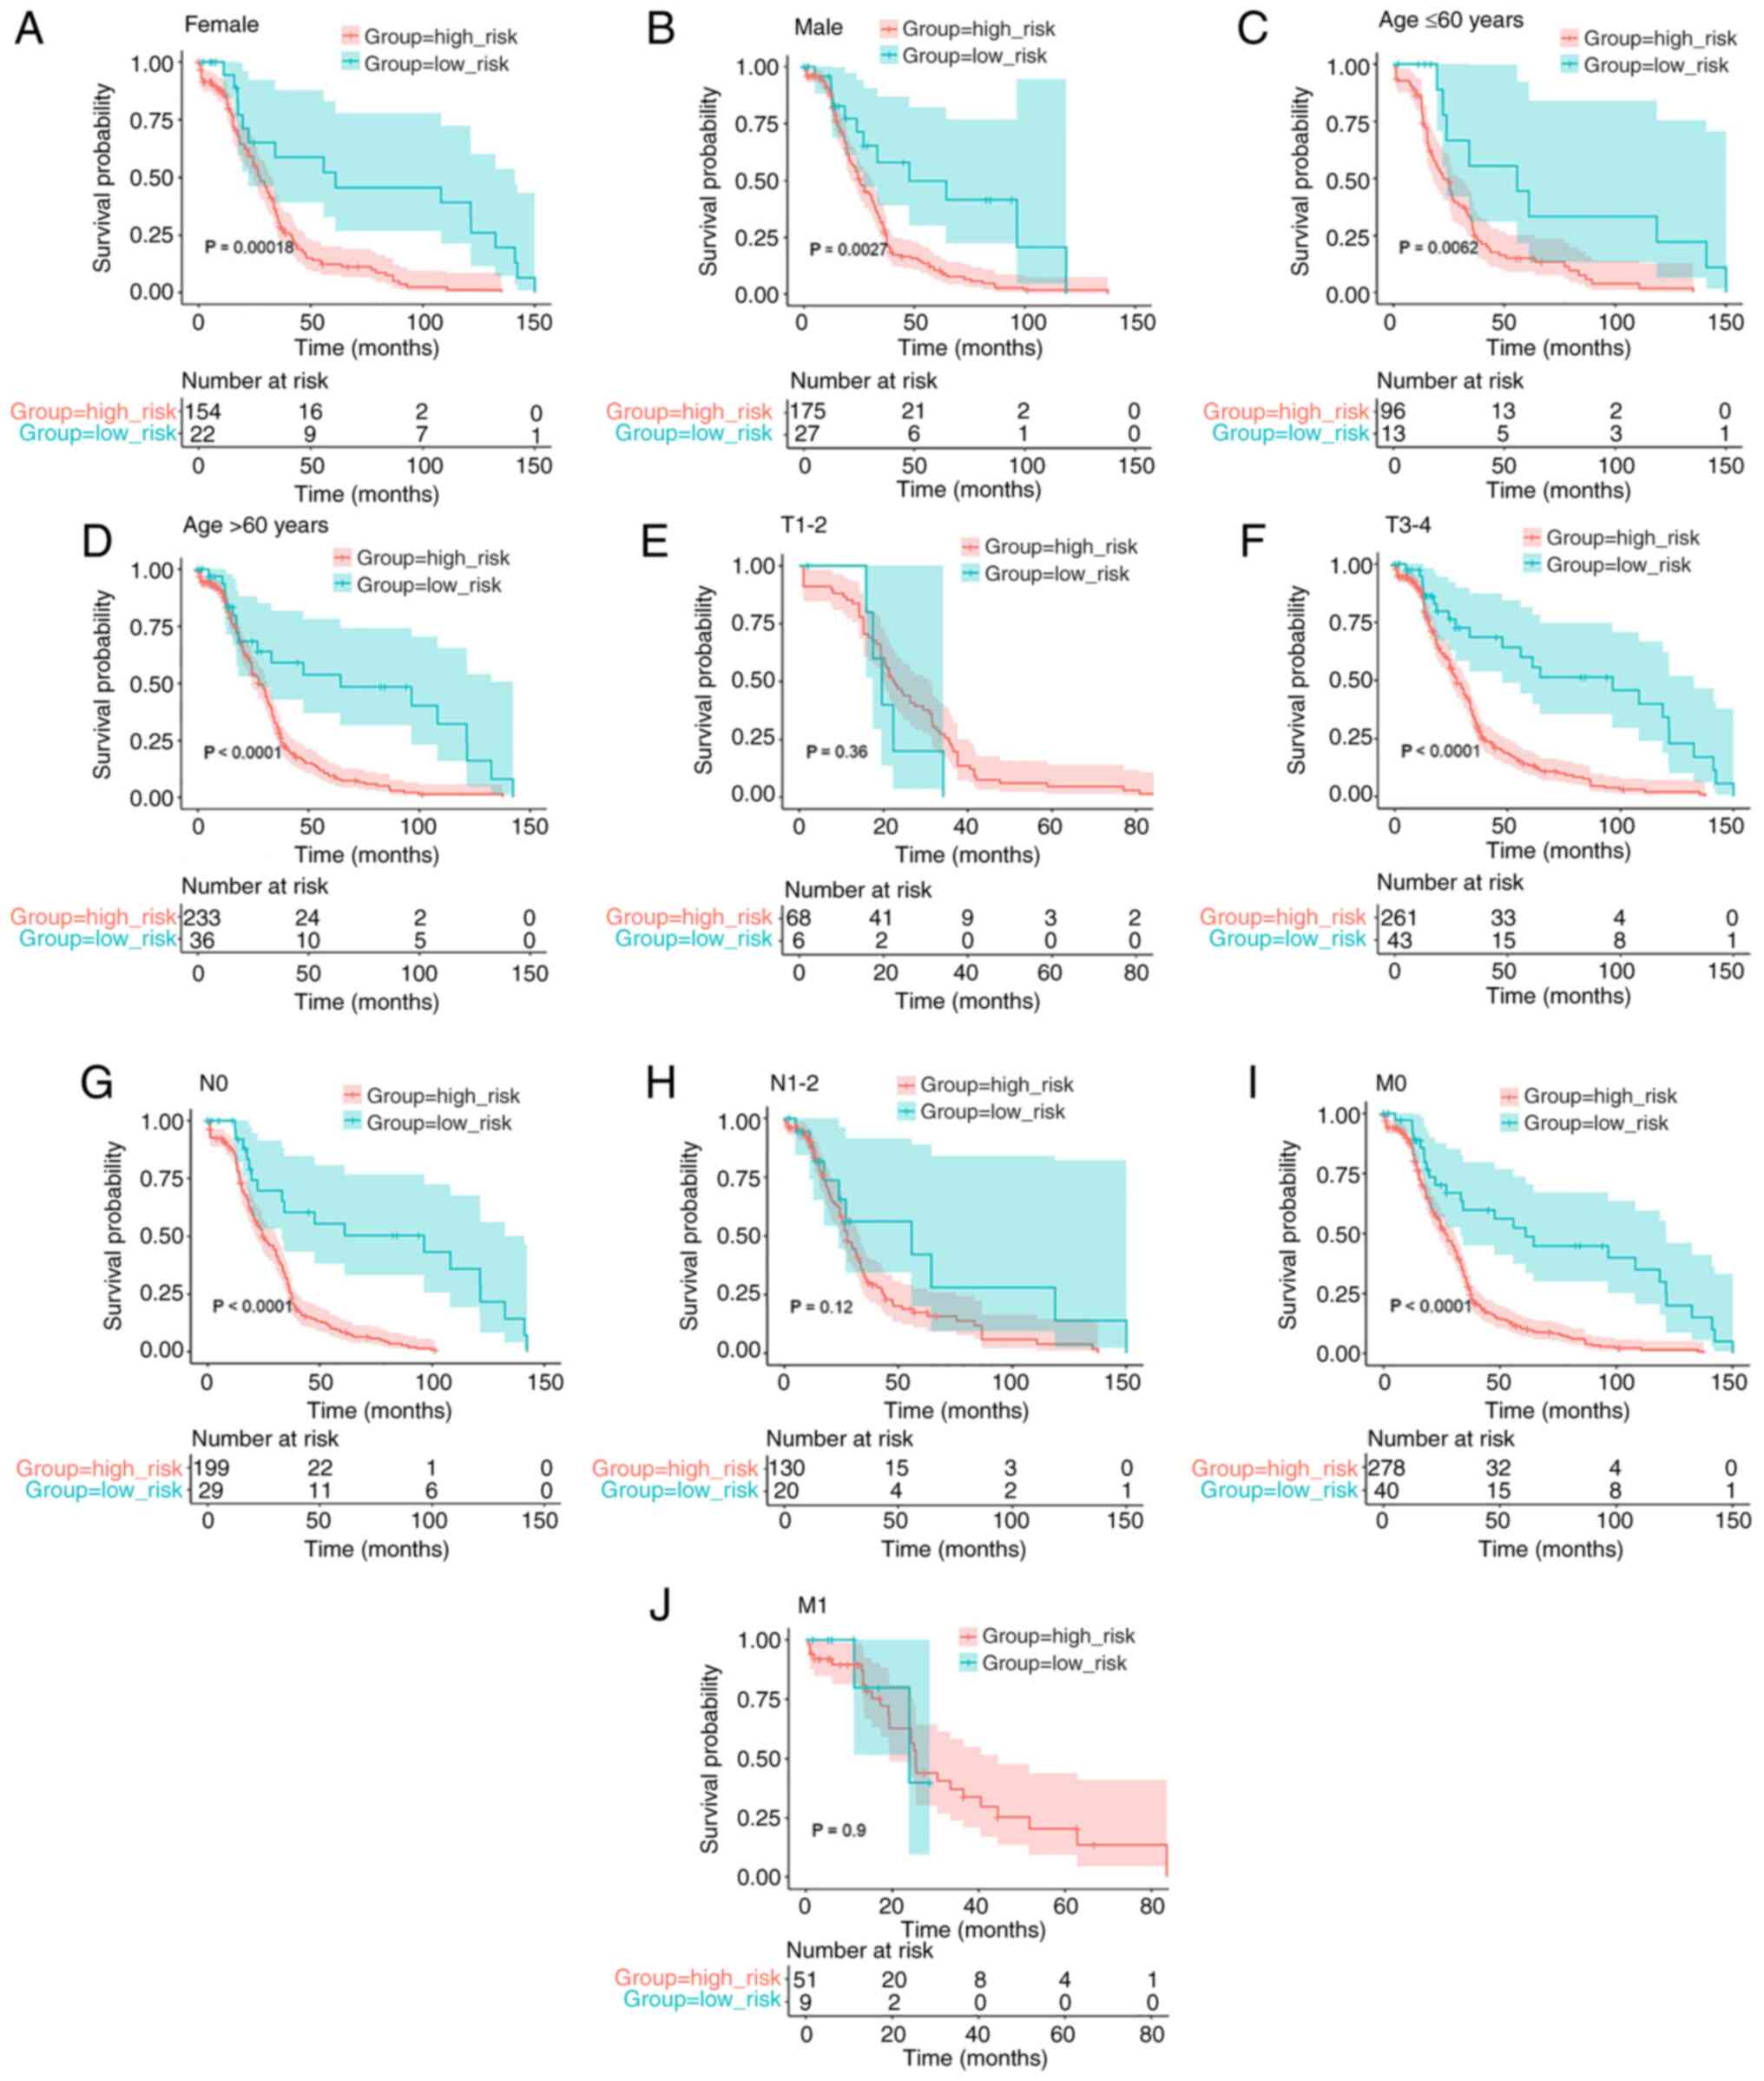
Kaplan-Meier analysis shows an
association between the risk score of the eight-gene signature and
OS
To ensure that the prognostic model was accurate,
Kaplan-Meier analysis was used to assess the predictive ability of
the model stratified by sex, age (≤60 years or >60 years),
pathological T stage (T1-2 or T3-4), pathological N stage (N0 or
N1-2), and pathological M stage (M0 or M1) on the data obtained
from TCGA. The survival analysis indicated an association between
lower risk scores and improved OS rates in female (P=0.00018;
Fig. 4A) and male (P=0.0027;
Fig. 4B) patients, patients aged
≤60 years (P=0.0062; Fig. 4C) and
>60 years (P<0.0001; Fig.
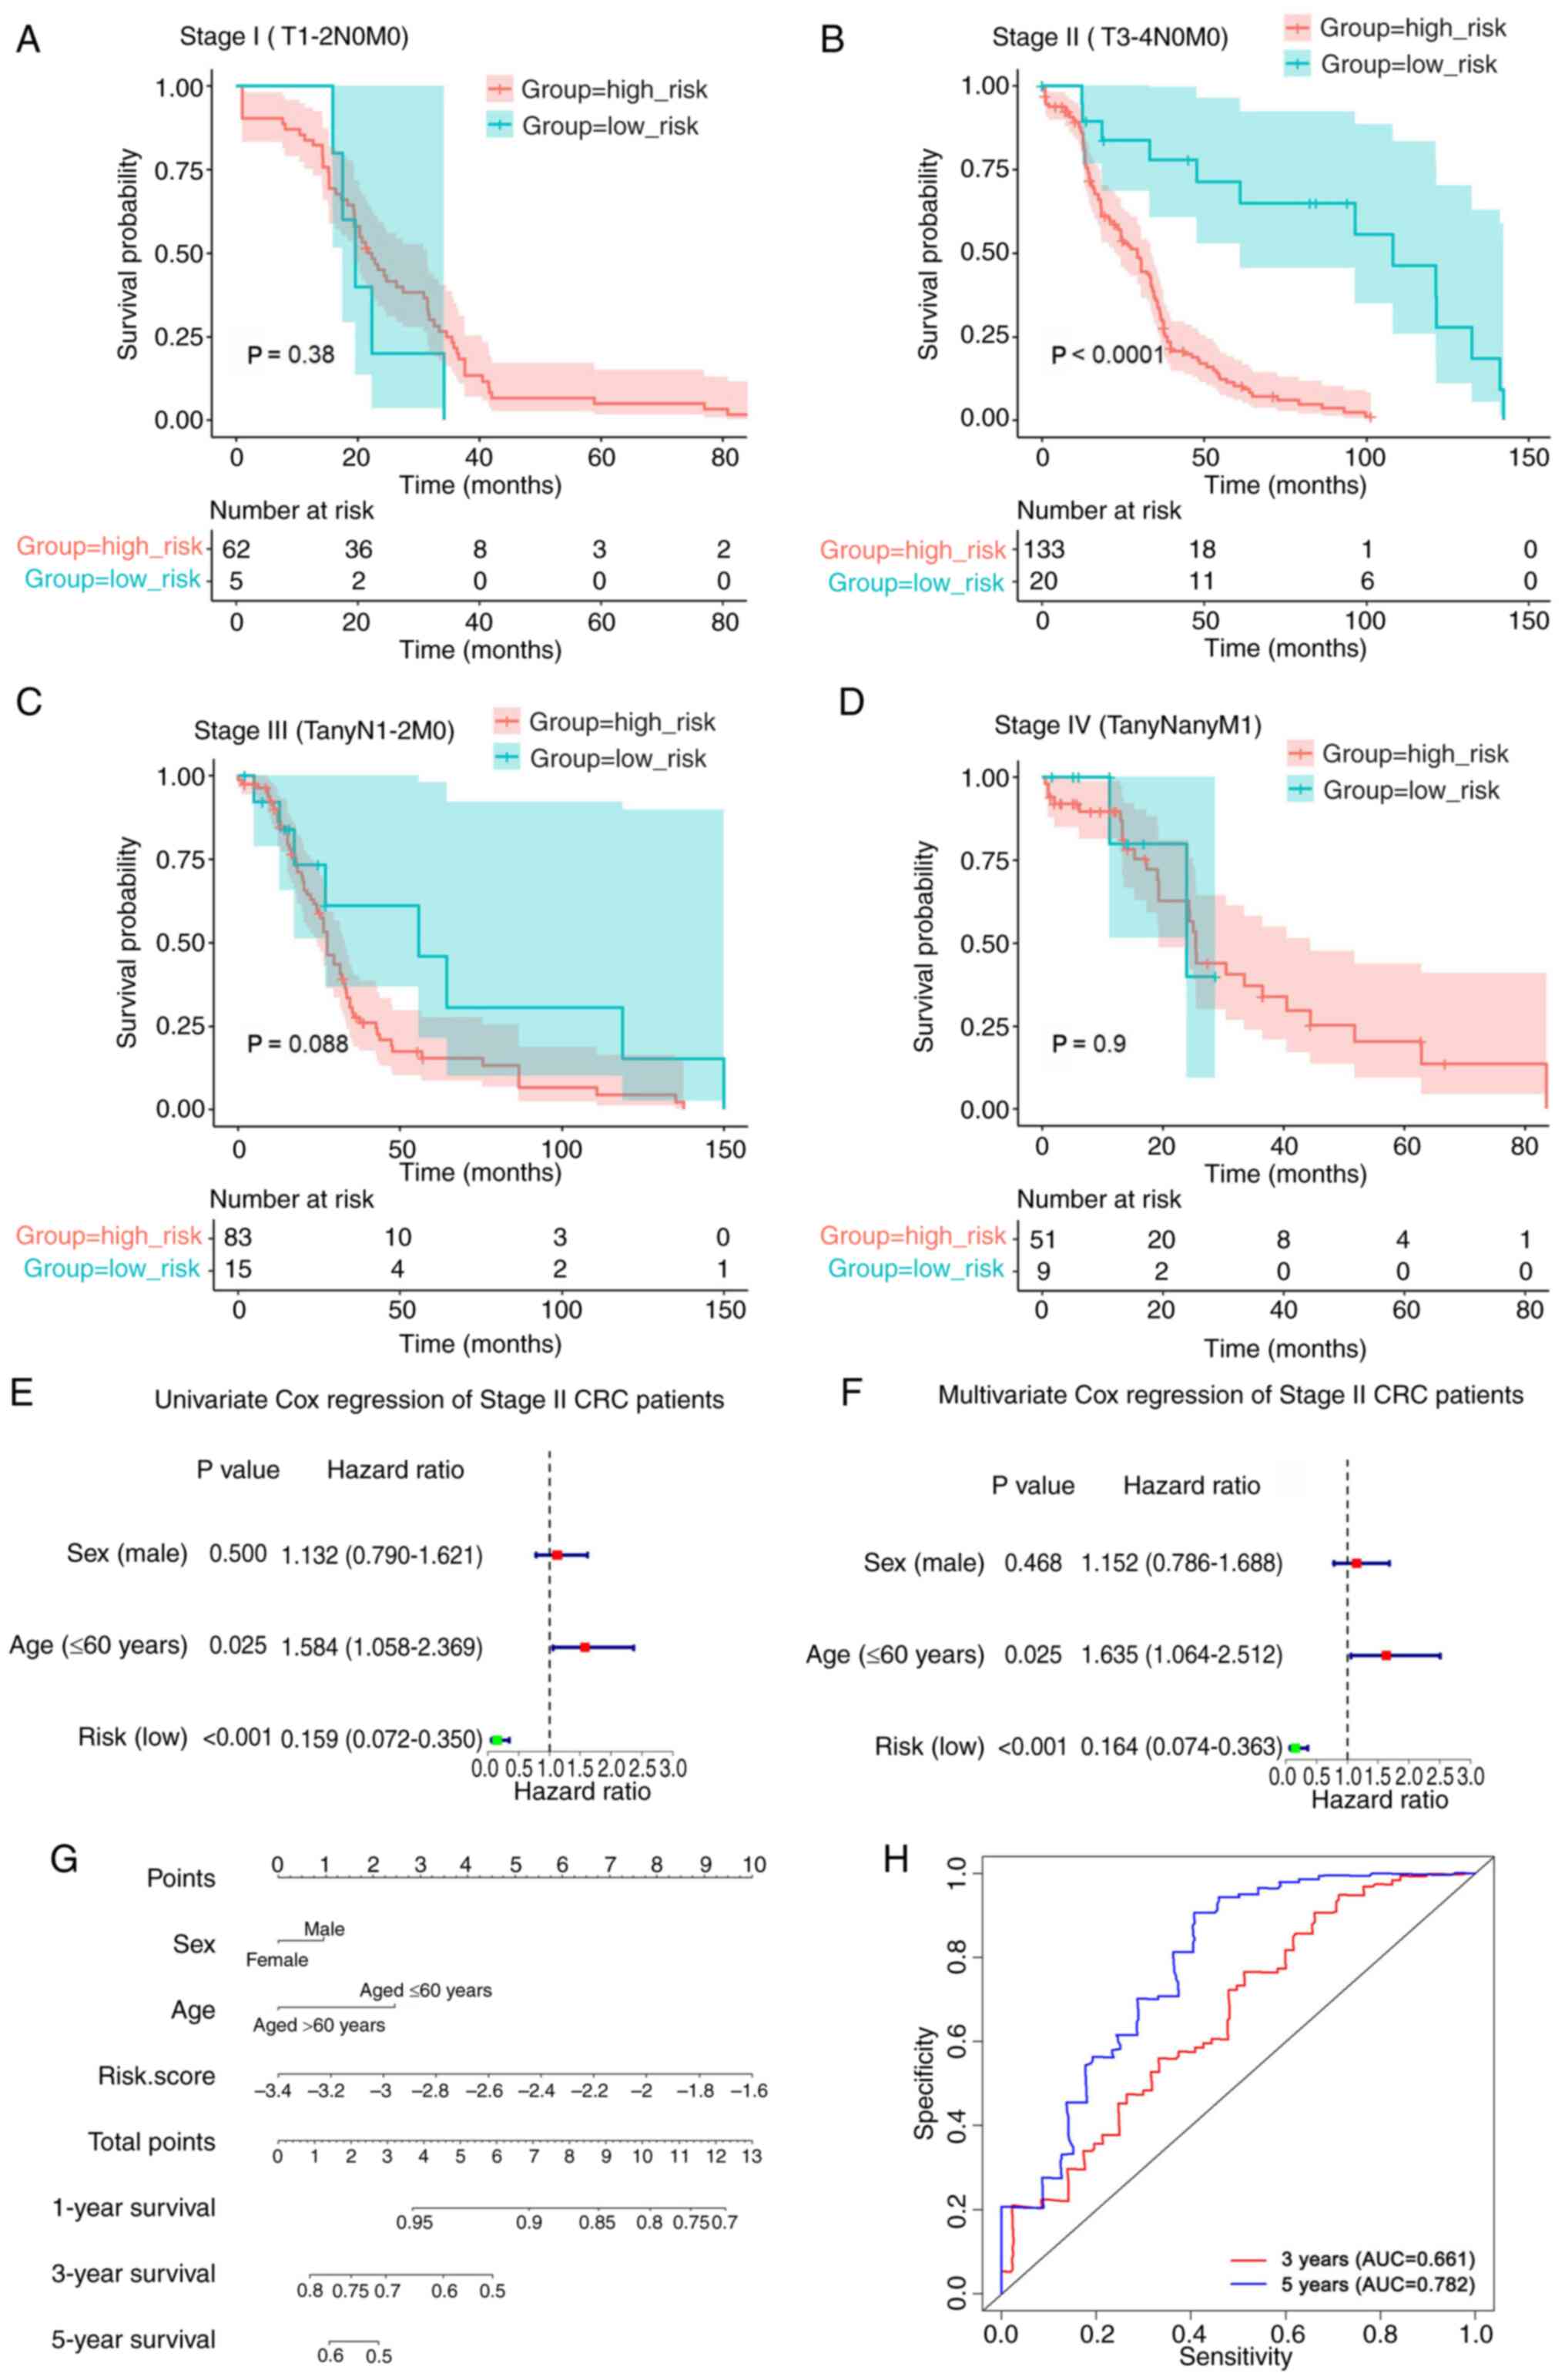
4D), and patients with T3-4 (P<0.0001; Fig. 4F), N0 (P<0.0001; Fig. 4G) and M0 (P<0.0001; Fig. 4I) tumors. However, there was no
association between the risk score of the eight-gene signature and
prognosis in the T1-2 (P=0.36; Fig.
4E), N1-2 (P=0.12; Fig. 4H),
and M1 (P=0.9; Fig. 4J)
subgroups.
Risk score of the eight-gene signature
serves as an independent prognostic indicator in patients with
stage II CRC (T3-4N0M0)
To further examine the effect of the risk score on
the prognosis of different stages of CRC, Kaplan-Meier analysis was
used to examine the association between the risk score and OS in
the patients with stage I (T1-2N0M0), stage II (T3-4N0M0), stage
III and stage IV CRC in the data obtained from TCGA. As shown in
Fig. 5A-D, the results indicated
that a high-risk score was associated with a poorer prognosis in
patients with stage II (T3-4N0M0) CRC, but not in patients with
stage I (T1-2N0M0), stage III or stage IV CRC. In addition,
according to the AJCC 8th edition staging system of CRC (43), patients with M1 tumors (Fig. 4J) were classified as clinical stage
IV (Fig. 5D).
By comparing the clinical characteristics, such as
age and sex, univariate and multivariate Cox regression analyses
were performed to investigate the independence of the prognostic
model for patients with stage II CRC (T3-4N0M0) (Fig. 5E and F). The findings revealed that
the risk score and age were highly significant prognostic
indicators. To provide a more accurate prognosis for patients with
stage II CRC (T3-4N0M0), a nomogram was established using the risk
score and several clinicopathological factors, including age and
sex. The concordance index of the nomogram was 0.612, which showed
that the model was accurate in predicting the prognosis of patients
with stage II CRC (T3-4N0M0) (Fig.
5G). The total score can be calculated using the score of each
variable on the point scale of this nomogram and can be used to
determine the probability of survival after 1-, 3- and 5-years.
Furthermore, the predictive validity of the nomogram was assessed
using ROC analysis. As shown in Fig.
5H, the areas under the curve for the prediction of 3- and
5-year OS were 0.661 and 0.782, respectively. Collectively, these
results indicated that the risk score may serve as an independent
prognostic indicator in patients with stage II CRC (T3-4N0M0).
Risk score is associated with the
tumor immune infiltration characteristics in CRC
To determine the difference in immune infiltration
between the high- and low-risk groups, the stromal, immune and
ESTIMATE scores between the high- and low-risk groups in patients
with stage II CRC were used. As shown in Fig. 6A, all three scores were
significantly higher in the high-risk group than in the low-risk
group (all P<0.001).
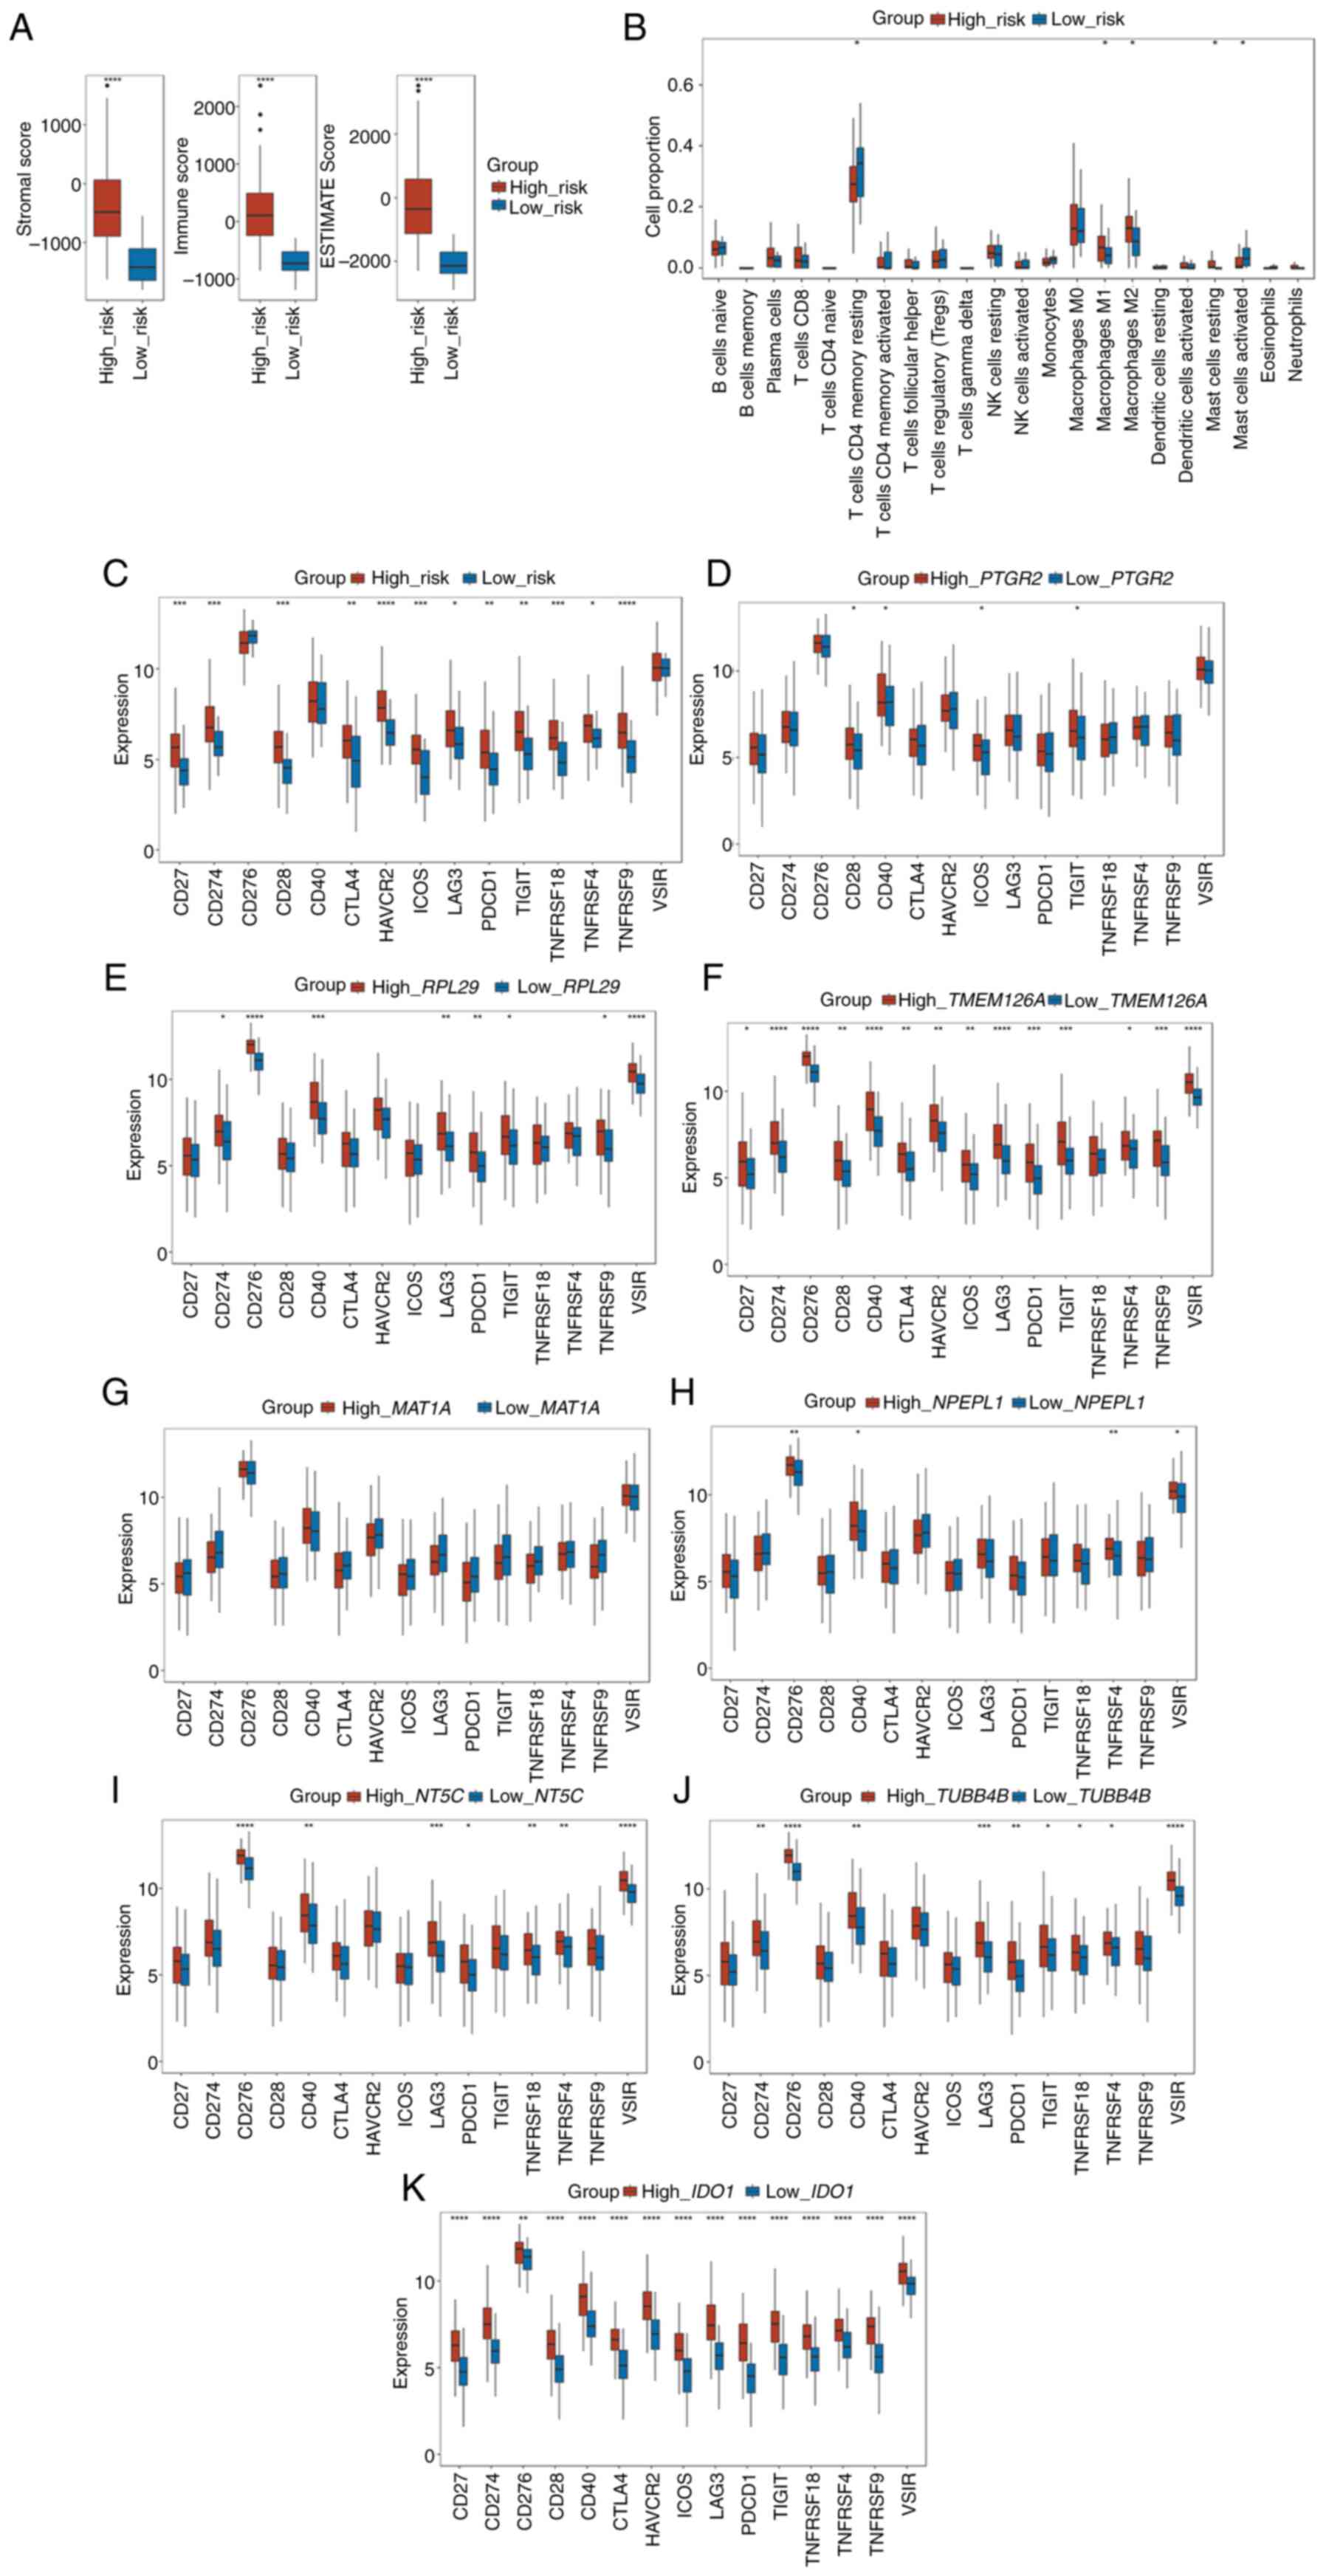 | Figure 6.Risk score is associated with the
tumor immune infiltration characteristics of colorectal cancer. (A)
Box plots of the comparison of the stromal score, immune score, and
ESTIMATE score between the high- and low-risk subgroups. (B) Box
plots of the differences in the proportion of immune cells between
the high- and low-risk subgroups. (C) Box plots of the differences
in the expression of immune checkpoint genes between the high- and
low-risk subgroups. Box plots of the differences in the expression
of immune checkpoint genes between the high- and low-expression
subgroups of (D) PTGR2, (E) RPL29, (F)
TMEM126A, (G) MAT1A, (H) NPEPL1, (I)
NT5C, (J) TUBB4B and (K) IDO1. *P<0.05,
**P<0.01, ***P<0.001, ****P<0.0001. ESTIMATE, Estimation
of STromal and Immune cells in MAlignant Tumor tissues using
Expression data. |
Next, the proportion of 22 types of immune cells
between the high- and low-risk groups of patients with stage-II CRC
was determined using CIBERSORT. According to the results, the
proportion of macrophages (both M1 and M2) and resting mast cells
were positively associated with the risk score, whereas the
proportion of CD4+ memory resting T cells and activated
mast cells were negatively associated with the risk score (Fig. 6B).
Furthermore, the relationship between the risk score
and the expression of 15 key immune checkpoint genes (CD27,
CD274, CD276, CD28, CD40, CTLA4, HAVCR2, ICOS, LAG3, PDCD1, TIGIT,
TNFRSF18, TNFRSF4, TNFRSF9 and VSIR) was explored. The
results illustrated that the expression of 12 immune checkpoint
genes (CD27, CD274, CD28, CTLA4, HAVCR2, ICOS, LAG3, PDCD1,
TIGIT, TNFRSF18, TNFRSF4 and TNFRSF9) were elevated in
the high-risk groups (Fig. 6C).
The relationships between the 15 key immune
checkpoint genes and the eight selected genes in the prognostic
model were next investigated. According to the median expression
level of each gene, the cohort was divided into a high expression
group and a low expression group of each gene. PTGR2
exhibited positive associations with the expression of CD28,
CD40, ICOS and TIGIT (Fig.
6D), whereas RPL29 showed positive associations with the
expression of CD274, CD276, CD40, LAG3, PDCD1, TIGIT,
TNFRSF9 and VSIR (Fig.
6E). As shown in Fig. 6F,
TMEM126A exhibited positive associations with the expression
of all the immune checkpoint genes, except TNFRSF18. MAT1A
showed no relationship with any of the 15 immune checkpoint genes
(Fig. 6G). NPEPL1 was
positively associated with the expression of CD276, CD40,
TNFRSF4 and VSIR (Fig.
6H). NT5C was positively associated with the expression
of CD276, CD40, LAG3, PDCD1, TNFRSF18, TNFRSF4 and
VSIR (Fig. 6I).
TUBB4B was positively associated with the expression of
CD274, CD276, CD40, LAG3, PDCD1, TIGIT, TNFRSF18, TNFRSF4
and VSIR (Fig. 6J). Finally,
IDO1 was positively correlated with the expression of all
the immune checkpoint genes (Fig.
6K). These results demonstrated that differences in tumor
immune infiltration were observed between the high- and low-risk
groups, showing that a high-risk score may be associated with
increased immune cell infiltration.
Discussion
Patients with CRC show differing levels of immune
cell infiltration, and this is directly associated with the
specific immunobiological behaviors of a tumor (44,45).
The most fundamental reason for these differences is the tumor
cells themselves. Thus, in the present study, patients with CRC
were divided into hot and cold groups using immunofluorescent
staining. Using MS, the differences in the expression of several
proteins between hot and cold CRC tumors were examined and
compared.
Compared with in cold CRC tumors, proteins that were
upregulated in hot tumors were primarily enriched in immune-related
pathways, including ‘phagocytosis’, ‘leukocyte cell-cell adhesion’,
‘myeloid leukocyte activation’ and ‘integrin-mediated signaling
pathway’, amongst other processes. This result indicated that the
immune interactions were relatively active in hot tumors. However,
a large number of immune cells present in the TME do not attack the
surrounding tumor cells. Therefore, a relative equilibrium state
may be formed between cancer cells and tumor-infiltrating immune
cells. According to the tumor stroma ROI DSP results, several vital
immune-related proteins exhibited upregulated expression in hot CRC
tumors, such as IDO1, STING, VISTA, PD-L1, 4-1BB and LAG3. The
majority of these upregulated proteins are immune checkpoint
molecules that may serve immunosuppressive functions to maintain a
balance in immune tolerance status. Targeting these proteins may be
a potential approach to disturb this balance and mobilize immune
cells to attack tumor cells.
The protein expression profiles in cold colorectal
tumors were distinct from those in the hot tumors. It was revealed
that metabolism-related proteins were highly expressed in cold
tumors, which may be related to the tumor metabolic
microenvironment. These proteins may assist tumor cells in
overcoming energy barriers and survive in a nutrient-deprived
microenvironment. Moreover, the upregulated expression of SMA, a
common marker of stromal cells (46), was observed in cold tumors. The
stromal components of tumors are closely intertwined, and a barrier
between tumor cells and immune cells is frequently formed (47). However, they do not directly contact
each other, and the immune cells are not activated to attack tumor
cells. Based on this, cold colorectal tumors with minimal immune
cell infiltration exhibit limited sensitivity to immune monotherapy
(48,49). Even though some effective treatments
are available, such as chemotherapy or radiotherapy, which induce
necrosis of tumor cells and antigen exposure, the immune cells and
tumor antigens still do not directly contact the numerous stromal
proteins. Therefore, the therapeutic efficacy of immunotherapy
remains unsatisfactory.
Based on the MS and DSP differential expression
analyses of hot and cold CRC tumors, a novel prognostic model was
established. The model was validated using data from TCGA, and it
was shown to perform well, whether in the training cohort,
validation cohort or the overall TCGA CRC cohort. After subgroup
analysis, it was demonstrated that this model had different
predictive outcomes in different T stages, N stages and M stages.
Compared with the T1-2 stage, the model showed higher predictive
efficacy in patients with T3-4 stage tumors, which indicated that
this model may be more appropriate for later T-stage patients, and
this effect may be due to the fact that the model is based on
comparisons between hot and cold tumors. The prognosis of patients
with T1-2N0M0 CRC was relatively good and the tumor sizes were
somewhat small. The DEGs between cold and hot CRC tumors had little
effect on the differences in clinical outcomes of patients with
T1-2N0M0 CRC. Conversely, the tumor sizes of patients with T3-4
stage CRC were likely larger. Thus, the infiltration of immune
cells contributed more significantly to the biological behaviors of
these tumors, and this model may have better predictive efficacy.
In the N- and M-stage subgroup analysis, improved predictive
efficacy was observed in the N0 or M0 subgroups. It is hypothesized
that there are several risk factors for CRC prognosis. Lymph node
metastasis or distant metastasis may exert a larger weighted
effect; however, this model showed no significant differences
between the N1-2 or M1 subgroups. Taking the aforementioned results
together, it could be proposed that this model may have a better
predictive effect on patients with stage II CRC (T3-4N0M0). It is
worth mentioning that the treatment modalities of chemotherapy or
radiation therapy are very complex, and the treatment information
provided in TCGA database was limited. There might be numerous
types of treatment, such as neoadjuvant chemotherapy, adjuvant
chemotherapy, palliative chemotherapy or concurrent
radiochemotherapy. Furthermore, the dosage, duration and timing of
chemotherapy tended to vary between different patients, and the
information was incomplete and ambiguous. Because of these
confounding factors, the action of the risk score in assessing the
predictive ability of the model stratified by therapy was not
assessed.
Clinically, adjuvant chemotherapy is not routinely
recommended for patients with stage II CRC as there is no evidence
that adjuvant chemotherapy can improve survival for these patients.
However, certain patients with stage II CRC may suffer from
recurrence or distant metastasis, and thus have a poorer prognosis.
At present, there are few prediction models for early-stage CRC. Li
et al (50) reported that
monosaccharide composites of circulating glycans in peripheral
blood may serve as a diagnostic biomarker for early-stage detection
of CRC. Additionally, based on gene expression profiles extracted
from microarray datasets, immune-related or autophagy-related gene
signatures were identified for the prognostic prediction of
patients with early-stage CRC (51,52).
However, the predictive model established in the present study
differed from these previous models in terms of the sources of
data. MS and DSP are both proteomics-based techniques used for
detection and analysis. In almost every physiological process,
proteins are the end products and functional molecules, and are
thus more closely related to functional biological behaviors. In
particular, the results of DSP show the protein expression levels
in the stromal compartments, which is more accurate for the study
of hot and cold tumors. Subsequently, data obtained from TCGA were
used to construct and validate the prognostic model. Thus, the
prognostic model developed was based on multi-omics data, and it
should more accurately reflect the biological reality and is thus a
more comprehensive prediction model.
Based on the results of the present study, patients
with stage II CRC can be divided into high-risk and low-risk
groups. Close monitoring is required for high-risk patients, and
this may result in earlier detection of tumor recurrence and
metastasis. Conversely, regular follow-up surveillance is
sufficient for low-risk patients. This way, it is possible to treat
patients with stage II CRC more accurately and in a more
individualized manner.
Notably, it was revealed that the stromal score and
immune score were markedly higher in the high-risk group of
patients with stage II CRC, and these patients exhibited higher
macrophage cell (both M1 and M2) and resting mast cell
infiltrations, and lower CD4+ memory resting T-cell and
activated mast cell infiltrations in the tumors. The results
demonstrated that the proportions of M1 and M2 macrophages were
both positively associated with the risk score, and were both
increased in the high-risk group. Therefore, it was hypothesized
that there may be a significant difference in macrophage
infiltration between these two groups. This requires more direct
and sufficient evidence, and we aim to further investigate this
aspect in future studies. The present study revealed higher
expression levels of several immunosuppressive checkpoint genes in
the high-risk group, including HAVCR2, CD274, CTLA4, PDCD1,
TIGIT and LAG3. Meanwhile, certain immune-activating
genes were also upregulated in the high-risk groups, such as
TNFRSF9, CD27 (TNFRSF7), CD28, ICOS, TNFRSF18
and TNFRSF4. These may form a balance between immune
suppression and activation. In addition, there was an association
detected between the expression levels of certain genes in the risk
score model and the expression of immune checkpoint genes. In
particular, IDO1 and TMEM126A were positively
associated with a number of immune checkpoint genes. All immune
checkpoint genes were upregulated in the high-IDO1 group,
and most immune checkpoint genes, with the exception of
TNFRSF18, were also upregulated in the high-TMEM126A
group.
In conclusion, the model established in the present
study is based on the differences in protein expression profiles
between hot and cold CRC tumors. The primary objective of this
model was to improve the prediction of patient prognosis. CRC
tumors can be classified into two different immune types, which
have various immune microenvironments, and carry a different risk
of recurrence and metastasis. The proposed model had the best
predictive outcomes on patients with stage II CRC, and may be used
to guide the appropriate use of adjuvant chemotherapy and determine
a suitable follow-up regime. As such, it provides important
scientific value and carries potential clinical significance.
Large-scale multicenter studies are required to confirm the
applicability of the model for the prediction of efficacy. In the
present study, a hot and cold tumor-related prognostic model for
stage II colorectal cancer was mainly built. In the future, based
on the results of the present study, we will select some genes from
the present prognostic model for relevant functional validation and
mechanism studies.
Supplementary Material
Supporting Data
Acknowledgements
Not applicable.
Funding
This work was supported by the National Natural Science
Foundation of China (grant no. 82072621) and the Zhejiang Medical
and Health Science and Technology Plan Project (grant no.
2020KY688).
Availability of data and materials
The datasets analyzed in the present study may be
found in TCGA database at the following URL: https://cancergenome.nih.gov/. The MS-based proteomics
data generated in the present study were deposited in the National
Genomics Data Center under accession number OMIX006709 or at the
following URL: https://ngdc.cncb.ac.cn/omix/release/OMIX006709. The
other data generated in the present study may be requested from the
corresponding author.
Authors' contributions
MZ, XG, JW and KX designed and conceived the study.
MZ, XG, JW, KX, XX, BS, HW, HS, SL and BT participated in data
collection and wrote the manuscript. MZ and KX performed the data
analysis and confirm the authenticity of all the raw data. JW and
MZ contributed to the interpretation of the results and revised the
manuscript. All authors have read and approved the final version of
the manuscript.
Ethics approval and consent to
participate
Human tissue samples were collected in this
research; this retrospective study was conducted in accordance with
the Declaration of Helsinki, and approved by the Institutional
Ethics Committee of the Second Affiliated Hospital of Zhejiang
University, School of Medicine (approval nos. 2020-0322 and
2021-0867). The patient consent for participation was waived due to
the retrospective nature of the study.
Patient consent for publication
Not applicable.
Competing interests
The authors declare that they have no competing
interests.
References
|
1
|
Paijens ST, Vledder A, de Bruyn M and
Nijman HW: Tumor-infiltrating lymphocytes in the immunotherapy era.
Cell Mol Immunol. 18:842–859. 2021. View Article : Google Scholar : PubMed/NCBI
|
|
2
|
Hanahan D and Coussens LM: Accessories to
the crime: Functions of cells recruited to the tumor
microenvironment. Cancer Cell. 21:309–322. 2012. View Article : Google Scholar : PubMed/NCBI
|
|
3
|
Kim TK, Vandsemb EN, Herbst RS and Chen L:
Adaptive immune resistance at the tumour site: Mechanisms and
therapeutic opportunities. Nat Rev Drug Discov. 21:529–540. 2022.
View Article : Google Scholar : PubMed/NCBI
|
|
4
|
Duan Q, Zhang H, Zheng J and Zhang L:
Turning cold into hot: Firing up the Tumor Microenvironment. Trends
Cancer. 6:605–618. 2020. View Article : Google Scholar : PubMed/NCBI
|
|
5
|
Weng J, Li S, Zhu Z, Liu Q, Zhang R, Yang
Y and Li X: Exploring immunotherapy in colorectal cancer. J Hematol
Oncol. 15:952022. View Article : Google Scholar : PubMed/NCBI
|
|
6
|
André T, Shiu KK, Kim TW, Jensen BV,
Jensen LH, Punt C, Smith D, Garcia-Carbonero R, Benavides M, Gibbs
P, et al: Pembrolizumab in Microsatellite-Instability-High advanced
colorectal cancer. N Engl J Med. 383:2207–2218. 2020. View Article : Google Scholar : PubMed/NCBI
|
|
7
|
Casak SJ, Marcus L, Fashoyin-Aje L, Mushti
SL, Cheng J, Shen YL, Pierce WF, Her L, Goldberg KB, Theoret MR, et
al: FDA approval summary: Pembrolizumab for the First-line
treatment of patients with MSI-H/dMMR advanced unresectable or
metastatic colorectal carcinoma. Clin Cancer Res. 27:4680–4684.
2021. View Article : Google Scholar : PubMed/NCBI
|
|
8
|
Ganesh K: Optimizing immunotherapy for
colorectal cancer. Nat Rev Gastroenterol Hepatol. 19:93–94. 2022.
View Article : Google Scholar : PubMed/NCBI
|
|
9
|
Keum N and Giovannucci E: Global burden of
colorectal cancer: Emerging trends, risk factors and prevention
strategies. Nat Rev Gastroenterol Hepatol. 16:713–732. 2019.
View Article : Google Scholar : PubMed/NCBI
|
|
10
|
Li J, Ma X, Chakravarti D, Shalapour S and
DePinho RA: Genetic and biological hallmarks of colorectal cancer.
Genes Dev. 35:787–820. 2021. View Article : Google Scholar : PubMed/NCBI
|
|
11
|
Zhang Y and Zhang Z: The history and
advances in cancer immunotherapy: Understanding the characteristics
of tumor-infiltrating immune cells and their therapeutic
implications. Cell Mol Immunol. 17:807–821. 2020. View Article : Google Scholar : PubMed/NCBI
|
|
12
|
Kao KC, Vilbois S, Tsai CH and Ho PC:
Metabolic communication in the tumour-immune microenvironment. Nat
Cell Biol. 24:1574–1583. 2022. View Article : Google Scholar : PubMed/NCBI
|
|
13
|
Chan TA, Yarchoan M, Jaffee E, Swanton C,
Quezada SA, Stenzinger A and Peters S: Development of tumor
mutation burden as an immunotherapy biomarker: Utility for the
oncology clinic. Ann Oncol. 30:44–56. 2019. View Article : Google Scholar : PubMed/NCBI
|
|
14
|
McGrail DJ, Pilié PG, Rashid NU, Voorwerk
L, Slagter M, Kok M, Jonasch E, Khasraw M, Heimberger AB, Lim B, et
al: High tumor mutation burden fails to predict immune checkpoint
blockade response across all cancer types. Ann Oncol. 32:661–672.
2021. View Article : Google Scholar : PubMed/NCBI
|
|
15
|
Havel JJ, Chowell D and Chan TA: The
evolving landscape of biomarkers for checkpoint inhibitor
immunotherapy. Nat Rev Cancer. 19:133–150. 2019. View Article : Google Scholar : PubMed/NCBI
|
|
16
|
Zhang J, Huang D, Saw PE and Song E:
Turning cold tumors hot: From molecular mechanisms to clinical
applications. Trends Immunol. 43:523–545. 2022. View Article : Google Scholar : PubMed/NCBI
|
|
17
|
Galon J and Bruni D: Approaches to treat
immune hot, altered and cold tumours with combination
immunotherapies. Nat Rev Drug Discov. 18:197–218. 2019. View Article : Google Scholar : PubMed/NCBI
|
|
18
|
Westcott PMK, Sacks NJ, Schenkel JM, Ely
ZA, Smith O, Hauck H, Jaeger AM, Zhang D, Backlund CM, Beytagh MC,
et al: Low neoantigen expression and poor T-cell priming underlie
early immune escape in colorectal cancer. Nat Cancer. 2:1071–1085.
2021. View Article : Google Scholar : PubMed/NCBI
|
|
19
|
Gettinger S, Choi J, Hastings K, Truini A,
Datar I, Sowell R, Wurtz A, Dong W, Cai G, Melnick MA, et al:
Impaired HLA class I antigen processing and presentation as a
mechanism of acquired resistance to immune checkpoint inhibitors in
lung cancer. Cancer Discov. 7:1420–1435. 2017. View Article : Google Scholar : PubMed/NCBI
|
|
20
|
Yamamoto K, Venida A, Yano J, Biancur DE,
Kakiuchi M, Gupta S, Sohn ASW, Mukhopadhyay S, Lin EY, Parker SJ,
et al: Autophagy promotes immune evasion of pancreatic cancer by
degrading MHC-I. Nature. 581:100–105. 2020. View Article : Google Scholar : PubMed/NCBI
|
|
21
|
Burr ML, Sparbier CE, Chan KL, Chan YC,
Kersbergen A, Lam EYN, Azidis-Yates E, Vassiliadis D, Bell CC,
Gilan O, et al: An Evolutionarily conserved function of polycomb
silences the MHC class I antigen presentation pathway and enables
immune evasion in cancer. Cancer cell. 36:385–401.e8. 2019.
View Article : Google Scholar : PubMed/NCBI
|
|
22
|
Spranger S, Dai D, Horton B and Gajewski
TF: Tumor-residing batf3 dendritic cells are required for effector
T cell trafficking and adoptive T cell therapy. Cancer Cell.
31:711–723.e4. 2017. View Article : Google Scholar : PubMed/NCBI
|
|
23
|
Wculek SK, Cueto FJ, Mujal AM, Melero I,
Krummel MF and Sancho D: Dendritic cells in cancer immunology and
immunotherapy. Nat Rev Immunol. 20:7–24. 2020. View Article : Google Scholar : PubMed/NCBI
|
|
24
|
Hegde S, Krisnawan VE, Herzog BH, Zuo C,
Breden MA, Knolhoff BL, Hogg GD, Tang JP, Baer JM, Mpoy C, et al:
Dendritic cell paucity leads to dysfunctional immune surveillance
in pancreatic cancer. Cancer Cell. 37:289–307.e9. 2020. View Article : Google Scholar : PubMed/NCBI
|
|
25
|
Liu YT and Sun ZJ: Turning cold tumors
into hot tumors by improving T-cell infiltration. Theranostics.
11:5365–5386. 2021. View Article : Google Scholar : PubMed/NCBI
|
|
26
|
Spranger S, Bao R and Gajewski TF:
Melanoma-intrinsic β-catenin signalling prevents anti-tumour
immunity. Nature. 523:231–235. 2015. View Article : Google Scholar : PubMed/NCBI
|
|
27
|
Grasso CS, Giannakis M, Wells DK, Hamada
T, Mu XJ, Quist M, Nowak JA, Nishihara R, Qian ZR, Inamura K, et
al: Genetic mechanisms of immune evasion in colorectal cancer.
Cancer Discov. 8:730–749. 2018. View Article : Google Scholar : PubMed/NCBI
|
|
28
|
Dangaj D, Bruand M, Grimm AJ, Ronet C,
Barras D, Duttagupta PA, Lanitis E, Duraiswamy J, Tanyi JL,
Benencia F, et al: Cooperation between constitutive and inducible
chemokines enables T cell engraftment and immune attack in solid
tumors. Cancer Cell. 35:885–900.e10. 2019. View Article : Google Scholar : PubMed/NCBI
|
|
29
|
Apte RS, Chen DS and Ferrara N: VEGF in
signaling and disease: Beyond discovery and development. Cell.
176:1248–1264. 2019. View Article : Google Scholar : PubMed/NCBI
|
|
30
|
Feig C, Jones JO, Kraman M, Wells RJ,
Deonarine A, Chan DS, Connell CM, Roberts EW, Zhao Q, Caballero OL,
et al: Targeting CXCL12 from FAP-expressing carcinoma-associated
fibroblasts synergizes with anti-PD-L1 immunotherapy in pancreatic
cancer. Proc Natl Acad Sci USA. 110:20212–20217. 2013. View Article : Google Scholar : PubMed/NCBI
|
|
31
|
Sahai E, Astsaturov I, Cukierman E,
DeNardo DG, Egeblad M, Evans RM, Fearon D, Greten FR, Hingorani SR,
Hunter T, et al: A framework for advancing our understanding of
cancer-associated fibroblasts. Nat Rev Cancer. 20:174–186. 2020.
View Article : Google Scholar : PubMed/NCBI
|
|
32
|
McAndrews KM, Chen Y, Darpolor JK, Zheng
X, Yang S, Carstens JL, Li B, Wang H, Miyake T, Correa de Sampaio
P, et al: Identification of functional heterogeneity of
Carcinoma-Associated fibroblasts with distinct IL6-Mediated therapy
resistance in pancreatic cancer. Cancer Discov. 12:1580–1597. 2022.
View Article : Google Scholar : PubMed/NCBI
|
|
33
|
de Visser KE and Joyce JA: The evolving
tumor microenvironment: From cancer initiation to metastatic
outgrowth. Cancer Cell. 41:374–403. 2023. View Article : Google Scholar : PubMed/NCBI
|
|
34
|
Tang J, Yan T, Bao Y, Shen C, Yu C, Zhu X,
Tian X, Guo F, Liang Q, Liu Q, et al: LncRNA GLCC1 promotes
colorectal carcinogenesis and glucose metabolism by stabilizing
c-Myc. Nat Commun. 10:34992019. View Article : Google Scholar : PubMed/NCBI
|
|
35
|
Dekker E, Tanis PJ, Vleugels JLA, Kasi PM
and Wallace MB: Colorectal cancer. Lancet. 394:1467–1480. 2019.
View Article : Google Scholar : PubMed/NCBI
|
|
36
|
Li J, Guo BC, Sun LR, Wang JW, Fu XH,
Zhang SZ, Poston G and Ding KF: TNM staging of colorectal cancer
should be reconsidered by T stage weighting. World J Gastroenterol.
20:5104–5112. 2014. View Article : Google Scholar : PubMed/NCBI
|
|
37
|
Guo T, Kouvonen P, Koh CC, Gillet LC,
Wolski WE, Röst HL, Rosenberger G, Collins BC, Blum LC, Gillessen
S, et al: Rapid mass spectrometric conversion of tissue biopsy
samples into permanent quantitative digital proteome maps. Nat Med.
21:407–413. 2015. View Article : Google Scholar : PubMed/NCBI
|
|
38
|
Cai X, Xue Z, Wu C, Sun R, Qian L, Yue L,
Ge W, Yi X, Liu W, Chen C, et al: High-throughput proteomic sample
preparation using pressure cycling technology. Nat Protoc.
17:2307–2325. 2022. View Article : Google Scholar : PubMed/NCBI
|
|
39
|
Sun Y, Selvarajan S, Zang Z, Liu W, Zhu Y,
Zhang H, Chen W, Chen H, Li L, Cai X, et al: Artificial
intelligence defines protein-based classification of thyroid
nodules. Cell Discov. 8:852022. View Article : Google Scholar : PubMed/NCBI
|
|
40
|
Demichev V, Messner CB, Vernardis SI,
Lilley KS and Ralser M: DIA-NN: Neural networks and interference
correction enable deep proteome coverage in high throughput. Nat
Methods. 17:41–44. 2020. View Article : Google Scholar : PubMed/NCBI
|
|
41
|
Ritchie ME, Phipson B, Wu D, Hu Y, Law CW,
Shi W and Smyth GK: Limma powers differential expression analyses
for RNA-sequencing and microarray studies. Nucleic Acids Res.
43:e472015. View Article : Google Scholar : PubMed/NCBI
|
|
42
|
Camp RL, Dolled-Filhart M and Rimm DL:
X-tile: A new bio-informatics tool for biomarker assessment and
outcome-based cut-point optimization. Clin Cancer Res.
10:7252–7259. 2004. View Article : Google Scholar : PubMed/NCBI
|
|
43
|
Amin MB, Edge SB, Greene FL, Byrd DR,
Brookland RK, Washington MK, Gershenwald JE, Compton CC, Hess KR,
Sullivan DC, et al: AJCC Cancer Staging Manual. Springer
International Publishing; New York, NY: 2017
|
|
44
|
Bruni D, Angell HK and Galon J: The immune
contexture and Immunoscore in cancer prognosis and therapeutic
efficacy. Nat Rev Cancer. 20:662–680. 2020. View Article : Google Scholar : PubMed/NCBI
|
|
45
|
Galon J, Costes A, Sanchez-Cabo F,
Kirilovsky A, Mlecnik B, Lagorce-Pagès C, Tosolini M, Camus M,
Berger A, Wind P, et al: Type, density, and location of immune
cells within human colorectal tumors predict clinical outcome.
Science. 313:1960–1964. 2006. View Article : Google Scholar : PubMed/NCBI
|
|
46
|
Kenswil KJG, Pisterzi P, Sánchez-Duffhues
G, van Dijk C, Lolli A, Knuth C, Vanchin B, Jaramillo AC,
Hoogenboezem RM, Sanders MA, et al: Endothelium-derived stromal
cells contribute to hematopoietic bone marrow niche formation. Cell
Stem Cell. 28:653–670.e11. 2021. View Article : Google Scholar : PubMed/NCBI
|
|
47
|
Valkenburg KC, de Groot AE and Pienta KJ:
Targeting the tumour stroma to improve cancer therapy. Nat Rev Clin
Oncol. 15:366–381. 2018. View Article : Google Scholar : PubMed/NCBI
|
|
48
|
Yuan J, Li J, Gao C, Jiang C, Xiang Z and
Wu J: Immunotherapies catering to the unmet medical need of cold
colorectal cancer. Front Immunol. 13:10221902022. View Article : Google Scholar : PubMed/NCBI
|
|
49
|
Chen EX, Jonker DJ, Loree JM, He Y, Zhang
Y, Hao C, Zeng P, Zhang M, Gao Y, Yang D, et al: Effect of combined
immune checkpoint inhibition vs best supportive care alone in
patients with advanced colorectal cancer: The Canadian cancer
trials group CO.26 Study. JAMA Oncol. 6:831–838. 2020. View Article : Google Scholar : PubMed/NCBI
|
|
50
|
Li H, Wang X, Huang X, He Y, Zhang Y, Hao
C, Zeng P, Zhang M, Gao Y, Yang D, et al: Circulating glycan
monosaccharide composite-based biomarker diagnoses colorectal
cancer at early stages and predicts prognosis. Front Oncol.
12:8520442022. View Article : Google Scholar : PubMed/NCBI
|
|
51
|
Lin XT, Wu QN, Qin S, Fan DJ, Lv MY, Chen
X, Cai JW, Weng JR, Zou YF, Rong YM and Gao F: Identification of an
Autophagy-Related gene signature for the prediction of prognosis in
early-stage colorectal cancer. Front Genet. 12:7557892021.
View Article : Google Scholar : PubMed/NCBI
|
|
52
|
Ke J, Liu X-H, Jiang X-F, He Z, Xiao J,
Zheng B, Chen Y-F, Cai Z-R, Zheng X-B, Zou Y-F, et al:
Immune-related gene signature in predicting prognosis of
early-stage colorectal cancer patients. Eur J Surg Oncol.
46:e62–e70. 2020. View Article : Google Scholar : PubMed/NCBI
|