Introduction
Anorectal cancer is the most prevalent form of
Crohn's disease-related colorectal cancer (CD-CRC) in Japan and
other Asian countries (1–3), and its incidence has been increasing
since 2000 (4,5). In contrast, in Western countries,
CD-CRC frequently develops in the right colon, and genome-wide
association studies of CD patients have identified different
associated mutations between patients of Asian and European descent
(6,7). Nevertheless, some Western countries
have reported anorectal cancer in CD patients, in which it ranks as
the second most common form of CD-CRC, necessitating further
research (7–11).
A large-cohort study from Japan reported that
compared to sporadic CRC patients, CD-CRC patients were younger and
had lower R0 resection rates, worse 5-year overall survival (OS)
rates, and a poorer prognosis in stage II or III (12). The poor prognosis of patients may be
related to the difficulty of early diagnosis, the complexity of
radical surgery in advanced cancer, and the low efficacy of
chemoradiotherapy due to the high incidence of mucinous carcinoma
(2). Therefore, although periodic
blood draws, magnetic resonance imaging (MRI), and endoscopic or
transanal histology are recommended for early detection of these
cancers, no effective surveillance program has been established
(13). Typically, the diagnosis of
anorectal cancer relies on the use of T2-weighted and
postcontrast-enhanced T1-weighted MRI scans, with T2-weighted
imaging (T2WI) playing a crucial role in assessing tumor depth
(14). However, it has been
reported that low anorectal carcinoma in CD arising in perianal
fistulas can be difficult to diagnose clinically and radiologically
(15,16).
To address these challenges, we performed radiomics
analysis, an exhaustive analysis using high-dimensional
quantitative features, on MR images of anorectal cancer and
noncancerous lesions from CD patients to identify MRI features
effective in discriminating benign and malignant anorectal cancer
and predicting diagnosis. Common concerns regarding machine
learning-based models, especially those using radiomics features,
are that their outcomes are not easily explicable. Therefore,
radiologists are hesitant to adopt such models (17). SHapley Additive exPlanations (SHAP)
is a framework used to interpret predictions and define measures of
additive feature importance and classes of theoretical outcomes
(18). SHAP involves showing
feature importance and its impact on the overall prediction model,
with several reported benefits, including providing an
understanding of the importance of individual features to model
outputs (19,20). Therefore, the combination of SHAP
and radiomics has the potential to allow clinicians to interpret
predictions and definitions of measures of additive feature
importance within a theoretical outcome framework (21).
We aimed to develop a predictive model to more
accurately diagnose CD cancerous lesions and to combine the SHAP
method with a predictive model to explain and visualize the
model.
Materials and methods
Patient selection
We retrospectively analyzed the data of CD patients
who developed anorectal CD lesions at Hyogo medical university
between March 2009 and June 2022 in this study. The patients were
divided into a cancer group or a noncancer group. The cancer group
was diagnosed with anorectal cancer according to endoscopic biopsy
or histopathology of the original operative specimens obtained at
surgery. The noncancer group was diagnosed with anorectal CD
lesions that were not identified as cancer, which should be those
with anorectal lesions that had been present for at least 10 years.
The data collected included sex, age at the time of the MRI scan,
duration of disease, Montreal classification for CD, anoperineal
disease, prednisolone administration, biologic administration,
histological findings, and cancer stage. In the present study,
CD-CRC was classified using the 8th Union for International Cancer
Control pathological TNM (pTNM) staging system.
We excluded patients in whom CD was not definitively
diagnosed, those who did not undergo MRI, and those who underwent
MRI with different imaging protocols, such as no fat
suppression.
Clinical characteristics model
Studies using clinical characteristics to make
predictions have been conducted for a variety of tasks (22,23).
We performed a multivariate analysis of risk factors for cancer in
the model with the factors identified in the univariate analysis.
Receiver operating characteristic (ROC) curve analysis was used to
calculate the area under the curve (AUC).
Statistical analysis was performed as follows.
Categorical variables were compared using the chi-square test,
ANOVA, or Fisher's exact test. Continuous variables are expressed
as the median and range and were compared using the Mann-Whitney
U test or ANOVA. The level of statistical significance was
set at P<0.05. The odds ratio (OR) and 95% confidence intervals
(CIs) were calculated for all variables in the univariate analysis.
A multivariate logistic regression analysis was performed to
examine the association between study variables and postoperative
complications for factors with p values <0.20 in the univariate
analysis. JMP ver. 16 (SAS Institute Inc. Cary, North Carolina,
USA) was used to perform all analyses.
Acquisition of image data
T2-weighted images were acquired from all patients;
postcontrast-enhanced T1-weighted images were used if available.
All MRI scans of the cancer patients were completed within 1 month
prior to surgery. The most recent MR images taken at least 2 years
before the time of analysis were used to exclude the possibility of
cancer in the noncancer patients who had had anorectal lesions for
more than 10 years.
Pelvic MRI was performed using a Magnetom Avanto
1.5-T (Siemens Medical Solutions, Erlangen, Germany) system
equipped with a body coil for excitation and a pelvic phased array
coil for signal reception. Axial, coronal, and sagittal
fast-spin-echo T2WI was performed with a repetition time (TR)/echo
time (TE) of 4,000-4,750/110-120 ms, 3 mm slice thickness/0.3 mm
gap, 28×22 cm field of view (FOV), and 228×256–256×320 matrix.
T1-weighted imaging (T1WI) was performed in the axial plane with a
spin-echo TR/TE of 500–550/9-10 ms, 3 mm slice thickness/0.3 mm
gap, 28×22 cm FOV, and 228×256–256×320 matrix. The MR images were
retrieved from the facility's image archive and communication
system and transferred to medical image merging software for image
segmentation.
Image segmentation
Regions of interest (ROIs) within the acquired MR
images were delineated using the open-source 3D Slicer program. The
segmentation process involved the use of a threshold segmentation
method, which defined the area within a fixed threshold range,
followed by manual fine-tuning of the selected area as whole
anorectal lesions, including fistula. The ROIs were delineated by a
radiologist with over two decades of experience and subsequently
reviewed by an equally seasoned radiologist with more than three
decades of expertise.
Feature extraction and selection
Radiomic features were extracted with PyRadiomics, a
Python library. A total of four feature extraction patterns were
applied, including postfilter processing patterns. Pattern 1
involved no filter processing, Pattern 2 incorporated a wavelet
filter, Pattern 3 employed a Laplacian of Gaussian filter with
sigma values of 1 mm and 3 mm, and Pattern 4 amalgamated the
features extracted from Patterns 1 to 3 while excluding common
features. For each image, features were extracted in categories
such as shape, first-order, gray level co-occurrence matrix (GLCM),
gray level run length matrix (GLRLM), gray level dependency matrix
(GLDM), and gray level size zone matrix (GLSZM).
To prevent overfitting, seven feature selection
methods were employed for the extracted features: Method 1 applied
no feature selection, Method 2 applied feature selection based on
the top 5 correlation coefficients with the outcome variable,
Method 3 applied feature selection based on the top 50 correlation
coefficients with the outcome variable, Method 4 applied feature
selection based on the top 5 mutual information content with the
outcome variable, Method 5 applied feature selection based on the
top 50 mutual information content with the outcome variable, Method
6 applied feature selection through least absolute shrinkage and
selection operator (LASSO) regression, and Method 7 applied feature
selection with L1 regularized logistic regression.
Machine learning models and
evaluation
Six machine learning models were investigated and
compared: support vector machine (SVM), naive Bayes (NB), random
forest (RF), light gradient boosting machine (Light GBM), extremely
randomized trees (ERT), and regularized greedy forest (RGF). A
library called RGF-python was used for RGF, and Scikit-learn was
used for the other models. The following hyperparameters were tried
for each model. Default values were used for the other
hyperparameters. The following is a list of parameters for which we
have tried multiple values. Regularization parameters (C: 0.01,
0.1, 1.0, 10) for SVM. Parameters of variance smoothing for NB
classifiers (var smoothing: 1e-09) for NB. Maximum depth of the
decision tree (max_depth: 2, 3, 4, 5) for RF. Learning_rate (0.01,
0.05, 0.1) for LightGBM. Maximum depth of decision tree (max depth:
2, 3, 4, 5) for ERT. Maximum number of leaves on the decision tree
(max_leaf: 100, 500, 1000, 1500, 2000, 5000) for RGF.
A fourfold cross-validation score was employed to
evaluate model performance. The data set was randomly partitioned
into four equal subsets, with one serving as the test set and the
remaining three as the training sets. This procedure was repeated
four times, each time designating a different subset as the test
set. Model performance was determined by averaging the scores
obtained from the four evaluations, with the evaluation metric set
as the AUC, accuracy and recall.
Application of SHAP
SHAP is a method for interpreting the contribution
of each feature to the predictions of a machine learning model
(SHAP value) in accordance with game theory principles. By
analyzing the importance of features in the model's prediction
process, one can gain insights into the relationship between these
features and, in this case, malignant tumors associated with
Crohn's disease, as well as their medical significance. The SHAP
value is computed to quantify the extent to which each feature
contributes to the model's predictions relative to a baseline
value, represented as the average of the model's predictions for
all test data. The predicted value for each data point was
calculated as the base value plus the summation of the SHAP
values.
Comparison with a deep learning
model
Transfer learning, a type of deep learning, is
widely used in medical image analysis, where the amount of data
collected is often insufficient (24). In this method, a pre-trained model
is used for a new task; the model is expected to produce good
results with a small amount of data, and only features unique to
the new task need to be learned.
One pre-trained model that can handle 3D images
instead of 2D images is the 3D-CNN. The 3D-CNN was developed for
video analysis, but it can also be applied to 3D medical images and
has shown good performance in a variety of tasks (25).
We used R(2+1)D, a type of 3D-CNN that combines 3D
and 2D convolutional approaches, provided by PyTorch as a
pre-trained model for transfer learning (4).
Comparison with other machine learning
methods
One machine learning technique is an ensemble
learning method called stacking. Kwon et al reported that
stacking exceeded the prediction results of a single model in a
breast cancer prediction task (26). Stacking is a method in which the
predictions of multiple models, called meta-features, for each
dataset are used as features, and a new model is used to make the
final prediction, which is called a meta-model.
We chose the predictions of a total pattern obtained
from the predictions of the radiomics models as candidates for
meta-features. If all features are used, there is a possibility of
overfitting or duplication of similar data. Therefore, it is
necessary to select meta-features appropriately based on specific
criteria. Stacking is known to improve results by combining models
that provide different prediction results (6). Therefore, we performed clustering
using the k-means method based on the prediction patterns, and for
each cluster, we selected the prediction closest to the center of
the cluster. These selected predictions were used as meta-features.
The number of clusters (equal to the number of meta-features) was
5, 10, 15, and 30, for a total of 4 patterns. For the meta-model,
we tested three models: logistic regression, RF, and LightGBM.
Results
Patient characteristics
A total of 52 patients with CD-related anorectal
cancer and 40 noncancer patients were initially included. Of these,
34 cancer patients and 40 noncancer patients had undergone MRI.
Patients with different imaging conditions, such as not including
fat suppression in T2-weighted and T1-weighted imaging sequences,
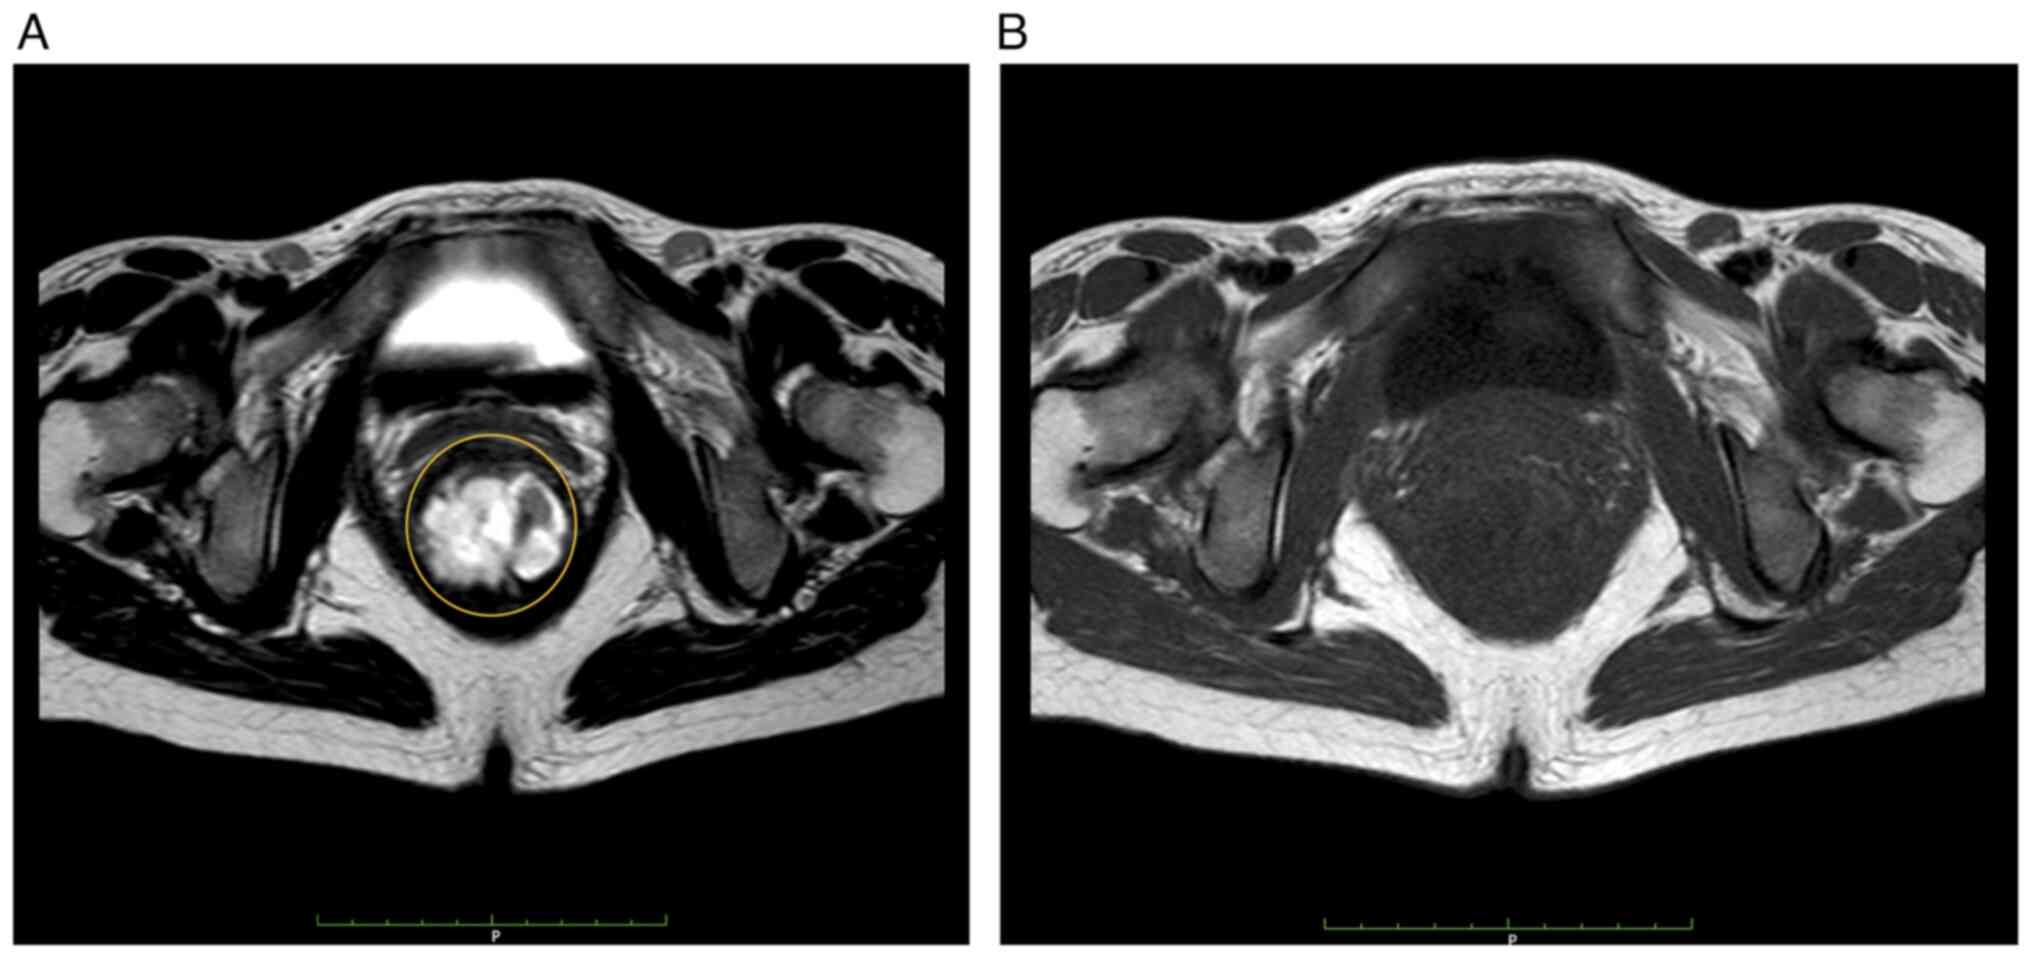
were excluded. Finally, the T2-weighted images of 28 cancer and 40
noncancer patients and the contrast-enhanced T1-weighted images of
22 cancer and 40 noncancer patients were included in the study.
Representative MRI image of CD-related anorectal cancer was shown
in Fig. 1.
The characteristics of the patients in the cancer
group and the noncancer group are shown in Table I. There were no significant
differences in sex distribution, age at the time of the MRI scan,
age at diagnosis, anoperineal disease, or pharmacotherapy between
the groups. The duration of disease was significantly longer in the
cancer group than in the noncancer group (P=0.01). Although the
proportion of L2 (colon type) was significantly higher in the
cancer group than in the noncancer group (P<0.01), the
proportion of L3 (ileocolonic type) was significantly lower in the
cancer group than in the noncancer group (P<0.01). There were
significantly more patients in the cancer group who had the
structuring and penetrating (B2+B3) type (P=0.02). Although 100% of
the patients had the penetrating type in both groups, two patients
in the cancer group had no anoperineal disease.
 | Table I.Characteristics of patients with CD
with T2-weighted images (cancer group and non-cancer group). |
Table I.
Characteristics of patients with CD
with T2-weighted images (cancer group and non-cancer group).
| Factors | Overall (n=68) | Cancer group
(n=28) | Non-cancer group
(n=40) | P-value |
|---|
| Female sex, n
(%) | 20 (29.4) | 10 (35.7) | 10 (25.0) | 0.24 |
| Age at the time of
MRI scan, years, median (range) | 45 (25–81) | 49.5 (34–58) | 41.5 (25–81) | 0.14 |
| Duration of
disease, months, median (range) | 243 (129–519) | 288 (144–516) | 221.5
(129–519) | 0.01a |
| Montreal age at
diagnosis classification, n (%) |
|
|
|
|
| A1: ≤
16 years old | 13 (19.1) | 4 (14.3) | 9 (22.5) | 0.87 |
| A2:
17–40 years old | 53 (77.9) | 24 (85.7) | 29 (72.5) | 0.15 |
| A3:
> 40 years old | 2 (2.9) | 0 (0) | 2 (5.0) | 0.22 |
| Montreal location
of diagnosis classification, n (%) |
|
|
|
|
| L1:
ileum | 6 (8.8) | 3 (10.7) | 3 (7.5) | 0.64 |
| L2:
colon | 15 (22.1) | 1 (3.6) | 14 (35.0) |
<0.01a |
| L3:
ileocolonic | 47 (69.1) | 24 (85.7) | 23 (57.5) | 0.01a |
| Montreal lesion
behavior classification, n (%) |
|
|
|
|
| B1:
inflammatory | 0 (0) | 0 (0) | 0 (0) | 0.00 |
| B2:
stricturing | 0 (0) | 0 (0) | 0 (0) | 0.00 |
| B3:
penetrating | 68 (100.0) | 28 (100.0) | 40 (100.0) | 0.00 |
|
B2+B3 | 15 (22.1) | 10 (35.7) | 5 (12.5) | 0.02a |
| Anoperineal
disease, n (%) | 66 (97.1) | 26 (92.8) | 40 (100.0) | 0.08 |
| PSL administration,
n (%) | 14 (20.6) | 5 (17.9) | 9 (22.5) | 0.64 |
| Biologic
administration, n (%) | 40 (58.8) | 14 (50.0) | 26 (65.0) | 0.21 |
The histological findings of anorectal cancer were
well-differentiated adenocarcinoma in 5 cases (17%), moderately
differentiated adenocarcinoma in 2 cases (7.1%), poorly
differentiated adenocarcinoma in 3 cases (10.7%), mucinous
adenocarcinoma in 14 cases (50%), and signet-ring cell carcinoma
and squamous cell carcinoma in 2 cases (7.1%). There were stage I
in 2 cases (7.1%), stage II in 11 cases (39.2%), stage III in 5
cases (17.8%), IV in 7 cases (25%), and X in 3 cases (10.7%).
Mucinous adenocarcinoma was the most frequent histological finding,
and there were few cases of early-stage cancer.
Clinical characteristics model
Univariate and multivariate analyses were performed
to identify the independent risk factors for CD-related anorectal
cancer. The results of these analyses are presented in Table II. Five clinically significant
factors, including age at the time of MRI scan, disease duration,
A2, L2, and B2+B3, were entered into multivariate logistic
regression analysis. The AUC value for the resulting clinical
characteristic model was 0.82.
| Table II.Univariable and multivariable
logistic regression analysis for CD-related anorectal cancer. |
Table II.
Univariable and multivariable
logistic regression analysis for CD-related anorectal cancer.
|
| Univariate | Multivariate |
|---|
|
|
|
|
|---|
| Factors | OR (95% CI) | P-value | OR (95% CI) | P-value |
|---|
| Age at the time of
MRI scan, 10 years | 1.03
(0.87–2.29) | 0.15 | 1.02
(0.43–2.44) | 0.96 |
| Duration of
disease, 12 months | 1.05
(0.99–1.12) | 0.08 | 1.08
(0.99–1.22) | 0.05 |
| Montreal age at
diagnosis classification (A2: 17–40 years old) | 2.25
(0.33–5.38) | 0.15 | 3.08
(0.57–16.4) | 0.18 |
| Montreal location
of diagnosis classification (L2: colon) | 1.71
(0.56–5.21) |
<0.01a | 0.04
(0.01–0.59) |
<0.01a |
| Montreal behavior
classification (B2+B3: structuring and penetrating) | 1.27
(0.37–4.38) | 0.02a | 2.12
(0.48–9.38) | 0.32 |
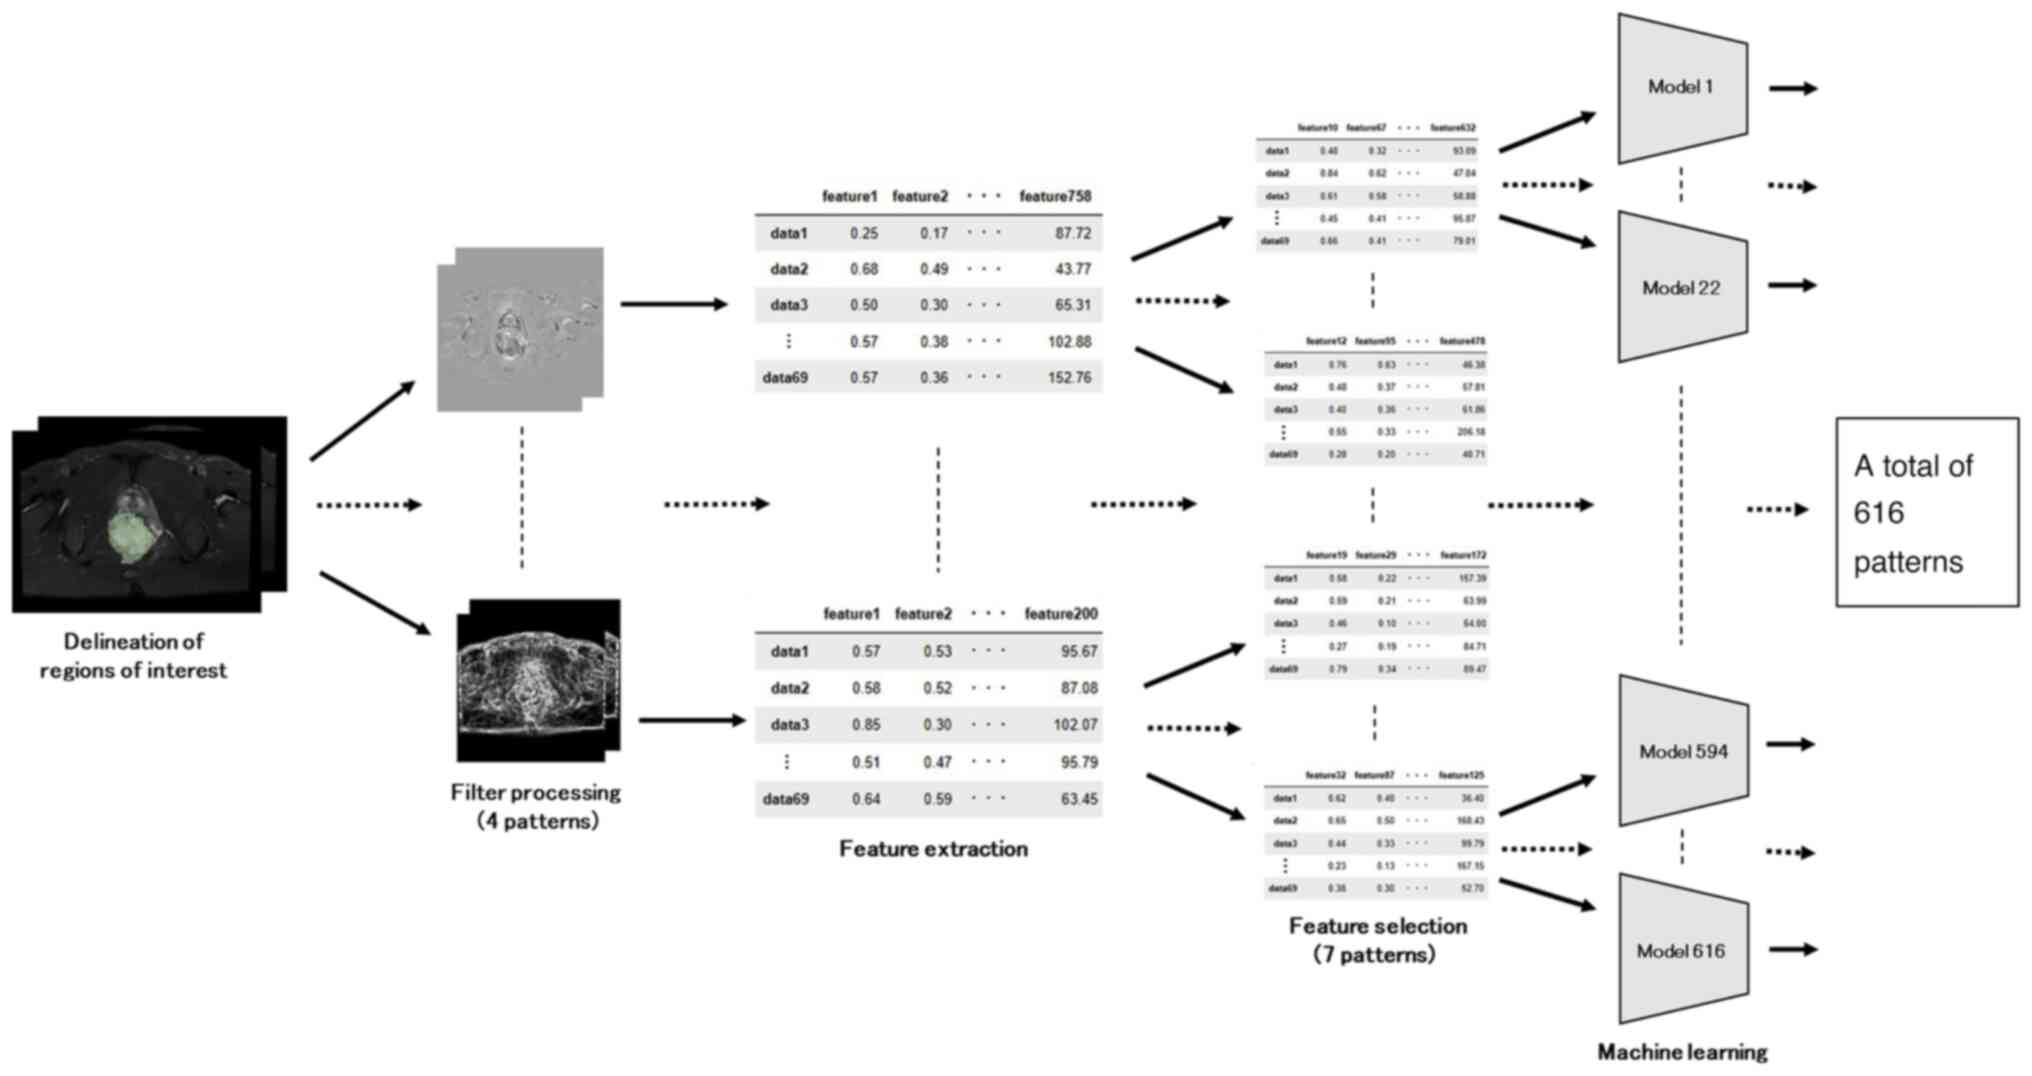
Radiomics models
The radiomics process is visually presented in the
flowchart shown in Fig. 2.
Prediction accuracy was calculated for a total of 616 patterns,
which is the sum of 4 patterns for the filtering process, 7
patterns for feature selection, and various models (6 different
models and hyperparameters for a total of 22 patterns).
The prediction models derived from the T2- and
T1-weighted images are described in Tables III and IV, respectively. The model with the
highest AUC for the T2-weighted image was RGF [pattern: no filter,
using LASSO regression, max leaf was 100], with an AUC of 0.944
(accuracy: 0.862, recall: 0.830). For T1-weighted images, the model
with the highest AUC was based on SVM [pattern: no filter, no
feature selection, regularization parameters was 0.1], with an AUC
of 0.932 (accuracy: 0.877, recall: 0.747). The MRI-based radiomic
models showed higher AUCs than the patient characteristics model,
and the RGF model based on T2-weighted image features showed the
highest AUC.
| Table III.Prediction models: T2-weighted
images. |
Table III.
Prediction models: T2-weighted
images.
| Models | AUC | Accuracy | Recall | Patterns |
|---|
| RGF | 0.947 | 0.862 | 0.830 | Original, LASSO,
100 |
| RF | 0.944 | 0.850 | 0.805 | Original, logistic,
2 |
| ERT | 0.937 | 0.821 | 0.766 | Original, logistic,
3 |
| SVM | 0.936 | 0.804 | 0.775 | Original, corr_5,
0.1 |
| NB | 0.931 | 0.825 | 0.884 | Original, corr_5,
1e-9 |
| Light GBM | 0.923 | 0.821 | 0.776 | Original, corr_5,
0.05 |
| Table IV.Prediction models: T1-weighted
images. |
Table IV.
Prediction models: T1-weighted
images.
| Models | AUC | Accuracy | Recall | Pattern |
|---|
| SVM | 0.932 | 0.877 | 0.747 | Original, all,
0.1 |
| RF | 0.880 | 0.804 | 0.669 | Original, logistic,
5 |
| ERT | 0.875 | 0.792 | 0.693 |
Original+wavelet+log, |
|
|
|
|
| Mutual_info_5,
4 |
| Light GBM | 0.874 | 0.808 | 0.705 | Original, all,
0.1 |
| RGF | 0.868 | 0.776 | 0.654 | Original, all,
100 |
| NB | 0.863 | 0.776 | 0.704 | Wavelet, corr_50,
1e-9 |
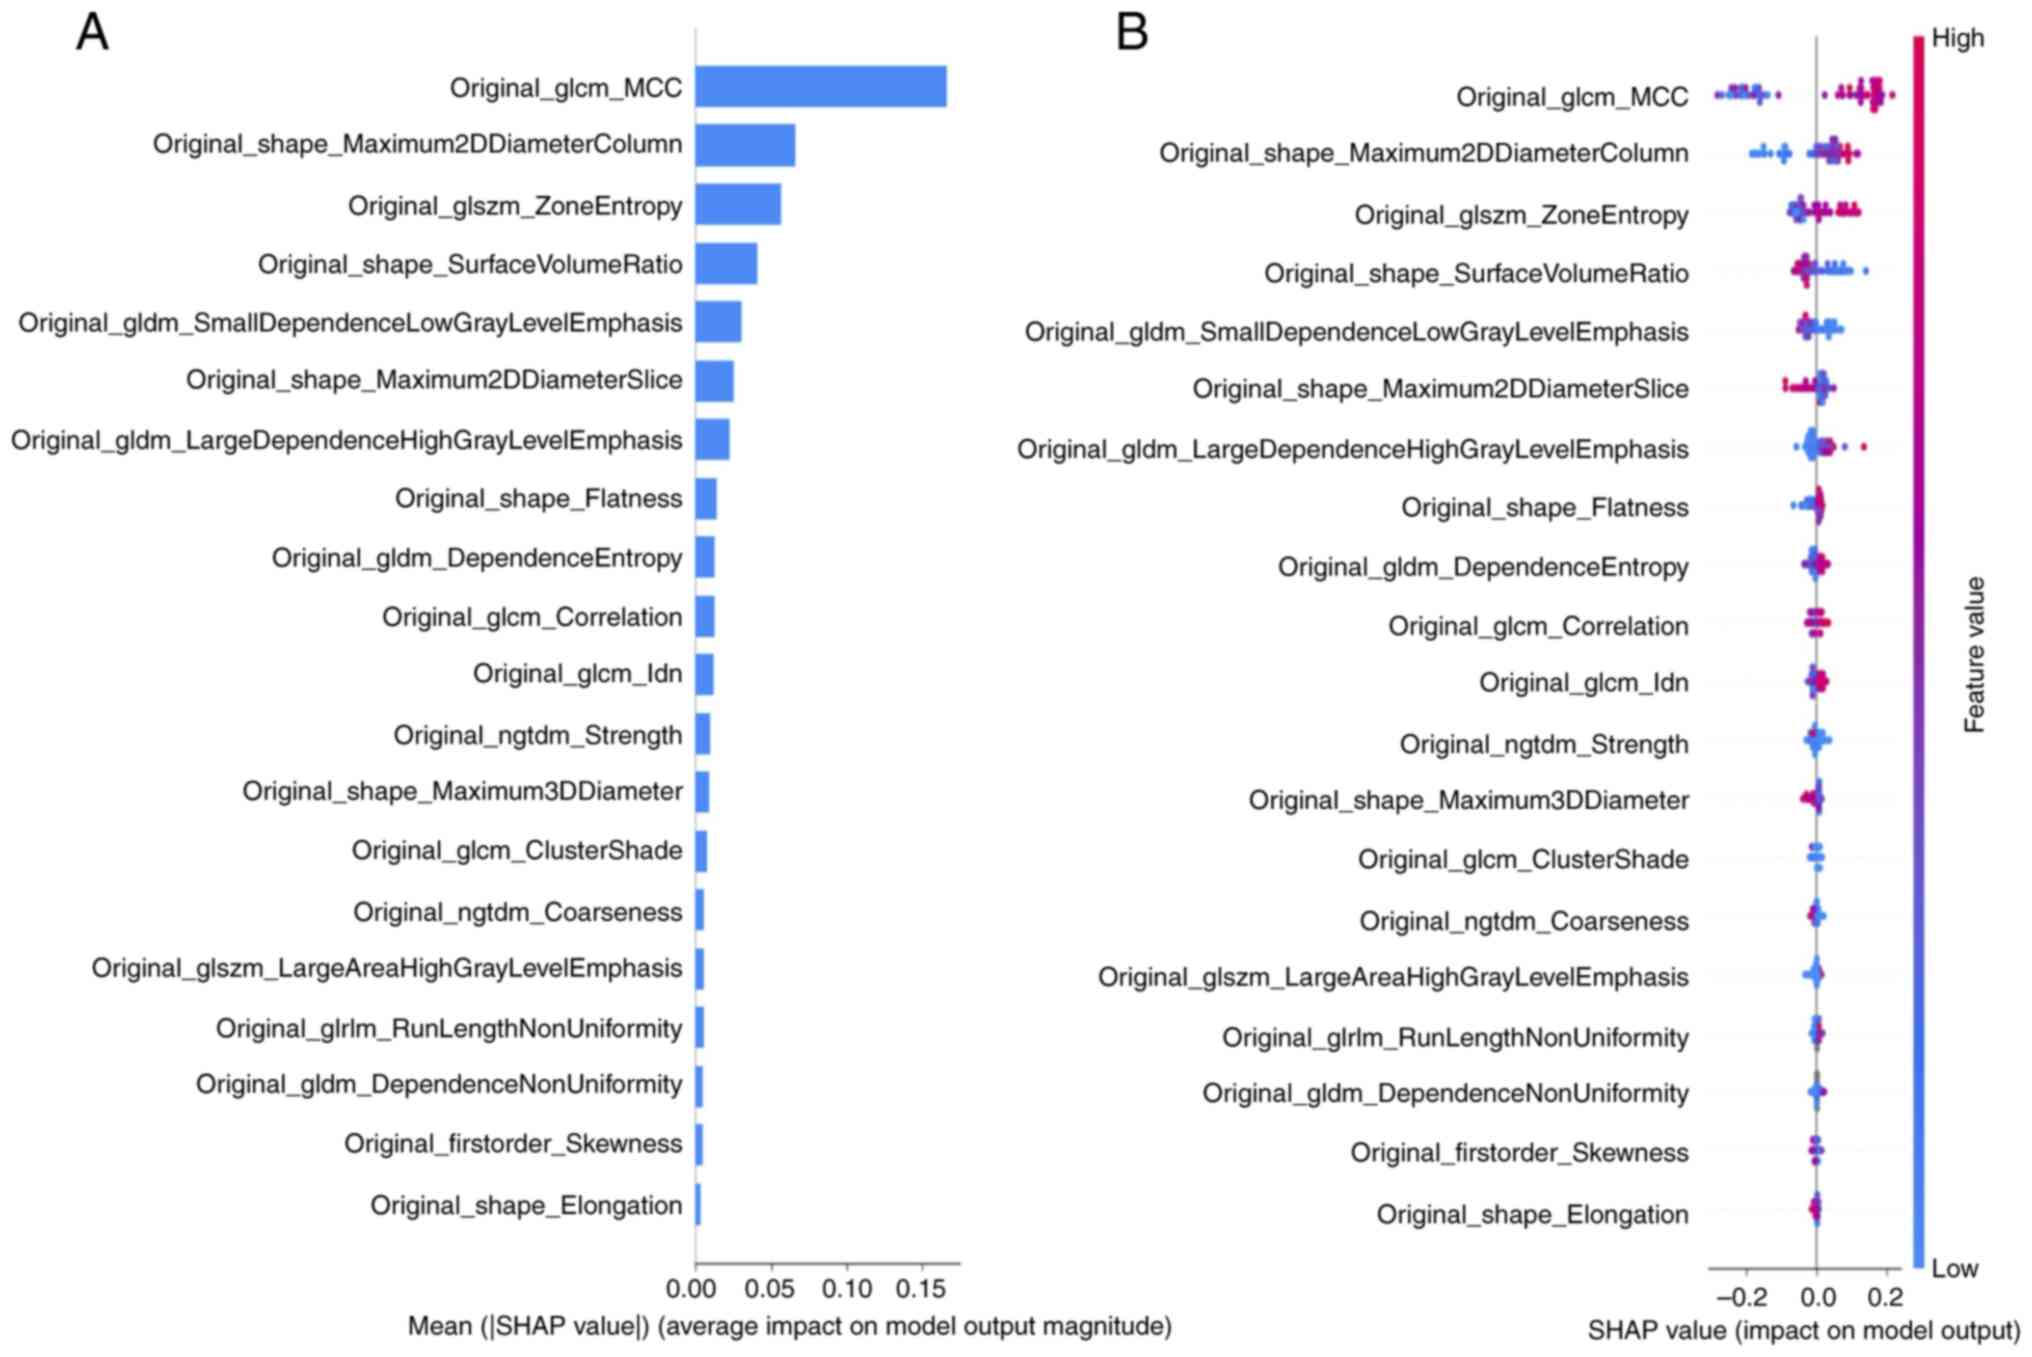
Explanation and visualization of the
radiomics models
SHAP was used to quantitatively describe the output
of the most accurate model (RGF) based on T2-weighted images. SHAP
summary plots were generated to provide a visually concise picture
by representing the range and distribution of the feature
importance values on the model output and relating the feature
values to the feature impacts. The distributed importance plot in
Fig. 3A lists the most important
variables in descending order, with the top four being 1: GLCM_MCC
(maximal correlation coefficient), which reflects texture
complexity; 2: SHAPE Maximum 2D Diameter Column, reflecting the
maximum distance between pixels in the same coronal cross-section;
3: GLSZM _Zone Entropy, which indicates how randomly distributed
the clump sizes of pixels of the same signal intensity are; and 4:
SHAPE Surface Area to Volume Ratio, in which values closer to 0
indicate greater sphericity. Each dot in Fig. 3B is colored according to the value
of the feature, with contributions ranging from negative (blue) to
positive (red). Interpretation of these data indicates that if the
signal intensity was heterogeneous in terms of the texture patterns
(GLCM_MCC and GLSZM_Zone Entropy), the width was greater in the
direction of the coronal cross-section (SHAPE_Maximum 2D Diameter
Column) and the shape of the lesion was more spherical
(SHAPE_Surface Area to Volume Ratio), the lesion was more likely to
be judged as anorectal cancer.
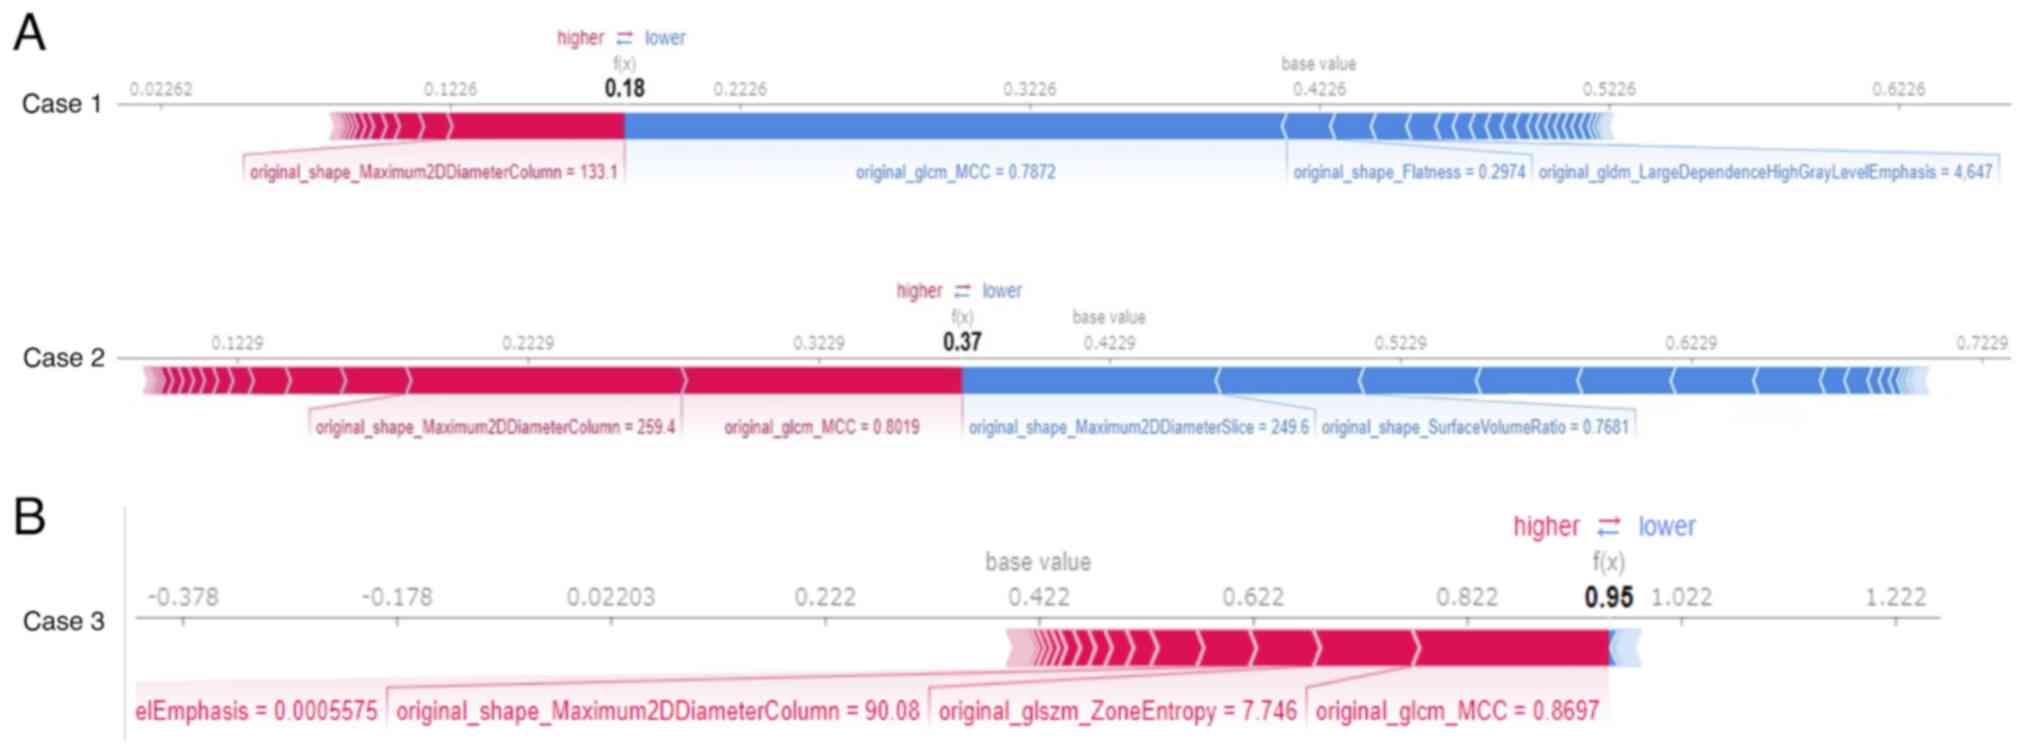
A force plot (Fig.
4) was generated for each individual data set to show which and
the degree to which features influenced the model to reach its
predictions. Features with positive SHAP values are represented in
red, features with negative SHAP values are represented in blue,
and the length of the bar indicates the magnitude of the SHAP value
for each feature. Two patients (Fig.
4A) for whom cancer could not be correctly predicted and one
patient (Fig. 4B) for whom cancer
could be correctly predicted are shown for comparison. GLCM_MCC in
Case 1 and SHAPE_Maximum 2D Diameter Column and SHAPE_Surface Area
to Volume Ratio in Case 2 had negative SHAP values. The two
patients for whom cancer could not be correctly predicted had stage
1 early-stage cancer (Case 1) and squamous cell carcinoma (Case 2).
There were two patients with stage 1 cancer and two with squamous
cell carcinoma in all cases.
Comparison with a deep learning model:
R(2+1)D
The prediction results using T2-weighted images are
shown in Table V. Patterns in which
data augmentation was performed by rotating the images at random
angles are also shown. The amount of training data was increased by
a factor of 2 or 5. These results showed that the AUC was
considerably lower than that of the radiomics models and that data
augmentation had minimal effect.
| Table V.Prediction model-transfer learning:
T2-weighted images. |
Table V.
Prediction model-transfer learning:
T2-weighted images.
| Pretrained
model | AUC | Accuracy | Recall | Data
augmentation |
|---|
| R(2+1)D | 0.569 | 0.600 | 0.377 | 2 times |
|
| 0.567 | 0.591 | 0.409 | - |
|
| 0.558 | 0.598 | 0.303 | 5 times |
Comparison with other machine learning
methods: prediction models-stacking
The prediction results using T2-weighted images are
shown in Table VI. The pattern
with the highest AUC among the predictions of each meta-model is
listed. The stacking model (AUC: 0.912) exhibited a worse
performance than the radiomics model (AUC: 0.947).
| Table VI.Prediction models-stacking:
T2-weighted images. |
Table VI.
Prediction models-stacking:
T2-weighted images.
| Models | AUC | Accuracy | Recall | No. of
meta-features |
|---|
| LR | 0.912 | 0.809 | 0.765 | 5 |
| RF | 0.895 | 0.800 | 0.774 | 10 |
| Light GBM | 0.884 | 0.807 | 0.784 | 30 |
Discussion
To our knowledge, this is the first study to develop
a machine learning-based radiomics model for predicting CD-related
anorectal cancer. We demonstrate that the radiomics-based RGF model
performed excellently in determining whether an anorectal lesion in
CD was cancerous. Moreover, we also found that the extracted
features could be clinically explained by applying SHAP.
Radiomics is derived from the terms radiology and
omics (the science of systematically handling large amounts of
information). It is a relatively new method for extracting large
amounts of quantifiable image characteristics from conventional CT,
MRI, and PET images and converting them into a form that can be
data-mined (27). Visualization of
tumor heterogeneity by extracting radiomics features is very
important in assessing tumor grade and prognosis, and the ability
of radiomics analysis to differentiate between cancer and benign
tissue has already been demonstrated in various organs (28). In prostate cancer, a study of 147
biopsy-diagnosed patients reported that texture analysis was able
to distinguish between cancerous and noncancerous prostate tissue
on both T2-weighted MR images and diffusion coefficient maps
obtained from diffusion-weighted MR images (28). Although data on the value of
radiomics in colorectal cancer patients are limited, some studies
have illustrated the usefulness of radiomics in staging colorectal
cancer (29).
The models we developed in this study were able to
determine the presence of anorectal cancer with a high degree of
confidence, with all T2-weighted-based models having AUCs exceeding
0.9. Certainly, targeted endoscopic biopsy and transanal biopsy
under anesthesia are important for the diagnosis of cancer, similar
to MRI (13,30). However, a thorough examination of
the rectum and perianal region is limited by pain in the perineal
tissue and anal strictures. In addition, even examination under
anesthesia by an experienced colorectal surgeon may miss early
malignant lesions (31). The
present results suggest that a predictive model using MRI may be
particularly useful as a diagnostic aid in such cases. On the other
hand, the T1WI-based model tended to have a lower overall recall
and was not as effective at correctly predicting cancer as the T2WI
models. Delayed postcontrast-enhanced axial T1-weighted
fat-saturated images have been reported to show mild enhancement of
internal nodular components and irregular internal walls (15). Therefore, it has been suggested that
T1-weighted images are less suitable for radiomics analysis of
overall volume and shape than T2-weighted images since only
features of the surfaces showing contrast enhancement were
extracted, which could explain the present results of the AUC for
the prediction model.
The drawback of machine learning models is that it
is difficult to interpret their predictive results, which hinders
their use by clinicians. To date, SHAP has been used to identify
patterns identified by complex machine learning algorithms that can
differentiate adult pilocytic astrocytomas from high-grade gliomas
and reveal early progression of nonmetastatic nasopharyngeal
carcinoma and treatment response to whole-brain radiotherapy
(32–34). In the present study, SHAP indicated
that with the T2WI-based model, lesions with a complex signal
intensity, a large width in the direction of the coronal section,
and a more spherical shape could be interpreted as being more
likely to be cancer. Complex signal intensity is a characteristic
MRI finding of cancer, and a large width might be a characteristic
advanced cancer or more complex fistula. Furthermore, T2-weighted
images of mucinous adenocarcinoma have been reported to show
lobular fluid accumulation similar to mosaic (15). The SHAP result that it was more
nearly spherical may represent this mucinous lobular morphology. In
fact, 50% of the histological types of cancer cases in the present
results were mucinous adenocarcinoma.
Regarding the deep learning model, R(2+1)D had a
considerably lower AUC than that of the radiomics models, and there
was little effect of data augmentation. The extremely small amount
of data is believed to be responsible for this result. In general,
deep learning models do not exhibit good performance unless the
amount of data is large (35). When
the number of data points is small (several hundred or more), the
results may be improved by data augmentation or transfer learning;
however, these effects were not expected in this study because the
amount of data is much smaller. In these cases, it is more
appropriate to use a radiomics model, which can be trained with a
small amount of data, than a deep learning model. Among other
machine learning methods, stacking is expected to improve the
prediction result in some cases (36), because it combines the predictions
of different models and thus can take advantage of the differences
in features and approaches of each model. However, a limitation of
stacking is that it reduces the interpretability of the prediction
results; with radiomics features, the meaning of the features
themselves can be interpreted, whereas with stacking, the
predictions of multiple models are used as the features, increasing
the difficulty of interpreting the meaning of the features. In this
study, the models using stacking exhibited worse performance than
the radiomics models. It is possible that the predictive results of
the different models were very similar and that the meta-features
lacked diversity. Compared to models using stacking, the radiomics
model had better prediction results, and when combined with SHAP,
the model can be interpreted more effectively.
Some limitations were present in this study. First,
the sample size was relatively small, and all cases were from the
same institution. Second, not all patients had T2-weighted and
T1-weighted images, so a rigorous comparison could not be made.
Third, the lobular pattern is seen in mucinous carcinoma but not in
squamous cell carcinoma, so the accuracy of the prediction may
differ depending on the histological type. Furthermore, the model
may not be suitable for detecting early-stage cancers, as it did
not correctly predict patients with stage 1 cancer. However, good
predictive results were obtained for stage 2 cancer patients, which
may reduce total pelvic exenteration and missed surgical
opportunities. Fourth, this study did not include genetic data.
TP53 has been reported to be the most frequently mutated
gene in CD-CRC (37). However, a
previous multicenter study in which we participated failed to
detect mutations in known oncogenes in half of the CD-CRC patients
(38). In Japan, the most common
types of CD-CRC are mucinous carcinoma of the anal canal and anal
fistula, and unknown genomic alterations specific to Asia may
affect this unique CD-CRC phenotype. Overall, there appears to be
heterogeneity in the genetic events of CRC depending on background
disease, histology, and ethnicity.
In the future, our findings should be confirmed by
multicenter clinical trials with larger sample sizes. In addition,
an automatic segmentation method needs to be developed. The
proposed method requires image segmentation performed by a
radiologist who is familiar with cancer associated with CD to
produce predictive results. However, if an automatic segmentation
method can be developed, it will be possible to make predictions
without a radiologist. One method of automatic segmentation
utilizes deep learning. By inputting images into a model that has
been pre-trained on numerous medical images, such as U-Net,
automatic segmentation results can be generated (39). However, accurate results cannot be
obtained when the boundary between a malignant tumor and normal
tissue is ambiguous, so it is necessary to develop a method to
address this problem.
The MRI radiomics-based RGF model had an excellent
ability to predict CD-related anorectal cancer. By applying SHAP,
the extracted radiomic features could be explained clinically and
radiologically. These results may affect the diagnosis and
surveillance strategies of CD-CRC.
Acknowledgements
Not applicable.
Funding
Funding: No funding was received.
Availability of data and materials
The data generated in the present study may be
requested from the corresponding author.
Authors' contributions
YH conceived and designed the study, acquired,
analyzed and interpreted the data and drafted the manuscript. JI,
KM and SO conceived and designed the study and acquired and
analyzed the data. KN, KKu, RK, KKi, KKa and NB acquired and
interpreted the data. MU, MI, TO, KY, HI analyzed and interpreted
the data, critically revised the manuscript for important
intellectual content and gave the final approval for publication.
YH, JI and KM confirm the authenticity of all the raw data. All
authors read and approved the final manuscript.
Ethics approval and consent to
participate
All study protocols were approved by the
institutional review board at Hyogo Medical University (no. 4389),
and written informed consent and agreement for the use of patient
data were obtained before surgery.
Patient consent for publication
Written informed consent was obtained via an opt-out
method.
Competing interests
The authors declare that they have no competing
interests.
References
|
1
|
Higashi D, Katsuno H, Kimura H, Takahashi
K, Ikeuchi H, Kono T, Nezu R, Hatakeyama K, Kameyama H, Sasaki I,
et al: Current state of and problems related to cancer of the
intestinal tract associated with Crohn's disease in Japan.
Anticancer Res. 36:3761–3766. 2016.PubMed/NCBI
|
|
2
|
Sasaki H, Ikeuchi H, Bando T, Hirose K,
Hirata A, Chohno T, Horio Y, Tomita N, Hirota S, Ide Y, et al:
Clinicopathological characteristics of cancer associated with
Crohn's disease. Surg Today. 47:35–41. 2017. View Article : Google Scholar : PubMed/NCBI
|
|
3
|
Kim J, Lee HS, Park SH, Yang SK, Ye BD,
Yang DH, Kim KJ, Byeon JS, Yoon YS, Yu CS and Kim J: Pathologic
features of colorectal carcinomas associated with Crohn's disease
in Korean population. Pathol Res Pract. 213:250–255. 2017.
View Article : Google Scholar : PubMed/NCBI
|
|
4
|
Uchino M, Ikeuchi H, Hata K, Minagawa T,
Horio Y, Kuwahara R, Nakamura S, Watanabe K, Saruta M, Fujii T, et
al: Intestinal cancer in patients with Crohn's disease: A
systematic review and meta-analysis. J Gastroenterol Hepatol.
36:329–336. 2021. View Article : Google Scholar : PubMed/NCBI
|
|
5
|
Yano Y, Matsui T, Hirai F, Okado Y, Sato
Y, Tsurumi K, Ishikawa S, Beppu T, Koga A, Yoshizawa N, et al:
Cancer risk in Japanese Crohn's disease patients: Investigation of
the standardized incidence ratio. J Gastroenterol Hepatol.
28:1300–1305. 2013. View Article : Google Scholar : PubMed/NCBI
|
|
6
|
Thomas M, Bienkowski R, Vandermeer TJ,
Trostle D and Cagir B: Malignant transformation in perianal
fistulas of Crohn's disease: A systematic review of literature. J
Gastrointest Surg. 14:66–73. 2010. View Article : Google Scholar : PubMed/NCBI
|
|
7
|
Hirsch D, Wangsa D, Zhu YJ, Hu Y, Edelman
DC, Meltzer PS, Heselmeyer-Haddad K, Ott C, Kienle P, Galata C, et
al: Dynamics of genome alterations in Crohn's disease-associated
colorectal carcinogenesis. Clin Cancer Res. 24:4997–5011. 2018.
View Article : Google Scholar : PubMed/NCBI
|
|
8
|
Palmieri C, Müller G, Kroesen AJ, Galata
C, Rink AD, Morgenstern J and Kruis W: Perianal fistula-associated
carcinoma in Crohn's disease: A multicentre retrospective case
control study. J Crohns Colitis. 15:1686–1693. 2021. View Article : Google Scholar : PubMed/NCBI
|
|
9
|
Shwaartz C, Munger JA, Deliz JR, Bornstein
JE, Gorfine SR, Chessin DB, Popowich DA and Bauer JJ:
Fistula-associated anorectal cancer in the setting of Crohn's
disease. Dis Colon Rectum. 59:1168–1173. 2016. View Article : Google Scholar : PubMed/NCBI
|
|
10
|
Beaugerie L, Carrat F, Nahon S, Zeitoun
JD, Sabaté JM, Peyrin-Biroulet L, Colombel JF, Allez M, Fléjou JF,
Kirchgesner J, et al: High risk of anal and rectal cancer in
patients with anal and/or perianal Crohn's disease. Clin
Gastroenterol Hepatol. 16:892–899.e2. 2018. View Article : Google Scholar : PubMed/NCBI
|
|
11
|
Galata C, Hirsch D, Reindl W, Post S,
Kienle P, Boutros M, Gaiser T and Horisberger K: Clinical and
histopathologic features of colorectal adenocarcinoma in Crohn's
disease. J Clin Gastroenterol. 52:635–640. 2018. View Article : Google Scholar : PubMed/NCBI
|
|
12
|
Ogino T, Mizushima T, Fujii M, Sekido Y,
Eguchi H, Nezu R, Ikeuchi H, Motoi U, Futami K, Okamoto K, et al:
Crohn's disease-associated anorectal cancer has a poor prognosis
with high local recurrence: A subanalysis of the nationwide
Japanese study. Am J Gastroenterol. 118:1626–1637. 2023. View Article : Google Scholar : PubMed/NCBI
|
|
13
|
Hirano Y, Futami K, Higashi D, Mikami K
and Maekawa T: Anorectal cancer surveillance in Crohn's disease. J
Anus Rectum Colon. 2:145–154. 2018. View Article : Google Scholar : PubMed/NCBI
|
|
14
|
Horvat N, Carlos Tavares Rocha C, Clemente
Oliveira B, Petkovska I and Gollub MJ: MRI of rectal cancer: Tumor
staging, imaging techniques, and management. Radiographics.
39:367–387. 2019. View Article : Google Scholar : PubMed/NCBI
|
|
15
|
Lad SV, Haider MA, Brown CJ and Mcleod RS:
MRI appearance of perianal carcinoma in Crohn's disease. J Magn
Reson Imaging. 26:1659–1662. 2007. View Article : Google Scholar : PubMed/NCBI
|
|
16
|
Devon KM, Brown CJ, Burnstein M and McLeod
RS: Cancer of the anus complicating perianal Crohn's disease. Dis
Colon Rectum. 52:211–216. 2009. View Article : Google Scholar : PubMed/NCBI
|
|
17
|
Xu Y, Liu X, Cao X, Huang C, Liu E, Qian
S, Liu X, Wu Y, Dong F, Qiu CW, et al: Artificial intelligence: A
powerful paradigm for scientific research. Innovation (Camb).
2:1001792021.PubMed/NCBI
|
|
18
|
Lundberg SM and Lee SI: A unified approach
to interpreting model predictions. Adv Neural Inf Process Syst.
30:4765–4774. 2017.PubMed/NCBI
|
|
19
|
Shapley LS: A value for n-person games.
Contributions to the Theory of Games. 2:307–317. 1953.
|
|
20
|
Rodríguez-Pérez R and Bajorath J:
Interpretation of compound activity predictions from complex
machine learning models using local approximations and shapley
values. J Med Chem. 63:8761–8777. 2020. View Article : Google Scholar : PubMed/NCBI
|
|
21
|
Li R, Shinde A, Liu A, Glaser S, Lyou Y,
Yuh B, Wong J and Amini A: Machine learning-based interpretation
and visualization of nonlinear interactions in prostate cancer
survival. JCO Clin Cancer Inform. 4:637–646. 2020. View Article : Google Scholar : PubMed/NCBI
|
|
22
|
Li W, Liu Y, Liu W, Tang ZR, Dong S, Li W,
Zhang K, Xu C, Hu Z, Wang H, et al: Machine learning-based
prediction of lymph node metastasis among osteosarcoma patients.
Front Oncol. 12:7971032022. View Article : Google Scholar : PubMed/NCBI
|
|
23
|
Li W, Dong S, Wang H, Wu R, Wu H, Tang ZR,
Zhang J, Hu Z and Yin C: Risk analysis of pulmonary metastasis of
chondrosarcoma by establishing and validating a new clinical
prediction model: A clinical study based on SEER database. BMC
Musculoskelet Disord. 22:5292021. View Article : Google Scholar : PubMed/NCBI
|
|
24
|
Kora P, Ooi CP, Faust O, Raghavendra U,
Gudigar A, Chan WY, Meenakshi K, Swaraja K, Plawiak P and Acharya
UR: Transfer learning techniques for medical image analysis: A
review. Biocybern Biomed Eng. 42:79–107. 2022. View Article : Google Scholar : PubMed/NCBI
|
|
25
|
Singh D, Kumar V and Vaishali Kaur M:
Classification of COVID-19 patients from chest CT images using
multi-objective differential evolution-based convolutional neural
networks. Eur J Clin Microbiol Infect Dis. 39:1379–1389. 2020.
View Article : Google Scholar : PubMed/NCBI
|
|
26
|
Kwon H, Park J and Lee Y: Stacking
ensemble technique for classifying breast cancer. Healthc Inform
Res. 25:283–288. 2019. View Article : Google Scholar : PubMed/NCBI
|
|
27
|
Zwanenburg A, Vallières M, Abdalah MA,
Aerts HJWL, Andrearczyk V, Apte A, Ashrafinia S, Bakas S, Beukinga
RJ, Boellaard R, et al: The image biomarker standardization
initiative: Standardized quantitative radiomics for high-throughput
image-based phenotyping. Radiology. 295:328–338. 2020. View Article : Google Scholar : PubMed/NCBI
|
|
28
|
Wibmer A, Hricak H, Gondo T, Matsumoto K,
Veeraraghavan H, Fehr D, Zheng J, Goldman D, Moskowitz C, Fine SW,
et al: Haralick texture analysis of prostate MRI: Utility for
differentiating non-cancerous prostate from prostate cancer and
differentiating prostate cancers with different Gleason scores. Eur
Radiol. 25:2840–2850. 2015. View Article : Google Scholar : PubMed/NCBI
|
|
29
|
Liang C, Huang Y, He L, Chen X, Ma Z, Dong
D, Tian J, Liang C and Liu Z: The development and validation of a
CT-based radiomics signature for the preoperative discrimination of
stage I–II and stage III–IV colorectal cancer. Oncotarget.
7:31401–31412. 2016. View Article : Google Scholar : PubMed/NCBI
|
|
30
|
Matsuno H, Mizushima T, Nezu R, Nakajima
K, Takahashi H, Haraguchi N, Nishimura J, Hata T, Yamamoto H, Doki
Y and Mori M: Detection of anorectal cancer among patients with
Crohn's disease undergoing surveillance with various biopsy
methods. Digestion. 94:24–29. 2016. View Article : Google Scholar : PubMed/NCBI
|
|
31
|
Ky A, Sohn N, Weinstein MA and Korelitz
BI: Carcinoma arising in anorectal fistulas of Crohn's disease. Dis
Colon Rectum. 41:992–996. 1998. View Article : Google Scholar : PubMed/NCBI
|
|
32
|
Park YW, Eom J, Kim D, Ahn SS, Kim EH,
Kang SG, Chang JH, Kim SH and Lee SK: Correction to: A fully
automatic multiparametric radiomics model for differentiation of
adult pilocytic astrocytomas from high-grade gliomas. Eur Radiol.
32:57842022. View Article : Google Scholar : PubMed/NCBI
|
|
33
|
Du R, Lee VH, Yuan H, Lam KO, Pang HH,
Chen Y, Lam EY, Khong PL, Lee AW, Kwong DL and Vardhanabhuti V:
Radiomics model to predict early progression of nonmetastatic
nasopharyngeal carcinoma after intensity modulation radiation
therapy: A multicenter study. Radiol Artif Intell. 1:e1800752019.
View Article : Google Scholar : PubMed/NCBI
|
|
34
|
Wang Y, Lang J, Zuo JZ, Dong Y, Hu Z, Xu
X, Zhang Y, Wang Q, Yang L, Wong STC, et al: The radiomic-clinical
model using the SHAP method for assessing the treatment response of
whole-brain radiotherapy: a multicentric study. Eur Radiol.
32:8737–8747. 2022. View Article : Google Scholar : PubMed/NCBI
|
|
35
|
LeCun Y, Bengio Y and Hinton G: Deep
learning. Nature. 521:436–444. 2015. View Article : Google Scholar : PubMed/NCBI
|
|
36
|
Hussein S, Kandel P, Bolan CW, Wallace MB
and Bagci U: Lung and pancreatic tumor characterization in the deep
learning era: Novel supervised and unsupervised learning
approaches. IEEE Trans Med Imaging. 38:1777–1787. 2019. View Article : Google Scholar : PubMed/NCBI
|
|
37
|
Hirsch D and Gaiser T: Crohn's
disease-associated colorectal carcinogenesis: TP53 mutations and
copy number gains of chromosome arm 5p as (early) markers of tumor
progression. Pathologe. 39 (Suppl 2):S253–S261. 2018.(In German).
View Article : Google Scholar
|
|
38
|
Fujita M, Matsubara N, Matsuda I, Maejima
K, Oosawa A, Yamano T, Fujimoto A, Furuta M, Nakano K, Oku-Sasaki
A, et al: Genomic landscape of colitis-associated cancer indicates
the impact of chronic inflammation and its stratification by
mutations in the Wnt signaling. Oncotarget. 9:969–981. 2017.
View Article : Google Scholar : PubMed/NCBI
|
|
39
|
Ronneberger O, Fischer P and Brox T:
U-net: Convolutional networks for biomedical image segmentation.
Medical image computing and computer-assisted intervention-MICCAI
2015: 18th international conference, Munich, Germany, October 5–9,
2015, proceedings, part III 18. Springer; Cham: pp. 234–241.
2015
|