Introduction
Kidney cancer, including its most frequently
occurring type renal cell carcinoma (RCC), is a significant global
health issue (1). With a mortality
rate of ~175,000 death/year, kidney cancer markedly contributes to
global cancer-related fatalities (2). RCC is a heterogeneous disease with
various histological subtypes (3),
including clear cell, papillary, chromophobe and collecting duct
carcinoma. Clear cell RCC (ccRCC) is the most common histological
subtype, comprising 70–80% of all kidney cancer cases (4). The prognosis and treatment options for
kidney cancer depend on the stage of the disease at diagnosis, with
advanced or metastatic cases presenting significant challenges for
effective treatment (5).
The diagnosis of kidney cancer typically involves a
combination of clinical evaluation, imaging techniques such as
computed tomography scans and magnetic resonance imaging, and the
pathological examination of tumor tissue obtained by biopsy or
surgery (6,7). These diagnostic approaches may be used
to determine the extent of tumor growth, invasion and metastasis,
providing crucial information for the planning of treatment and
assessment of prognosis.
Current treatment strategies for kidney cancer
involve a multidisciplinary approach (7), including surgery, targeted therapies,
immunotherapies and radiation therapy. Surgical intervention, such
as partial or radical nephrectomy, remains the primary treatment
option for localized kidney tumors (6). However, the management of advanced or
metastatic kidney cancer poses considerable challenges, as it is
often associated with a poor prognosis and limited treatment
options (8).
Substantial progress has been made in understanding
the molecular landscape of kidney cancer, leading to the
development of targeted therapies (5,9).
Agents that inhibit the vascular endothelial growth factor (VEGF)
pathway, such as tyrosine kinase inhibitors (TKIs) (10) and anti-angiogenic monoclonal
antibodies (11), have shown
efficacy in the treatment of advanced kidney cancer. In addition,
immune checkpoint inhibitors targeting programmed cell death
protein 1 (PD-1) and PD-ligand 1 have demonstrated marked clinical
responses, highlighting the importance of the immune system in
combating kidney cancer (12,13).
Despite these advancements, treatment resistance and
disease progression remain major obstacles in the management of
kidney cancer. Therefore, it is urgently necessary to identify
novel therapeutic targets and develop innovative treatment
strategies for kidney cancer. Targeting tumor necrosis factor
(TNF), a pro-inflammatory cytokine with complex roles in
inflammation and immune regulation, has emerged as a potential
therapeutic approach (14,15). A previous study indicated that TNF
receptor superfamily member 1A (TNFRSF1A) and 1B (TNFRSF1B) are
regulated under inflammatory conditions, with the former promoting
inflammatory responses upon binding to TNF-α (16). However, whether TNFRSF1A is a
pro-inflammatory factor that acts against cancer or aids in the
immune evasion of cancer to promote carcinogenesis within renal
cancer tissue remains to be validated and explored.
In the present study, single-cell data analysis of
RCC was conducted to investigate the global characteristics of the
tumor microenvironment. The aim was to analyze the roles played by
key cellular components in the tumor microenvironment and predict
the involvement of the TNF signaling pathway in the development of
ccRCC. Comprehensive analysis suggested that TNFRSF1A may play a
pivotal role in the progression of ccRCC. Therefore, cell
experiments assessing proliferation, migration, invasion, the cell
cycle and apoptosis were performed to validate the pro-cancer
effects of TNFRSF1A and its potential as a therapeutic target for
ccRCC. Ultimately, the goal of the present study was to contribute
to the advancement of precision medicine and improve the prognosis
for patients with kidney cancer.
Materials and methods
Data sources
The raw single-cell sequencing data of 4 cases of
RCC and 1 case of normal kidney tissue were obtained from the
dataset GSE152938 (17) in the Gene
Expression Omnibus (https://www.ncbi.nlm.nih.gov/gds) database.
Additionally, the sequencing data and clinical information of
patients with ccRCC were obtained from The Cancer Genome Atlas
(TCGA; http://portal.gdc.cancer.gov)
database.
Single-cell data download and
conversion
Under the Linux environment, the Sequence Read
Archive (SRA) Toolkit version 2.11.3 (https://github.com/ncbi/sra-tools) was used as
follows: i) The prefetch tool was utilized to download the sample
data in the original SRA data format. ii) as the dataset was
generated using paired-end sequencing, the dump tool was employed
to split and convert the SRA files into 2–3 FASTQ files, with each
SRA file yielding two FASTQ files due to the high sequencing
quality of the dataset; and iii) files were renamed for improved
data organization and management.
scRNA-fseq data preprocessing
Sequence quality control and
alignment
FastQC (version 0.11.7; available at: http://www.bioinformatics.babraham.ac.uk/projects/fastqc/)
was executed in a Linux environment to perform a quality control
assessment of each FASTQ file. Cellranger (version 6.1.2;
http://www.10×genomics.com/support/software/cell-ranger/)
was then utilized for data alignment using the reference genome
refdata-gex-GRCh38-2020-A. The cellranger count command was used to
align the sequencing files with the reference genome, resulting in
matrix.mtx.gz, features.tsv.gz and barcodes.tsv.gz files that were
used for downstream bioinformatics analysis.
Preprocessing for analysis
The processed data were loaded into Seurat (version
3.1.1; http://github.com/satijalab/seurat/) for single-cell
analysis. Initially, the scDblFinder (version 3.16; http://github.com/plger/scDblFinder)
package was used to filter doublet cells from the dataset.
Additionally, genes associated with ribosomes, mitochondria and
blood cells were removed to eliminate interference. The filtering
and quality control criteria were set as follows: Genes expressed
in ≥1 cell, cells expressing ≥700 genes, count value ≥600 for each
gene, unique molecular identifier counts <500 and mitochondrial
gene expression limited to ~15% of total gene expression in each
single cell.
Cell type and subtype
identification
Seurat v3.1.1 were applied to integrate the
single-cell data from 18,347 ccRCC cells, 3,365 normal kidney
tissue cells, 10,168 papillary RCC cells, and 8,216 chromophobe RCC
cells. SCTransform (version 0.3.5; http://github.com/satijalab/sctransform) was used for
further data normalization and the calculation of expression
values. Principal component analysis (PCA) and non-linear
dimensionality reduction were performed using the normalized
expression values. Subsequently, preliminary clustering results
were visualized using t-distributed stochastic neighbor embedding
(t-SNE) and uniform manifold approximation and projection (UMAP)
algorithms. PCA, t-SNE and UMAP were performed using Seurat v3.1.1.
Cell identification was performed using the SingleR (version 1.0;
http://github.com/dviraran/SingleR)
package with manual identification based on marker genes, resulting
in several cell clusters and their corresponding cell types.
Further subclustering was performed using the same methods to
identify cell subtypes.
Copy number variation (CNV)
analysis
The infercnv (version 1.16.0; http://github.com/broadinstitute/infercnv) package was
used to determine large-scale chromosomal CNVs in somatic cells
based on single-cell data. This package inferred chromosomal
variations by comparing the expression intensity of genes at
different positions in tumor RNA to that in a set of reference
normal cells.
Functional annotation and pathway
enrichment
Gene Ontology (GO) functional annotation and Kyoto
Encyclopedia of Genes and Genomes (KEGG) pathway enrichment
analyses were conducted using the GO (https://www.geneontology.org/) and KEGG (https://www.genome.jp/kegg/) databases to elucidate
the higher-level functions and roles of relevant genes and proteins
in biological systems. GO terms and KEGG pathways with a Q-value
≤0.05 were considered significantly enriched. Both tools were
implemented using the R programming language. Abnormal cell
signaling can cause cancer and is a common target for treatment.
The PROGENy (version 1.22.0; http://saezlab.github.io/progeny/) package was used to
infer the signaling pathway activity of 14 abnormal signaling
pathways based on the gene expression data from the present study,
namely androgens, estrogens, EGFR, hypoxia, JAK-STAT, MAPK, NF-κB,
PI3K, p53, TGF-β, TNF-α, Trail, VEGF and WNT.
Pseudotime computation
Pseudotime analysis is a method used to infer the
developmental trajectory of cells (18). It is based on single-cell
transcriptomic data and involves quantifying the similarity of
cells, grouping the cells and arranging them in a sequence that
reflects their development and reveals their sequential
progression. The Monocle (version 2.26.0; http://cole-trapnell-lab.github.io/monocle-release/)
package was utilized to perform a single-cell trajectory analysis,
employing the DDR-Tree algorithm. In addition, the Slingshot
(version 2.8.0) package (19) was
used to infer the lineage of cells as they differentiate, structure
the lineages and place them on the original visualized clustered
graph.
Cell communication
Cell-cell communication (20) mediated by ligand-receptor complexes
plays a crucial role in tumor development and the associated
inflammatory responses. The iTALK (https://github.com/Coolgenome/iTALK) package was used
to compare the expression of ligand and receptor genes between
different cell types in RCC tissues, and thereby reveal
intercellular communication interactions. iTALK performs analyses
based on ligand-receptor expression patterns, co-expression
analysis and pathway enrichment analysis to elucidate cell-cell
communication networks. Additionally, the CellChat package (version
1.4.0; http://www.cellchat.org) (21) was used to further analyze and
visualize cell-cell communication networks for continuous cell
states along their developmental trajectories. These two tools were
integrated to perform a comprehensive analysis of single-cell RNA
sequencing data, and elucidate complex cell-cell communication
networks within the ccRCC microenvironment. The ggalluvial package
(https://corybrunson.github.io/ggalluvial) was used to
visualize the cell-cell networks into riverplots.
Bioinformatics analysis
The sequencing data and clinical information of
patients with ccRCC were downloaded from TCGA database for gene
expression analysis and the statistical analysis of clinical data.
The protein expression levels of genes positively associated with
TNFRSF1A and TNFRSF1B were derived from protein expression data for
ccRCC and normal tissues from the Clinical Proteomic Tumor Analysis
Consortium (CPTAC), which were accessed via the UALCAN online
database (22).
Cell culture
The human kidney carcinoma cell line 786-O and human
renal proximal tubular epithelial cell line HK-2 were bought from
Shanghai Zhongqiao Xinzhou Biotechnology Co., Ltd. The 786-O cells
were cultured in RPMI-1640 (HyClone; Cytiva) and the HK-2 cells
were cultured in DMEM (HyClone; Cytiva); both were supplemented
with 10% heat-inactivated FBS (PAN-Biotech GmbH) and 1%
Penicillin-Streptomycin (Gibco; Thermo Fisher Scientific, Inc.) in
a 5% CO2 incubator at 37°C.
Transfection of TNFRSF1A small
interfering RNA (siRNA) into 786-O cells
TNFRSF1A siRNA (si-TNFRSF1A) was used to suppress
TNFRSF1A expression in the experimental group. The sequences of
si-TNFRSF1A were as follows: Sense, 5′-GUGGAGAUCUCUUCUUGCATT-3′ and
antisense, 5′-UGCAAGAAGAGAUCUCCACTT-3′. A non-silencing siRNA
negative control (si-NC) was used to establish the NC group. The
sequences of si-NC were as follows: Sense,
5′-UUCUCCGAACGUGUCACGUTT-3′ and antisense,
5′-ACGUGACACGUUCGGAGAATT-3′ (Shanghai GenePharma Co., Ltd.).
Lipofectamine® 2000 (Invitrogen; Thermo Fisher
Scientific. Inc.) was used as the transfection reagent. The cells
were transfected at 37°C for 2 h with 20 pM siRNA in a 1:1 volume
with Lipofectamine 2000, after which, the medium was replaced with
complete medium. After a further 24 h of incubation at 37°C, the
cells were used in further experiments.
Reverse transcription-quantitative
polymerase chain reaction (RT-qPCR)
Total RNA was extracted from the cells using
TRIzol® reagent (Invitrogen; Thermo Fisher Scientific.
Inc.). RT was carried out using a RT kit (Promega GoScript™ Reverse
Transcription System; Thermo Fisher Scientific. Inc.), according to
manufacturer's protocol, and qPCR was then performed using SYBR
Green methodology (PerfectStart® Green qPCR SuperMix;
TransGen Biotech Co., Ltd.). The thermal cycling conditions for
qPCR were as follows: Initial denaturation at 94°C for 5 min,
followed by 40 cycles of denaturation at 94°C for 15 sec and
annealing/extension at 60°C for 1 min. GAPDH was the internal
reference gene. The primer sequences (BGI Genomics) were as
follows: TNFRSF1A forward, 5′-ATTGGACTGGTCCCTCACCT-3′- and reverse,
5′-CACTCCCTGCAGTCCGTATC-3′; GAPDH forward,
5′-AAGGTGAAGGTCGGAGTCAA-3′ and reverse, 5′-AATGAAGGGGTCATTGATGG-3′.
The 2−ΔΔCq method was used for quantification (23). The silencing effect of si-TNFRSF1A
was confirmed by RT-qPCR. The expression levels in the si-TNFRSF1A
group were compared with those in the NC and mock groups using
one-way ANOVA followed by Tukey's honestly significant difference
(HSD) post hoc tests.
Cell proliferation
Cell Counting Kit-8 (CCK-8; Dojindo Laboratories,
Inc.) was used to assess the proliferation of 786-O cells.
Specifically, 5×10³ cells in 100 µl were seeded per well
of a 96-well plate 24 h after transfection. Each treatment group
was subjected to testing with ≥3 replicates. Cell proliferation was
detected at 0, 24, 48 and 72 h after seeding. The cells were
incubated with the CCK-8 reagent for 2 h and the absorbance of each
sample was determined at 450 nm using a microplate reader
(SpectraMax M5; Molecular Devices, LLC).
A 5-ethynyl-2′-deoxyuridine (EdU) assay was also
performed, in which 786-O cells 24 h after siRNA transfection were
treated with 10 µM EdU for 2 h using the BeyoClick™ EdU Cell
Proliferation Kit with Alexa Fluor 594 (Beyotime Institute of
Biotechnology). Subsequently, the cells were fixed with 4%
polyformaldehyde in PBS at room temperature for 30 min, washed and
then incubated with Enhanced Immunostaining Permeabilization
Solution (Beyotime Institute of Biotechnology) at room temperature
for 10 min. After additional washes, the cells were incubated with
Click Addictive Solution (Beyotime Institute of Biotechnology) for
30 min in the dark at room temperature. Finally, the cell nuclei
were stained with 1X Hoechst 33343 solution at room temperature for
10 min. Fluorescence microscopy was performed in five randomly
selected fields to assess the proliferation rate. Blue fluorescence
represented Hoechst 33343 staining of the cell nuclei, red
fluorescence indicated the staining of EdU in proliferating cells,
and the red/blue ratio indicated the proportion of proliferating
cells. All assays were repeated at least three times.
Colony formation assay
A single cell suspension comprising 786-O cells
treated with either si-TNFRSF1A or si-NC was prepared. The
suspension was diluted to 1×10³ cells/well in a 6-well
plate with three replicates per group, and then 2 ml RPMI-1640 was
added. The plates were incubated in a humidified atmosphere at 37°C
with 5% CO2 for 2 weeks. Images were captured after
30-min fixing with 4% paraformaldehyde and 10-min staining with
0.1% crystal violet at room temperature. The number of cell
colonies was manually counted. Each independently counted colony
refers to a cluster of ≥50 cells visible under the microscope, with
clear boundaries or spatial separation from other colonies. The
experiment was repeated three times.
Cell migration and invasion
assays
For the wound healing assay, the transfected 786-O
cells were seeded in 6-well plates and cultured until they reached
80–90% confluence. Next, a straight line was scratched in the
middle of the cell layer in each well with a 2-ml pipette tip and
the RPMI-1640 medium was replaced with Opti-MEM I Reduced Serum
Medium (Gibco; Thermo Fisher Scientific, Inc.) The wounds were
imaged under an inverted fluorescence microscope (Nikon
Corporation) at 0 and 24 h after wounding. The percentage reduction
in the width of the wound after cell migration from the edge of the
scratch to the center of the scratch was observed.
In the Transwell assays, 5×10⁵ cells/ml
(100 µl) in Opti-MEM I Reduced Serum Medium were seeded in the
upper chamber of a 24-well Transwell apparatus (Costar; Corning,
Inc.), which contained either an uncoated or Matrigel-coated
membrane. For pre-coating, the chambers were incubated with 10%
Matrigel at 37°C for 2 h. Then, 600 µl medium containing 20% FBS
was placed the lower chambers. After 24 h at 37°C, the cells that
crossed the inserts were stained with 0.1% crystal violet at room
temperature for 20 min and then washed with PBS. Finally, three
fields in each well were randomly selected and images captured
under a TS2FL inverted fluorescence microscope (Nikon Corporation)
to count the number of migrated or invaded cells. In addition, the
crystal violet was washed away with 200 µl 33% acetic acid,
collected in a 96-well plate, and its absorption at 570 nm was
measured. These experiments were repeated at least three times.
Cell cycle and apoptosis assays
For flow cytometric cell cycle analysis, following
transfection with si-TNFRSF1A or si-NC for 24 h, 786-O cells were
harvested and resuspended in 1 ml PBS (1×10⁶/ml), and
then treated according to the instructions of the Cell Cycle
Staining Kit [MultiSciences (Lianke) Biotech Co., Ltd.]. Briefly,
the supernatant was removed after centrifugation at 1,000 × g under
room temperature for 3 min, then 1 ml DNA staining solution was
added, and the cells were stained for 30 min in the dark at room
temperature. Finally, the cell cycle was analyzed by flow cytometry
(Beckman CytoFLEX S; Beckman Coulter, Inc.) using FlowJo software
(version 10.9.0; FlowJo LLC) for quantification.
An Annexin V-FITC/PI staining assay was also
performed to quantify apoptosis. Following transfection with
si-TNFRSF1A or si-NC for 24 h, 786-O cells were collected, washed
with PBS, and resuspended in 500 µl binding buffer. Subsequently, a
mixture of 5 µl Annexin V-FITC and 10 µl PI [Annexin V-FITC/PI
Apoptosis Kit; MultiSciences (Lianke) Biotech Co., Ltd.] was added
to the cells, and the solution was incubated at room temperature
for 5 min. The apoptotic cells were detected by flow cytometry and
quantified using FlowJo v10.9.0 software. All samples were assayed
in triplicate.
Statistical analysis
All data were processed using R software (version
3.6.0, http://cran-archive.r-project.org/bin/windows/base/old/3.6.0),
GraphPad 8.0 (Dotmatics) and SPSS version 23.0 (IBM Corp.).
Differences between two groups, including those in expression data
from TCGA database, were examined using the unpaired t-test.
Clinical data were analyzed using one-way ANOVA, as well as
univariate and multivariate logistic regression analyses. One-way
ANOVA was also used for the comparison of the three groups in the
transfection assay. Tukey's HSD test was employed as the post hoc
test following ANOVA. The stats package (version 4.3.2; http://www.rdocumentation.org/packages/stats/) was
used to calculate the Pearson correlation coefficient, and the
ggplot2 package (version 3.3.4; http://cran.r-project.org/src/contrib/Archive/ggplot2/)
was used to visualize the results. RStudio (version 2023.06.0;
http://docs.posit.co/ide/news/#rstudio-2023.06.0)
was employed as the tool for analysis. Data are presented as the
mean ± standard deviation. P<0.05 was considered to indicate a
statistically significant result. All experiments were performed at
least three times.
Results
Single-cell landscape and phenotypes
of RCC
Raw data obtained for RCC and normal kidney tissues
were preprocessed to obtain the corresponding expression profiles.
Subsequently, doublet-cell filtering and quality control were
applied to the data from different sample types, resulting in four
cell-gene matrices. For the most common type of renal cell
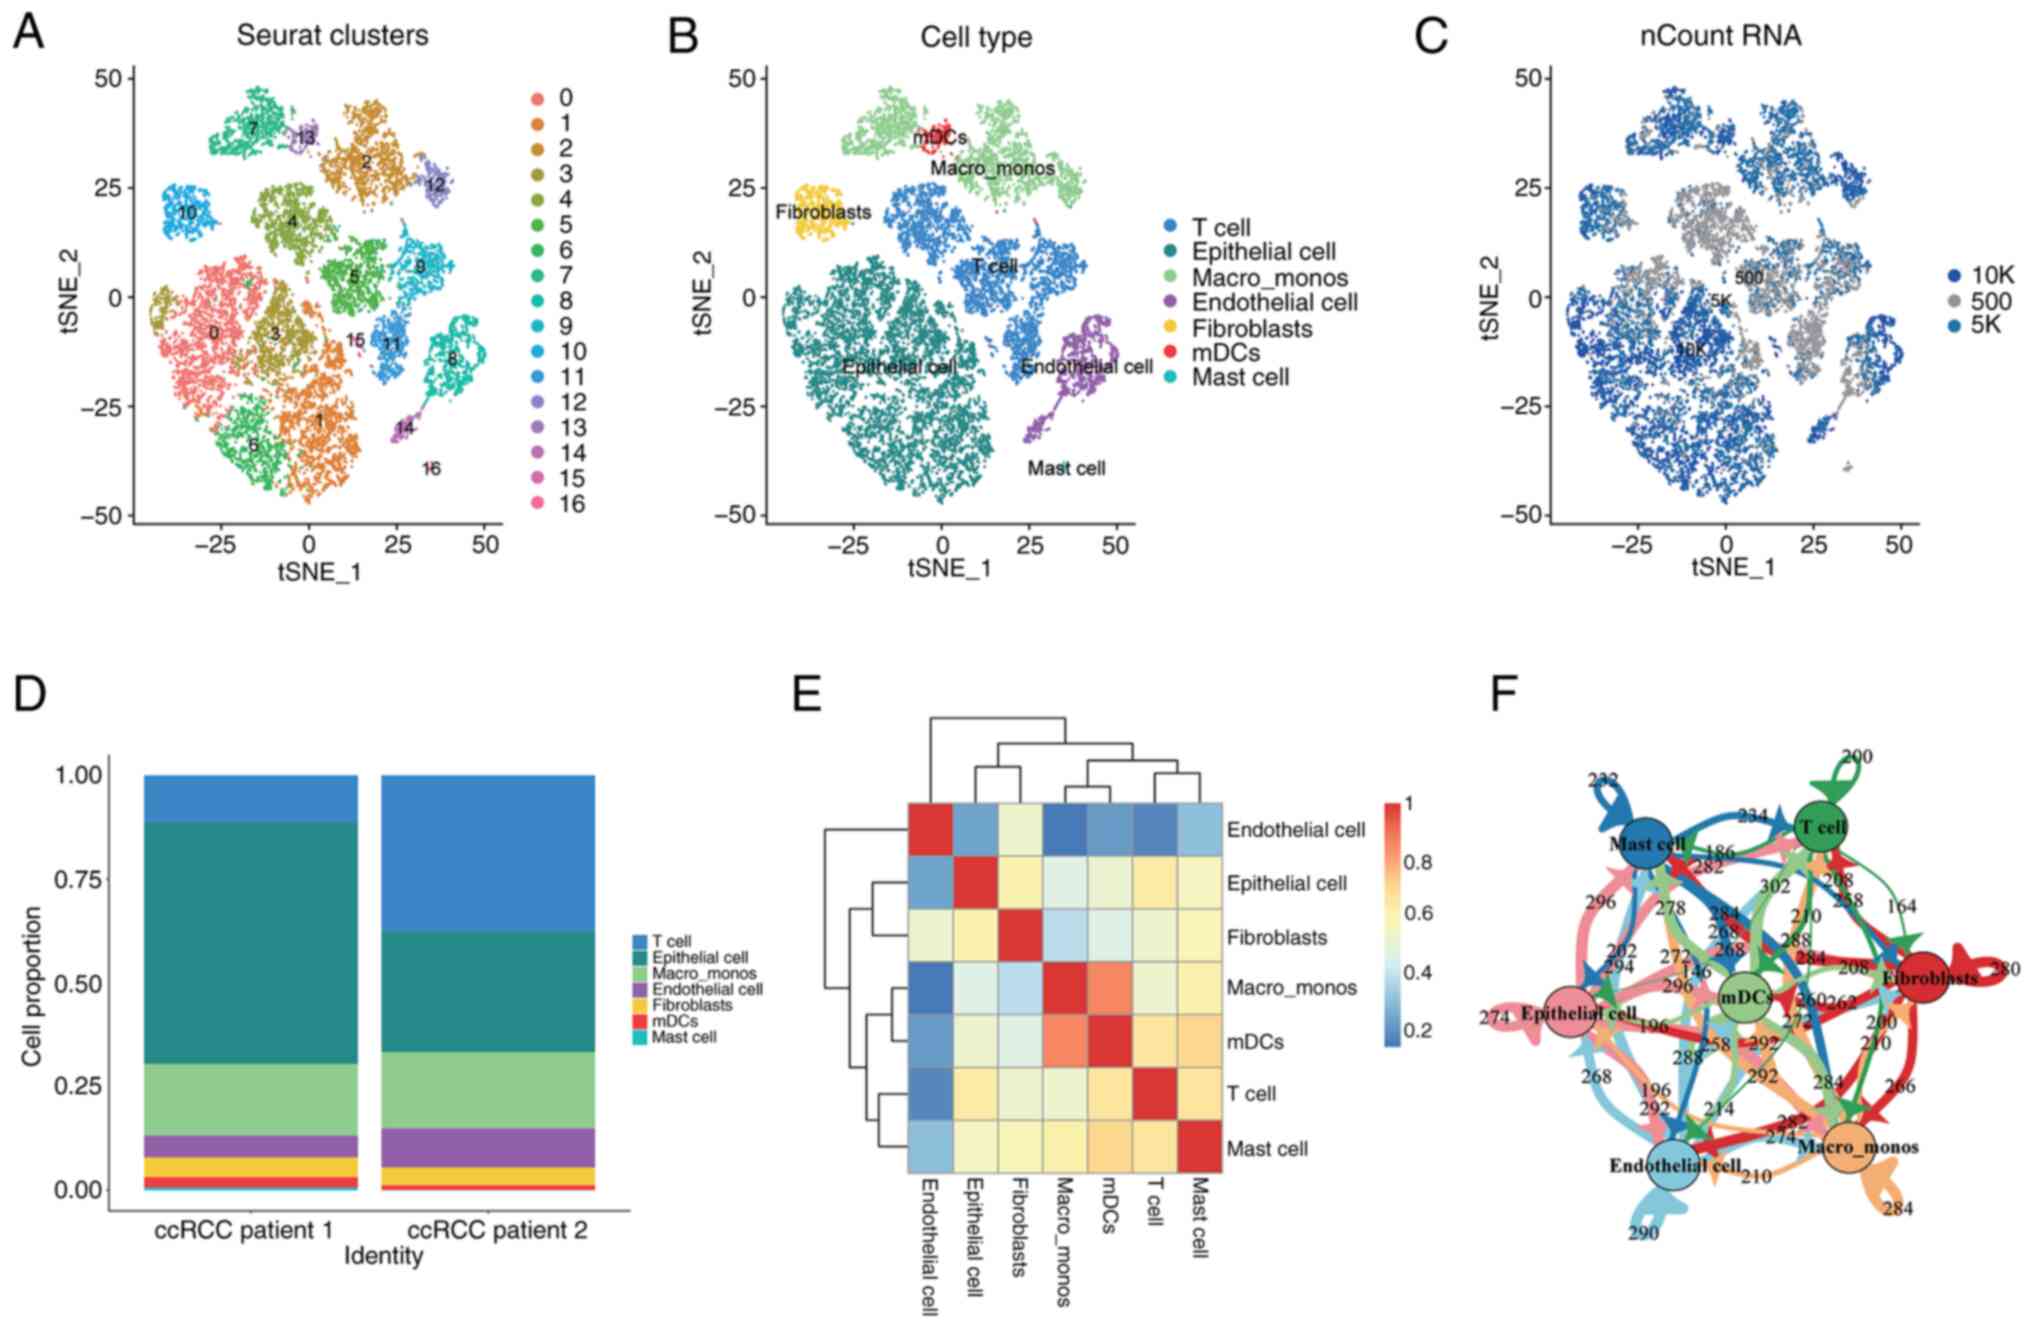
carcinoma, ccRCC, PCA was performed followed by dimensionality
reduction, resulting in the classification of cells into 17
distinct clusters (Fig. 1A).
The 17 cell clusters were further characterized and
grouped based on the specific marker gene expression of different
cell populations, which revealed seven major categories: Epithelial
cells, T cells, monocytes/macrophages, endothelial cells,
fibroblasts, plasmacytoid dendritic cells and mast cells (Fig. 1B). The distribution of the number of
transcripts captured in each cell were visualized on the cluster
plot (Fig. 1C). By examining the
distribution levels of each cell population across the samples
(Fig. 1D), it was observed that T
cells and epithelial cells were the predominant cell populations in
ccRCC, while other cell types were relatively rare. Additionally,
correlation analysis among the cell populations showed that each
cluster was independent and endothelial cells were the most
independent stromal cell type in the tumor microenvironment, which
had the lowest correlation with other cell types (Fig. 1E). Numerous interactions and mutual
influences among different cell populations were observed within
the tumor microenvironment (Fig. 1E and
F).
Similarly, cell clustering and visualization
analysis were performed on papillary RCC, chromophobe RCC and
normal kidney tissues (Fig. S1).
Different types of RCC exhibited heterogeneity in the composition
of their cell populations.
Malignancy and heterogeneity analysis
of ccRCC epithelial cells
The epithelial cell population of ccRCC exhibits
abundant heterogeneity, with a total of 6,943 epithelial cells
identified by the cell identification analysis. Based on the marker
gene expression patterns and predicted functional characteristics
of each cell cluster, six putative subtypes of epithelial cells
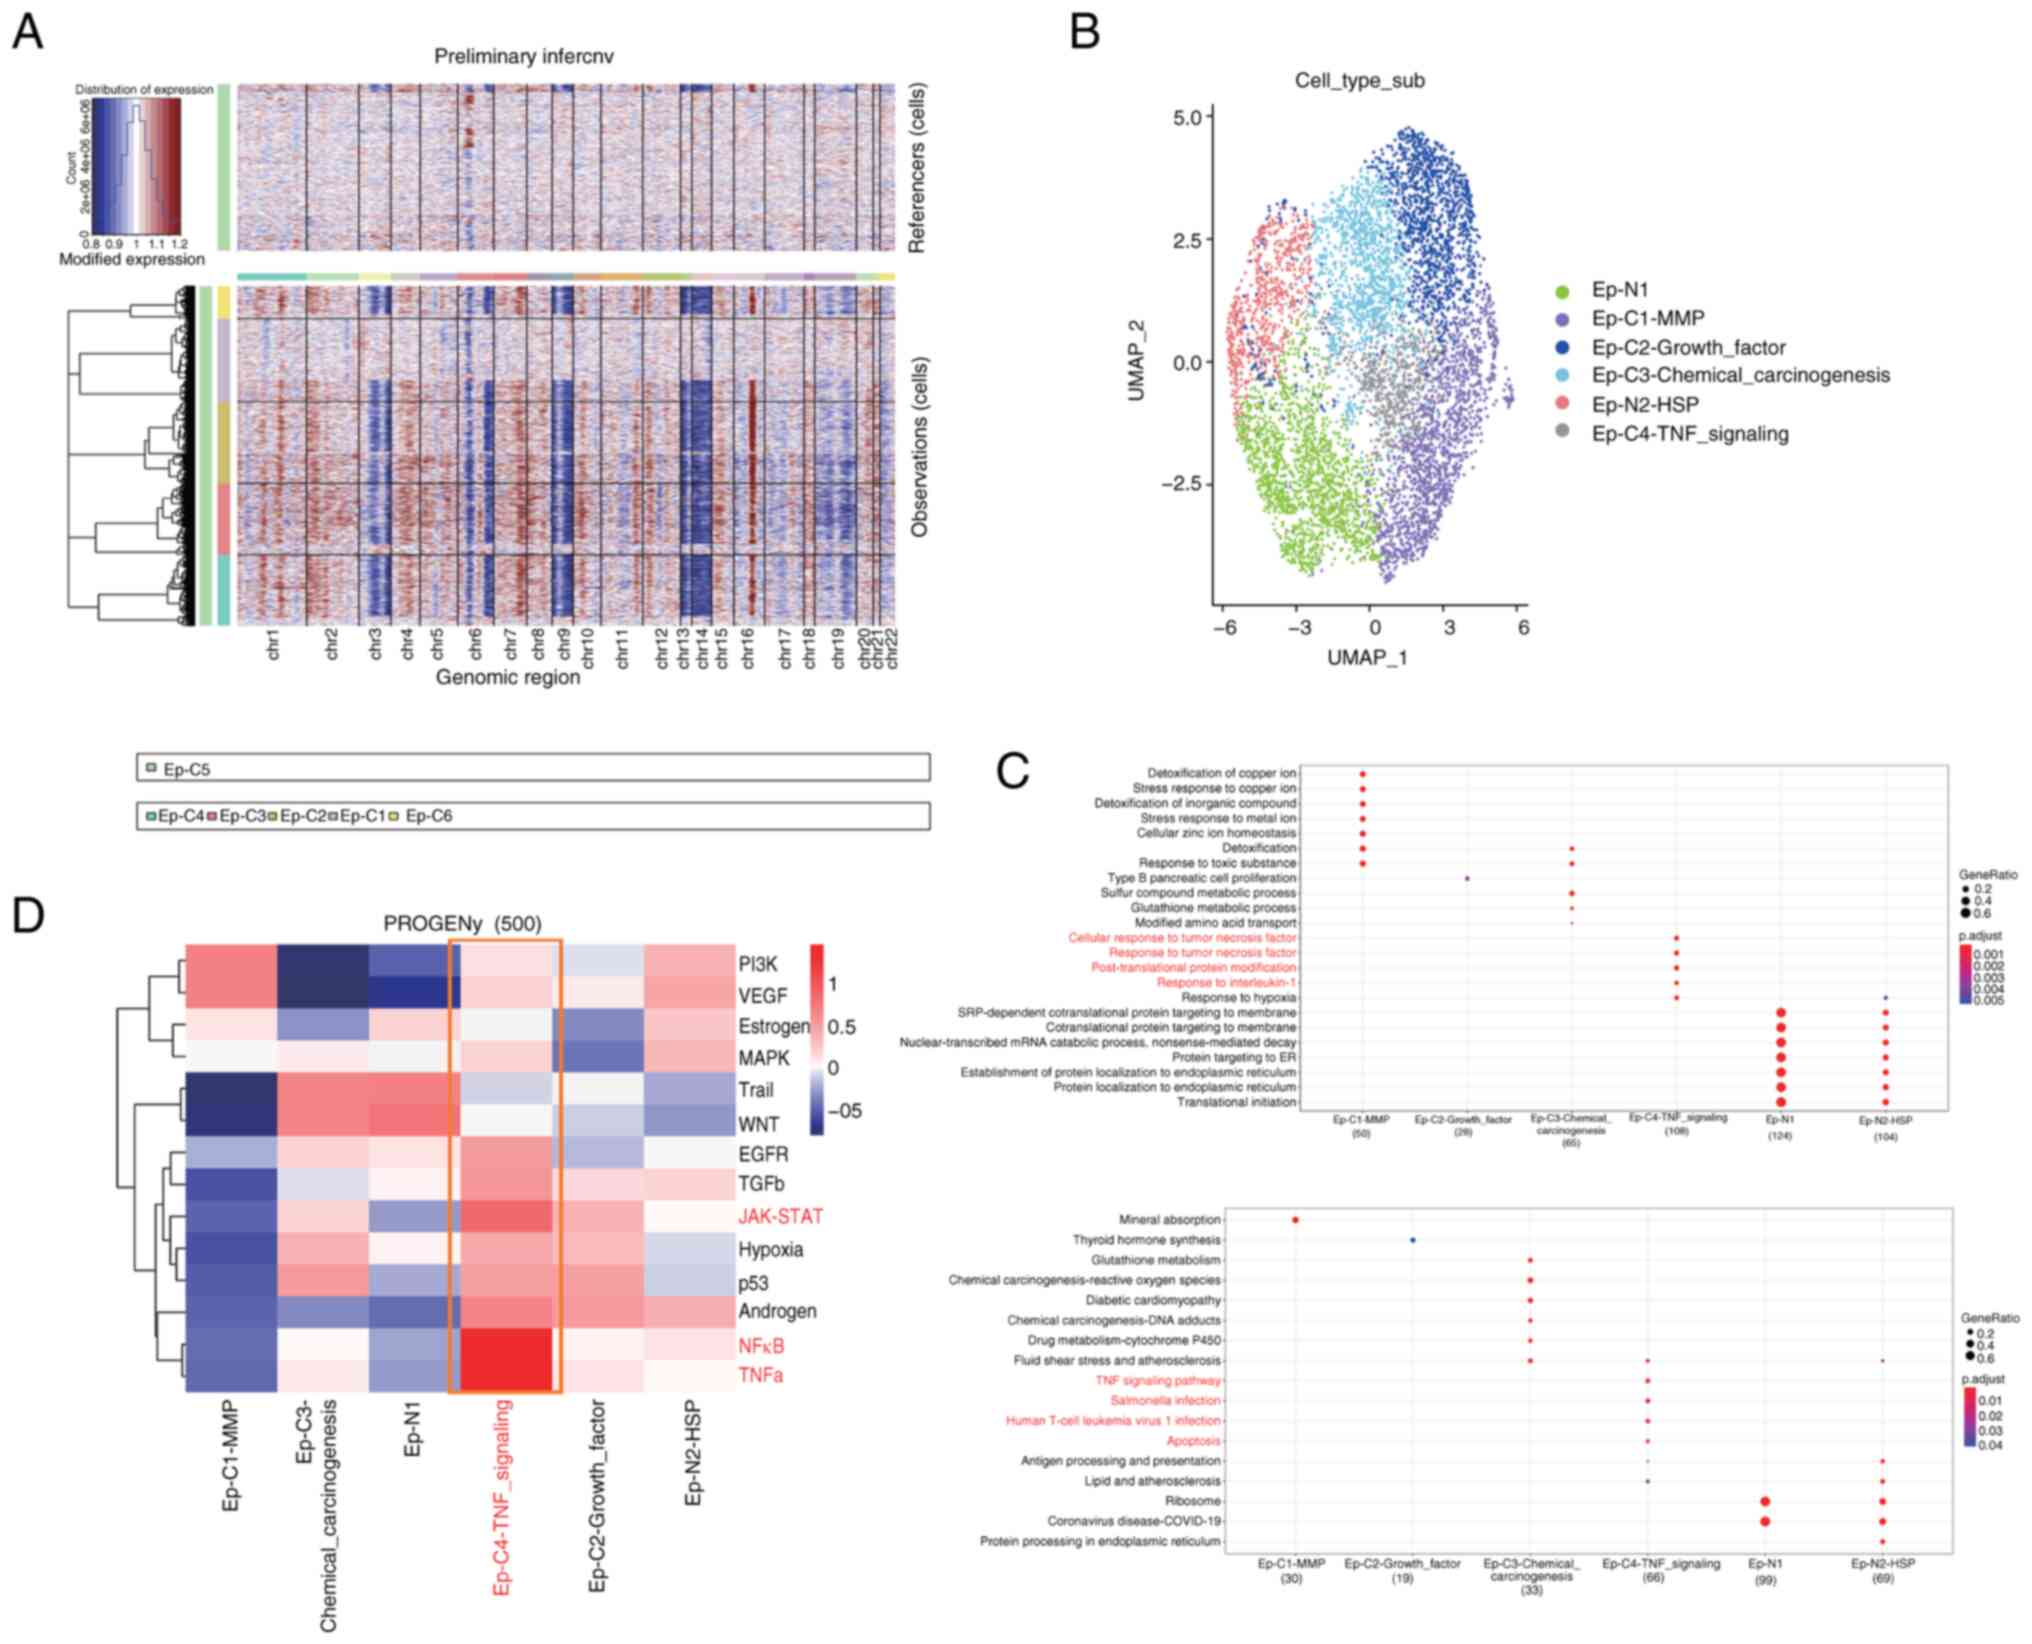
were identified. CNV analysis was performed on each cell cluster to
identify tumor cells. Clusters C1 and C5 were found to exhibit the
lowest levels of CNV, while clusters C2-4 and C6 showed higher
levels of CNV (Fig. 2A). Therefore,
it was initially hypothesized that the former clusters represented
normal epithelial cell populations, while the latter represented
tumor epithelial cell populations. Subsequently, a combination of
marker gene expression and prediction using the SingleR package was
used for the further identification and characterization of the
epithelial cell subtypes (Fig.
2B).
GO and KEGG functional and pathway enrichment
analyses were performed on the six subtypes of epithelial cells, as
shown in Fig. 2C. Functional and
pathway similarities were observed between the two normal cell
populations, N1 and N2, while significant functional heterogeneity
was observed among the cancer cell populations C1-C4. Among all
subtypes, it was noted that the Ep-C4-TNF signaling cell
population, which represents a small proportion of the cells, was
enriched in important pathways such as ‘TNF signaling pathway’,
‘Salmonella infection’, ‘Human T-cell leukemia virus 1 infection,’
and ‘Apoptosis’. Furthermore, its functions were significantly
enriched in ‘cellular response to tumor necrosis factor’, ‘response
to tumor necrosis factor’, ‘post-translational protein
modification’ and ‘response to interleukin-1’. Thus, a clear
association between this cell population and TNF was identified.
TNF has both beneficial and detrimental effects in tumor
progression, as it has the potential to inhibit tumor cell
proliferation as well as the ability to induce tumor growth
(24,25). It was originally found that
macrophages secrete this cytokine into the tumor microenvironment,
inducing the apoptosis of tumor cells and exerting antitumor
effects (26,27). However, subsequent studies
discovered that tumor cells also secrete TNF, leading to cytotoxic
resistance, immune escape, the promotion of cancer cell
infiltration, tumor vascularization and the induction of cancer
cell differentiation (28,29).
Using the PROGENy package (Fig. 2D), the classical tumor pathways that
these cell populations may be involved in were investigated. It was
found that the complexity of the role of each cell population in
ccRCC tissue varies in different tumor pathways. Notably, cell
population C1 was enriched in the classic PI3K/AKT tumor pathway
and VEGF signaling pathway, both of which are associated with tumor
angiogenesis. In addition, cell population C4 showed significant
enrichment in the TNF-α and NF-κB pathways, which promote
uncontrolled cell growth and tumor progression (30,31).
Subsequently, a correlation analysis of the key TNF
pathway genes, TNFRSF1A and TNFRSF1B, in ccRCC tissue were
performed using TCGA database (Fig.
S2). The results revealed that TNFRSF1A gene expression clearly
correlated with cell cytoskeleton- and cell motility-related genes,
namely MAP7 domain containing 1, tubulin β 6 classV and zyxin. By
contrast, TNFRSF1B gene expression closely correlated with tumor
angiogenesis-related genes, namely IL16, WASP actin nucleation
promoting factor and vav guanine nucleotide exchange factor 1.
Moreover, the protein expression levels of these genes in the
cancer cell population were markedly higher than those in the
non-cancer cell population, as revealed by analysis of ccRCC data
from the CPTAC database.
Based on the results of the enrichment analysis, it
may be speculated that TNF-associated epithelial cell populations
play a role in increasing tumor immune resistance, promoting cancer
cell motility and infiltration, and facilitating tumor angiogenesis
within the tumor tissue. This suggests that targeting such cell
populations could serve as a therapeutic target in antitumor immune
therapy.
TNF signaling networks in the complex
microenvironment of ccRCC
Following exploration of the heterogeneity of
epithelial cells in the ccRCC microenvironment, the immune
composition and constructed networks of this microenvironment were
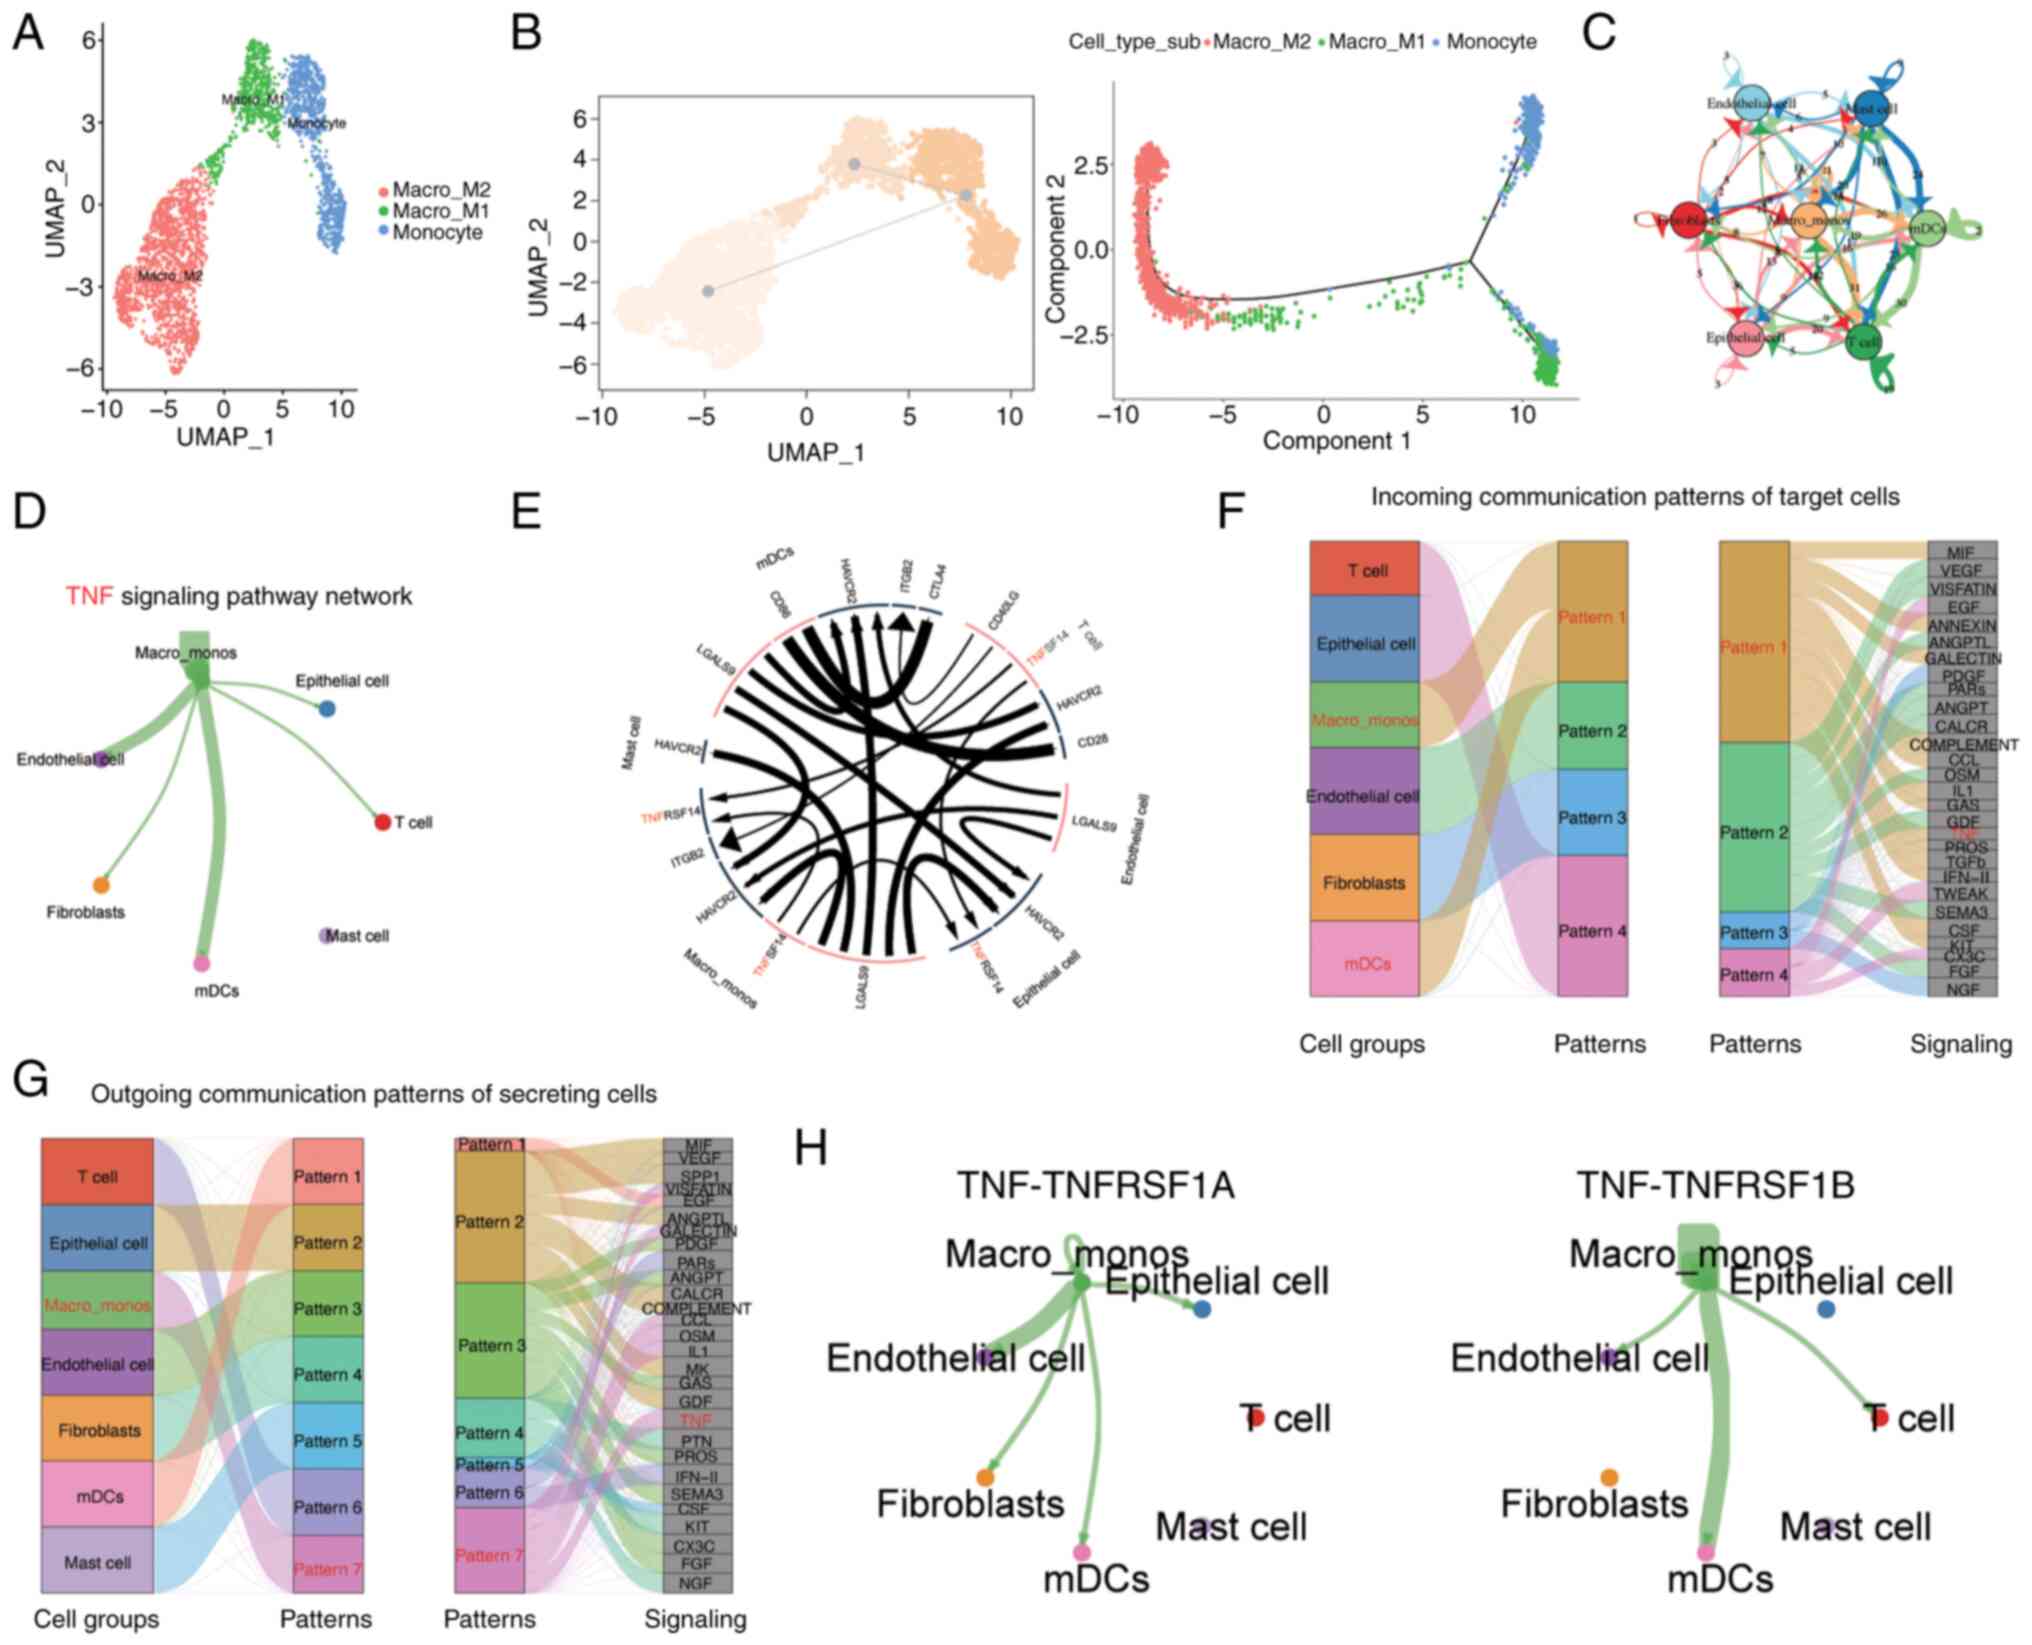
analyzed. Based on the characteristics of cell populations and the
specific expression of marker genes, three subgroups within the
monocyte/macrophage cell population were identified, namely the
Macro_M1, Macro_M2, and Monocyte groups (Fig. 3A). Through pseudotime analysis, it
was observed that the monocyte cell population evolved into M1 and
M2 macrophages at the pseudotime starting point (Fig. 3B), which is consistent with the
theory that monocytes transition into macrophages (32). Furthermore, the subtyping analysis
of T cells was performed (Fig.
S3A) and T cells were divided into six distinct subgroups based
on their characteristics. Through functional enrichment analysis, a
cluster of highly proliferative CD8+ T-cell subtypes was
identified. These cells showed enrichment in GO functions
associated with mitotic nuclear division, nuclear division,
organelle fission and chromosome segregation (Fig. S3B). This implies that following the
stimulation of ccRCC, this cell cluster is activated to undergo
rapid proliferation, with an expansion in number via cell division,
and an enhanced ability to combat pathogens or tumors. These highly
active cells are likely to exhibit strong cytotoxic activity and
eliminate abnormal cells via the release of cytotoxic substances.
Therefore, the proliferative activity of this cell population may
be crucial for an effective immune response.
Subsequently, to investigate the intercellular
communication occurring within the ccRCC microenvironment, the
CellChat method was used to construct a comprehensive cell
communication network and visualize the top interacting pairs and
communicating cell populations. This indicated that the
monocyte/macrophage cell population exhibited a prominent presence
in the microenvironmental communication network (Fig. 3C). Key pathways involved in
important communication processes were predicted and the TNF
signaling pathway was identified as one of the most crucial
pathways (Fig. 3E-G). Through this
signaling pathway analysis, it was observed that
monocyte/macrophage cells were the predominant senders of signals
compared with other cell types, while other cell types, with the
exception of mast cells, were regulated by this signal (Fig. 3D). The major interacting pairs
within this network were found to be TNF-TNFRSF1A and TNF-TNFRSF1B
(Fig. 3H). TNFRSF1A, also known as
TNFR1, is expressed on almost all cells in the body. By contrast,
TNFRSF1B, also known as TNFR2, is considered to be highly specific
to the tumor microenvironment and is a potential driver of immune
escape and tumor proliferation (33,34).
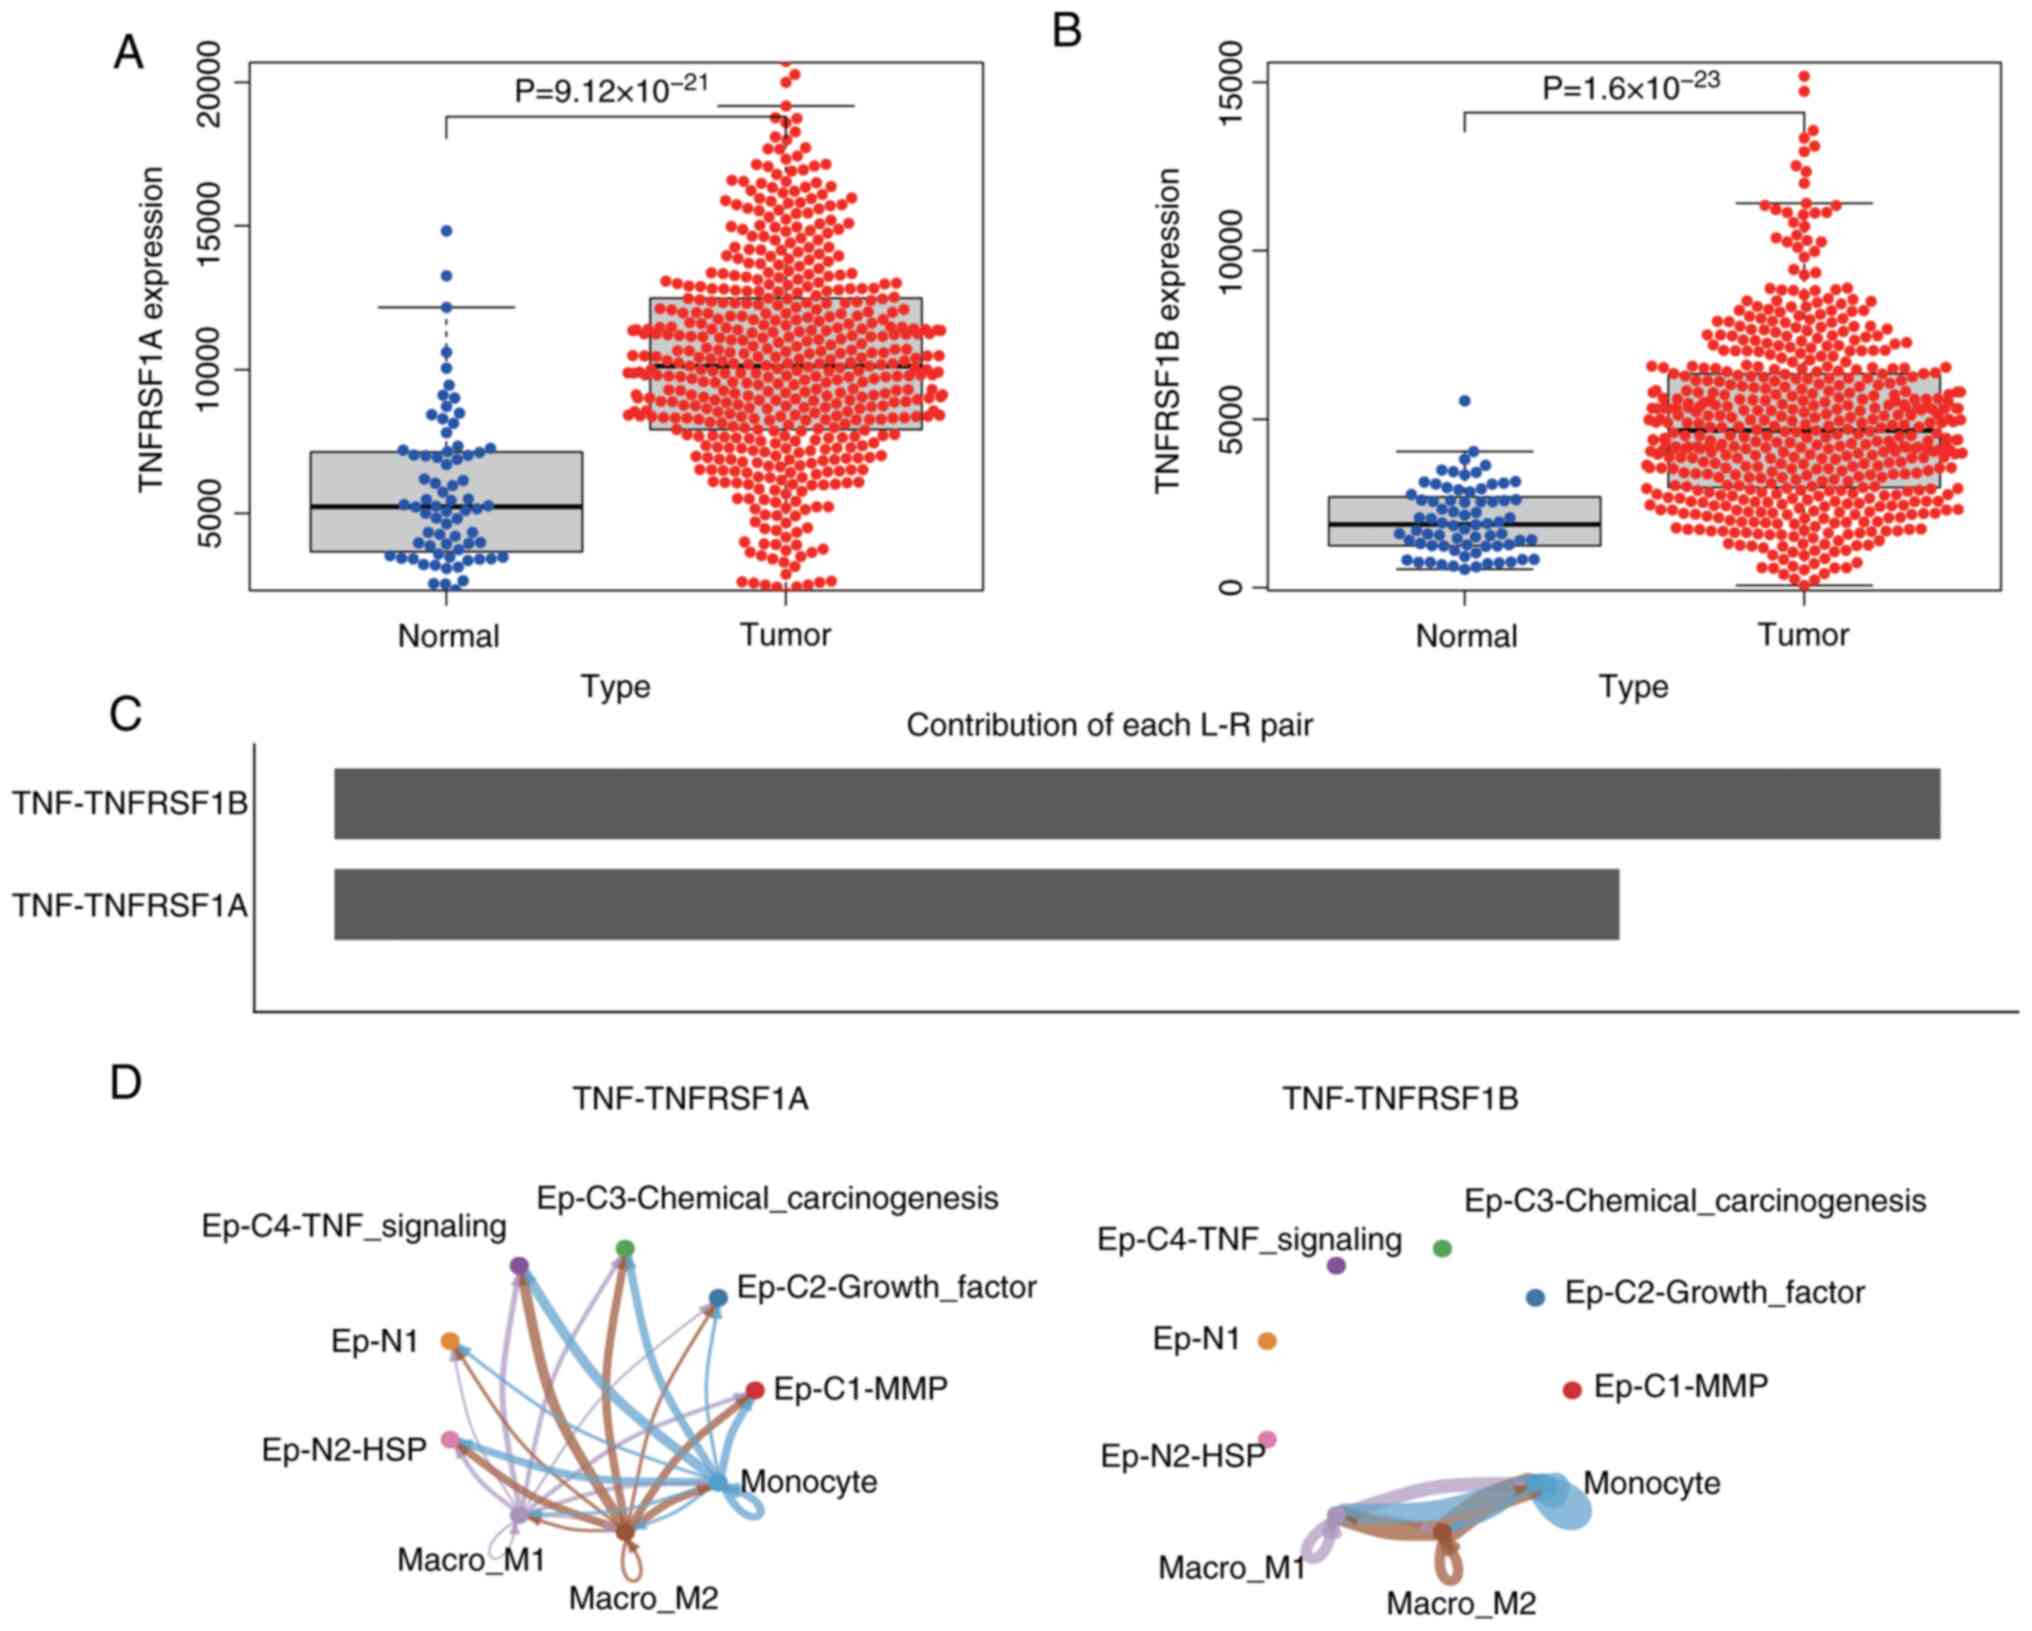
To further investigate the potential role of
monocyte/macrophage cells in the epithelial cancer cell population
of ccRCC, the gene expression profile of ccRCC in TCGA database was
analyzed. The results revealed that the expression levels of
TNFRSF1A and TNFRSF1B in ccRCC were significantly higher than in
normal tissues (Fig. 4A and B).
Additionally, a communication network between monocyte/macrophage
cells and epithelial cells was constructed. The results predicted
that the interaction weight of TNF-TNFRSF1B was higher than that of
TNFRSF1A (Fig. 4C), and the
interaction with TNF-TNFRSF1B was limited to subgroups of
monocyte/macrophage cells, while the TNF-TNFRSF1A network exhibited
cross-talk between monocyte/macrophage cell subgroups and
epithelial cell subgroups (Fig.
4D). This suggests that TNF activates various signaling
pathways through TNFRSF1A, such as the NF-κB and MAPK pathways in
the Ep-C4-TNF-signaling cell subgroup, thereby influencing cancer
cell proliferation, survival and metastasis. However, the
interaction between TNF and TNFRSF1A may directly affect other
cells involved in inflammation and immune regulation, and impact
the survival, proliferation and cytokine production of other
epithelial and immune cells, thus affecting immune function.
Furthermore, these findings suggest that the interaction between
TNF and TNFRSF1B modulates the immune response in the tumor
microenvironment, indirectly influencing tumor immune evasion and
the effectiveness of antitumor immune therapy.
In normal kidney tissue, the TNF pathway also
exhibits significant intercellular crosstalk, but this is limited
to interactions between monocyte/macrophage cells and immune cells.
The corresponding receptor genes were found not to be activated on
the surface of normal tissue epithelial cells (Fig. S4). The TNF-TNFRSF1B interaction
network in normal tissue exhibited a pronounced high-weight
interaction. In comparison to the TNF pathway in ccRCC,
TNF-TNFRSF1B signaling demonstrated a more pronounced intensity in
cancer tissue. Furthermore, it is noteworthy that the TNF-TNFRSF1A
interaction was found to be highly specific for the epithelial
cells of ccRCC tissue.
TNFRSF1A promotes RCC progression
In the preceding analysis, the existence of a cancer
cell subpopulation associated with the functionality of the
TNF-associated signaling pathway was identified. Furthermore, in
the RCC communication network, the strength and specificity of the
TNF-TNFRSF1B interaction were higher than those in normal tissue.
However, the TNF-TNFRSF1A interaction exhibited greater
specificity, particularly in the communication process between
monocytes/macrophages and epithelial cells in RCC. In a previous
study, Hwang et al (35)
identified the TNF signaling pathway as being pivotal in the
context of tyrosine kinase inhibitor (TKI) resistance in advanced
ccRCC, and suggested that TNFRSF1A expression could potentially
serve as a predictive biomarker for an unfavorable clinical
response to TKIs in ccRCC. Therefore, the present study focused on
the specific perturbation of TNFRSF1A in the epithelial cell
population.
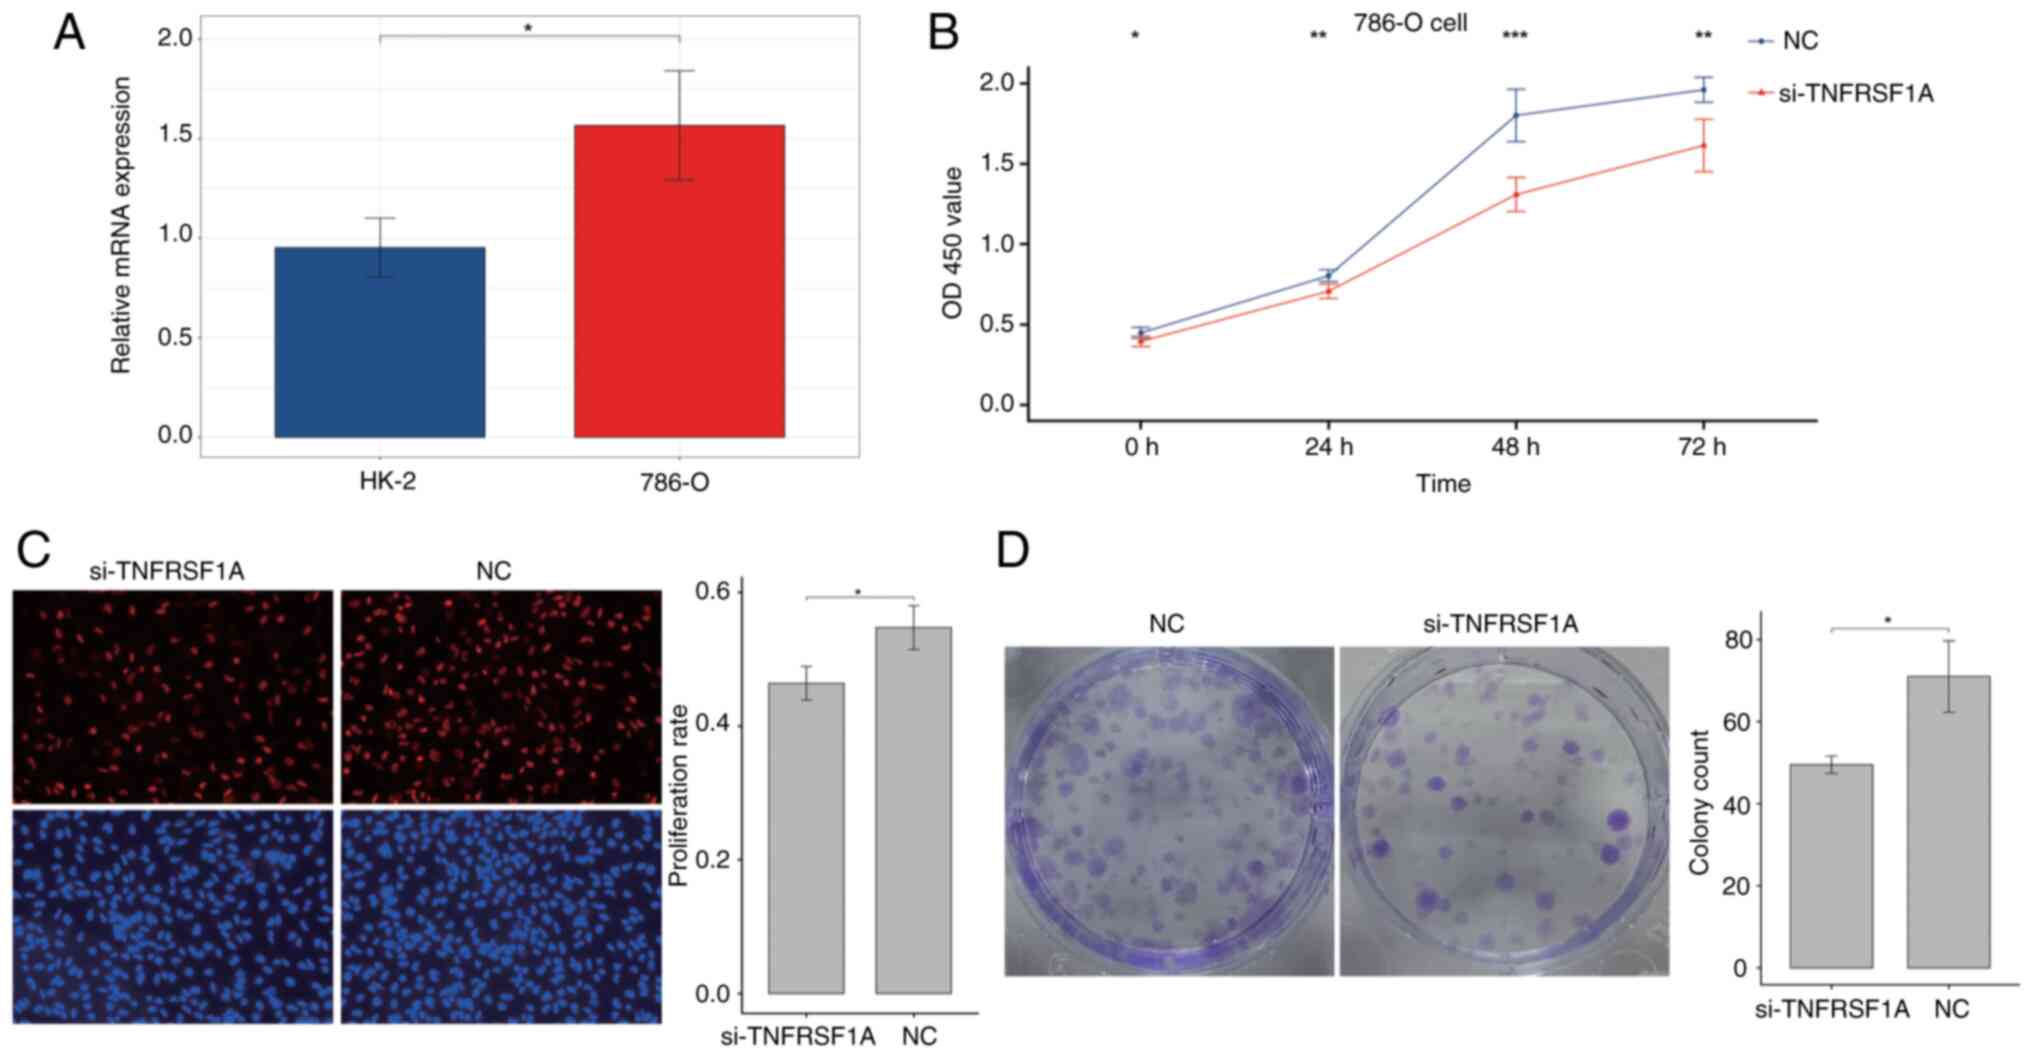
Firstly, the expression of TNFRSF1A was tested in
the renal cancer cell line 786-O and the normal renal cell line
HK-2 via RT-qPCR (Fig. 5A). The
results showed that TNFRSF1A expression in the tumor cell line was
significantly higher compared with that in the normal cell line.
Then, the expression of TNFRSF1A was knocked down in 786-O cells
using siRNA (Fig. S5) and the
transfected cells were analyzed in a CCK-8 experiment. The results
showed a significant reduction the proliferation of the renal
cancer cells transfected with si-TNFRSF1A compared with those
transfected with si-NC (Fig. 5B).
Additionally, cell proliferation was further examined using the EdU
assay and a significant reduction in the proliferation rate in the
experimental group was observed following TNFRSF1A knockdown
compared with that in the NC group (Fig. 5C). Furthermore, the results of the
colony formation assay using the treatment and control renal cancer
cells showed that colony formation in the si-TNFRSF1A group was
significantly lower than that in the NC group, indicating a
significant reduction in independent survival capability (Fig. 5D). Therefore, it was concluded that
TNFRSF1A promotes ccRCC cell proliferation.
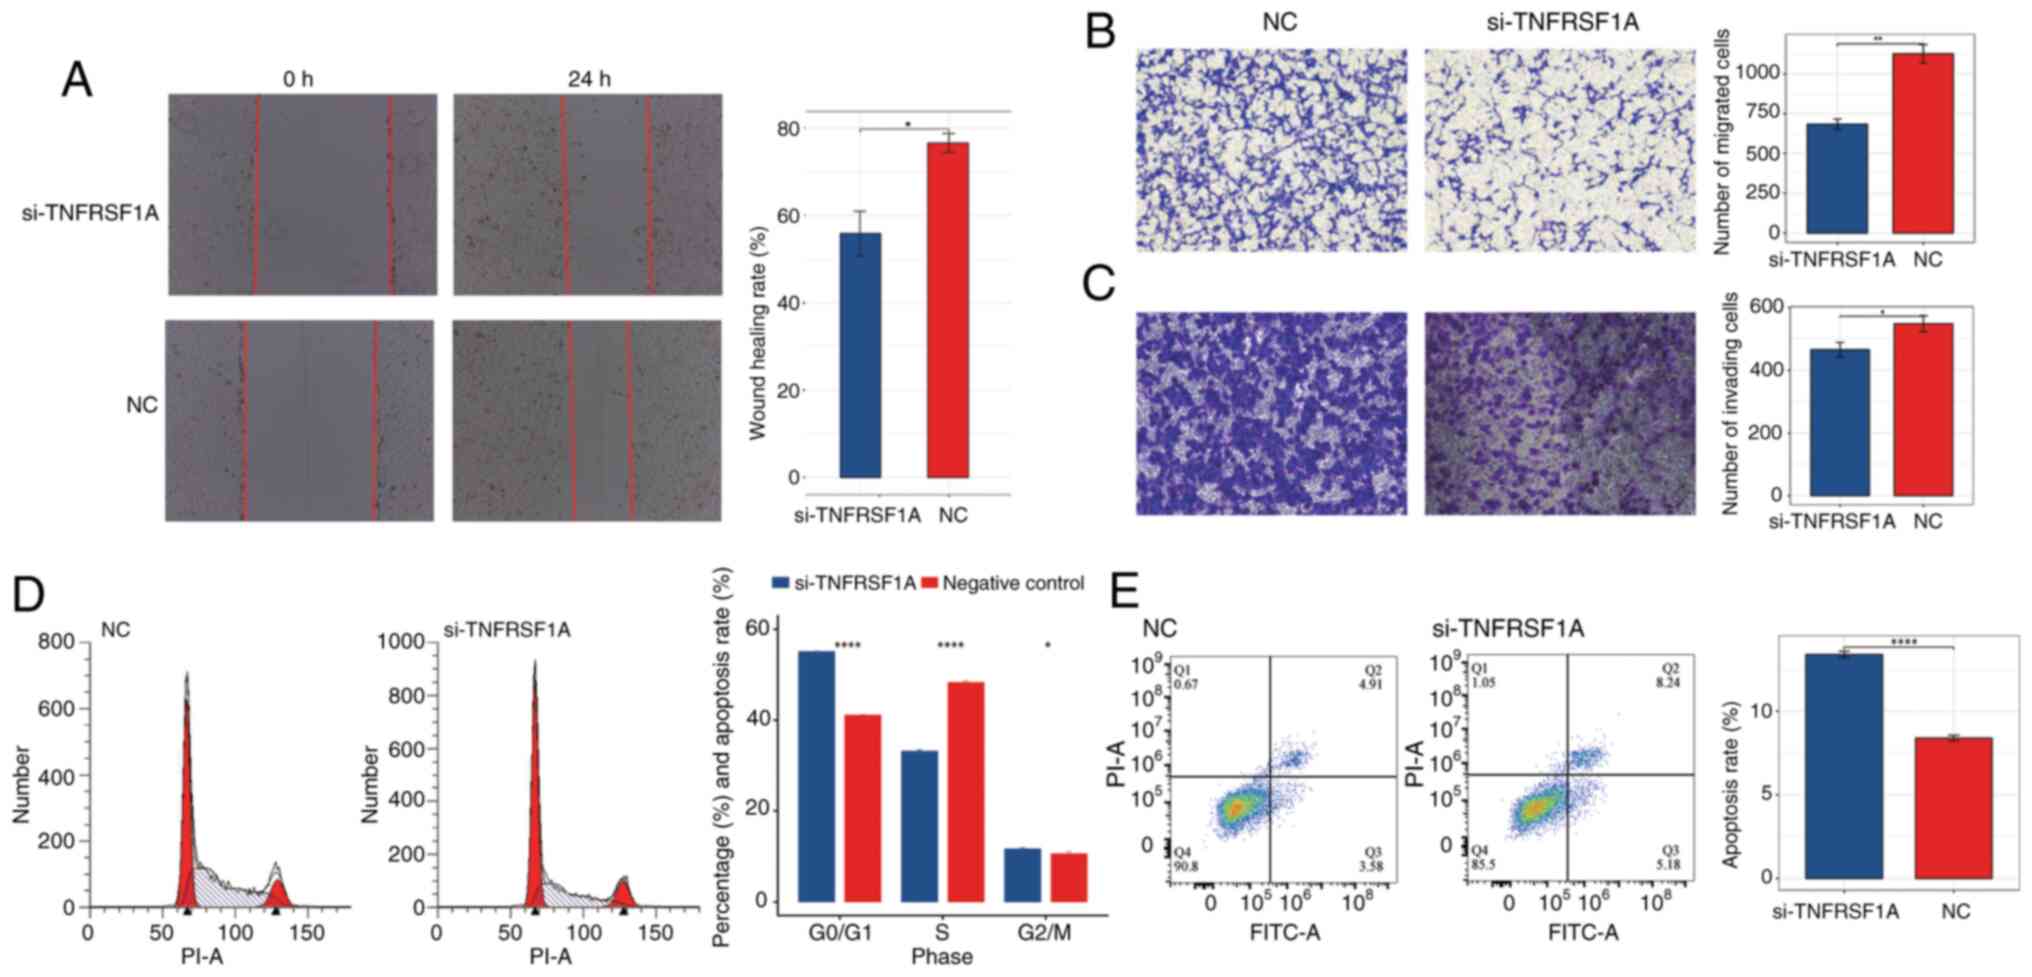
Subsequently, a wound healing assay and Transwell
migration and invasion assays were conducted to further investigate
the effects of TNFRSF1A knockdown, The results demonstrated that
cell migration in the treatment group was significantly lower than
that in the NC group (Fig. 6A and
B). Additionally, in the Transwell invasion assay the knockdown
of TNFRSF1A significantly inhibited invasion compared with that in
the NC group (Fig. 6C). These
results indicate that reducing the expression of the TNFRSF1A gene
negatively regulates the migration and invasion capabilities of
ccRCC cells.
In addition, to further characterize the role of
TNFRSF1A in renal cancer cells, flow cytometry assays were
conducted to assess the cell cycle and apoptosis status of the
si-TNFRSF1A and NC groups (Fig. 6D and
E) The results of the cell cycle assay revealed that following
TNFRSF1A knockdown the number of ccRCC cells entering the S phase
from the G0/G1 phase significantly decreased.
This suggests that elevated TNFRSF1A expression leads to an
increased number of renal cancer cells entering the S phase with
active DNA synthesis. Correspondingly, the results of the apoptosis
assay showed that the apoptosis rate in the TNFRSF1A knockdown was
significantly higher compared with that in the NC group, indicating
that high TNFRSF1A expression suppresses apoptosis in ccRCC cells.
Also, analysis of the variation of TNFSF1A expression with
different clinical factors using one-way ANOVA showed that TNFRSF1A
mRNA expression significantly differs according to the grade and
distant metastasis of ccRCC (Table
SI). Furthermore, post hoc analysis revealed a significant
difference between G2 and G4 stage patients. In addition, uni- and
multi-variate logistic regression analyses revealed that TNFRSF1A
serves as an independent risk factor in the assessment of survival
prognosis (Tables SII and SIII).
Discussion
The comprehensive analysis of the single-cell
landscapes and phenotypes of RCC in the present study provides
valuable insights into the cellular composition, heterogeneity and
potential interactions within the tumor microenvironment. The
findings shed light on the specific characteristics of ccRCC and
its associated epithelial cell populations, as well as the role of
TNF signaling in RCC progression.
In the analysis of ccRCC, seven distinct cell types
were identified through PCA and dimensionality reduction. These
clusters represent different cell types within the tumor, including
epithelial cells, T cells, monocytes/macrophages, endothelial
cells, fibroblasts, myeloid dendritic cells and mast cells. ccRCC
itself is highly heterogeneous, and differences in the tumor
microenvironment among different patients, as well as in the extent
of tumor tissue resection between patient samples, can lead to
differences in cell composition (36,37).
The present study revealed that one sample was predominantly
composed of epithelial cells, while another was predominantly
composed of T cells. The predominance of T cells and epithelial
cells in ccRCC suggests their potential importance in tumor
development and progression. In studies on the anti-PD-1
immunotherapy of multiple patients with ccRCC, it has been
consistently verified that T-cell immune infiltration is
significantly associated with tumor sensitivity, PD-1 blockade
response and resistance (38,39).
The relatively lower abundance of other cell types indicates that
their contributions to the tumor microenvironment are comparatively
minor. In the present study, further characterization of the
epithelial cell population in ccRCC revealed significant
heterogeneity; six putative subtypes were identified. CNV analysis
distinguished clusters representing normal epithelial cells from
those representing tumor epithelial cells. Functional enrichment
analysis demonstrated distinct functional profiles for normal
epithelial cells and cancerous subtypes, highlighting the
heterogeneity within the tumor epithelial cell population. Notably,
the Ep-C4-TNF cell population exhibited enrichment in the TNF
signaling pathway and associated pathways, indicating its potential
involvement in tumor immune resistance, cancer cell motility and
tumor angiogenesis. The TNF family comprises extremely versatile
cytokines that play pivotal roles in the maintenance of immune
homeostasis, triggering inflammation and supporting the host
defense (40). Depending on the
cellular context, these cytokines are able to elicit a wide range
of effects, including apoptosis, necrosis, angiogenesis, activation
of immune cells, differentiation and cell migration (41,42).
The association between TNF signaling and ccRCC was
extensively explored in the present study. Analysis of two key
genes in the TNF pathway, namely TNFRSF1A and TNFRSF1B, revealed
their significant correlations with genes associated with the cell
cytoskeleton, cell motility and tumor angiogenesis. The expression
levels of TNFRSF1A and TNFRSF1B were also found to be higher in
tumor tissues compared with those in normal tissues. Moreover,
communication network analysis demonstrated the important role of
TNF signaling in intercellular communication within the tumor
microenvironment, with monocytes/macrophages acting as primary
signal senders. The interaction between TNF and its receptors,
particularly TNFRSF1A and TNFRSF1B, was indicated to influence
various cellular processes, including cancer cell proliferation,
survival, metastasis and immune responses. These findings have
important implications in understanding the complex
microenvironment of ccRCC and the potential therapeutic
implications. In other types of tumors, the interaction between
monocyte-derived TNF-α and tumor cell TNFRSF1B has been shown to
trigger the occurrence of tumorigenic inflammation (43). This signaling pathway also serves as
a crucial regulatory factor in the immune-suppressive function of
endothelial progenitor cells (44).
Therefore, targeting TNF-associated epithelial cell populations and
the TNF signaling pathway may provide new opportunities for
antitumor immune therapy. The heterogeneity observed within the
epithelial cell population also highlights the requirement for a
personalized approach in cancer treatment. Additionally, the
characterization of the immune cell composition and communication
networks provides valuable insights into the immune response and
potential immunotherapeutic targets in RCC.
Although the TNF signaling pathway has garnered
extensive research attention in the field of cancer, further
exploration of its role in ccRCC is imperative. The various members
of the TNF family exhibit heterogeneity in their functions
(45,46). In the present study, during the
identification process of distinct subpopulations within the
epithelial cell cluster, a subset of cancer cells enriched with
functions relevant to TNF-associated signaling pathways was
discovered. Furthermore, while the intensity and specificity of
TNF-TNFRSF1B interactions in the RCC communication network were
found to be higher than those in normal tissues, it is noteworthy
that the interactions of TNF-TNFRSF1A exhibited greater
specificity, particularly in the communication between
monocyte/macrophage cells and epithelial cells in RCC. The key
proteins associated with positively correlated receptor genes and
the potential mechanisms of carcinogenesis were also explored.
TNFRSF1A and TNFRSF1B are the most
well-characterized members of the TNFR superfamily (47). TNFRSF1B is preferentially expressed
in leukocytes, while TNFRSF1A is reported to be expressed in most
cell types (48,49). Nevertheless, the present study
indicated that the interactions of TNF-TNFRSF1A exhibited greater
specificity than those of TNF-TNFRSF1B within renal cancer tissues.
Thus, cell biology experiments were performed to further validate
the oncogenic role of the receptor gene TNFRSF1A. The knockdown of
TNFRSF1A expression reduced RCC cell proliferation, indicating that
the upregulated expression of TNFRSF1A promotes the proliferation
of RCC. Similarly, the results of in vitro experiments
indicated that TNFRSF1A promotes RCC cell migration and invasion.
Moreover, the knockdown of TNFRSF1A was shown to promote apoptosis
and reduce cell cycle progression, indicating that this receptor
gene inhibits apoptosis when highly expressed, and significantly
facilitates the entry of cancer cells to the S-phase for DNA
replication. These experimental findings collectively demonstrate
the specific functions of TNFRSF1A as a driver of tumor progression
in RCC cells. These results provide valuable insights for the
selection of suitable targeted treatment strategies in clinical
practice and lay the foundation for the exploration of other
potential therapeutic targets.
However, the study has certain limitations. For
example, in the analysis of clinical samples, the collection and
measurement of TNFRSF1A expression in primary kidney cancer tissue
samples from patients were not performed. Instead, data from TCGA
database was used to analyze the expression of TNFRSF1A and its
clinical associations in ccRCC. Although TCGA data is extensive,
the uniformity in sample processing and analysis methods might
introduce biases. The direct measurement of TNFRSF1A expression in
patient samples would more accurately reflect individual
differences and provide a deeper understanding of the specific
biological role of TNFRSF1A in kidney cancer. In addition, the
effectiveness of TNFRSF1A as a potential therapeutic target was not
validated. The following experimental strategies are suggested to
investigate the targeting of TNFRSF1A in ccRCC: Firstly, identify
TNFRSF1A-specific inhibitors and optimize their structures.
Secondly, conduct validation experiments in vitro to
evaluate the impact of the inhibitors on tumor growth, cell
apoptosis and other biomarkers. Lastly, perform in vivo
experiments using animals to assess the safety and potential side
effects of the TNFRSF1A inhibitors. This may address the
limitations of the present study.
In summary, a comprehensive analysis of the
single-cell landscape and phenotypes of RCC was conducted in the
present study, which highlighted the heterogeneity within the tumor
microenvironment and the potential role of the TNF signaling
pathway in RCC progression. The specificity and pro-cancer effects
of TNFRSF1A in renal cancer were further validated through in
vitro experiments. These findings contribute to an improved
understanding of RCC biology, and may guide future research and
therapeutic strategies.
Supplementary Material
Supporting Data
Supporting Data
Acknowledgements
Not applicable.
Funding
The study was supported by a grant from the Project of NINGBO
Leading Medical & Health Discipline (project no. 2022-X11).
Availability of data and materials
The data generated in the present study may be found
in the TCGA database at the following URL: https://portal.gdc.cancer.gov, and in the Gene
Expression Omnibus database under accession number GSE152938 or at
the following URL: https://www.ncbi.nlm.nih.gov/geo/query/acc.cgi?acc=GSE152938.
The other data generated in the present study may be requested from
the corresponding author.
Authors' contributions
LY and ZD conceived the study. LY and JZ performed
the bioinformatics analyziz. LY, ZD and PX performed the
experiments, and ZD and JZ provided scientific advice. XX and JZ
performed data analysis of the cell experiments. LY wrote the
manuscript and XX revised the manuscript. LY and JZ confirm the
authenticity of all the raw data. All authors read and approved the
final version of the manuscript.
Ethics approval and consent to
participate
Not applicable.
Patient consent for publication
Not applicable.
Competing interests
The authors declare that they have no competing
interests.
References
|
1
|
Capitanio U, Bensalah K, Bex A, Boorjian
SA, Bray F, Coleman J, Gore JL, Sun M, Wood C and Russo P:
Epidemiology of renal cell carcinoma. Eur Urol. 75:74–84. 2019.
View Article : Google Scholar : PubMed/NCBI
|
|
2
|
Cirillo L, Innocenti S and Becherucci F:
Global epidemiology of kidney cancer. Nephrol Dial Transplant.
39:920–928. 2024. View Article : Google Scholar : PubMed/NCBI
|
|
3
|
Choueiri TK: Renal cell carcinoma. Hematol
Oncol Clin North Am. 25:xiii–xiv. 2011. View Article : Google Scholar : PubMed/NCBI
|
|
4
|
Diaz-Montero CM, Rini BI and Finke JH: The
immunology of renal cell carcinoma. Nat Rev Nephrol. 16:721–735.
2020. View Article : Google Scholar : PubMed/NCBI
|
|
5
|
Chowdhury N and Drake CG: Kidney cancer:
An overview of current therapeutic approaches. Urol Clin North Am.
47:419–431. 2020. View Article : Google Scholar : PubMed/NCBI
|
|
6
|
Bahadoram S, Davoodi M, Hassanzadeh S,
Bahadoram M, Barahman M and Mafakher L: Renal cell carcinoma: An
overview of the epidemiology, diagnosis, and treatment. G Ital
Nefrol. 39:2022–vol3. 2022.PubMed/NCBI
|
|
7
|
Gray RE and Harris GT: Renal cell
carcinoma: Diagnosis and management. Am Fam Physician. 99:179–184.
2019.PubMed/NCBI
|
|
8
|
Hancock SB and Georgiades CS: Kidney
cancer. Cancer J. 22:387–392. 2016. View Article : Google Scholar : PubMed/NCBI
|
|
9
|
Li F, Aljahdali IAM, Zhang R, Nastiuk KL,
Krolewski JJ and Ling X: Kidney cancer biomarkers and targets for
therapeutics: Survivin (BIRC5), XIAP, MCL-1, HIF1alpha, HIF2alpha,
NRF2, MDM2, MDM4, p53, KRAS and AKT in renal cell carcinoma. J Exp
Clin Cancer Res. 40:2542021. View Article : Google Scholar : PubMed/NCBI
|
|
10
|
Sharma R, Kadife E, Myers M, Kannourakis
G, Prithviraj P and Ahmed N: Determinants of resistance to VEGF-TKI
and immune checkpoint inhibitors in metastatic renal cell
carcinoma. J Exp Clin Cancer Res. 40:1862021. View Article : Google Scholar : PubMed/NCBI
|
|
11
|
Tonooka A and Ohashi R: Current trends in
anti-cancer molecular targeted therapies: Renal complications and
their histological features. J Nippon Med Sch. 89:128–138. 2022.
View Article : Google Scholar : PubMed/NCBI
|
|
12
|
Miao D, Margolis CA, Gao W, Voss MH, Li W,
Martini DJ, Norton C, Bossé D, Wankowicz SM, Cullen D, et al:
Genomic correlates of response to immune checkpoint therapies in
clear cell renal cell carcinoma. Science. 359:801–806. 2018.
View Article : Google Scholar : PubMed/NCBI
|
|
13
|
Topalian SL, Taube JM, Anders RA and
Pardoll DM: Mechanism-driven biomarkers to guide immune checkpoint
blockade in cancer therapy. Nat Rev Cancer. 16:275–287. 2016.
View Article : Google Scholar : PubMed/NCBI
|
|
14
|
Fischer R, Kontermann RE and Pfizenmaier
K: Selective targeting of TNF receptors as a novel therapeutic
approach. Front Cell Dev Biol. 8:4012020. View Article : Google Scholar : PubMed/NCBI
|
|
15
|
Liu W, Yan B, Yu H, Ren J, Peng M, Zhu L,
Wang Y, Jin X and Yi L: OTUD1 stabilizes PTEN to inhibit the
PI3K/AKT and TNF-alpha/NF-kappaB signaling pathways and sensitize
ccRCC to TKIs. Int J Biol Sci. 18:1401–1414. 2022. View Article : Google Scholar : PubMed/NCBI
|
|
16
|
Richter F, Williams SK, John K, Huber C,
Vaslin C, Zanker H, Fairless R, Pichi K, Marhenke S, Vogel A, et
al: The TNFR1 antagonist atrosimab is therapeutic in mouse models
of acute and chronic inflammation. Front Immunol. 12:7054852021.
View Article : Google Scholar : PubMed/NCBI
|
|
17
|
Su C, Lv Y, Lu W, Yu Z, Ye Y, Guo B, Liu
D, Yan H, Li T, Zhang Q, et al: Single-Cell RNA sequencing in
multiple pathologic types of renal cell carcinoma revealed novel
potential tumor-specific markers. Front Oncol. 11:7195642021.
View Article : Google Scholar : PubMed/NCBI
|
|
18
|
Liu J, Fan Z, Zhao W and Zhou X: Machine
intelligence in single-cell data analysis: Advances and new
challenges. Front Genet. 12:6555362021. View Article : Google Scholar : PubMed/NCBI
|
|
19
|
Street K, Risso D, Fletcher RB, Das D,
Ngai J, Yosef N, Purdom E and Dudoit S: Slingshot: Cell lineage and
pseudotime inference for single-cell transcriptomics. BMC Genomics.
19:4772018. View Article : Google Scholar : PubMed/NCBI
|
|
20
|
Armingol E, Officer A, Harismendy O and
Lewis NE: Deciphering cell-cell interactions and communication from
gene expression. Nat Rev Genet. 22:71–88. 2021. View Article : Google Scholar : PubMed/NCBI
|
|
21
|
Jin S, Guerrero-Juarez CF, Zhang L, Chang
I, Ramos R, Kuan CH, Myung P, Plikus MV and Nie Q: Inference and
analysis of cell-cell communication using CellChat. Nat Commun.
12:10882021. View Article : Google Scholar : PubMed/NCBI
|
|
22
|
Chandrashekar DS, Karthikeyan SK, Korla
PK, Patel H, Shovon AR, Athar M, Netto GJ, Qin ZS, Kumar S, Manne
U, et al: UALCAN: An update to the integrated cancer data analysis
platform. Neoplasia. 25:18–27. 2022. View Article : Google Scholar : PubMed/NCBI
|
|
23
|
Livak KJ and Schmittgen TD: Analysis of
relative gene expression data using real-time quantitative PCR and
the 2(−Delta Delta C(T)) method. Methods. 25:402–408. 2001.
View Article : Google Scholar : PubMed/NCBI
|
|
24
|
Balkwill F: Tumour necrosis factor and
cancer. Nat Rev Cancer. 9:361–371. 2009. View Article : Google Scholar : PubMed/NCBI
|
|
25
|
Saha P and Smith A: TNF-α (Tumor Necrosis
Factor-α). Arterioscler Thromb Vasc Biol. 38:2542–2543. 2018.
View Article : Google Scholar : PubMed/NCBI
|
|
26
|
Eisenman ST, Gibbons SJ, Verhulst PJ,
Cipriani G, Saur D and Farrugia G: Tumor necrosis factor alpha
derived from classically activated ‘M1’ macrophages reduces
interstitial cell of Cajal numbers. Neurogastroenterol Motil.
29:10.1111. 2017. View Article : Google Scholar : PubMed/NCBI
|
|
27
|
Shapouri-Moghaddam A, Mohammadian S,
Vazini H, Taghadosi M, Esmaeili SA, Mardani F, Seifi B, Mohammadi
A, Afshari JT and Sahebkar A: Macrophage plasticity, polarization,
and function in health and disease. J Cell Physiol. 233:6425–6440.
2018. View Article : Google Scholar : PubMed/NCBI
|
|
28
|
Garancher A, Suzuki H, Haricharan S, Chau
LQ, Masihi MB, Rusert JM, Norris PS, Carrette F, Romero MM,
Morrissy SA, et al: Tumor necrosis factor overcomes immune evasion
in p53-mutant medulloblastoma. Nat Neurosci. 23:842–853. 2020.
View Article : Google Scholar : PubMed/NCBI
|
|
29
|
Masola V, Greco N, Tozzo P, Caenazzo L and
Onisto M: The role of SPATA2 in TNF signaling, cancer, and
spermatogenesis. Cell Death Dis. 13:9772022. View Article : Google Scholar : PubMed/NCBI
|
|
30
|
Yu H, Lin L, Zhang Z, Zhang H and Hu H:
Targeting NF-κB pathway for the therapy of diseases: Mechanism and
clinical study. Signal Transduct Target Ther. 5:2092020. View Article : Google Scholar : PubMed/NCBI
|
|
31
|
Balkwill F: TNF-alpha in promotion and
progression of cancer. Cancer Metastasis Rev. 25:409–416. 2006.
View Article : Google Scholar : PubMed/NCBI
|
|
32
|
Tacke F and Zimmermann HW: Macrophage
heterogeneity in liver injury and fibrosis. J Hepatol.
60:1090–1096. 2014. View Article : Google Scholar : PubMed/NCBI
|
|
33
|
Takahashi H, Yoshimatsu G and Faustman DL:
The roles of TNFR2 signaling in cancer cells and the tumor
microenvironment and the potency of TNFR2 targeted therapy. Cells.
11:19522022. View Article : Google Scholar : PubMed/NCBI
|
|
34
|
Speeckaert MM, Speeckaert R, Laute M,
Vanholder R and Delanghe JR: Tumor necrosis factor receptors:
Biology and therapeutic potential in kidney diseases. Am J Nephrol.
36:261–270. 2012. View Article : Google Scholar : PubMed/NCBI
|
|
35
|
Hwang HS, Park YY, Shin SJ, Go H, Park JM,
Yoon SY, Lee JL and Cho YM: Involvement of the TNF-α pathway in TKI
resistance and suggestion of TNFR1 as a predictive biomarker for
TKI responsiveness in clear cell renal cell carcinoma. J Korean Med
Sci. 35:e312020. View Article : Google Scholar : PubMed/NCBI
|
|
36
|
Dong B, Miao J, Wang Y, Luo W, Ji Z, Lai
H, Zhang M, Cheng X, Wang J, Fang Y, et al: Single-cell analysis
supports a luminal-neuroendocrine transdifferentiation in human
prostate cancer. Commun Biol. 3:7782020. View Article : Google Scholar : PubMed/NCBI
|
|
37
|
Couturier CP, Ayyadhury S, Le PU, Nadaf J,
Monlong J, Riva G, Allache R, Baig S, Yan X, Bourgey M, et al:
Single-cell RNA-seq reveals that glioblastoma recapitulates a
normal neurodevelopmental hierarchy. Nat Commun. 11:34062020.
View Article : Google Scholar : PubMed/NCBI
|
|
38
|
Braun DA, Hou Y, Bakouny Z, Ficial M,
Angelo MS, Forman J, Ross-Macdonald P, Berger AC, Jegede OA,
Elagina L, et al: Interplay of somatic alterations and immune
infiltration modulates response to PD-1 blockade in advanced clear
cell renal cell carcinoma. Nat Med. 26:909–918. 2020. View Article : Google Scholar : PubMed/NCBI
|
|
39
|
Au L, Hatipoglu E, de Massy M, Litchfield
K, Beattie G, Rowan A, Schnidrig D, Thompson R, Byrne F, Horswell
S, et al: Determinants of anti-PD-1 response and resistance in
clear cell renal cell carcinoma. Cancer Cell. 39:1497–1518.
e14112021. View Article : Google Scholar : PubMed/NCBI
|
|
40
|
Wajant H: The role of TNF in cancer.
Results Probl Cell Differ. 49:1–15. 2009. View Article : Google Scholar : PubMed/NCBI
|
|
41
|
Gao M, Li X, Yang M, Feng W, Lin Y and He
T: TNFAIP3 mediates FGFR1 activation-induced breast cancer
angiogenesis by promoting VEGFA expression and secretion. Clin
Transl Oncol. 24:2453–2465. 2022. View Article : Google Scholar : PubMed/NCBI
|
|
42
|
Messeha SS, Zarmouh NO, Antonie L and
Soliman KFA: Sanguinarine inhibition of TNF-α-induced CCL2,
IKBKE/NF-κB/ERK1/2 signaling pathway, and cell migration in human
triple-negative breast cancer cells. Int J Mol Sci. 23:83292022.
View Article : Google Scholar : PubMed/NCBI
|
|
43
|
Tomolonis JA, Xu X, Dholakia KH, Zhang C,
Guo L, Courtney AN, Wang S, Balzeau J, Barragán GA, Tian G, et al:
Interaction between tumor cell TNFR2 and monocyte membrane-bound
TNF-α triggers tumorigenic inflammation in neuroblastoma. J
Immunother Cancer. 11:e0054782023. View Article : Google Scholar : PubMed/NCBI
|
|
44
|
Naserian S, Abdelgawad ME, Bakshloo MA, Ha
G, Arouche N, Cohen JL, Salomon BL and Uzan G: The TNF/TNFR2
signaling pathway is a key regulatory factor in endothelial
progenitor cell immunosuppressive effect. Cell Commun Signal.
18:942020. View Article : Google Scholar : PubMed/NCBI
|
|
45
|
Siegmund D, Wagner J and Wajant H: TNF
receptor associated factor 2 (TRAF2) signaling in cancer. Cancers
(Basel). 14:40552022. View Article : Google Scholar : PubMed/NCBI
|
|
46
|
Hira K and Begum AS: Methods for
evaluation of TNF-α inhibition effect. Methods Mol Biol.
2248:271–279. 2021. View Article : Google Scholar : PubMed/NCBI
|
|
47
|
Xing-Rong W, Sheng-Qian X, Wen L, Shan Q,
Fa-Ming P and Jian-Hua X: Role of TNFRSF1A and TNFRSF1B
polymorphisms in susceptibility, severity, and therapeutic efficacy
of etanercept in human leukocyte antigen-B27-positive Chinese Han
patients with ankylosing spondylitis. Medicine (Baltimore).
97:e116772018. View Article : Google Scholar : PubMed/NCBI
|
|
48
|
Shi G and Hu Y: TNFR1 and TNFR2, which
link NF-κB activation, drive lung cancer progression, cell
dedifferentiation, and metastasis. Cancers (Basel). 15:42992023.
View Article : Google Scholar : PubMed/NCBI
|
|
49
|
Miller PG, Bonn MB and McKarns SC:
Transmembrane TNF-TNFR2 impairs Th17 differentiation by promoting
Il2 expression. J Immunol. 195:2633–2647. 2015. View Article : Google Scholar : PubMed/NCBI
|