Introduction
HCC is the most common form of liver cancer and the
fourth leading cause of mortality worldwide (1,2). It
predominates as the most common form of liver cancer, representing
approximately 90% of all cases (3).
Infection with Hepatitis B virus (HBV) or Hepatitis C virus (HCV)
is a major risk factor for HCC development (4). Metabolic-associated steatohepatitis
(MASH) and metabolic-associated fatty liver disease (MAFLD)
associated with metabolic syndrome have emerged as contributing
factors for HCC (5–7). Surgical treatments result in high
patient survival rates. However, this approach has only been
applied to patients with early stage HCC (8,9).
Recently, atezolizumab plus bevacizumab has emerged as the therapy
for unresectable HCC (10),
sorafenib remains a treatment option for these patients.
Sorafenib, a multi-targeted tyrosine kinase
inhibitor, has been approved as a therapeutic agent for
advanced-stage HCC (11). Sorafenib
inhibits tumor cell proliferation by suppressing the activity of
BRAF, RAF1, and kinases in the MEK/ERK signaling pathways (12). In addition, the anti-angiogenesis
effect of sorafenib is mediated by platelet-derived growth factor
receptor (PDGFR-β), vascular endothelial growth factor receptors
(VEGFR-1 and VEGFR-2), and c-KIT (13). Despite sorafenib treatment, drug
resistance persists in some patients with advanced HCC (14). Only 30% of the patients with HCC
benefit from sorafenib, and acquired resistance commonly occurs
within 6 months (15). Therefore,
the mechanisms underlying sorafenib resistance must be
elucidated.
Type I interferons (IFNs) are cytokines with
antiviral, anti-proliferative, and immunomodulatory effects that
play crucial roles in suppressing viral infections (16). Type I IFNs bind to IFN receptors,
leading to the phosphorylation of JAK1 and TYK2 (17). Subsequently, STAT1 and STAT2 are
phosphorylated to form a complex with IRF9 (18). The ISGF3 (phosphorylated STAT1,
phosphorylated STAT2 and IRF9) complex translocates into the
nucleus and upregulates the expression of genes such as
interferon-stimulated genes (ISGs) with antiviral functions
(19). However, low concentrations
of interferon lead to the dephosphorylation of STAT1 and STAT2. At
this stage, unphosphorylated STAT1 and STAT2 bind to high levels of
IRF9 to form the U-ISGF3 complex (17,20).
The U-ISGF3 complex translocates to the nucleus and regulates the
expression of genes such as U-ISGs, OAS1, MDA5, and
BST2 (21,22). U-ISGs are associated with resistance
to chemotherapy and irradiation, which are correlated with
resistance to DNA damage (23).
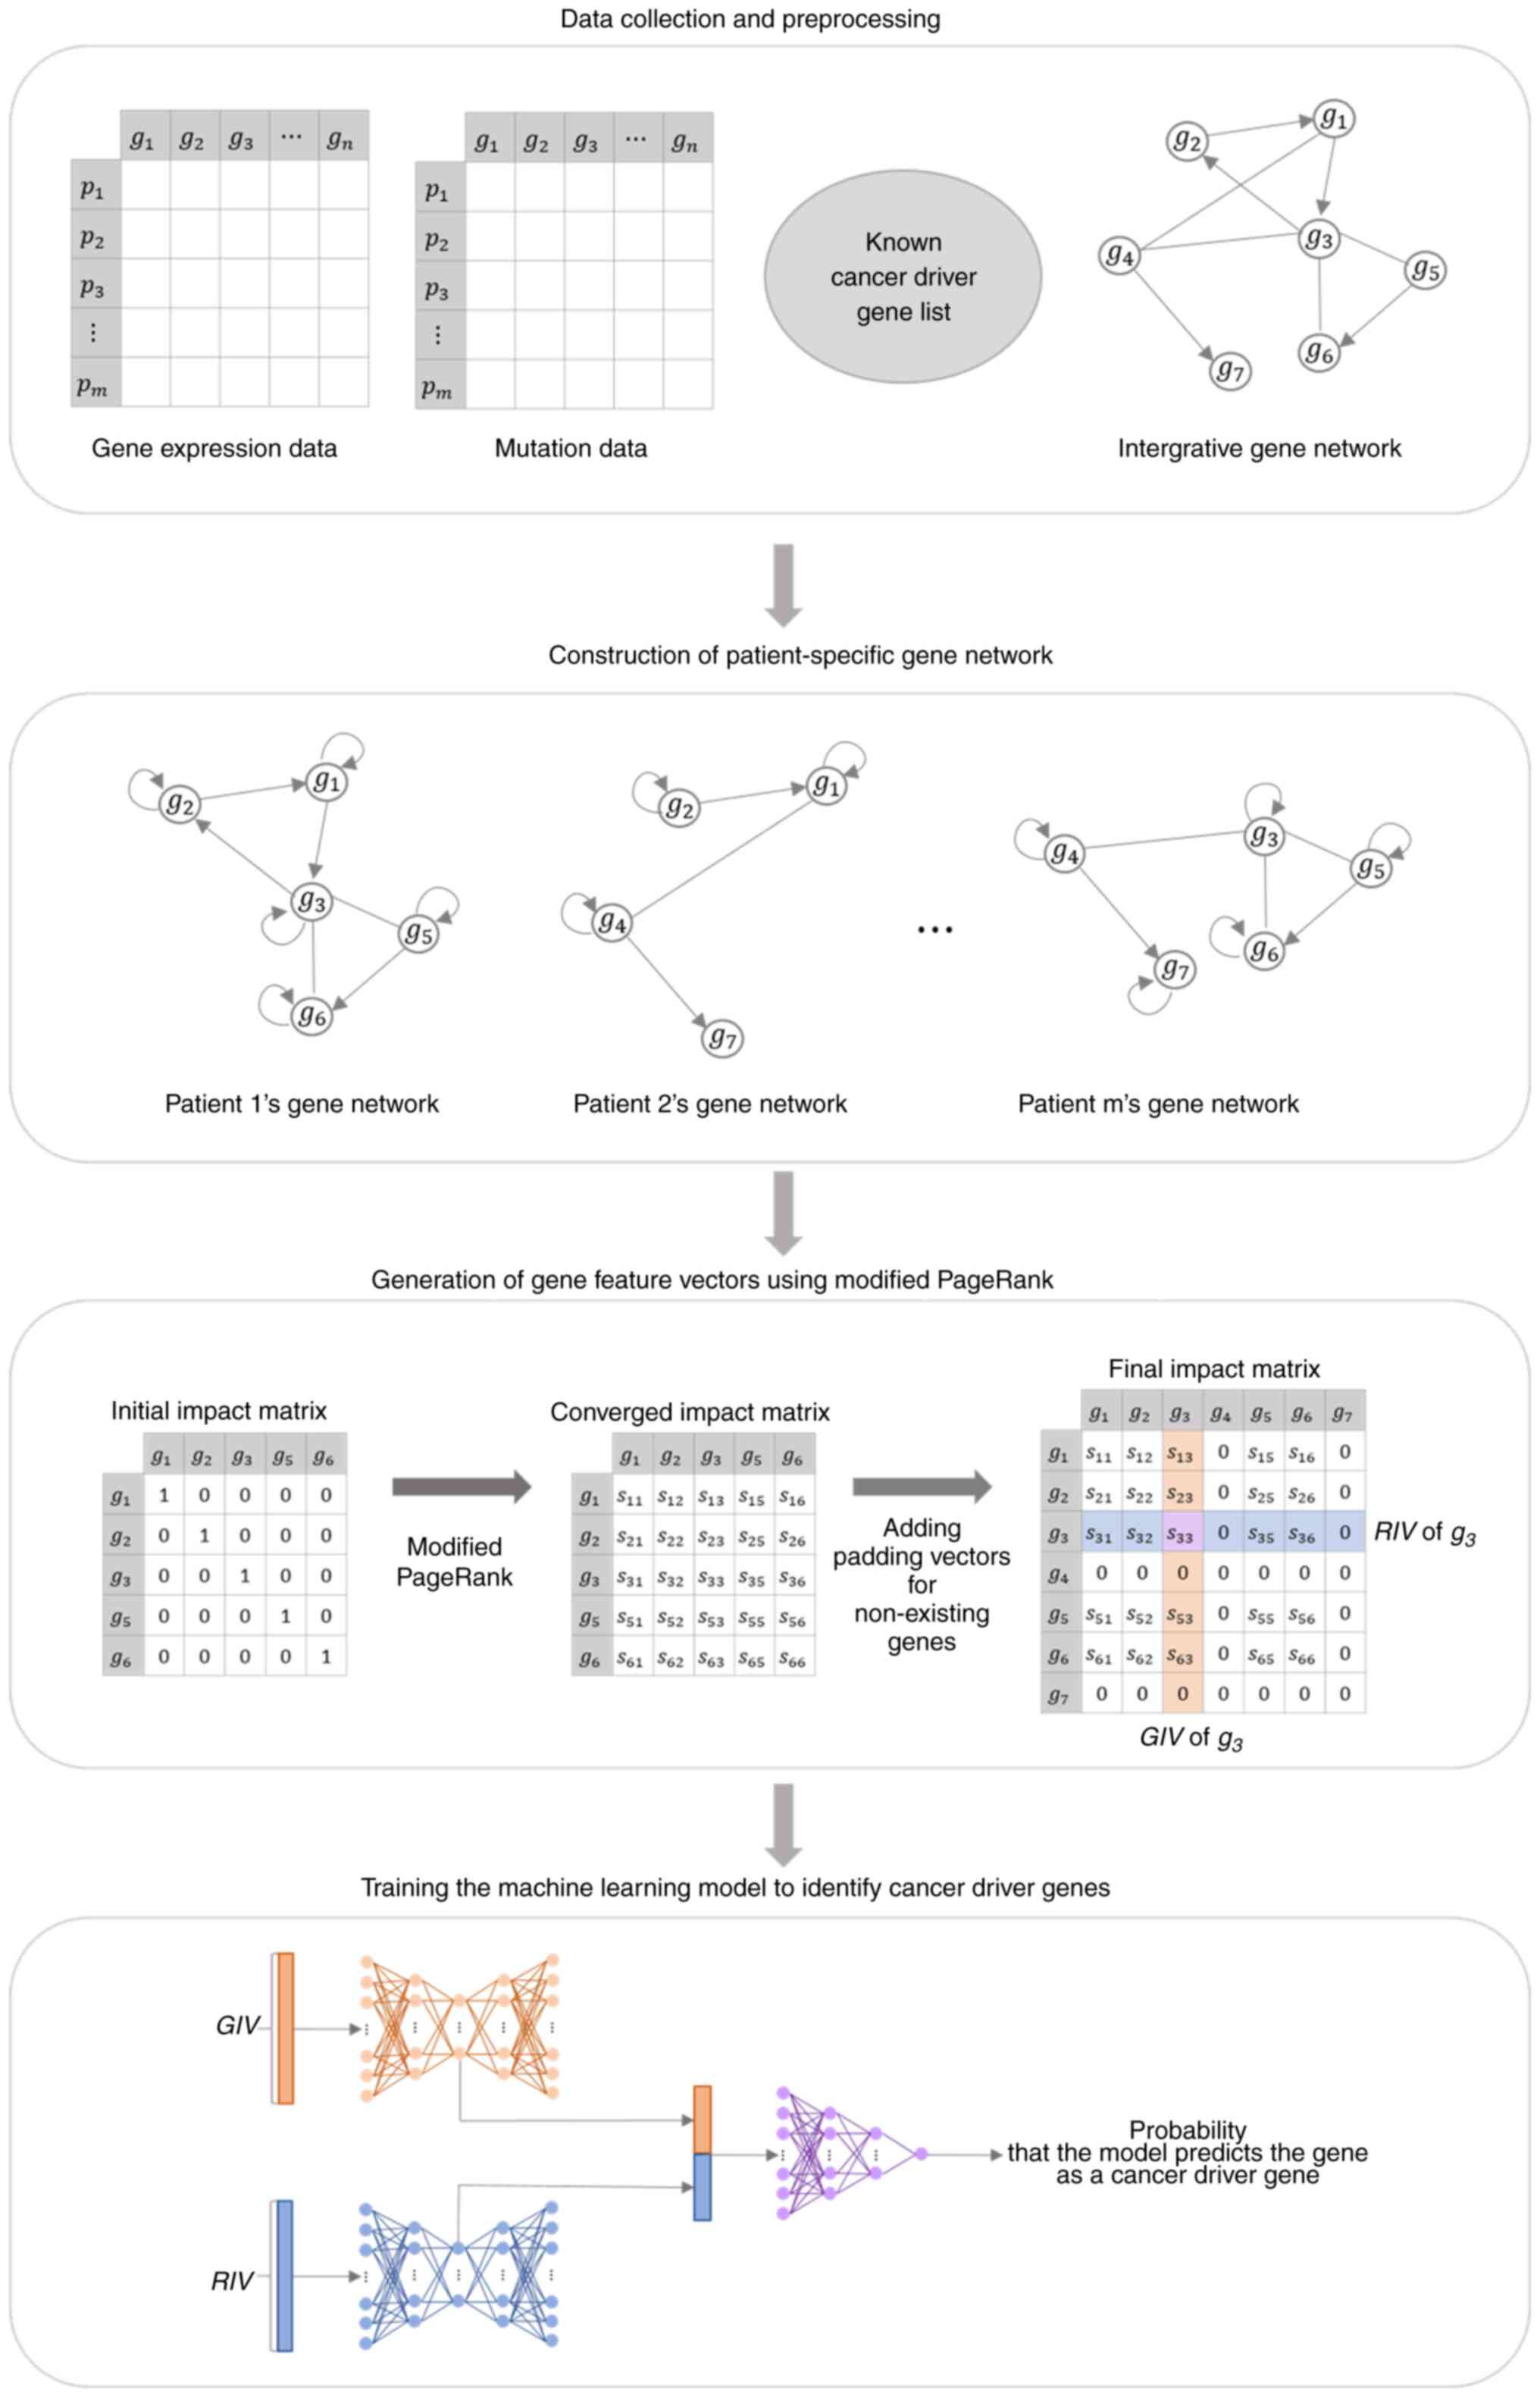
Machine learning has become a powerful tool for the
identification of diagnostic genes. We organized the data for input
into the machine learning model by generating a vector of gene
features that represented the influence of genes on other genes and
the influence they received (24).
The gene feature vector was extracted from the impact matrix
generated by applying a modified PageRank algorithm to a
patient-specific gene network constructed using the integrated gene
network, gene variants, and gene expression data. A machine
learning model was constructed by combining two autoencoders and a
deep neural network. The model was trained using gene feature
vectors generated from data obtained from patients with liver
cancer in The Cancer Genome Atlas (TCGA) (25). These gene feature vectors are
labeled based on the presence of genetic mutations and a list of
known cancer driver genes. We utilized this trained machine
learning model to input gene feature vectors generated from Huh-7
cells to investigate genes associated with sorafenib resistance.
The model learns the patterns of influence that known cancer driver
genes have on other genes; the more the input gene feature vector
has feature patterns similar to the cancer driver genes, the closer
the output value will be to 1. Among the genes with high model
outputs in samples with sorafenib resistance, particularly those
with low model outputs in samples without sorafenib resistance, we
selected candidate genes involved in the mechanism of sorafenib
resistance and identified the role of STAT1 in this process.
In the current study, machine learning revealed that
U-ISGs were highly expressed in sorafenib-resistant liver cancer
cells. We further found that the U-ISGF3 complex upregulated U-ISGs
in sorafenib-resistant liver cancer cells. Our findings suggest
that U-ISGs play a significant role in sorafenib resistance in
liver cancer cells, and U-ISGF3 induces sorafenib resistance in
liver cancer cells.
Materials and methods
RNA-sequencing analysis
RNA-sequencing analysis was performed using Human
liver cancer cell lines (Huh-7, sorafenib resistant Huh-7, HepG2
and sorafenib resistant HepG2). The generated RNA-sequencing
libraries were sequenced using an Illumina sequencing system
(Macrogen). RNA-sequencing analysis was conducted on Huh-7
(SAMN41561228), sorafenib resistant Huh-7 (SAMN41561229) HepG2
(SAMN41561230) and sorafenib resistant HepG2 (SAMN41561231),
obtained from the NCBI Sequenced Read Archive (SRA) database
(https://www.ncbi.nlm.nih.gov/bioproject/PRJNA1117191,
last accessed on May 27, 2024).
Overall process to identify sorafenib
resistance-associated genes
The first step in identifying genes associated with
sorafenib resistance using machine learning involves generating
gene feature vectors from LIHC (Liver Hepatocellular Carcinoma)
tumor patient samples obtained from TCGA, as well as Huh-7 samples
with sorafenib resistance, along with Huh-7 samples with sorafenib
resistance. These gene feature vectors represent the rows and
columns of the impact matrix, calculated by applying a modified
PageRank algorithm to the patient-specific gene network. This
network is constructed using integrated gene network data, the
patient's genetic variants, and gene expression data. Once the gene
feature vector generation is complete, we construct the training
data using the TCGA LIHC samples' gene feature vectors and proceed
to train the model. To identify candidate genes related to
sorafenib resistance, the gene feature vectors from Huh-7 samples
with and without sorafenib resistance are input into the machine
learning model. By comparing the sorafenib-resistant and
non-sorafenib-resistant sample groups, genes exhibiting
particularly high scores in the sorafenib-resistant group are
considered candidate genes associated with sorafenib resistance. A
visual representation of the overall process is presented in
Figure 1.
Construction of patient-specific gene
networks
The construction of a patient-specific gene network
involves selecting relevant edges from the integrated gene network,
considering the specific characteristics of each patient. The
integrated gene network was created by combining directed edges
from functional interaction networks obtained from Reactome
(26). Additionally, gene
regulation networks were incorporated from the RegNetwork and
TRRUST (27).
For an edge to be included in the patient-specific
gene network, it had to satisfy at least one of two conditions:
(1) at least one gene from a gene
pair connected by an edge exhibited a mutation, and the mutational
status utilized information specific to individual patients;
(2) the expression of two connected
genes aligned with the overall expression pattern observed in the
entire cancer sample. To determine this, the RANSAC algorithm was
executed 10 times to generate 10 regression models. RANSAC uses the
expression values of genes corresponding to the departure node of
an edge as input and estimates the regression model parameters to
predict the expression of genes corresponding to the arrival node.
Regression models with regression coefficients below 0.1 were
excluded from consideration. If at least one regression model
identified a patient as an inlier, that particular edge was
included in the patient's gene network. After acquiring a set of
edges that met one or more of the previously mentioned conditions,
the construction of the patient-specific gene network was
accomplished using Equation (1):
W = (I – Ψ)Α + Ψ
where A is an adjacent matrix of individual
patients, and each component has one value among 0, 1, and 2.
Specifically, if the patient has an edge connecting genes i
and j, the value of Aij becomes 2 if there
is a mutation in gene i, and 1 if there is no mutation. If
there are no edges connecting genes i and j, the
value of Aij becomes zero. I is an identity
matrix, and Ψ is a diagonal matrix meaning the weight of a
self-loop in the gene network for each patient. The self-loop
weight was calculated using a one-sample t-test on the gene
expression data of the patient and control groups. When the
self-loop weight was 0, the gene was incapable of affecting itself;
conversely, when it was set to 1, the gene remained unaffected by
the gene network.
Generation of gene feature vectors
using modified PageRank
The modified PageRank algorithm was applied to the
gene network of individual patients to produce an impact matrix.
The resulting impact matrix rows and columns served as gene feature
vectors, and their calculation involved iterating Equation (2):
IΜτ+1 = W̃ × IMτ
where W̃ is a stochastic matrix, which is a matrix
with a column sum of 1, calculated by dividing the components of
each column of the matrix W by the sum of the corresponding
columns. W can be interpreted as the probability that
patient gene i affects gene j. IM (impact matrix) is
a square matrix of n × n, where n is the
number of genes in the patient-specific gene network. The initial
value matrix IM0 is a diagonal matrix in which the
values of the diagonal components are all 10,000, and the impact
matrix at τ + 1 is calculated as the product of the
stochastic matrix W and the impact matrix at τ. If
Equation (2) is repeated, each
column of IM0 is a one-hot vector whose value exists
only in the component of the corresponding column index; therefore,
the initial value of each column spreads to other components along
the patient-specific gene network. Iteration of Equation (2) ends when the impact matrix
converges.
The components of the converged impact matrix,
denoted as IMij, represent the influence of gene
j on gene i for a given patient. Therefore, the ith
column of IM represents the impact that gene i has on all
genes in the network, denoted as GIV (give impact vector). The ith
row represents the impact that gene i receives from all
genes in the network, denoted as the RIV (received impact vector).
The gene feature vector encompasses both GIV and RIV. Each patient
had a different gene network composition. Therefore, for gene
i, each patient had a different gene feature vector.
Training a cancer driver gene
identification model
We employed a composite model consisting of two
autoencoders and one deep neural network to develop an approach for
identifying cancer driver genes. In the initial phase of the model,
two autoencoders were used to manage GIV and RIV separately. The
encoder compresses and represents high-dimensional gene feature
vectors as low-dimensional latent vectors. Subsequently, the
decoder reconstructs these latent vectors back into their original
input data formats. The latent vectors of the GIV and RIV were
concatenated and fed into the deep neural network, where the model
predicted the probability that the input gene feature vector
represented a cancer driver gene. The parameters used in the
machine learning model are shown in Table I.
 | Table I.Hyper-parameters used for the deep
feed-forward network. |
Table I.
Hyper-parameters used for the deep
feed-forward network.
| Groups | Parameters | Value |
|---|
| Common | Epoch | 100 |
|
| Batch size | 200 |
|
| Optimizer | Stochastic gradient
descent |
|
| Learning rate | 0.005 |
|
| Momentum | 0.9 |
| AutoEncoder | Size of input
layer | Number of
genes |
|
| Number of hidden
layers | 3 |
|
| Size of hidden
layers | 5,000, 1,000,
5,000 |
|
| Activation
function | ReLU |
|
| Loss function | Mean Squared
Error |
| Deep neural
network | Size of input
layer | 2,000 |
|
| Number of hidden
layers | 2 |
|
| Size of hidden
layers | 500, 100 |
|
| Size of output
layer | 1 |
|
| Activation function
of hidden layers | ReLU |
|
| Activation function
of output layers | Sigmoid |
|
| Loss function | Binary Cross
Entropy |
To generate the training data, we gathered 360 tumor
patient samples and 50 normal samples from TCGA using search term
‘LIHC’. During the preprocessing phase, gene expression level data
excluded genes with an FPKM of zero in more than 80% of samples.
Genetic mutation data were constructed by integrating somatic and
gene copy number mutation data. Each gene was assigned a value of 1
if one or more mutations occurred and 0 otherwise.
After generating gene feature vectors for TCGA LIHC
tumor samples, we labeled them using information from known cancer
driver genes and genetic mutation data of the samples. Known cancer
driver genes were sourced from the IntOGen and CGC databases
(28,29). Only Tier 1 genes with substantial
evidence of cancer occurrence in the CGC database were used. The
list of known cancer driver genes comprised 30 genes from IntOGen
and 28 genes from CGC, with eight genes common to both databases.
Gene feature vectors corresponding to known cancer driver genes
with mutations in individual samples were labeled true, whereas the
remaining vectors were labeled false. To construct the training
dataset, a falsely labeled gene feature vector was randomly
selected for each truly labeled gene feature vector.
Cell lines
Human liver cancer cell lines (Huh-7 and HepG2) were
obtained from American Type Culture Collection (Rockville, MD,
USA). Huh-7 and Huh-7/sorafenib resistant (Huh-7-SR) cells were
maintained in Dulbecco's Modified Eagle Medium (DMEM) supplemented
with 10% fetal bovine serum (WelGENE, Daegu, Korea), 4.5 g/l
glucose, L-glutamine, and 100 U/ml penicillin/streptomycin
(Invitrogen, Carlsbad, CA) at 37°C with 5% CO2. HepG2,
HepG2/sorafenib resistant (HepG2-SR) cells were maintained in
minimum essential medium (MEM) with 10% fetal bovine serum and 100
U/ml penicillin/streptomycin. Huh-7 and HepG2 cells were obtained
from American Type Culture Collection (ATCC). In order to establish
sorafenib resistant cell lines, Huh-7, HepG2 cells were exposed to
1 µM sorafenib at first, and the concentration was gradually
increased by 1 µM per month until reaching 6 µM.
RNA extraction, cDNA synthesis, and
RT-qPCR
Total RNA was isolated using the TRIzol reagent
(Invitrogen). cDNA was amplified using GoScriptTM Reverse
Transcriptase (Promega). RT-qPCR was performed using specific
primer sequences and SYBR based was conducted with a Light Cycler
480 (Roche Applied Science) in a total volume of 20 µl. The
relative expression was analyzed using the 2-ΔΔCq method. The
primer sequences for the gene were provided in Table II.
| Table II.Primers sequence used in SYBR-based
reverse transcription-quantitative PCR. |
Table II.
Primers sequence used in SYBR-based
reverse transcription-quantitative PCR.
| Primer | Forward sequence
(5′-3′) | Reverse sequence
(5′-3′) |
|---|
| Mx1 |
GGCTGTTTACCAGACTCCGACA |
CACAAAGCCTGGCAGCTCTCTA |
| ADAR |
TCCGTCTCCTGTCCAAAGG |
TTCTTGCTGGGAGCACTCACAC |
| MyD88 |
GAGGCTGAGAAGCCTTTACAGG |
GCAGATGAAGGCATCGAAACGC |
| PKR |
GAAGTGGACCTCTACGCTTTGG |
TGATGCCATCCCGTAGGTCTGT |
| IRF1 |
GAGGTGAAAGACCAGAGCA |
TAGCATCTCGGCTGGACTTCGA |
| ACTB |
CACCATTGGCAATGAGCGGTTC |
AGGTCTTTGCGGATGTCCACGT |
| STAT1 |
ATGGCAGTCTGGCGGCTGAATT |
CCAAACCAGGCTGGCACAATTG |
| STAT2 |
CAGGTCACAGAGTTGCTACAGC |
CGGTGAACTTGCCAGTCTT |
| OAS1 |
AGGAAAGGTGCTTCCGAGGTAG |
GGACTGAGGAAGACAACCAGGT |
| OAS2 |
GCTTCCGACAATCAACAGCCAAG |
CTTGACGATTTTGTGCCGCTCG |
| MAP3K |
TGGCAAGCACTACCTGGATCAG |
GCAGAGACTGTAGGTAGTTTCGG |
| BST2 |
TCTCCTGCAACAAGAGCTGACC |
TCTCTGCATCCAGGGAAGCCAT |
| IFI27 |
CGTCCTCCATAGCAGCCAAGAT |
ACCCAATGGAGCCCAGGATGAA |
| MDA5 |
CCCAAGACACAGAATGAACAAAA |
CGAGACCATAACGGATAACAATGT |
Immunoblotting
Huh-7 cells, Huh-7-SR cells, HepG2, and HepG2-SR
cells were collected and lysed with RIPA buffer (20 mM Tris-HCl,
150 mM NaCl, 1% sodium deoxycholate, 1% Triton-X-100 and 0.1% SDS)
containing protease inhibitors and phosphate inhibitors. SDS-PAGE
(8%) was performed to separate the protein extracts. The proteins
were transferred onto nitrocellulose membranes. After blocking the
membrane in TBS containing 5% skim milk for 1 h. The antibodies
used for immunoblotting were as follows: rabbit monoclonal
anti-STAT1 (Cell signaling Technology, Cat#9176S), rabbit
monoclonal anti-PY STAT1 (Cell signaling Technology, Cat#9167S),
rabbit polyclonal anti-STAT2 (Cell signaling Technology,
Cat#4594S), rabbit polyclonal anti-PY STAT2 (Cell signaling
Technology, Cat#4441S), rabbit monoclonal IRF9 (Cell signaling
Technology, Cat#28492), and horseradish peroxidase-conjugated
secondary antibody (1:5,000).
siRNA transfection
Huh-7-SR cells were seeded at 2.5×10⁵
cells per wells into a 6-well plate in DMEM. The following day,
Huh-7-SR cells were transfected with siControl (Santa Cruz,
Cat#sc-37007), siSTAT1 (Santa Cruz, Cat#sc-44123), siSTAT2 (Santa
Cruz, Cat#sc-29492), or siIRF9 (OriGene, Cat#SR323091) at a
concentration of 10 nM in 2 ml of serum-free medium containing
RNAiMAX (Invitrogen, Cat#13778075). The medium was changed 4 h
after transfection, and the cells were harvested after 48 h. Next,
the transfected cells were treated with sorafenib for 24 h,
followed by MTT assay.
Cell viability assay
For cell viability assays, liver cancer cells
(Huh-7, Huh-7-SR, HepG2, HepG2-SR) were seeded into 96 well plates
at 1×10⁴ cells per well and incubated with sorafenib at
a concentration of 0 to 32 µM for 24 h. After the addition of 10 µl
of MTT solution (Abcam, Cat#ab211091), the samples were incubated
for 4 h. Subsequently, the medium was removed, and 100 µl of DMSO
was added to each well. The optical density was recorded at 590 nm
using an enzyme-linked immunosorbent assay reader (MDS Analytical
Technologies).
Statistical analysis
Statistical analyses were performed using GraphPad
Prism 8 software (GraphPad Software Inc., San Diego, CA, USA).
Human liver cancer cells are presented as the mean ± SEM. Unpaired
t tests were used for statistical analyses. The significance
was set at P<0.05.
Results
Genes associated with sorafenib
resistance
Raw RNA-seq data were processed using Cutadapt,
FastQC and MultiQC (30). Kallisto
was used to determine the abundance of transcripts, which were
normalized using TPM (31). Genes
with a TPM value of zero in >80% of the samples were excluded
from the gene expression data. Gene feature vectors were derived
from the processed gene expression data of Huh-7 cells. DNA-seq
data were processed using the GATK pipeline v4.1.7.0 (32). Subsequently, the gene feature
vectors for each sample were input into a model, and the genes were
ranked based on the output of the model. For each cell line, a list
of genes was obtained that ranked in the top 50 in at least two of
the three samples with sorafenib resistance and outside the top 50
in at least two of the three samples without sorafenib resistance.
To eliminate genes with insignificant rank differences between the
groups with and without sorafenib resistance, the average rank of
each group of genes was compared, and genes with an average rank
difference of less than twice were excluded. This led to the
identification of 21 Huh-7 genes. By intersecting the results from
the Huh-7 cell lines, six common genes were identified.
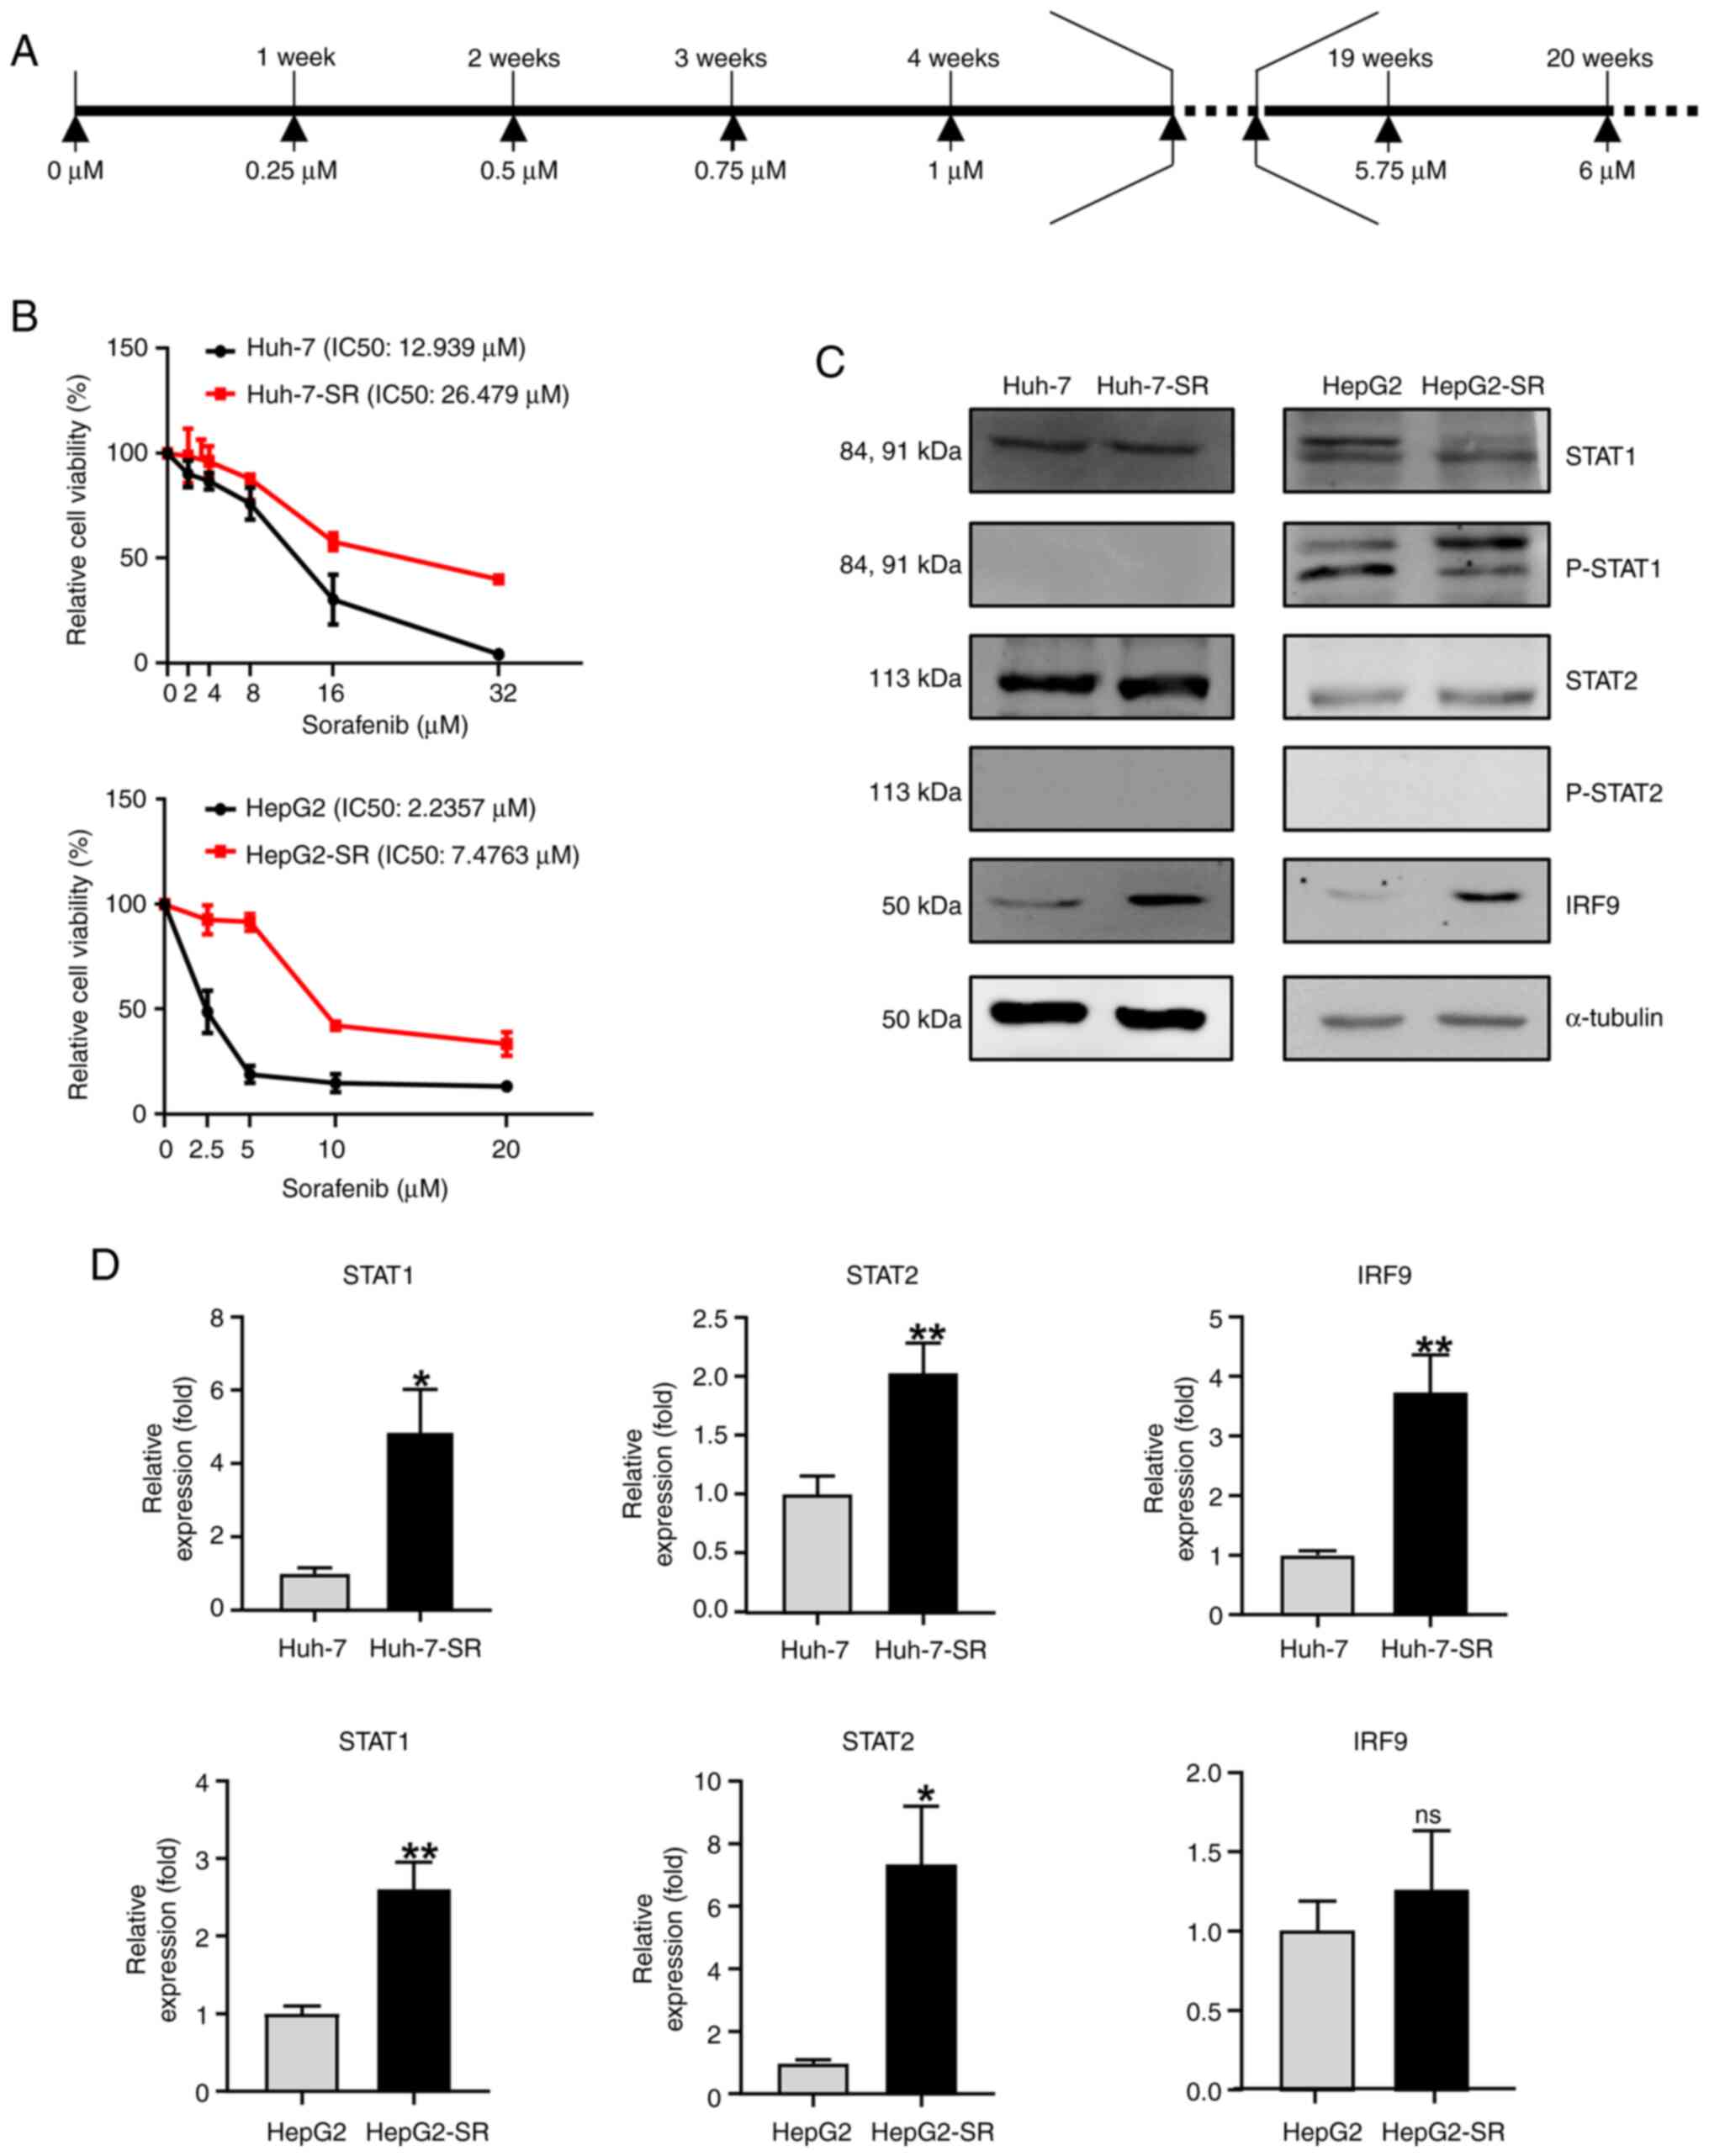
Unphosphorylated ISGF3 is positively
associated with sorafenib resistance in liver cancer cells
Sorafenib-resistant liver cancer cell lines were
established as follow: liver cancer cells were exposed to gradually
increasing concentrations ranging from 1 to 6 µM of sorafenib
(increasing 0.25 µM per cycle) for ~4 months (Fig. 2A). To observe the effects of
sorafenib resistance, we treated liver cancer cell lines with
increasing concentrations of sorafenib for 24 h using the MTT
assay. Sorafenib-resistant liver cancer cell lines were resistant
to higher concentrations of sorafenib (Fig. 2B). Compared with liver cancer cells,
sorafenib-resistant liver cancer cells showed markedly increased
levels of IRF9, but no significant difference in STAT1 and STAT2
(Fig. 2C and D).
Sorafenib resistance increases U-ISG
levels
U-ISGs, including OAS1, IFI27, BST2, and MDA5, were
increased in sorafenib-resistant liver cancer cells (Fig. 3A). In contrast, ISGF3
complex-dependent ISGs did not increase in Huh-7-SR cells (Fig. 3B) or were slightly induced in
HepG2-SR cells (Fig. 3B). Moreover,
other U-ISGs were robustly upregulated in the sorafenib-resistant
liver cancer cells (Fig. 3C).
However, ISGs produced by the phosphorylated ISGF3 complex were
minimally increased (Fig. 3C).
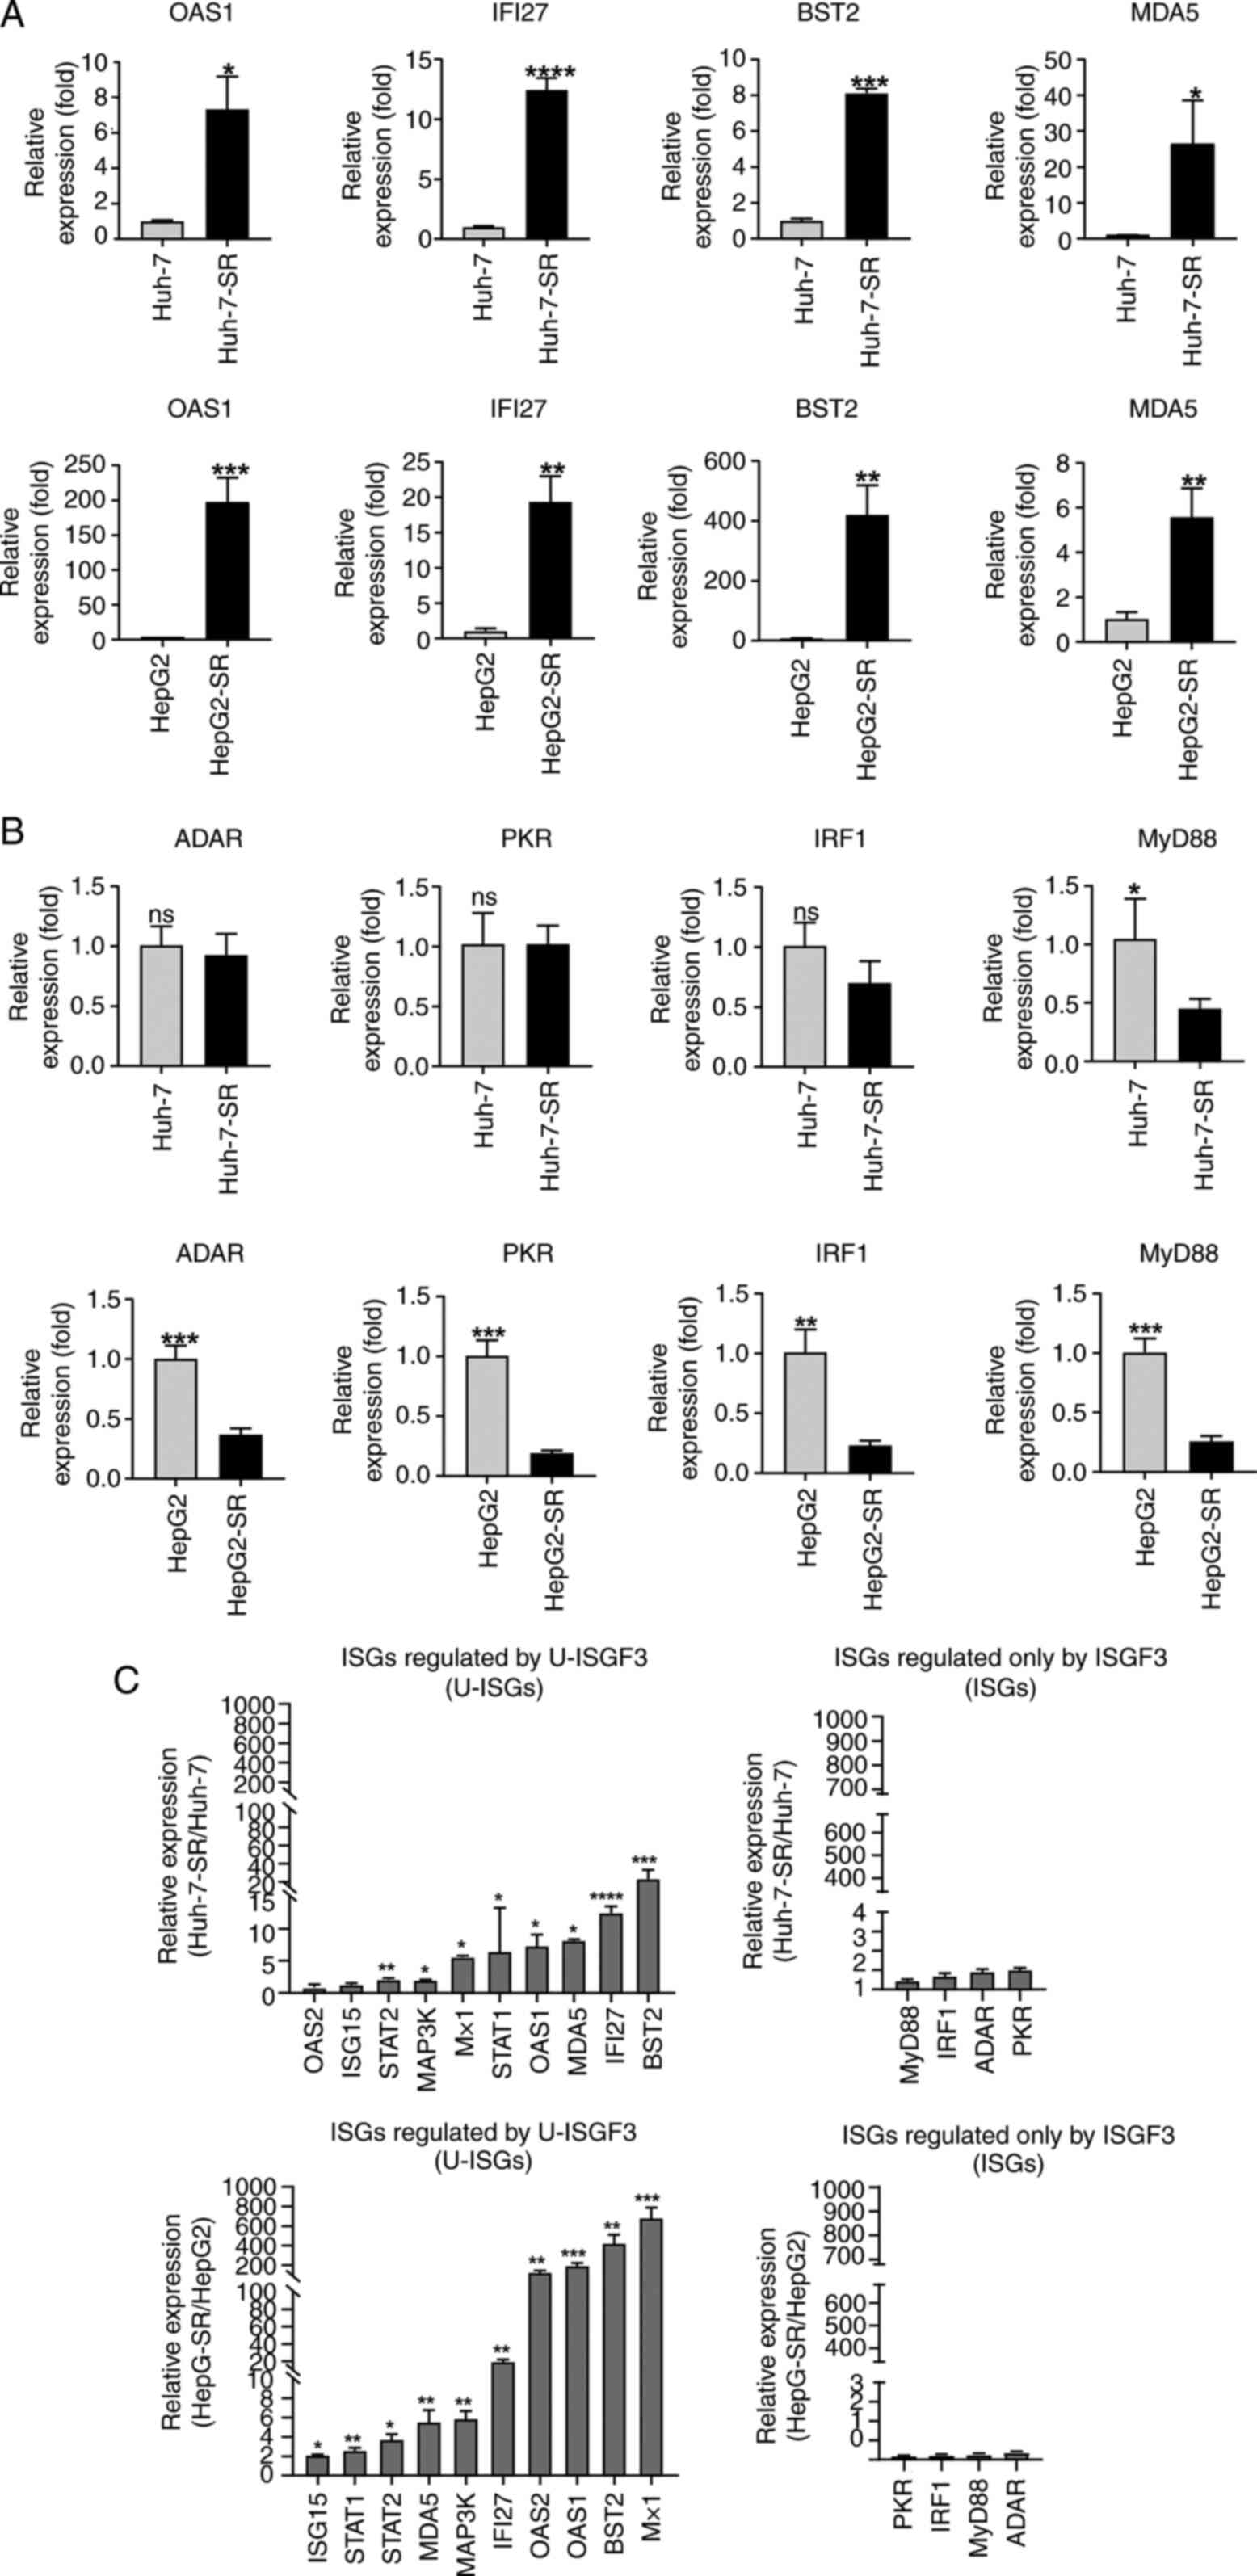 | Figure 3.Expression of U-ISGs in
sorafenib-resistant liver cancer cells. (A) Sorafenib-resistant
liver cancer cells were consistently maintained at 6 µM sorafenib.
The expression of U-ISGs was measured by RT-qPCR. (B) The
expression of ISGs regulated only by ISGF3 were measured by
RT-qPCR. (C) The expression of U-ISGs (left) and ISGs known to be
regulated only by ISGF3 (right) were measured by RT-qPCR. Data are
presented as a ratio of the mRNA level in sorafenib-resistant cells
to the mRNA level in liver cancer cells. *P<0.05, **P<0.01,
***P<0.001, ****P<0.001 vs. liver cancer cell lines (Huh-7
and HepG2). RT-qPCR, reverse transcription-quantitative PCR; IRF,
interferon regulatory factor; OAS1, oligoadenylate synthetase 1;
IFI27, Interferon Alpha Inducible Protein 27; BST2, Bone Marrow
Stromal Cell Antigen 2; MDA5, melanoma differentiation-associated
protein 5; ADAR, Adenosine deaminase Acting on RNA; PKR, Protein
kinase R; MyD88, Myeloid differentiation primary response 88; ISG,
interferon-stimulated gene; U-ISG, unphosphorylated
interferon-stimulated gene. |
U-ISGF3 inhibition re-sensitizes
sorafenib-resistant liver cancer cells to sorafenib
To explore the role of the U-ISGF3 complex, we used
a transfection method to reduce U-ISGF3 levels in Huh-7-SR cells
(Fig. 4A). Downregulation of the
U-ISGF3 complex in Huh-7-SR cells reduced U-ISG expression
(Fig. 4B). We showed that sorafenib
resistance was reduced in Huh-7-SR treated with transfection and in
the MTT assay. As expected, the U-ISGF3 complex increased the
viability of sorafenib-resistant liver cancer cells (Fig. 4C).
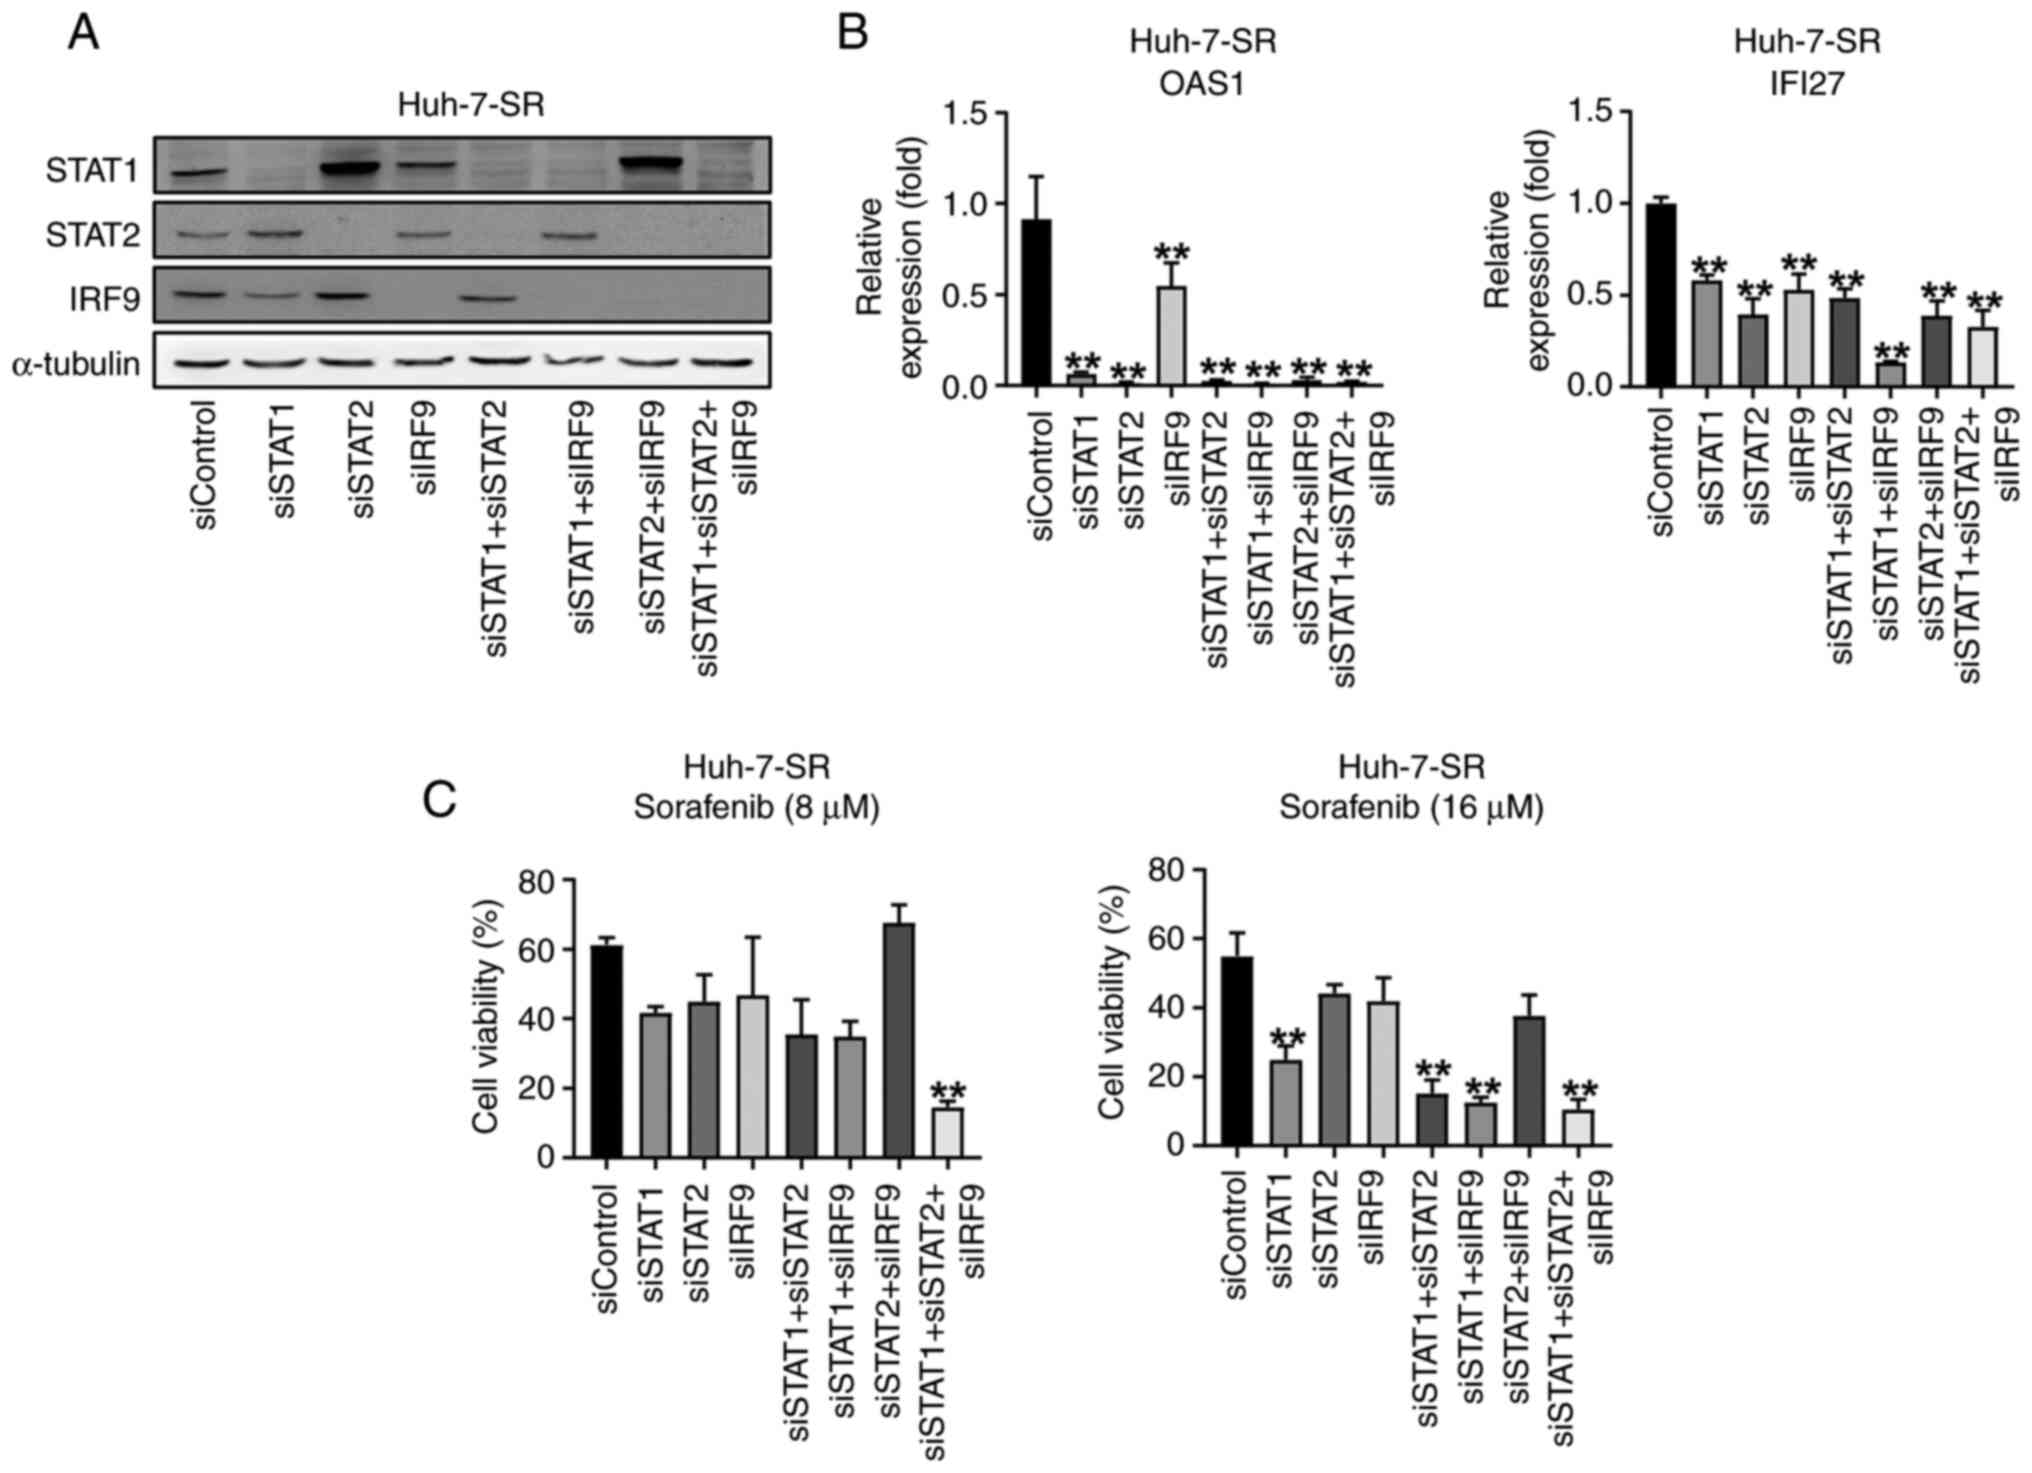 | Figure 4.U-ISGs unresponsiveness depends on
STAT1, STAT2 and IRF9 in Huh-7-SR cells. (A) Huh-7-SR cells were
transfected with si-control, si-STAT1, si-STAT2, and si-IRF9. Then,
48 h after transfection, cells were harvested and immunoblotting of
STAT1, STAT2 and IRF9 was performed. (B) mRNA levels of U-ISGs were
measured by reverse transcription-quantitative PCR. (C) After
transfection, Huh-7-SR cells were treated with an increasing dose
of sorafenib for 24 h. **P<0.01 vs. siControl. IRF, interferon
regulatory factor; si, small interfering; OAS1; oligoadenylate
synthetase 1; IFI27, Interferon Alpha Inducible Protein 27. |
Discussion
Several studies have revealed a critical role of the
U-ISGF3 complex in cancer (33).
Thus, the inhibition of U-ISGF3 is emerging as an attractive
therapeutic strategy for cancer. However, the relationship between
the U-ISGF3 complex and sorafenib resistance in HCC remains poorly
understood. Here, we confirmed that the U-ISGF3 complex promotes
sorafenib resistance and that inhibition of the U-ISGF3 complex
reduces sorafenib resistance.
Sorafenib is a multityrosine kinase inhibitor used
to treat HCC (34). However, its
sensitivity appears in only 30% of the patients, and within 6
months, sorafenib resistance is acquired in HCC (35). The first mechanism occurs when there
is no initial response to sorafenib treatment and is mainly
associated with altered activation of signaling pathways. In
contrast, the second mechanism refers to the development of
resistance to sorafenib after following an initial response.
Sorafenib resistance targets multiple cellular pathways that
contribute to tumor survival and proliferation (36,37).
The PI3K/Akt/mTOR signaling pathway is strongly activated by
prolonged exposure to sorafenib, leading to the development of
resistance (38). Machine learning
was used to elucidate the mechanisms underlying sorafenib
resistance. We employed a deep neural network to identify candidate
genes responsible for sorafenib resistance. However, machine
learning methods, including deep neural networks, require a
substantial number of samples. Therefore, we trained the model
using TCGA data and applied it to the data obtained from Huh-7
cells. While attempting to identify driver genes exhibiting
distinct patterns in samples with and without resistance, an
inherent limitation arises owing to factors such as batch effects
between TCGA and Huh-7 cell data, potentially causing a decrease in
accuracy.
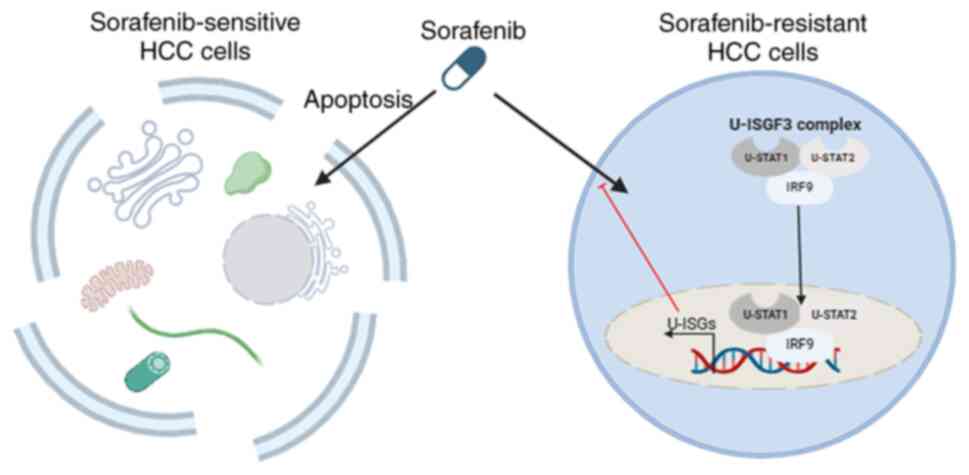
Using ML, we determined the significance of STAT1
expression in sorafenib resistance. In this study, we found no
differences in STAT1 expression in sorafenib-resistant cell lines,
whereas only IRF9 was differentially expressed. The U-ISGF3 complex
binds to the promoter regions of U-ISGs, particularly IRF9, which
contributes to most of the U-ISG promotor region. This suggests
that IRF9 is important for U-ISG expression. Fig. 5 shows that in sorafenib-resistant
cell lines, the U-ISGF3 complex translocates into the nucleus to
regulate the expression of U-ISGs, leading to the acquisition of
resistance. Several studies have suggested that U-ISGs are critical
regulators of irradiation or chemotherapy. The knockdown of STAT1,
STAT2, and IRF9 significantly enhanced the antitumor activity of
sorafenib in vitro.
In conclusion, our results indicate that the U-ISGF3
complex plays a crucial role in mediating sorafenib resistance in
liver cancer cells. These results suggest that this mechanism may
have clinical relevance and could potentially be applicable to
patients. The current study is limited by the lack of patient
samples, and future research should be verified using patient
samples.
Acknowledgements
Not applicable.
Funding
This work was supported by the Basic Science Research Program of
the National Research Foundation of Korea through the Ministry of
Science Information and Communication Technology (grant no.
NRF-2019R1A2C3005212) and the Research Fund of Seoul St. Mary's
Hospital (grant no. 2022-001). This work was also supported by the
Basic Science Research Program of the National Research Foundation
of Korea through the Ministry of Science Information and
Communication Technology (grant no. RS-2024-00337298).
Availability of data and materials
The datasets have been deposited in the Sequenced
Read Archive (SRA) (https://www.ncbi.nlm.nih.gov/bioproject/PRJNA1117191)
under accession no. PRJNA1117191. The rest of data generated in the
present study may be requested from the corresponding author.
Authors' contributions
DHS contributed to collecting raw data, analyzing
data interpretation, designing the research and writing the draft
of the paper and revision of the manuscript. JWP, HWJ, MWK and BYK
contributed to collecting raw data and data analysis. DYL and JJL
contributed to the study conception and data interpretation. SKY
and JWJ interpreted the data and revised the manuscript. PSS
designed the research and supervised the study. JGA contributed to
the study design, data interpretation, drafting the paper, and
manuscript revision. PSS and JGA confirm the authenticity of the
raw data. All authors have reviewed and approved the final
manuscript.
Ethics approval and consent to
participate
Not applicable.
Patient consent for publication
Not applicable.
Competing interests
The authors declare that they have no competing
interests.
Glossary
Abbreviations
Abbreviations:
|
HCC
|
hepatocellular carcinoma
|
|
U-ISGs
|
unphosphorylated interferon-stimulated
genes
|
|
U-ISGF3
|
unphosphorylated interferon-stimulated
gene factor-3
|
|
HBV
|
hepatitis B virus
|
|
HCV
|
hepatitis C virus
|
|
MASH
|
metabolic-associated
steatohepatitis
|
|
MAFLD
|
metabolic-associated fatty liver
disease
|
|
PDGFR-β
|
platelet-derived growth factor
receptor
|
|
VEGFR
|
vascular endothelial growth factor
receptors
|
|
IFNs
|
type I interferons
|
|
ISGs
|
interferon-stimulated genes
|
|
LIHC
|
liver hepatocellular carcinoma
|
References
|
1
|
Sung PS, Park DJ, Roh PR, Mun KD, Cho SW,
Lee GW, Jung ES, Lee SH, Jang JW, Bae SH, et al: Intrahepatic
inflammatory IgA+PD-L1high monocytes in
hepatocellular carcinoma development and immunotherapy. J
Immunother Cancer. 10:e0036182022. View Article : Google Scholar : PubMed/NCBI
|
|
2
|
Mun K, Han J, Roh P, Park J, Kim G, Hur W,
Jang J, Choi J, Yoon S, You Y, et al: Isolation and
characterization of cancer-associated fibroblasts in the tumor
microenvironment of hepatocellular carcinoma. J Liver Cancer.
23:341–349. 2023. View Article : Google Scholar : PubMed/NCBI
|
|
3
|
Tumen D, Heumann P, Gulow K, Demirci CN,
Cosma LS, Muller M and Kandulski A: Pathogenesis and current
treatment strategies of hepatocellular carcinoma. Biomedicines.
10:32022022. View Article : Google Scholar : PubMed/NCBI
|
|
4
|
Alawyia B and Constantinou C:
Hepatocellular carcinoma: A narrative review on current knowledge
and future prospects. Curr Treat Options Oncol. 24:711–724. 2023.
View Article : Google Scholar : PubMed/NCBI
|
|
5
|
Thandra KC and Barsouk A, Saginala K,
Aluru JS, Rawla P and Barsouk A: Epidemiology of non-alcoholic
fatty liver disease and risk of hepatocellular carcinoma
progression. Clin Exp Hepatol. 6:289–294. 2020. View Article : Google Scholar : PubMed/NCBI
|
|
6
|
Kim GA, Moon JH and Kim W: Critical
appraisal of metabolic dysfunction-associated steatotic liver
disease: Implication of Janus-faced modernity. Clin Mol Hepatol.
29:831–843. 2023. View Article : Google Scholar : PubMed/NCBI
|
|
7
|
Gallego-Durán R, Albillos A, Ampuero J,
Arechederra M, Bañares R, Blas-García A, Berná G, Caparrós E,
Delgado TC, Falcón-Pérez JM, et al: Metabolic-associated fatty
liver disease: From simple steatosis toward liver cirrhosis and
potential complications. Proceedings of the third translational
hepatology meeting, organized by the Spanish association for the
study of the liver (AEEH). Gastroenterol Hepatol. 45:724–734.
2022.(In English, Spanish). View Article : Google Scholar : PubMed/NCBI
|
|
8
|
Angeli-Pahim I, Chambers A, Duarte S and
Zarrinpar A: Current trends in surgical management of
hepatocellular carcinoma. Cancers (Basel). 15:53782023. View Article : Google Scholar : PubMed/NCBI
|
|
9
|
Yoon JH and Choi SK: Management of
early-stage hepatocellular carcinoma: Challenges and strategies for
optimal outcomes. J Liver Cancer. 23:300–315. 2023. View Article : Google Scholar : PubMed/NCBI
|
|
10
|
Jost-Brinkmann F, Demir M, Wree A, Luedde
T, Loosen SH, Müller T, Tacke F, Roderburg C and Mohr R:
Atezolizumab plus bevacizumab in unresectable hepatocellular
carcinoma: Results from a German real-world cohort. Aliment
Pharmacol Ther. 57:1313–1325. 2023. View Article : Google Scholar : PubMed/NCBI
|
|
11
|
Sung PS: Crosstalk between
tumor-associated macrophages and neighboring cells in
hepatocellular carcinoma. Clin Mol Hepatol. 28:333–350. 2022.
View Article : Google Scholar : PubMed/NCBI
|
|
12
|
Zhang Y, Li G, Liu X, Song Y, Xie J, Li G,
Ren J, Wang H, Mou J, Dai J, et al: Sorafenib inhibited cell growth
through the MEK/ERK signaling pathway in acute promyelocytic
leukemia cells. Oncol Lett. 15:5620–5626. 2018.PubMed/NCBI
|
|
13
|
Habiba YH, Omran GA, Helmy MW and Houssen
ME: Antitumor effects of rhamnazinon sorafenib-treated human
hepatocellular carcinoma cell lines via modulation of VEGF
signaling and PI3K/NF-κB p38/caspase-3 axes cross talk. Life Sci.
297:1204432022. View Article : Google Scholar : PubMed/NCBI
|
|
14
|
Li J, Xuan S, Dong P, Xiang Z, Gao C, Li
M, Huang L and Wu J: Immunotherapy of hepatocellular carcinoma:
Recent progress and new strategy. Front Immunol. 14:11925062023.
View Article : Google Scholar : PubMed/NCBI
|
|
15
|
Tian X, Yan T, Liu F, Liu Q, Zhao J, Xiong
H and Jiang S: Link of sorafenib resistance with the tumor
microenvironment in hepatocellular carcinoma: Mechanistic insights.
Front Pharmacol. 13:9910522022. View Article : Google Scholar : PubMed/NCBI
|
|
16
|
Hiebinger F, Kudulyte A, Chi H, Burbano De
Lara S, Ilic D, Helm B, Welsch H, Dao Thi VL, Klingmüller U and
Binder M: Tumour cells can escape antiproliferative pressure by
interferon-β through immunoediting of interferon receptor
expression. Cancer Cell Int. 23:3152023. View Article : Google Scholar : PubMed/NCBI
|
|
17
|
Blaszczyk K, Nowicka H, Kostyrko K,
Antonczyk A, Wesoly J and Bluyssen HAR: The unique role of STAT2 in
constitutive and IFN-induced transcription and antiviral responses.
Cytokine Growth Factor Rev. 29:71–81. 2016. View Article : Google Scholar : PubMed/NCBI
|
|
18
|
Au-Yeung N, Mandhana R and Horvath CM:
Transcriptional regulation by STAT1 and STAT2 in the interferon
JAK-STAT pathway. JAKSTAT. 2:e239312013.PubMed/NCBI
|
|
19
|
Platanitis E, Demiroz D, Schneller A,
Fischer K, Capelle C, Hartl M, Gossenreiter T, Muller M,
Novatchkova M and Decker T: A molecular switch from STAT2-IRF9 to
ISGF3 underlies interferon-induced gene transcription. Nat Commun.
10:29212019. View Article : Google Scholar : PubMed/NCBI
|
|
20
|
Lee CJ, An HJ, Cho ES, Kang HC, Lee JY,
Lee HS and Cho YY: Stat2 stability regulation: An intersection
between immunity and carcinogenesis. Exp Mol Med. 52:1526–1536.
2020. View Article : Google Scholar : PubMed/NCBI
|
|
21
|
Sung PS, Cheon H, Cho CH, Hong SH, Park
DY, Seo HI, Park SH, Yoon SK, Stark GR and Shin EC: Roles of
unphosphorylated ISGF3 in HCV infection and interferon
responsiveness. Proc Natl Acad Sci USA. 112:10443–10448. 2015.
View Article : Google Scholar : PubMed/NCBI
|
|
22
|
Cheon H, Holvey-Bates EG, Schoggins JW,
Forster S, Hertzog P, Imanaka N, Rice CM, Jackson MW, Junk DJ and
Stark GR: IFNβ-dependent increases in STAT1, STAT2, and IRF9
mediate resistance to viruses and DNA damage. EMBO J. 32:2751–2763.
2013. View Article : Google Scholar : PubMed/NCBI
|
|
23
|
Cheon H, Wang YX, Wightman SM, Jackson MW
and Stark GR: How cancer cells make and respond to interferon-I.
Trends Cancer. 9:83–92. 2023. View Article : Google Scholar : PubMed/NCBI
|
|
24
|
Jung H, Choi J, Park J and Ahn J: A novel
machine learning model for identifying patient-specific cancer
driver genes. IEEE Access. 10:54245–54253. 2022. View Article : Google Scholar
|
|
25
|
Tomczak K, Czerwińska P and Wiznerowicz M:
The cancer genome atlas (TCGA): An immeasurable source of
knowledge. Contemp Oncol (Pozn). 19:A68–A77. 2015.PubMed/NCBI
|
|
26
|
Croft D, O'Kelly G, Wu G, Haw R, Gillespie
M, Matthews L, Caudy M, Garapati P, Gopinath G, Jassal B, et al:
Reactome: A database of reactions, pathways and biological
processes. Nucleic Acids Res. 39:(Database Issue). D691–D697. 2011.
View Article : Google Scholar : PubMed/NCBI
|
|
27
|
Liu ZP, Wu C, Miao H and Wu H: RegNetwork:
An integrated database of transcriptional and post-transcriptional
regulatory networks in human and mouse. Database (Oxford).
2015:bav0952015. View Article : Google Scholar : PubMed/NCBI
|
|
28
|
Sondka Z, Bamford S, Cole CG, Ward SA,
Dunham I and Forbes SA: The COSMIC cancer gene census: Describing
genetic dysfunction across all human cancers. Nat Rev Cancer.
18:696–705. 2018. View Article : Google Scholar : PubMed/NCBI
|
|
29
|
Gundem G, Perez-Llamas C, Jene-Sanz A,
Kedzierska A, Islam A, Deu-Pons J, Furney SJ and Lopez-Bigas N:
IntOGen: Integration and data mining of multidimensional
oncogenomic data. Nat Methods. 7:92–93. 2010. View Article : Google Scholar : PubMed/NCBI
|
|
30
|
Ewels P, Magnusson M, Lundin S and Käller
M: MultiQC: Summarize analysis results for multiple tools and
samples in a single report. Bioinformatics. 32:3047–3048. 2016.
View Article : Google Scholar : PubMed/NCBI
|
|
31
|
Bray NL, Pimentel H, Melsted P and Pachter
L: Near-optimal probabilistic RNA-seq quantification. Nat
Biotechnol. 34:525–527. 2016. View Article : Google Scholar : PubMed/NCBI
|
|
32
|
Marx V: Genomics in the clouds. Nat
Methods. 10:941–945. 2013. View Article : Google Scholar : PubMed/NCBI
|
|
33
|
Wang W, Yin Y, Xu L, Su J, Huang F, Wang
Y, Boor PPC, Chen K, Wang W, Cao W, et al: Unphosphorylated ISGF3
drives constitutive expression of interferon-stimulated genes to
protect against viral infections. Sci Signal. 10:eaah42482017.
View Article : Google Scholar : PubMed/NCBI
|
|
34
|
Zhou W, Lou W, Chen J, Ding B, Chen B, Xie
H, Zhou L, Zheng S and Jiang D: AG-1024 sensitizes
sorafenib-resistant hepatocellular carcinoma cells to sorafenib via
enhancing G1/S arrest. Onco Targets Ther. 14:1049–1059. 2021.
View Article : Google Scholar : PubMed/NCBI
|
|
35
|
Guo L, Hu C, Yao M and Han G: Mechanism of
sorafenib resistance associated with ferroptosis in HCC. Front
Pharmacol. 14:12074962023. View Article : Google Scholar : PubMed/NCBI
|
|
36
|
Zhai B and Sun XY: Mechanisms of
resistance to sorafenib and the corresponding strategies in
hepatocellular carcinoma. World J Hepatol. 5:345–352. 2013.
View Article : Google Scholar : PubMed/NCBI
|
|
37
|
Xia S, Pan Y, Liang Y, Xu J and Cai X: The
microenvironmental and metabolic aspects of sorafenib resistance in
hepatocellular carcinoma. EBioMedicine. 51:1026102020. View Article : Google Scholar : PubMed/NCBI
|
|
38
|
Sun T, Liu H and Ming L: Multiple roles of
autophagy in the sorafenib resistance of hepatocellular carcinoma.
Cell Physiol Biochem. 44:716–727. 2017. View Article : Google Scholar : PubMed/NCBI
|