Introduction
Colorectal cancer (CRC) is one of the most common
tumors worldwide, and its incidence and mortality rates are ranked
third among all malignant tumors (1–3).
Early-stage CRC is mainly treated with surgery (4), while advanced-stage or metastatic CRC
is treated with chemotherapy combined with targeted therapy
(5). Unfortunately, a number of
patients with CRC have no obvious symptoms in the early stage of
disease, leading to patients reaching advanced stage disease at the
time of diagnosis, missing the best opportunity for surgery
(6). Additionally, even after
successful surgical resection, some patients still encounter local
recurrence or distant metastasis (7). Chemotherapy and targeted therapy have
improved the therapeutic effect to a certain extent, but there are
also side effects and drug resistance issues (8). Therefore, it is of great significance
to develop new biomarkers to detect early CRC, improve the cure
rate of surgery and overcome the existing drug resistance mechanism
to prolong the survival of patients. With the popularization of
gene detection, CRC classification based on biomarker
classification, such as RAS and BRAF mutation and microsatellite
instability (MSI), contributes to treatment and prognosis
prediction in CRC (9). Therefore,
further exploration and improvement in biomarker classification is
of great value to provide individualized and accurate treatment for
patients with CRC.
Pyroptosis is a newly discovered type of programmed
cell death (10). Contrary to
apoptosis, pyroptosis is accompanied by changes in cell membrane
permeability, water influx, cell rupture and the release of
inflammatory factors (11), causing
a strong inflammatory response. Pyroptosis can be induced via the
classical inflammasome pathway (caspase-1-dependent) and
non-classical inflammasome pathway (caspase-4/5/11-dependent)
(12). Both pathways lead to the
cleavage and activation of the gasdermin (GSD) family of proteins
(GSDMA, GSDMB, GSDMA, GSDMD and GSDME) and finally result in
membrane pore formation and cell death (13). A previous study has shown that
pyroptosis is involved in the development of malignant tumors
(14). In CRC, pyroptosis not only
affects tumor angiogenesis (15,16)
but also increases chemosensitivity (17). Therefore, pyroptosis-related genes
(PRGs) may be biomarkers of CRC and improve treatment and
prognosis.
In the present study, the genomic mutations and
expression patterns of PRGs in CRC were analyzed using datasets
from The Cancer Genome Atlas (TCGA) and Gene Expression Omnibus
(GEO) databases. Distinct pyroptosis subgroups were identified and
then the differential genes between the different subgroups were
obtained to generate a PRG risk score. Further analysis was
performed to determine whether the PRG risk score could assess
prognosis, immune cell infiltration and drug sensitivity in
CRC.
Materials and methods
Data sources
Somatic mutation data, mRNA expression data and the
clinical information of patients with CRC were downloaded from TCGA
(18) (https://portal.gdc.cancer.gov/repository) on February
20, 2022. There were 44 normal tissues and 568 CRC tissues in this
dataset. The GSE39582 dataset (19)
(platform GPL570; 579 patients with CRC) was downloaded from the
GEO database (http://www.ncbi.nlm.nih.gov/geo/) on February 25,
2022. Some cases with missing clinical information were excluded
from analysis. The CamBat function of the ‘SVA’ package in R
(version 4.1.0; http://www.r-project.org) was used for merging and
correcting the TCGA and GEO datasets.
Gene expression analysis and
unsupervised clustering
A total of 52 PRGs were pooled from previous reviews
(20–22) (Table
SI). Gene differential analysis was performed using the ‘limma’
package in R (version 4.1.0), with P<0.05 as the cut-off.
Unsupervised clustering analysis (23) was performed using the
‘ConsensusClusterPlus’ package (24) to identify pyroptosis-related
subgroups. The repetition was set at 1,000 times to guarantee the
stability of classification. Principal component analysis (PCA) was
also conducted to investigate whether different subgroups had
different characteristics.
Clinical samples, RNA extraction and
reverse transcription-quantitative PCR (RT-qPCR)
The samples used for RT-qPCR were paired CRC tissues
and adjacent normal tissues from 27 patients. These samples were
collected from patients who underwent CRC surgery at Zhongshan
People's Hospital (Zhongshan, China) but had not undergone
chemotherapy, targeted therapy, immunotherapy or other internal
medicine treatments. These tissue samples were collected from June
2022 to May 2023, and the age range of patients was 41–81 years
old, with 14 females and 13 males. The inclusion criteria were as
follows: i) All samples must have undergone pathological
examination and be diagnosed with CRC; ii) fresh or flash frozen
tissue samples were preferred to maintain tissue integrity and
bioactivity; iii) each sample should have enough tissue to meet the
experimental needs; iv) detailed clinical information available,
including the patient's age, sex, tumor stage, grade and treatment
history; and v) patients or their family members had signed the
informed consent form for the use of their tissue samples in
research. The exclusion criteria were as follows: i) Tissue samples
with obvious infection, inflammation or severe necrosis; ii)
samples containing a large number of non-tumor tissues (such as
normal mucosa and adipose tissue) to reduce interference; and iii)
samples from patients who had received radiotherapy or chemotherapy
were excluded as these treatments may change the biological
characteristics of tumors. The clinical information of the patients
is listed in Table SII. The
clinical staging system for patients with CRC used in the present
study was the 8th edition of TNM staging system released by the
American Joint Committee on cancer and the Union for international
cancer control in 2017 (25).
Total RNA was extracted from patient tissue samples
by TRIzol reagent (Invitrogen; Thermo Fisher Scientific, Inc.)
according to the manufacturer's protocol. Subsequently, the
extracted RNA was reverse transcribed using the PrimeScript RT
reagent Kit with a gDNA Eraser (Takara Bio, Inc.), according to the
manufacturer's instructions. The cDNAs were subjected to SYBR
Green-based (Thermo Fisher Scientific, Inc.) qPCR analysis. qPCR
reactions were carried out on an ABI 7500 Real-Time PCR System
(Applied Biosystems; Thermo Fisher Scientific, Inc.) with the
following thermocycling conditions: Initial denaturation at 95°C
for 3 min; denaturation at 95°C for 10 sec, annealing at 60°C for
30 sec and extension at 72°C for 30 sec, which was repeated for 40
cycles; melting curve analysis at 95°C for 15 sec, 60°C for 1 min,
95°C for 15 sec. β-actin was used as the reference gene to
normalize the cDNA input. The relative expression levels of target
genes were quantified using the ΔΔCq method (26). The primers used in the qPCR are
listed in (Table SIII).
Gene Set Variation Analysis
(GSVA)
GSVA (27) was
performed using the ‘GSVA’ packages in R (version 4.1.0) to analyze
the differences in biological signaling pathways between the
different subgroups, with adjusted P<0.05 as the cut-off.
‘c2.cp. Kegg.v7.4.symbols’ was downloaded from the MSigDB database
(https://www.gsea-msigdb.org/gsea/msigdb) to conduct
GSVA.
CIBERSORT analysis
Initially, the gene expression matrix was extracted
from the raw data, which included the gene expression levels of all
samples. Subsequently, the CIBERSORT algorithm in R (version 4.1.0)
was employed to estimate the abundance of 23 types of immune cells
in each sample. The inputs for the algorithm comprised the gene
expression matrix and the cell type-specific gene sets. The output
results provided the relative abundance of each immune cell type in
every sample.
Estimation of immune cell infiltration
in the tumor microenvironment (TME)
A single-sample gene set enrichment analysis
(ssGSEA) was conducted to compare the immune cell infiltration
profiles between the different subgroups. In total, 23 types of
TME-infiltrating immune cells, such as regulatory T cells (Tregs),
activated CD8+ T cells and macrophages, were obtained
from the study by Charoentong et al (28). R (version 4.1.0; http://www.r-project.org) was used to perform ssGSEA
analysis to calculate the abundance of each type of infiltrating
cells in the CRC TME. The enrichment scores were used to indicate
the degree of infiltration. ES >0.5 or ES <-0.5 were selected
as the threshold for significant enrichment or depletion. Adjusted
P<0.05 indicated that the enrichment score was statistically
significant.
Identification of differentially
expressed genes (DEGs) in the different subgroups
The ‘Venn diagram’ package in R (version 4.1.0) was
used to identify the overlapping differential genes between the
different subgroups. Then, Gene Ontology (GO) and Kyoto
Encyclopedia of Genes and Genomes (KEGG) enrichment analyses were
performed to determine the molecular mechanisms of the overlapping
differential genes using the ‘clusterProfiler’ package in R
(version 4.1.0).
Kaplan-Meier analyses
Kaplan-Meier survival analyses were performed using
R (version 4.1.0) to evaluate the association between gene
expression levels and patient survival. The median expression level
of the target gene was used as the cut-off to classify patients
into the high-expression and low-expression groups. Patients with
gene expression levels higher than or equal to the median were
classified as the high-expression group, while those with
expression levels below the median were classified as the
low-expression group.
Identification of prognostic genes and
the generation of a risk score model
A univariate Cox regression analysis was performed
to identify genes that were significantly associated (P<0.01)
with the survival of patients with CRC. TCGA and GEO data were
integrated and randomly divided into the training and test cohorts.
The risk score model was constructed using LASSO analysis and the
‘glmnet’ R package. The risk score was calculated as follows: Risk
score= Σi n=1 vi × ci, where n indicates the quantity of
genes, vi indicates the expression of genes and ci indicates the
regression coefficient of genes i. According to the median risk
score of the training cohort, both cohorts were divided into the
high-risk and low-risk groups. Then, receiver operating
characteristic (ROC) curved were used to assess the prognostic
practicability of the risk score. Using the ‘regplot’ and
‘survival’ packages in R, a nomogram was constructed based on the
clinical characteristics to predict the patient survival time (1-,
3- and 5-year survival). Calibration curves were produced using the
‘rms’ package in R to verify the nomogram.
Relationship between the risk score
and drug sensitivity
Genomics of Drug Sensitivity in Cancer (GDSC)
(https://www.cancerrxgene.org/) is a
database providing the relationship between the antitumor drug
response and genomic features. According to the list of drugs, the
‘PRRophetic’ package in R was used to construct the ridge
regression model. By analyzing the expression profiles based on the
drug IC50, the relationship between the risk score and the
sensitivity to antitumor drugs was shown.
ESTIMATE analysis
All analyses were conducted in the R (version 4.1.0;
R Core Team) environment. The main R packages used include estimate
and ggplot2. The estimate package was utilized to calculate the
ImmuneScore, StromalScore and ESTIMATEScore, while the ggplot2
package was employed for data visualization.
Statistical analysis
All statistical analyses were performed using R
(version 4.1.0). The ‘maftools’ package was used to analyze the
mutation frequency of genes. The ‘RCircos’ package was used to
analyze the copy number variation landscape of PRGs in 23 pairs of
chromosomes. In the qPCR experiment, the comparison between two
groups was performed using a paired two-sample t-test, while the
comparison between two groups in other analyses was conducted using
an unpaired two-sample t-test. One-way ANOVA was used to compare
three or more groups, followed by Bonferroni correction as the post
hoc test. All P-values were two-sided, and P<0.05 was considered
to indicate a statistically significant difference.
Results
Landscape of the genetic variation of
the PRGs in CRC
A flow chart of the present study is presented in
Fig. S1. Using the mutation data
from TCGA, the somatic mutations and copy number variations (CNVs)
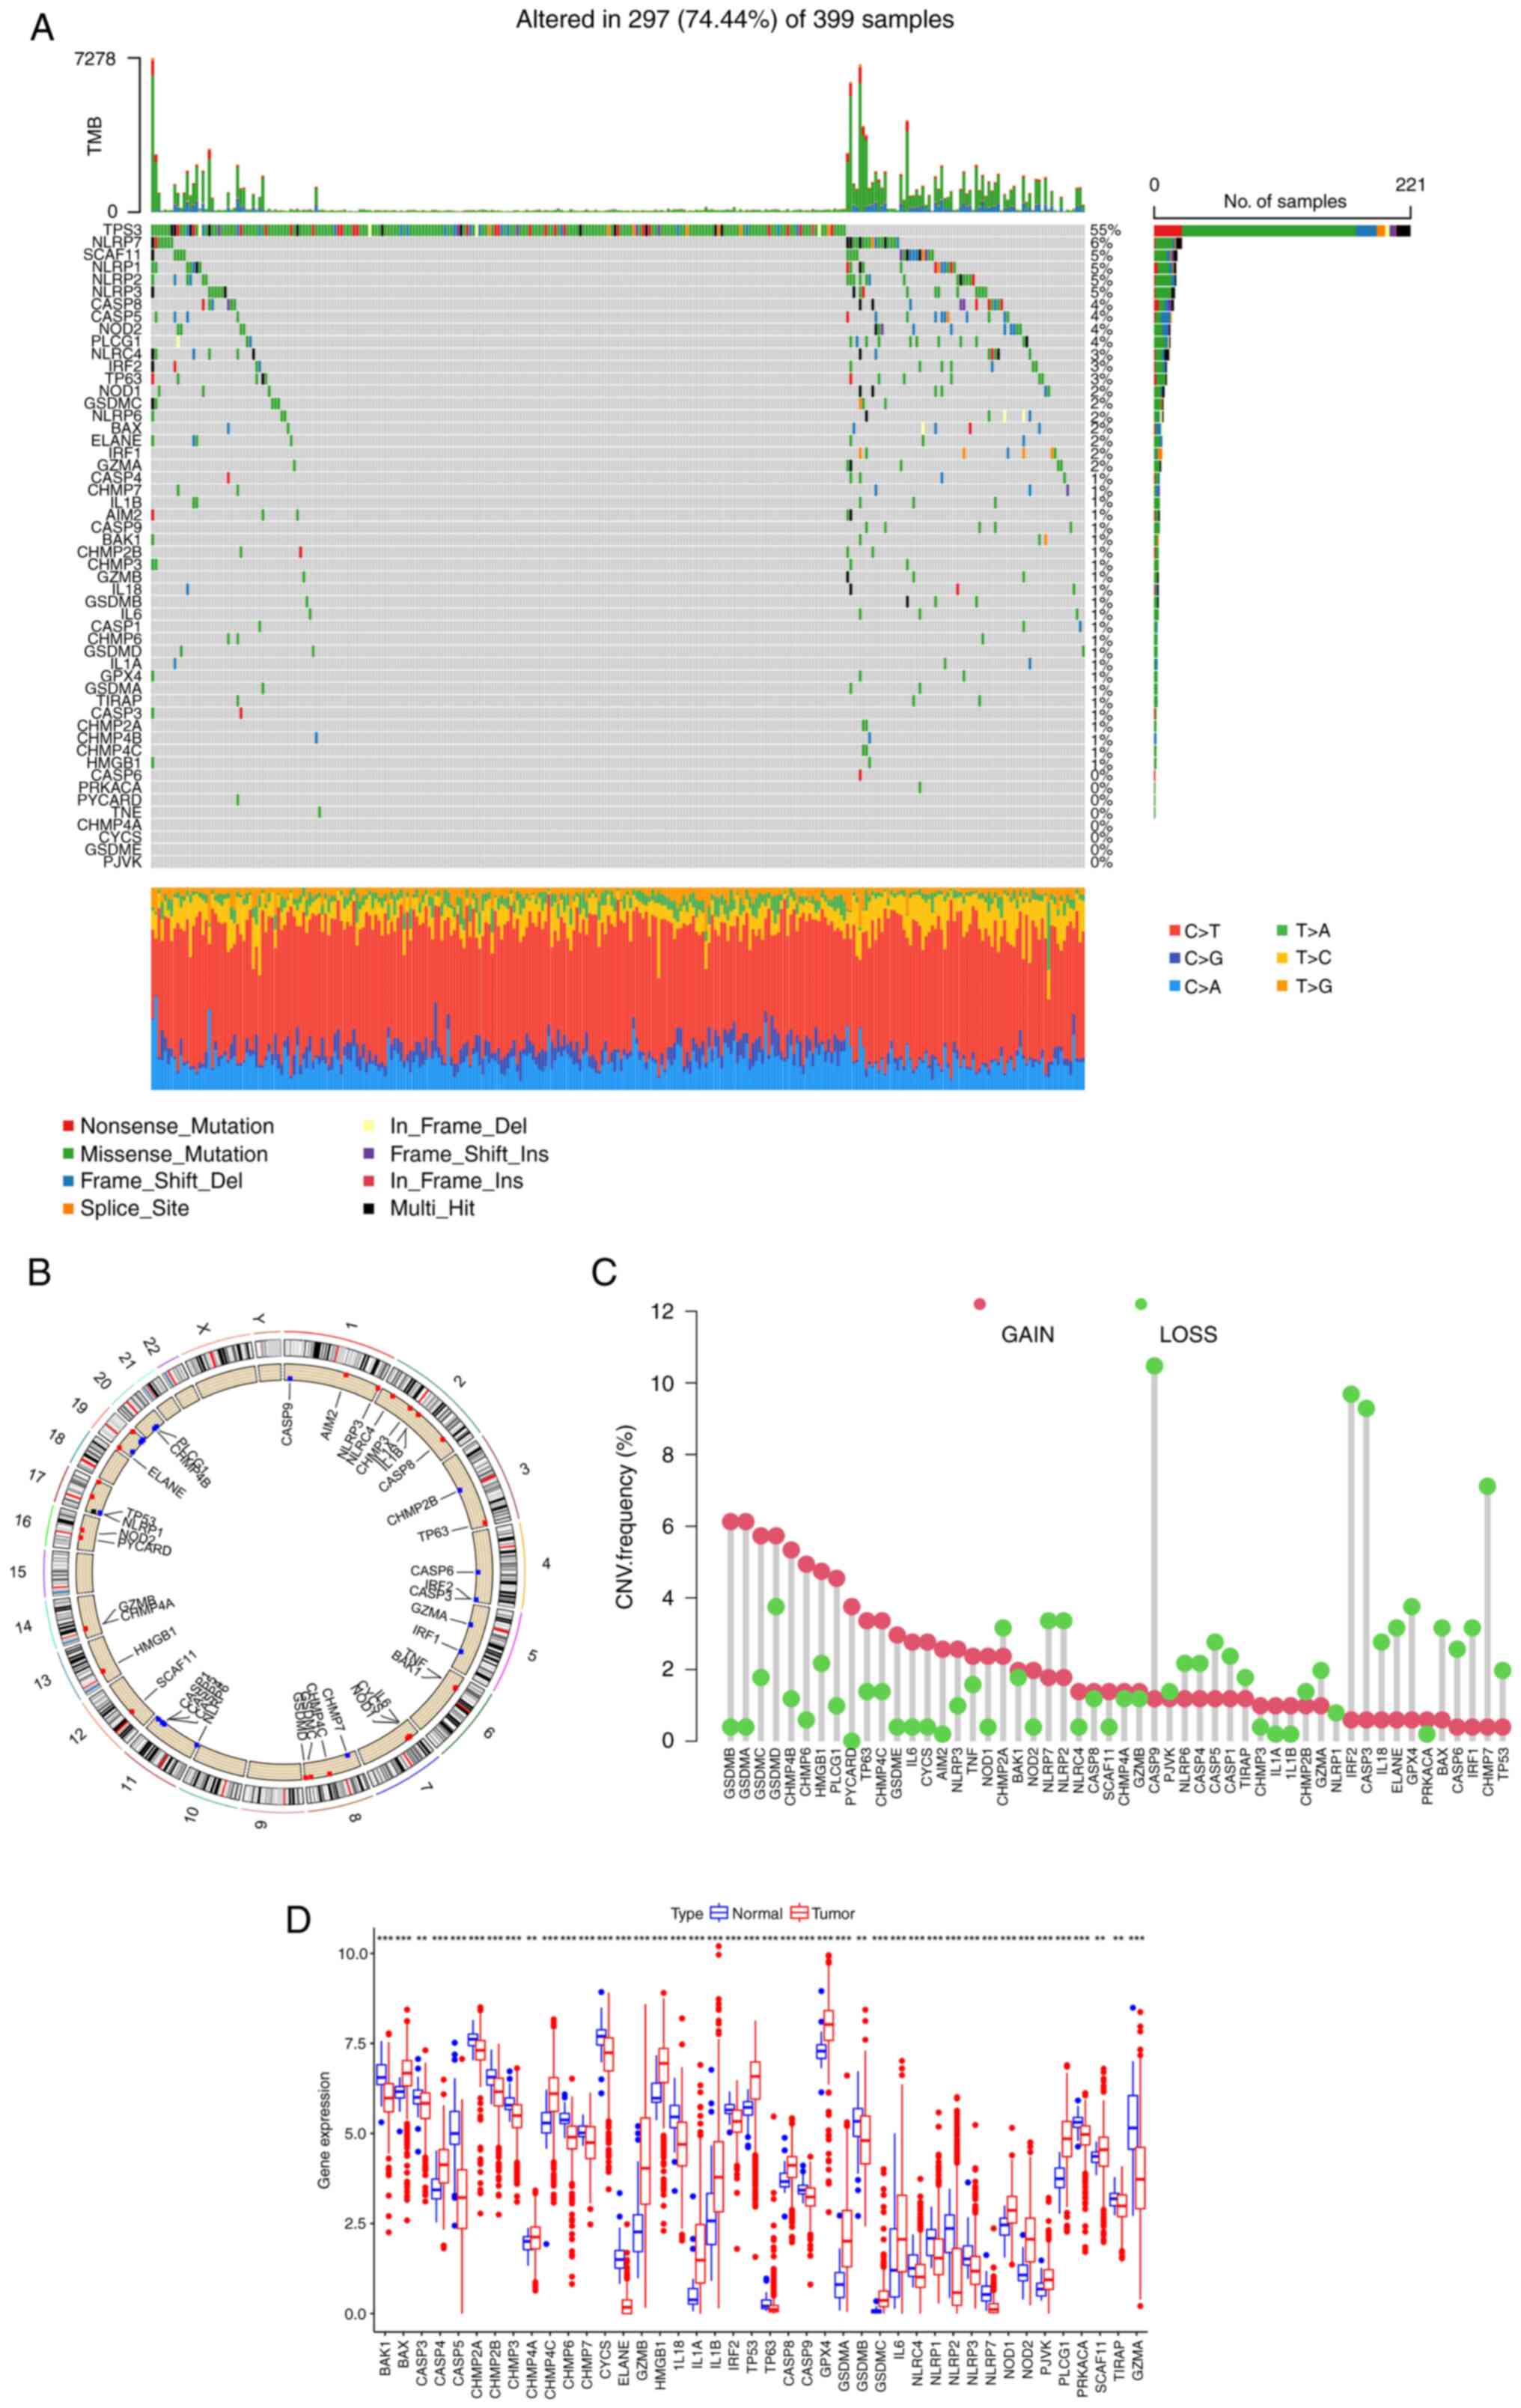
of 52 PRGs in CRC were analyzed. Among 399 patients, 297 exhibited
PRG mutations, with a frequency of 74.44% (Fig. 1A). Among them, TP53 (55%) had the
highest mutation frequency, followed by NLRP7 (6%). In total, 8
PRGs, including CASP6, PRKACA, PYCARD, TNF, CHMP4A, CYCS, GSDME and
PJVK, did not show any mutations in the CRC samples. The location
of CNVs of PRGs on chromosomes is shown in Fig. 1B. The CNV frequency of PRGs was also
analyzed (Fig. 1C), and it was
found that the copy number of most genes of the GSD family, such as
GSDMA, GSDMB, GSDMC and GSDMD, was amplified, while CASP9, CASP3,
IRF2 and CHMP7 were mainly deleted. Next, the mRNA expression
levels of 52 PRGs were investigated (Fig. 1D). Compared with normal tissues,
most PRGs with increased CNV, such as GSDMA and GSDMC, showed
significantly higher expression in CRC samples, and an opposite
pattern was observed for genes with decreased CNV, such as CASP9
and IRF2. However, for certain PRGs, such as GSDMB and TP53, the
alterations of CNV may not be the main factor affecting their
expression, as these PRGs with increased CNV had significantly
decreased expression in tumor tissues. These findings suggest an
uncertain association between the gene mutational intensity and
expression level.
Generation of pyroptosis subgroups in
CRC
The data from 1,089 patients with CRC in TCGA and
GSE39582 were integrated to investigate the potential biological
function of PRGs (Table SIV).
Univariate Cox and Kaplan-Meier analyses were conducted to reveal
the prognostic values of the PRGs (Table SV). Then, according to the
expression level and prognostic value of the PRGs, a correlation
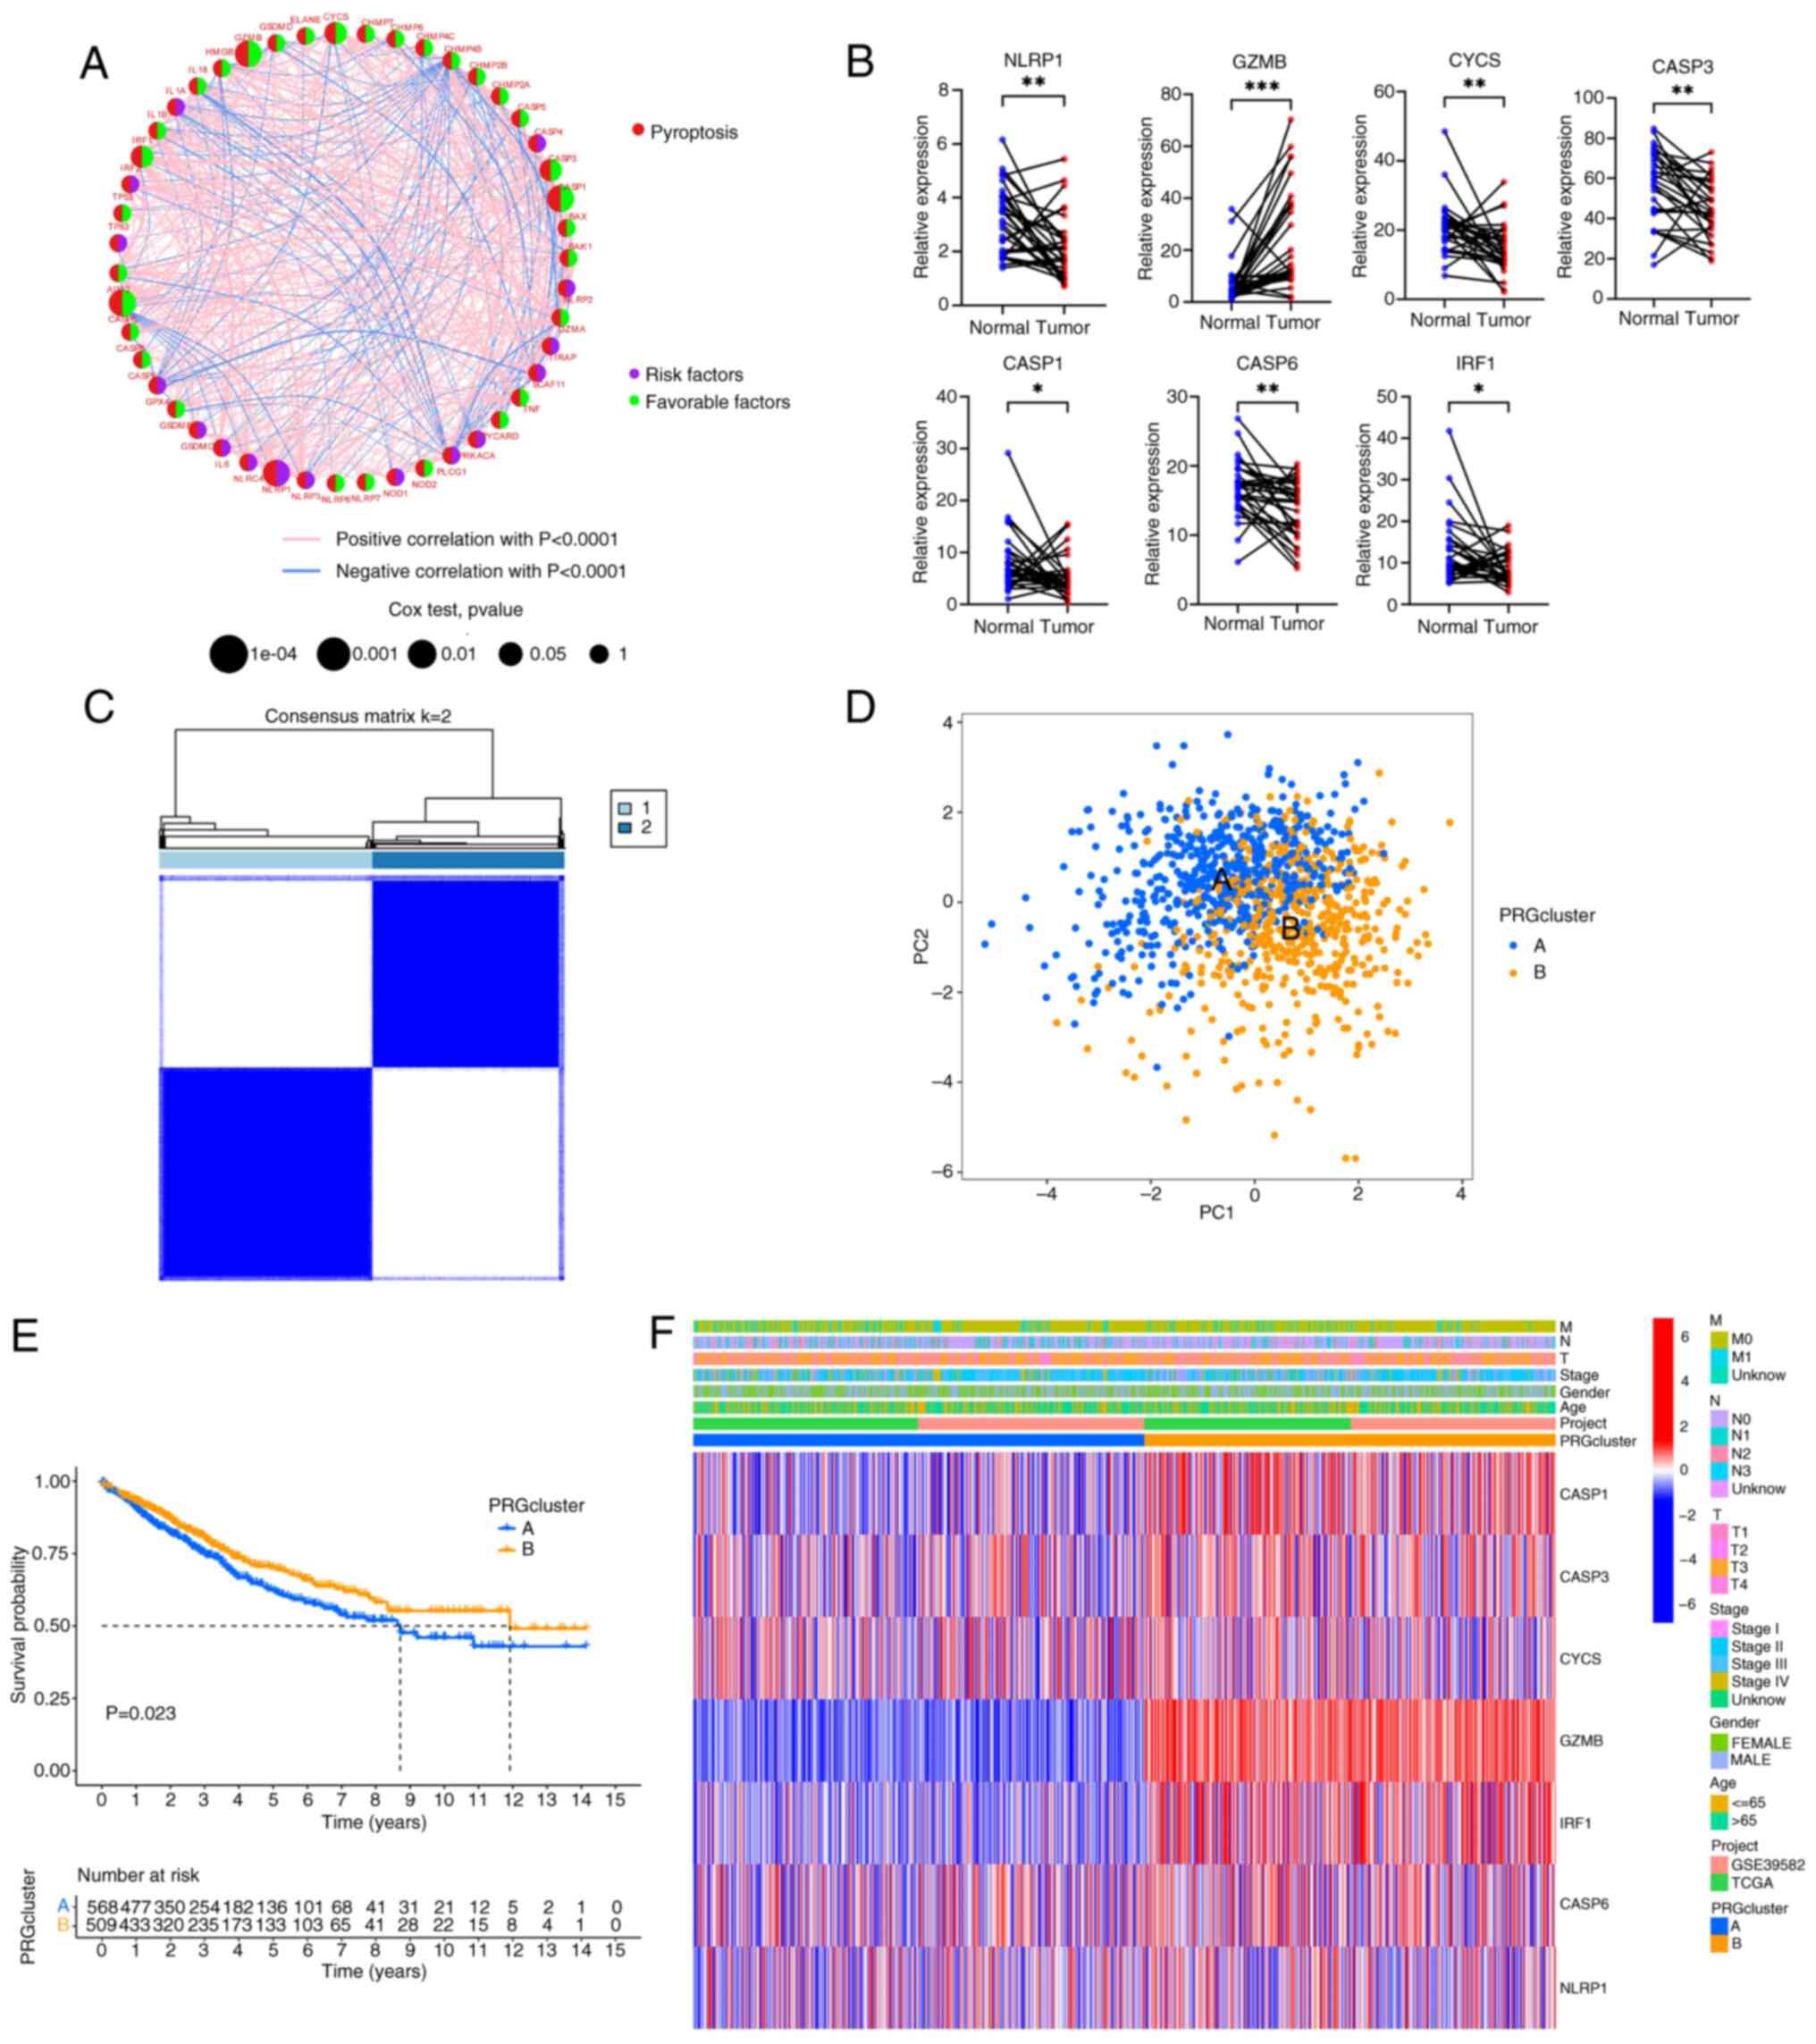
network was constructed (Fig. 2A
and Table SVI). There were 7 PRGs
(GZMB, CYCS, CASP3, CASP1, CASP6, IRF1 and NLRP1) with statistical
significance in the univariate and Kaplan-Meier analyses (all
P<0.05; Fig. S2 and Table SVII). Generally, if the
upregulation of gene expression leads to a worse prognosis, the
gene is termed a risk factor. Conversely, if the upregulation of a
gene expression leads to an improved prognosis, the gene is termed
a favorable factor. NLRP1 was the only risk factor, and increased
expression of NLRP1 worsened the prognosis of CRC. By contrast,
increased expression of GZMB, CYCS, CASP3, CASP1, CASP6 and IRF1
predicted a more favorable prognosis. The mRNA expression levels of
the 7 genes were also verified by RT-qPCR using clinical samples
obtained from Zhongshan People's Hospital (paired CRC tissues and
adjacent normal tissues; n=30) (Fig.
2B). It was observed that, compared with the adjacent normal
tissue, GZMB expression was elevated, while the expression of the
other 6 genes (NLRP1, CYCS, CASP3, CASP1, CASP6 and IRF1) was
decreased. Based on the expression patterns of the 7 PRGs, a
consensus clustering and PCA analysis were performed. Notably,
patients were clustered into two subtypes (clusters A and B;
Fig. 2C and D). Furthermore, there
were statistically significant differences in the prognosis of
patients between clusters A and B (Fig.
2E). The differences in clinical features between the two
groups of patients were also analyzed (Fig. 2F). It was found that there were no
significant differences in the clinical characteristics between the
two groups of patients, but the PRGs in cluster B were more
inclined towards high expression, especially GZMB, IRF1, CASP1,
CASP3 and CASP6.
Difference in the TME between the PRG
subgroups
A GSVA was conducted to investigate the differences
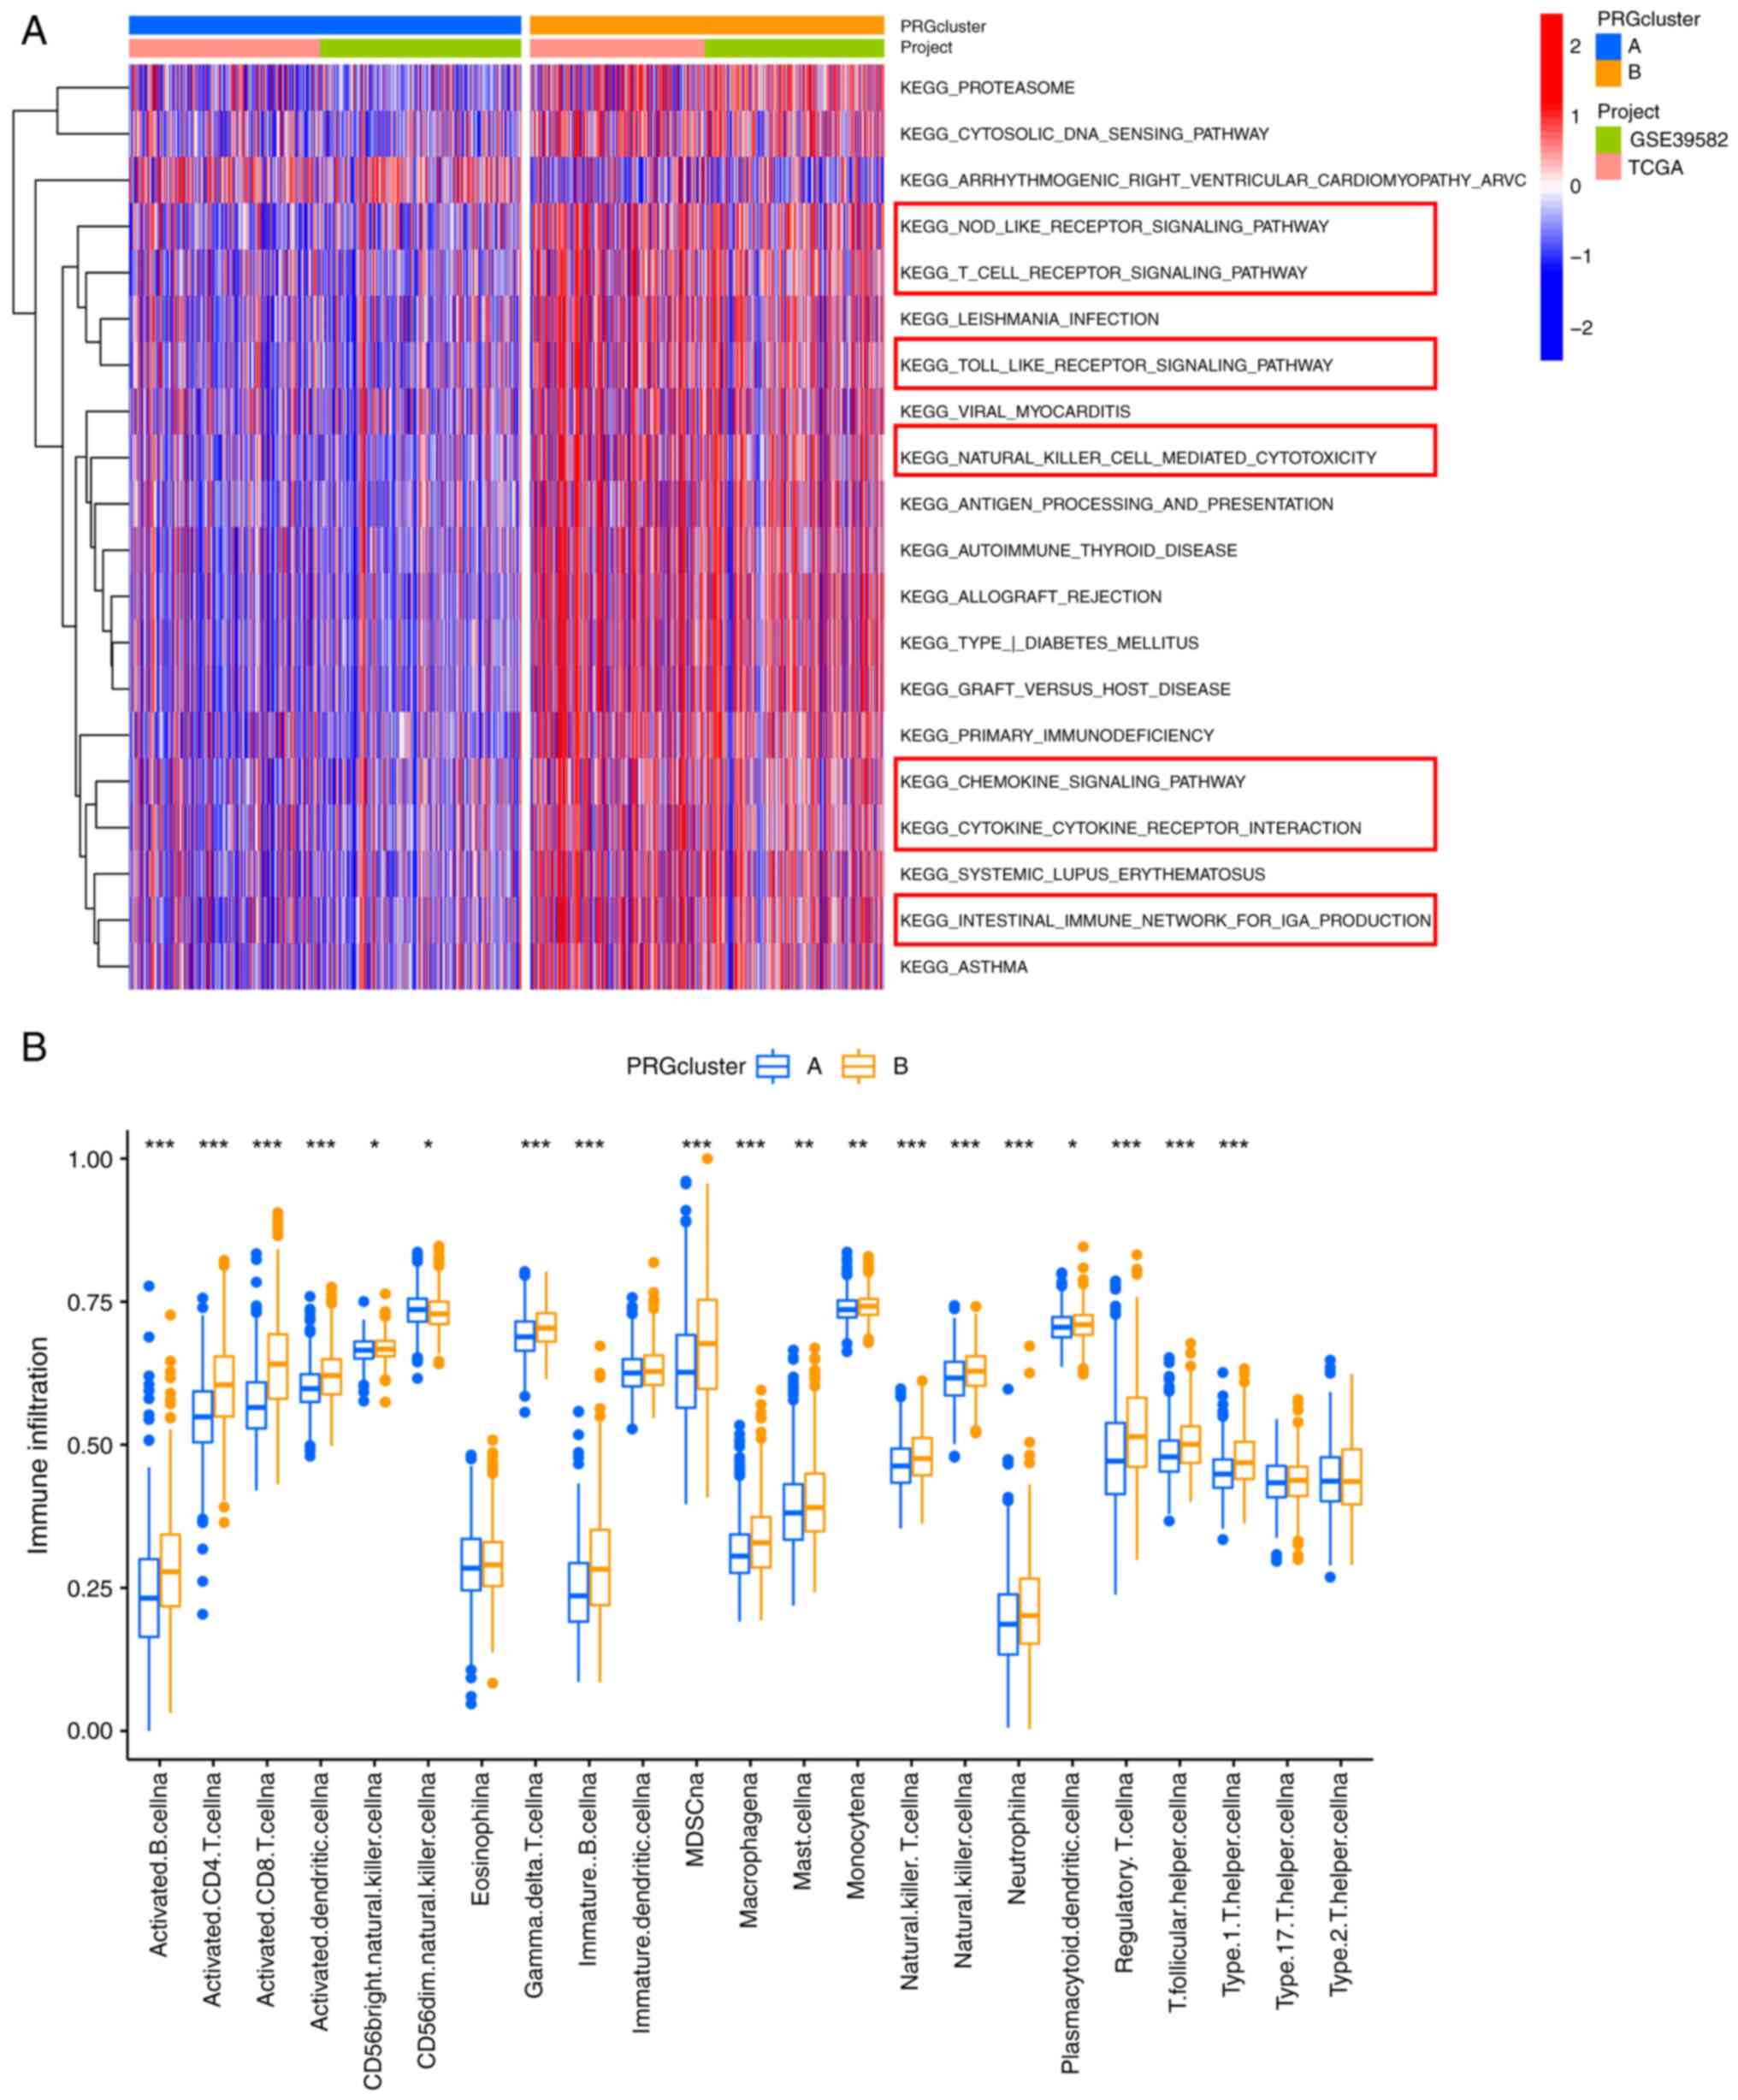
in the biological signaling pathways of the PRG subgroups. Notably,
cluster B was enriched in immune-associated pathways, such as
‘NOD-LIKE RECEPTOR SIGNALING PATHWAY’, ‘T CELL RECEPTOR SIGNALING
PATHWAY’, ‘CHEMOKINE SIGNALING PATHWAY’ and ‘NATURAL KILLER
CELL-MEDIATED CYTOTOXICITY’ (Fig.
3A). Therefore, we speculated that cluster B may have a more
favorable prognosis than cluster A due to the rich immune cell
infiltration in its TME. The CIBERSORT algorithm was used to
estimate the infiltration levels of 23 types of immune cells and
verify our hypothesis. As expected the abundance of almost all
immune cells was significantly increased in cluster B (Fig. 3B).
Identification of DEGs
Considering that phenotypic changes are closely
related to differential expression of genes, the expression levels
of all genes were analyzed using the ‘limma’ package and 76 DEGs
between clusters A and B were obtained (Table SVIII). Next, functional enrichment
analysis was conducted to explore the underlying biological
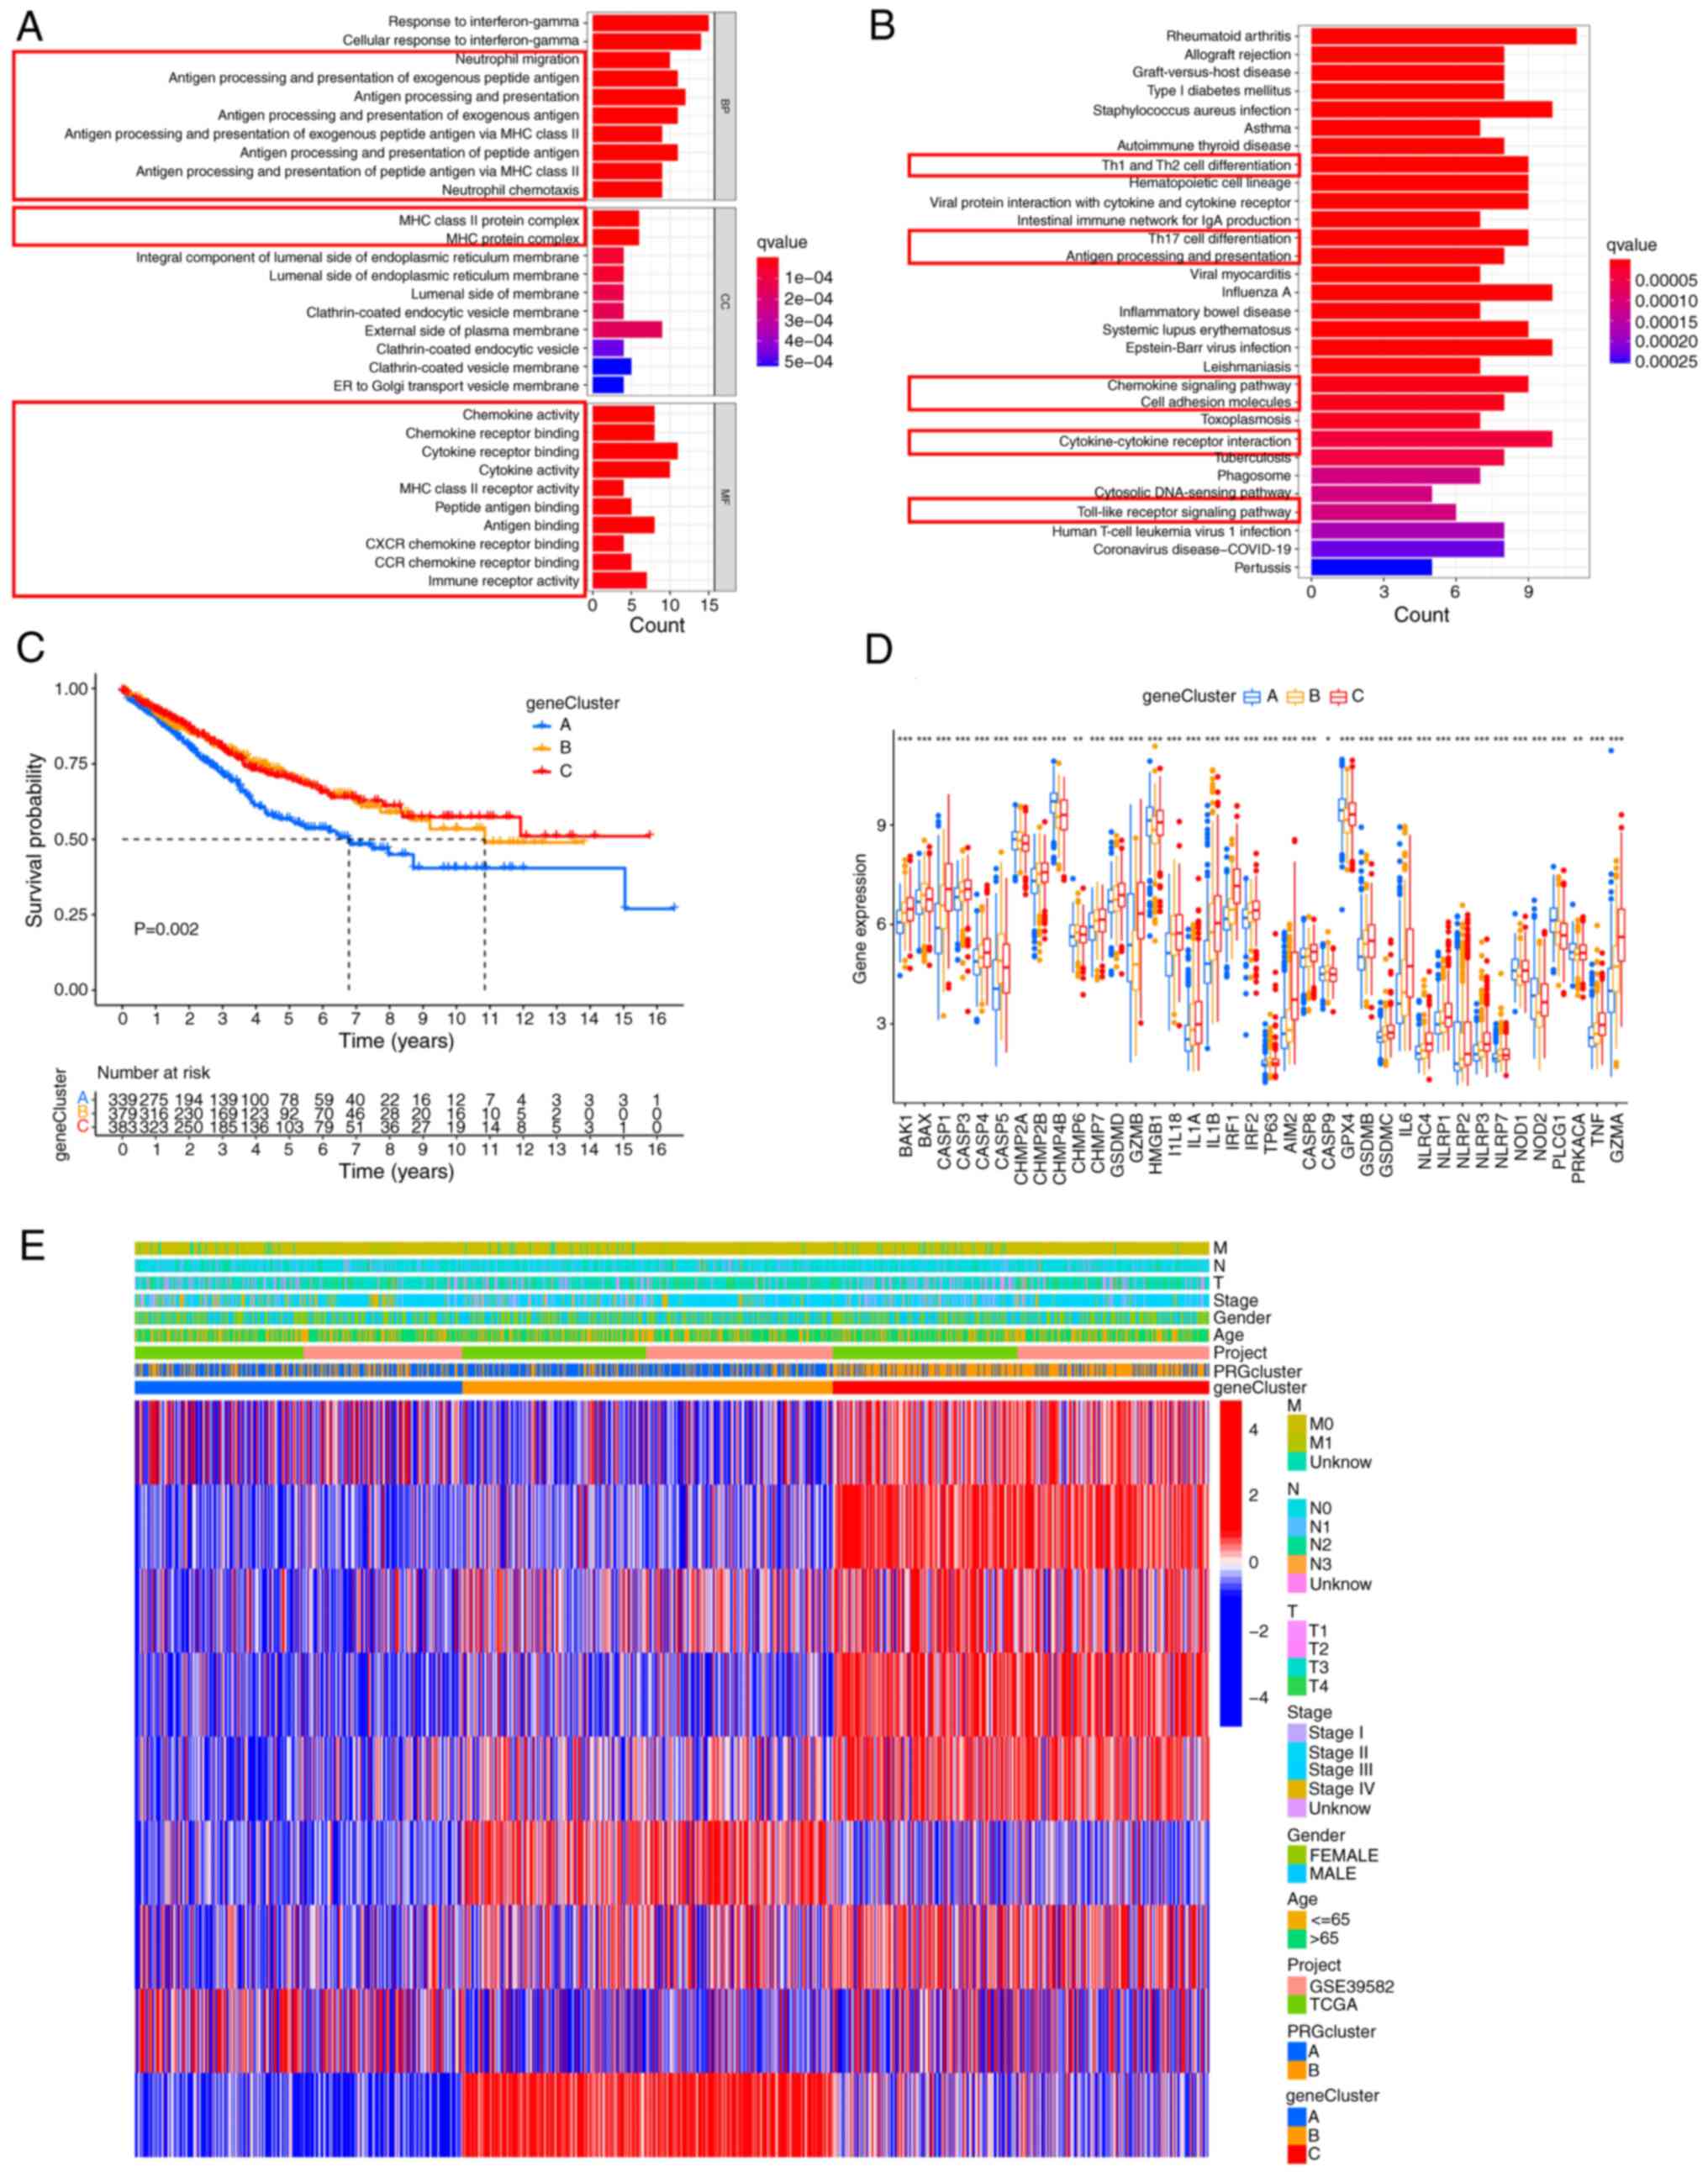
function of these DEGs. Both GO and KEGG analyses showed that DEGs
were mainly enriched in immunomodulation-associated pathways
(Fig. 4A and B). Then, univariate
Cox analysis was performed and 9 DEGs (P<0.01) with significant
effects on survival were identified (Table SIX). A consensus clustering
analysis was performed and patients were divided into three gene
clusters (clusters A-C) to investigate the specific prognostic
value of the 9 DEGs (Fig. S3). It
was found that patients in cluster A had the shortest OS (Fig. 4C). The expression of most PRGs was
significantly different in the three gene clusters (Fig. 4D). The relationship between the
three gene clusters and clinicopathologic features is shown in
Fig. 4E.
Construction and validation of the PRG
score
LASSO and multivariate Cox analysis were conducted
for the 9 pyroptosis cluster-associated prognostic DEGs to
construct an optimal PRG score. In total, 5 DEGs, including GZMB,
CASP1, LINC00261, MMP3 and CKMT2, were used (Fig. S4). These 5 genes were not only
statistically significant, but also contributed the most in the
model, which may more accurately reflect the survival risk of the
patients. The reason why 9 genes were not used is that reducing the
number of genes can reduce the complexity of the model, avoid
overfitting and making the model more powerful in predicting new
data. Additionally, 5 genes may mean that the model is easier to
understand and apply, which is convenient for practical operation
in clinical practice. The formula used for constructing the PRGs
score was as follows: Risk score=(expression of GZMB × −0.0990) +
(expression of CASP1 × −0.1354) + (expression of LINC00261 ×
−0.2266) + (expression of MMP3 × −0.0849) + (expression of CKMT2 ×
−0.1529). The distribution of patients with CRC in the two
pyroptosis clusters, three gene clusters and two PRG score groups
is shown in Fig. 5A. It was found
that there were significant differences in the PRG scores between
the different PRG clusters and gene clusters. Consistent with the
results of the survival analysis, the PRG risk scores of PRG
cluster A and gene cluster A were the highest (Fig. 5B and C), suggesting that patients in
these clusters had a higher risk of death (Fig. 5D). Furthermore, Kaplan-Meier
analysis of the training cohort also confirmed that patients with
high PRG risk scores had a worse prognosis (Fig. 5D), and the area under the curve
(AUCs) for 1-, 3- and 5-year OS were 0.680, 0.721, and 0.698,
respectively (Fig. 5E), which
indicates that the model has good prediction performance. A risk
plot of the PRG score was also generated. With an increase in PRG
risk score, the OS of patients with CRC decreased and mortality
increased (Fig. 5F). The same
method was used to calculate the PRG risk score of the entire
cohort (Fig. S5A-C) and the test
cohort (Fig. S5D and E) to verify
the robustness of the PRG risk score. Based on the median score of
the training cohort, patients in the test cohort and the entire
cohort were assigned to the high-risk and low-risk subgroups.
Similar results were obtained in the training group, with good AUC
values (Fig. S5B and E). These
findings indicate that the PRG risk score has a great prognostic
value for patients with CRC.
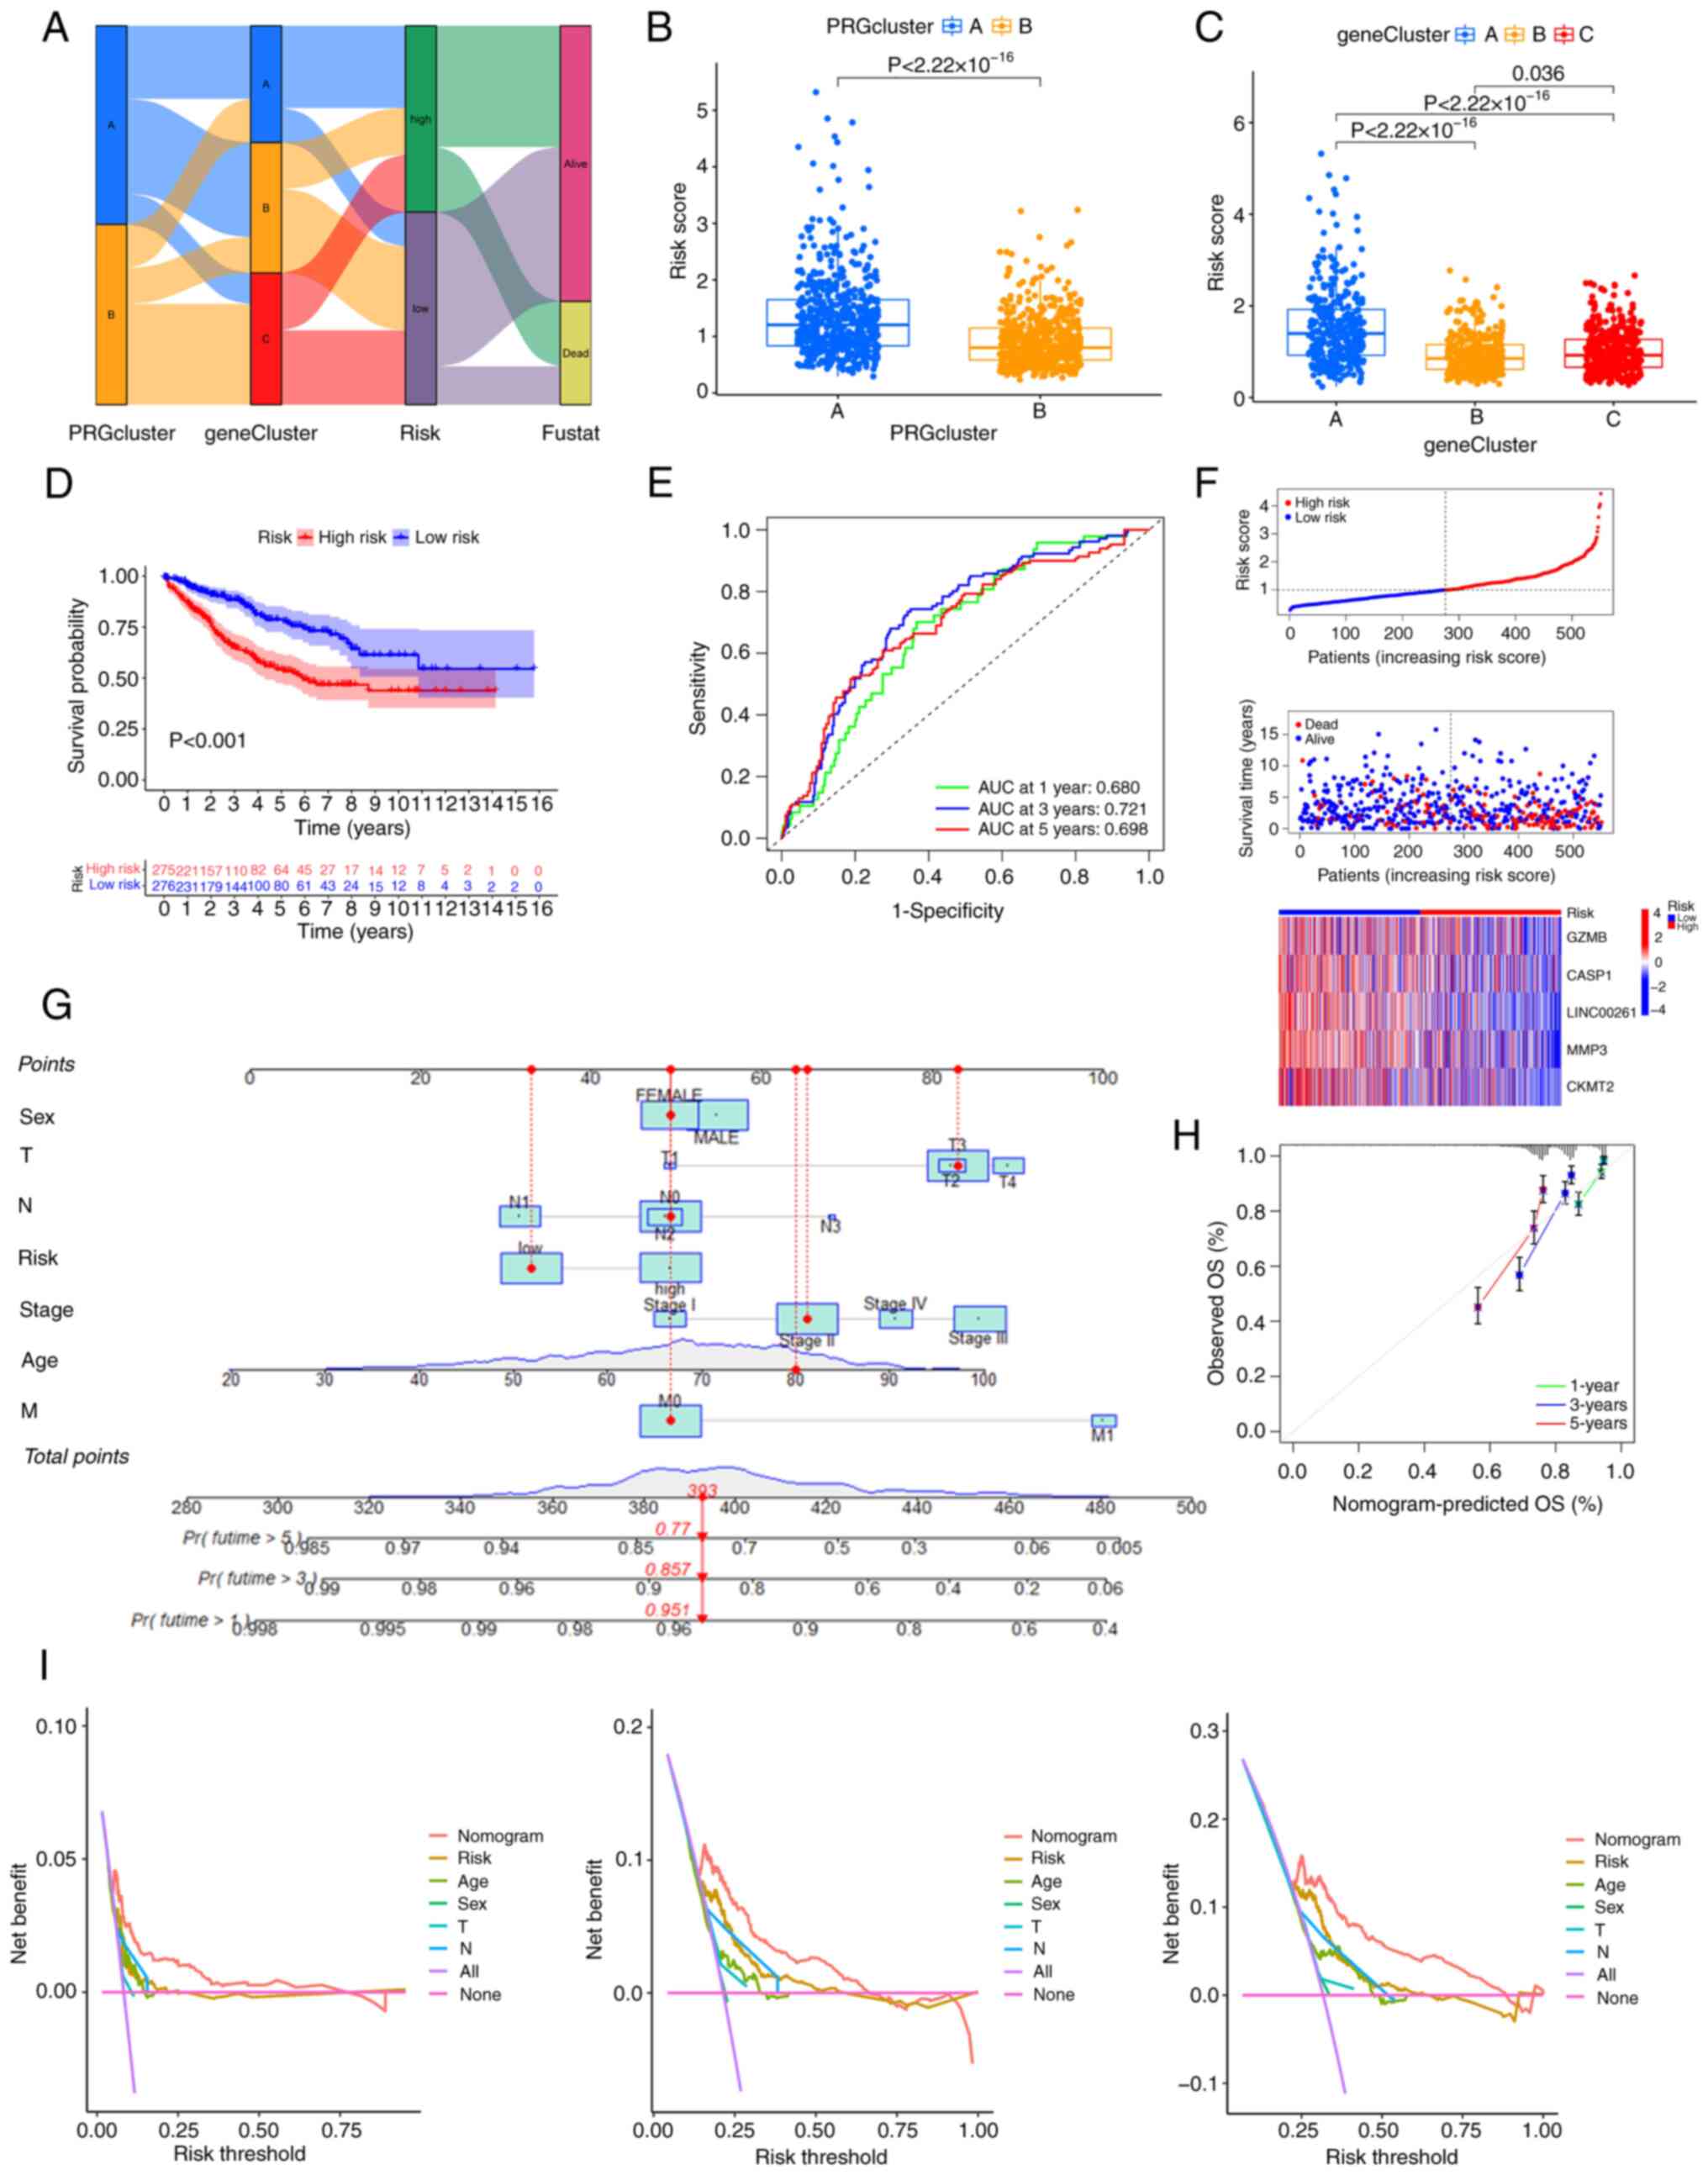 | Figure 5.Generation of the PRG risk score and
further validation. (A) The relationship between the two pyroptosis
clusters, three gene clusters and the two PRG risk score groups.
(B) PRG risk scores of PRG clusters A and B, as well as (C) gene
clusters A, B and C. (D) Kaplan-Meier analysis of the training
cohort. (E) The receiver operating characteristic curves showing
the AUCs of 1–3-, and 5-year OS. (F) Risk plot of the PRG risk
score. (G) A nomogram for predicting the prognosis of patients with
colorectal cancer. (H) The calibration curve of the nomogram. (I)
Decision Curve Analyses to evaluate the clinical value of the
nomogram model. AUC, area under the curve; OS, overall survival;
PRG, pyroptosis-related gene; T, tumor; N, node; M, metastasis. |
Constructing a nomogram for patients
with CRC
As the PRG risk score was closely related to the OS
of patients with CRC, by integrating the PRG risk score and
clinical parameters, a nomogram was constructed to predict the 1-,
3- and 5-year OS of patients with CRC (Fig. 5G). The calibration curve of the
nomogram is shown in Fig. 5H,
implying great accuracy between actual observations and predicted
values. Decision curve analysis indicated that the nomogram curve
was higher than the other curves, suggesting that within the
high-risk threshold range (0 to 1), the prediction results of the
nomogram model may better guide clinical decision-making (Fig. 5I).
Relationship between PRG risk score
and the TME
The most important components of the TME are stromal
cells and immune cells, and the immune score calculated using the
ESTIMATE algorithm is an important index to assess the TME
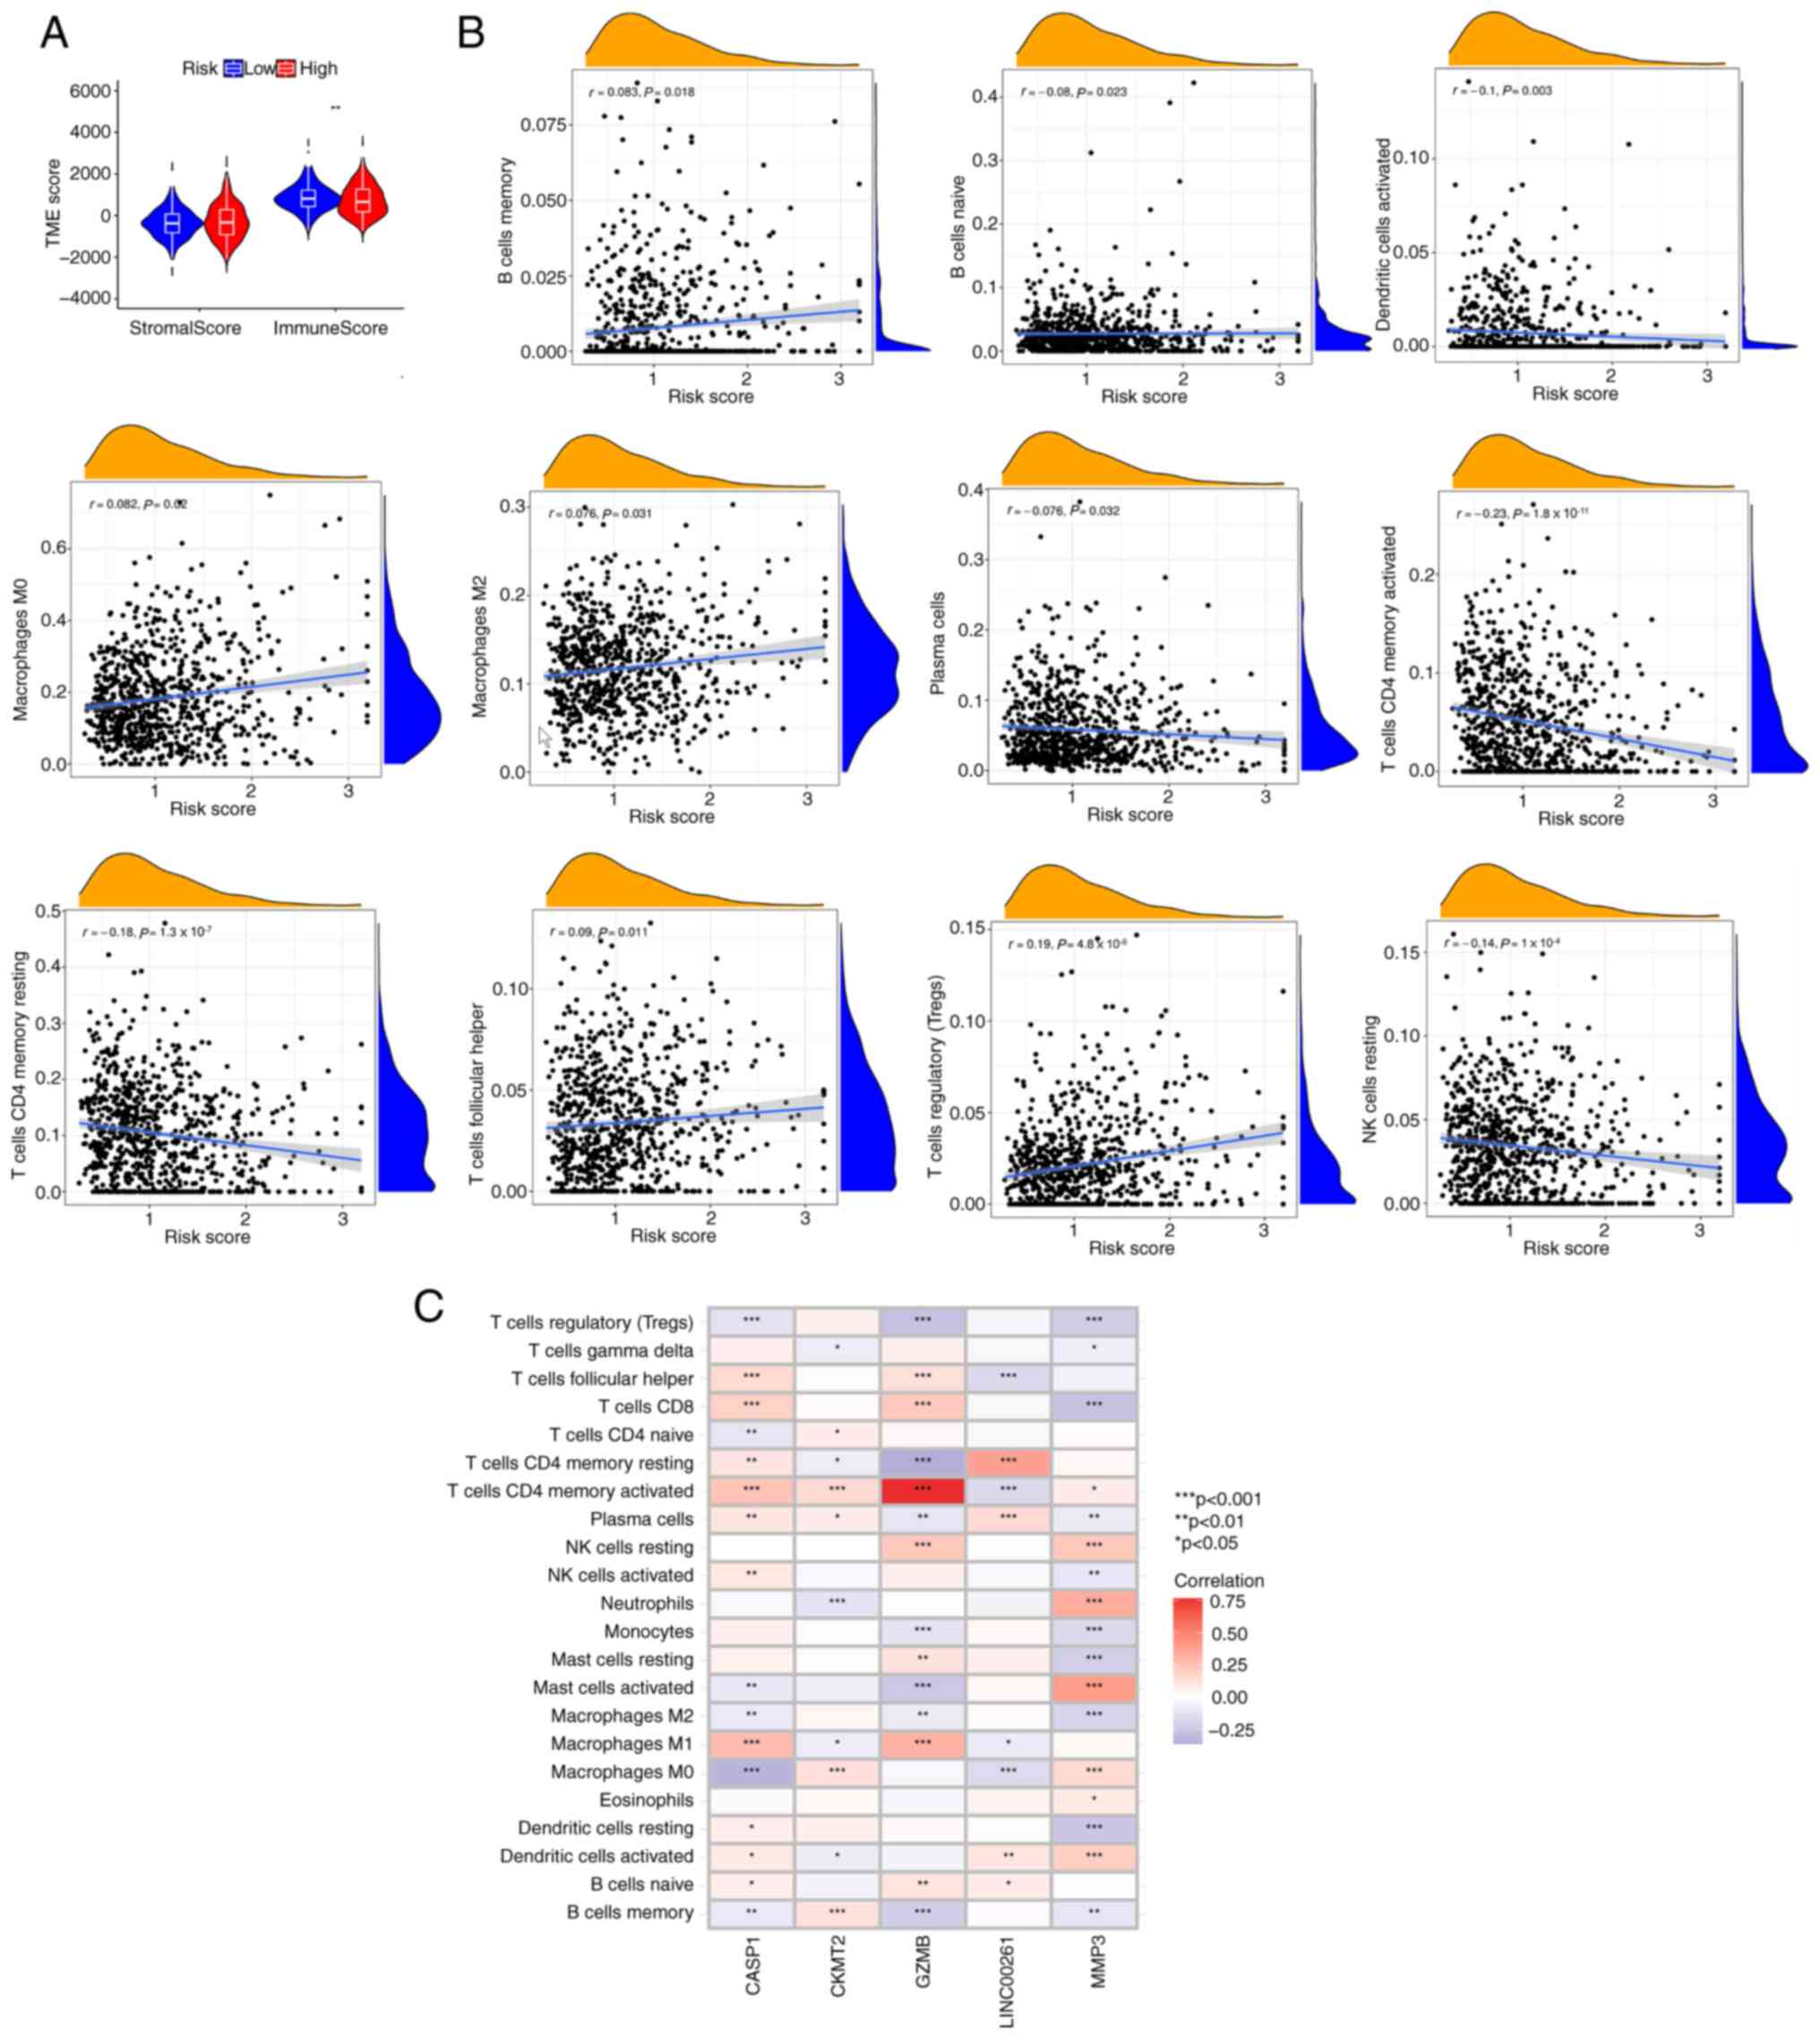
(29,30). The correlation between the PRG risk
score and the immune score was analyzed. It was noted that the PRG
risk score was inversely associated with the immune score (Fig. 6A), suggesting that the PRG risk
score could be used to evaluate the abundance of immune cells in
the TME of CRC. In addition, it was demonstrated that the PRG risk
score was positively correlated with the abundance of M0
macrophages Tregs, M2 macrophages, memory B cells and follicular
helper T cells, whereas it was negatively correlated with the
abundance of naive B cells, activated dendritic cells, resting
natural killer cells, plasma cells, resting memory CD4+
T cells and activated memory CD4+ T cells (Fig. 6B). This suggests that CRC tumors
with high PRG risk scores may have a tumor immune microenvironment
more prone to immune evasion. The correlation between GZMB, CASP1,
LINC00261, MMP3 and CKMT2 and immune cell infiltration was also
explored. Most immune cells were closely related to the 5 genes
(Fig. 6C). Among these 5 genes, the
expression levels of CASP1, GZMB and MMP3 were significantly
correlated with almost all immune cells, suggesting that they are
most critical in CRC immune cell infiltration. In particular, GZMB
showed a strong positive correlation with the activated memory
CD4+ T cells.
Relationship between the PRG risk
score and MSI
A number of studies have demonstrated that MSI is
associated with the efficacy of immune checkpoint inhibitors.
Patients with MSI-high can benefit from immune checkpoint
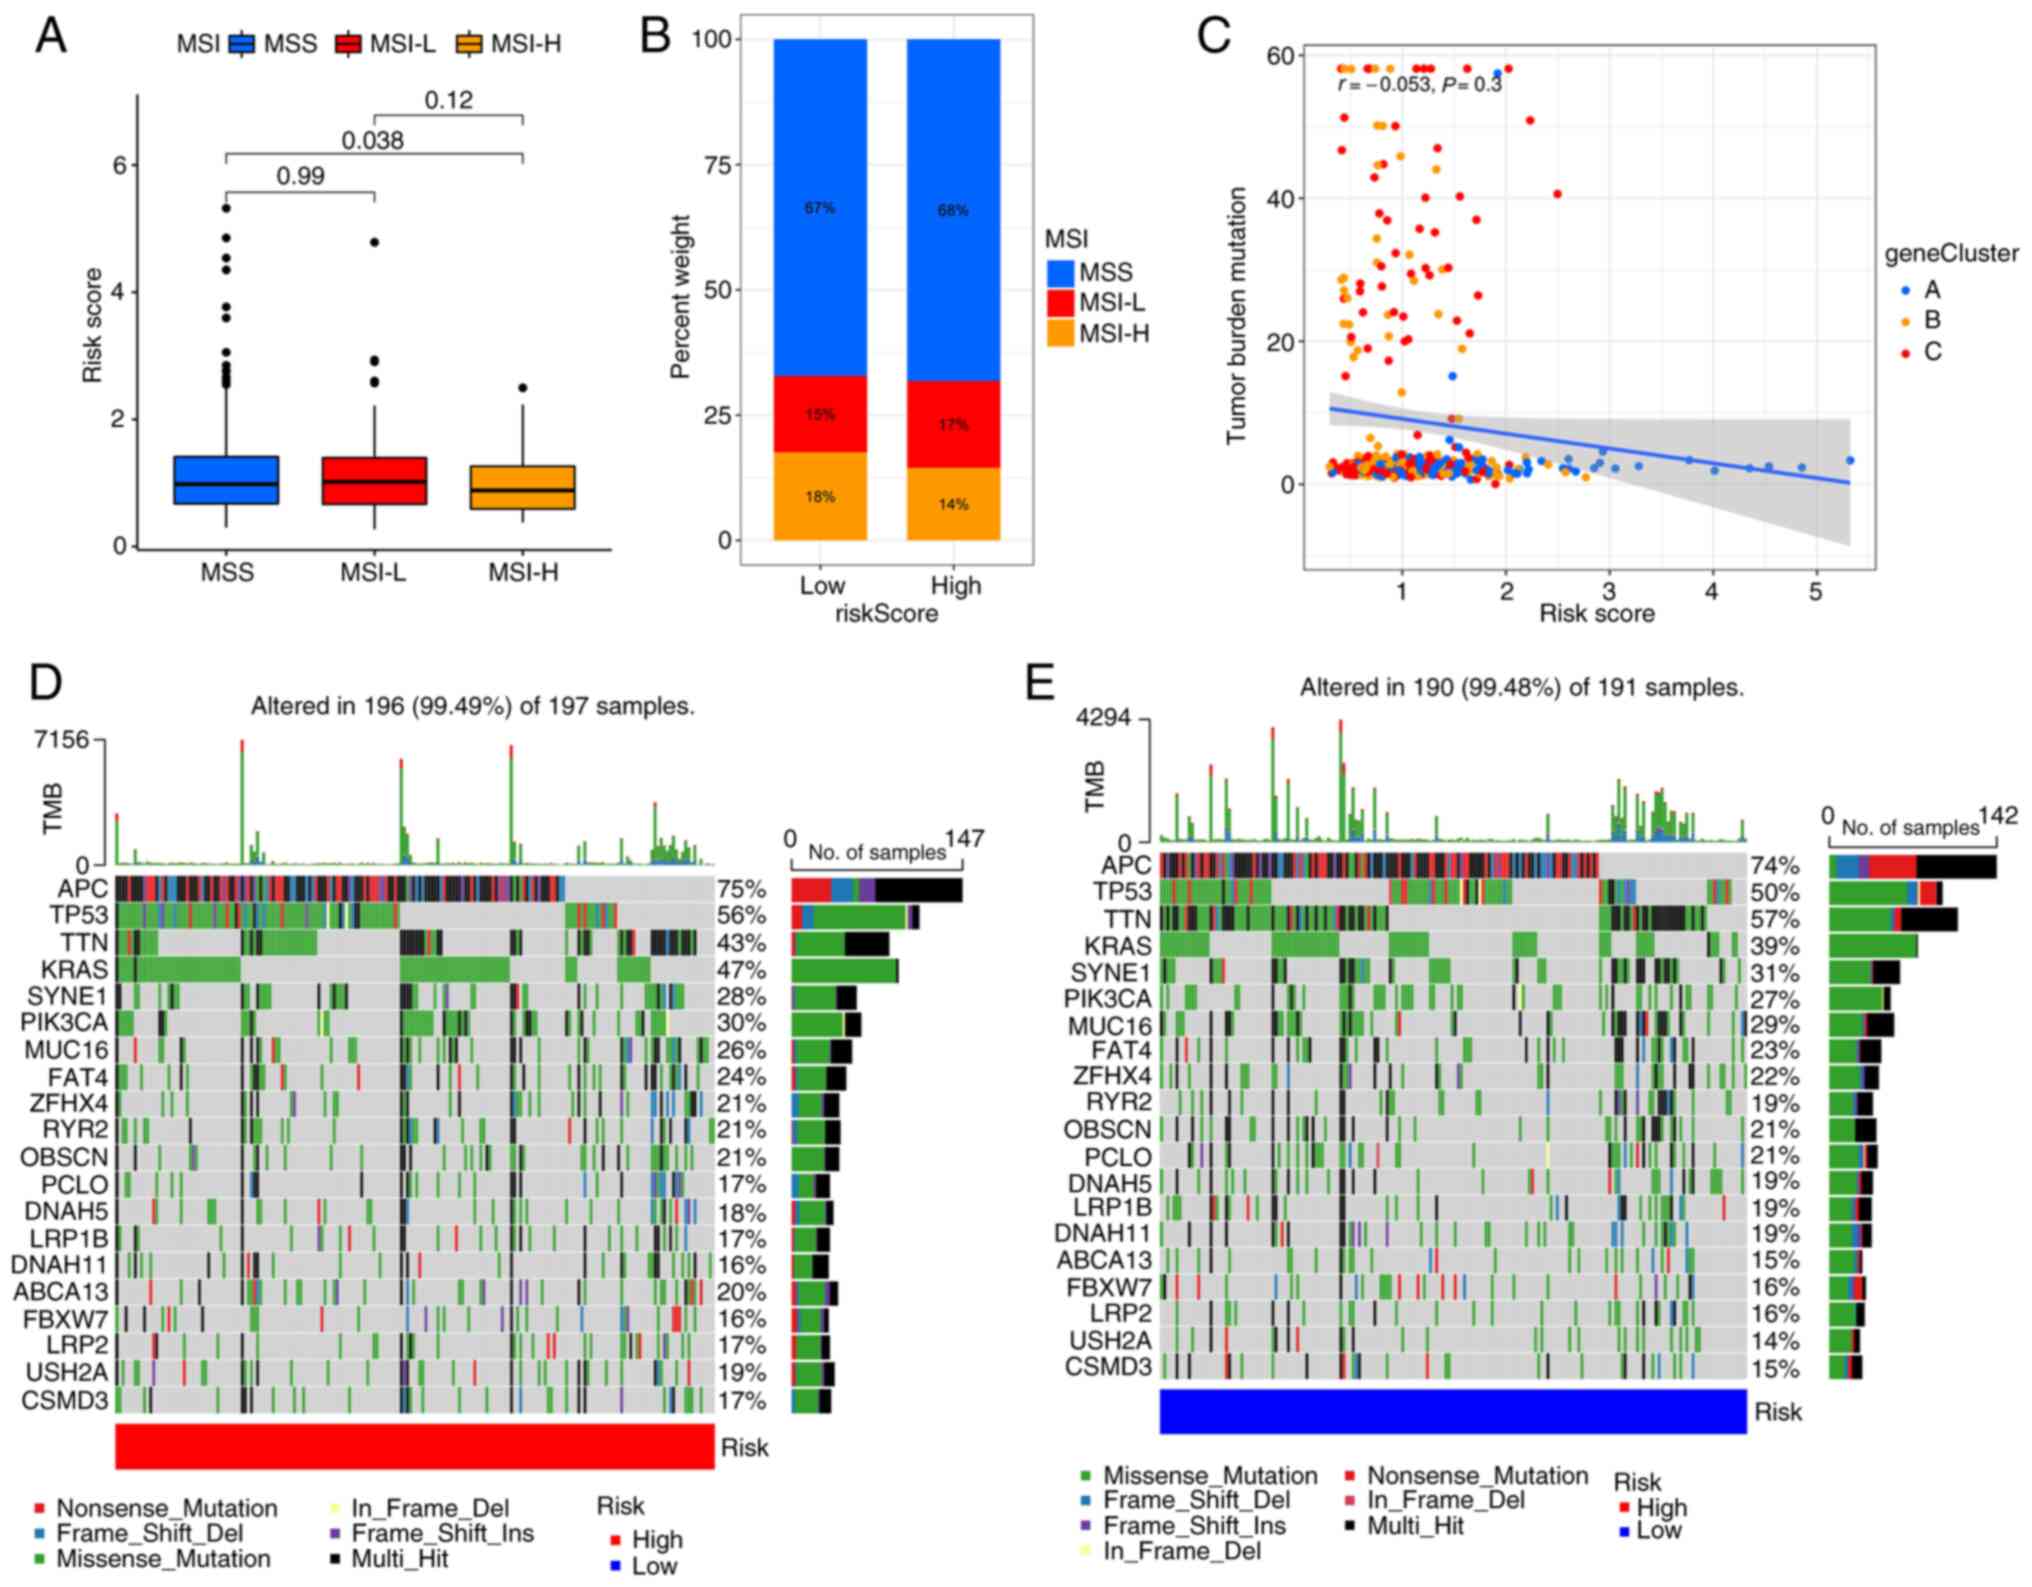
inhibitors (31–34). The results suggest that patients
with high PRG risk scores are more likely to have microsatellite
stability (Fig. 7A and B). These
findings indicate that patients with low PRG risk scores are more
likely to benefit from immune checkpoint inhibitors. Consistent
with the results of the MSI analysis, correlation analysis
indicated that the PRG risk score is negatively associated with
tumor mutation burden (Fig. 7C),
although the P-value was not statistically significant. The somatic
mutation distribution of different patterns of PRG risk scores in
TCGA dataset were also investigated. The results showed that APC,
TP53, KRAS and PIK3CA mutations were more common in the high PRG
risk score subgroup (Fig. 7D and
E). Previous studies (35–37)
have shown that these 4 genes are the key genes in the development
of CRC.
Drug sensitivity analysis
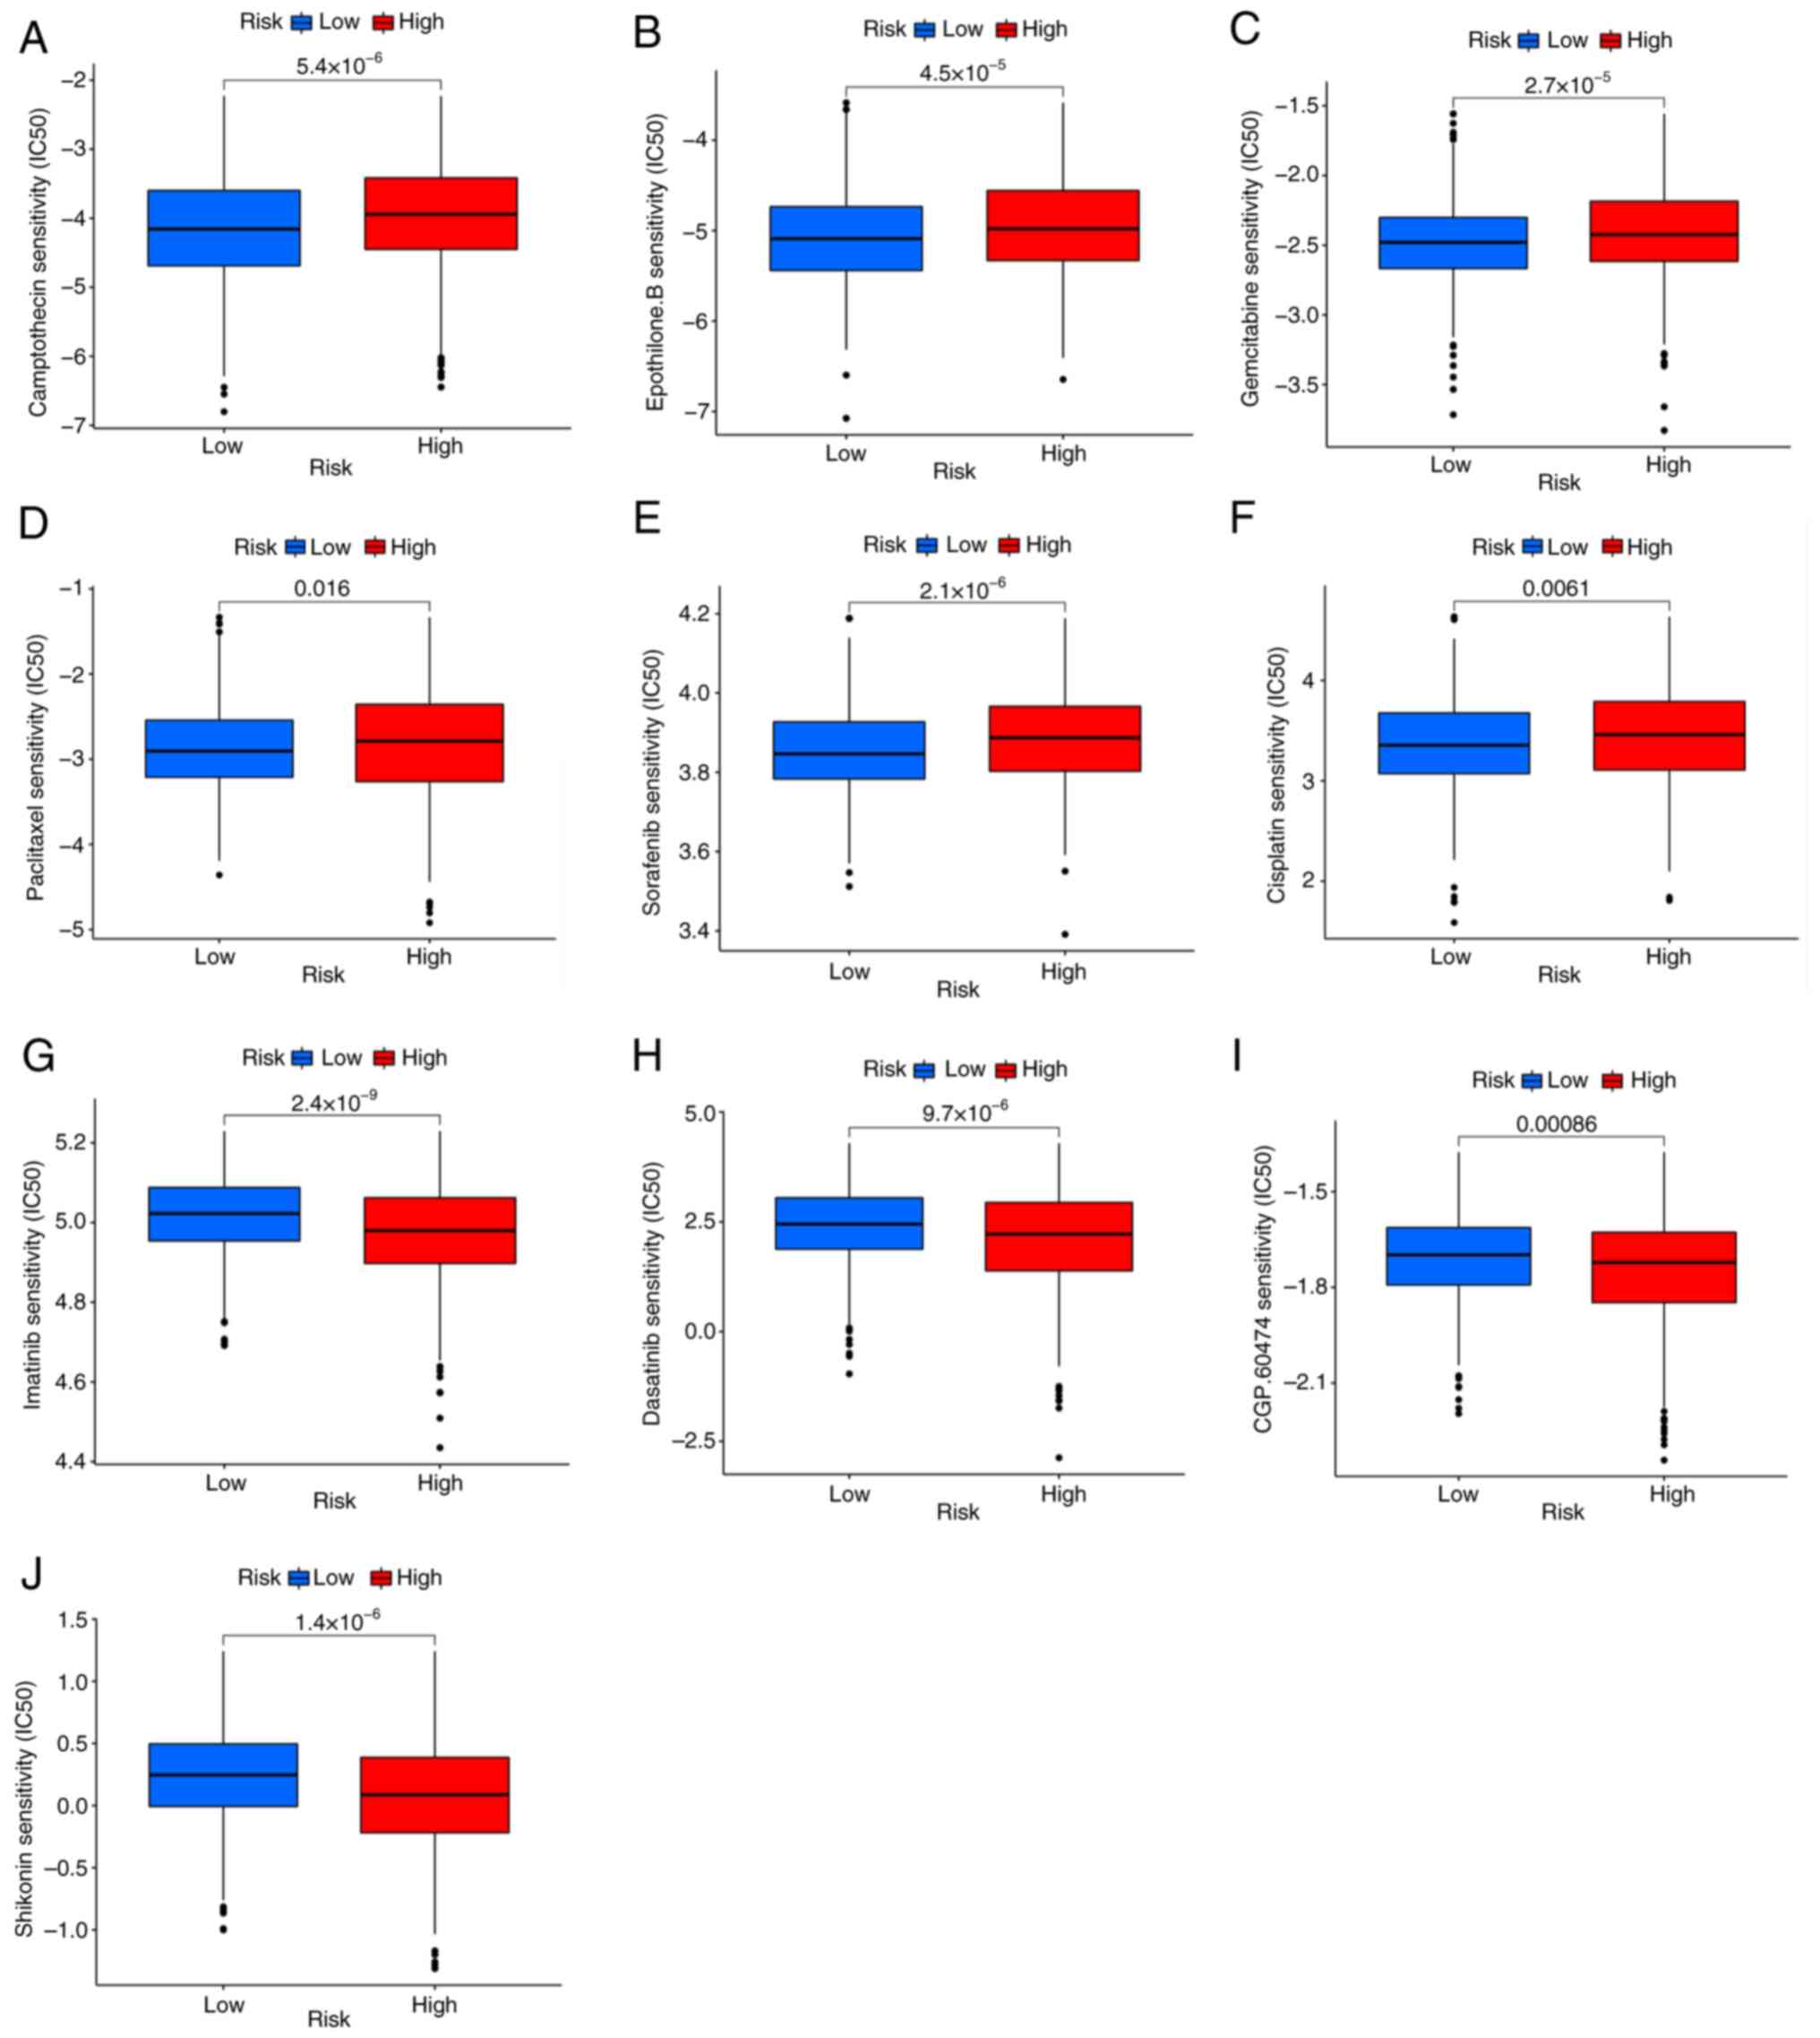
The IC50 values of 138 antitumor drugs in TCGA
database were measured to determine whether the PRG risk score
could predict the response to antitumor drugs. It was found that
patients with low PRG risk scores were sensitive to cisplatin,
paclitaxel, gemcitabine, sorafenib, camptothecin and Epothilone.B.
(Fig. 8A-F), while patients with
high PRG risk scores were sensitive to imatinib, dasatinib,
shikonin and CGP.60474 (VEGFR-2 inhibitor) (Fig. 8G-J).
Discussion
Pyroptosis is an important type of cancer cell death
(31). Different from apoptosis and
autophagy, pyroptosis is often followed by strong immune and
inflammatory responses, implying that PRGs may markedly modulate
the tumor immune microenvironment (6,23). A
previous study reported that pyroptosis has a complex effect on
cancer, which varies in different tissues and genetic backgrounds
(38). In liver cancer, 17
β-estradiol was found to have antitumor effects by activating the
NLRP3 inflammasome and pyroptosis (39). In gastric cancer, a previous study
showed that PRGs can regulate tumor-related signaling pathways and
modulate the TME (40). Tang et
al (16) reported that
pyroptosis plays a pivotal role in tumor cell growth and metastasis
in CRC. Miguchi et al (40)
found that TGFBR2 can upregulate GSDME expression, which
contributes to tumor cell proliferation and tumorigenesis.
Therefore, accumulative evidence has demonstrated that the
expression levels of PRGs significantly affect cancer progression.
However, the biological function of most PRGs in CRC is still
unknown. Therefore, it is necessary to clarify the
mutation/expression profiles and functional characteristics of PRGs
in CRC.
In the present study, the transcriptional
alterations and expression patterns of 52 PRGs in CRC were examined
using data from TCGA and GEO datasets. Although a certain
correlation between the mutational intensity and expression level
was not found, most PRGs were abnormally expressed in patients with
CRC and GZMB, CYCS, CASP3, CASP1, CASP6, IRF1 and NLRP1 were
related to prognosis. Using the unsupervised clustering method,
patients with CRC were divided into two clusters (clusters A and
B). A significant difference was observed in the clinical outcome,
immune cell infiltration and cell signaling pathways between the
two clusters. Based on the DEGs of PRG clusters A and B, three gene
clusters (gene clusters A, B, and C) with different clinical
features were obtained. Furthermore, the PRG risk score was
generated to differentiate between pyroptosis subgroups. Both
cluster A and gene cluster A, with the highest PRG risk score, had
the poorest clinical outcome, suggesting that a high PRG risk score
may indicate a poor prognosis in CRC. The findings of the present
study also confirmed that the PRG risk score was closely linked to
the clinicopathological features of CRC. The predictive value of
the PRG risk score was validated by ROC for 1-, 3- and 5-year OS. A
nomogram to estimate the 1-, 3- and 5-year OS of patients with CRC
was also established by integrating the PRG risk score and clinical
parameters. The calibration curve showed that this nomogram had
great accuracy.
Similar to the findings of the present study, a
recent study has indicated that pyroptosis can lead to cell
rupture, proinflammatory cytokine release and immune cell
infiltration (41). In the present
study, cluster B was a population with upregulated PRGs and a more
favorable survival. According to the results of the GSVA, cluster B
was enriched in signaling pathways involved in inflammation and
immune response, such as natural killer cell-mediated cytotoxicity,
nod-like receptor signaling pathway, T cell receptor signaling
pathway and chemokine signaling pathway. Consistently, the
abundance of almost all immune cells was significantly increased in
cluster B, indicating that upregulation of PRGs can activate
inflammatory signaling pathways and promote immune cell
infiltration. GO and KEGG analyses of gene cluster-related DEGs
reported similar results. The relationship between the PRG risk
score and the immune score was also analyzed to elucidate the
correlation between pyroptosis and the immune response and it was
observed that patients with CRC and low PRG risk scores had higher
immune scores. Since genes related to PRG risk score were all
favorable factors, a low PRG risk score predicted high PRG
expression. The correlation between the PRG risk score and the
tissue infiltration of each type of immune cell was also analyzed.
It was found that a high PRG risk score was positively associated
with the abundance of follicular helper T cells, M0 macrophages, M2
macrophages, memory B cells and Tregs. M2 macrophages are a type of
anti-inflammatory macrophage that primarily inhibit immune
responses by secreting anti-inflammatory factors. In the TME, M2
macrophages can promote tumor growth and angiogenesis while
suppressing antitumor immune responses (42). Tregs are a type of T cell with
immunosuppressive functions, primarily maintaining immune balance
by inhibiting the function of other immune cells. In the TME, Tregs
can suppress antitumor immune responses, thereby promoting tumor
growth (43). A previous study has
reported that a high abundance of Tregs can inhibit the antitumor
immune response, leading to a worse prognosis (44). These findings are consistent with
the findings of the present study and explain why high PRG risk
scores are associated with poor clinical outcomes. Pyroptosis is
closely correlated with immune cell infiltration and the PRG risk
score may predict the tumor immune microenvironment in CRC.
Antitumor drug resistance is a major cause of
progression and mortality in patients with CRC (45,46).
Current antineoplastic drugs have limited efficacy; therefore,
identifying patients who are sensitive to antitumor drugs can
improve the efficacy of treatment and reduce resistance. In the
present study, by integrating the PRG risk score with drug-related
data from the GDSC database, it was found that patients with low
PRG risk scores had an improved response to cisplatin, paclitaxel,
gemcitabine, sorafenib, camptothecin and Epothilone.B. By contrast,
patients with a high PRG risk score may have an improved response
to imatinib, dasatinib, shikonin and CGP.60474 (a VEGFR-2
inhibitor).
There have been studies that have reported
pyroptosis-related prognostic models for CRC; however, only one
model also included the MMP3 gene, while the other genes were
different or similar. These previous studies generally have
limitations such as a small sample size, few included genes and no
experimental validation (47–49).
The present study solves the aforementioned limitations and
provides a more accurate prognostic model for CRC treatment.
However, the present study had some limitations. First, the present
study employed retrospective data from public databases and the
accuracy of the results needs to be verified by prospective
studies. Second, further experiments are needed to explore the
relationship between the PRG risk score and immune cell
infiltration in CRC. Third, application of the PRG risk score has
certain limitations. CRC has a high degree of heterogeneity and
there may be significant differences in gene expression patterns
between different individuals, which may lead to large differences
in the performance of the model in different patients. The changes
in gene expression levels over time are very dynamic, and a single
detection may not capture these dynamic changes, which can affect
the accuracy of model predictions. Different genetic testing
platforms and technologies may produce different results. For
instance, there may be differences in the results of RNA-sequencing
and microarray chips, which can affect the consistency and
reproducibility of the model. Additionally, the relatively high
cost of genetic testing may limit its widespread application in
resource-limited areas. In terms of potential clinical application
value, the PRG risk score can help doctors to identify high-risk
patients and develop personalized treatment plans. Based on the
correlation between the PRG risk score and the tumor immune
microenvironment, the state of the tumor immune microenvironment
could also be preliminarily determined by the PRG risk score to
guide the decision-making in immunotherapy. In addition, the PRG
risk score can also be used for disease monitoring, regularly
monitoring the changes in the expression of pyroptosis genes, so as
to understand the progress of the disease in a timely manner and
provide a basis for adjusting the treatment plan.
In conclusion, the mutation and expression
characteristics of PRGs in CRC were analyzed and a prognostic PRG
signature was constructed. This signature may help estimate the
immune cell infiltration and therapeutic response in CRC. Thus,
this signature may advance the treatment and prognosis evaluation
of CRC.
Supplementary Material
Supporting Data
Supporting Data
Supporting Data
Supporting Data
Supporting Data
Supporting Data
Supporting Data
Supporting Data
Supporting Data
Supporting Data
Acknowledgements
Not applicable.
Funding
This study was funded by the Science and Technology Projects
Funding of Zhongshan Science and Technology Bureau (grant no.
2023B1009).
Availability of data and materials
The data generated in the present study may be
requested from the corresponding author.
Authors' contributions
CH and WD contributed to conceptualization, data
analysis, funding acquisition and writing the original draft; YL
and YQ contributed to data analysis; SZ conducted the RT-qPCR
experiment; XJ contributed to conception, design, methodology, and
data curation which involved management activities to annotate
(produce metadata), scrub data and maintain research data
(including software code, where it is necessary for interpreting
the data itself; JX contributed to validation, supervision,
conception and design. CH and WD confirm the authenticity of all
the raw data. All authors read and approved the final version of
the manuscript.
Ethics approval and consent to
participate
The samples used for RT-qPCR were collected from
patients who underwent colorectal cancer surgery at Zhongshan
People's Hospital (Zhongshan, China). The studies involving human
participants were reviewed and approved by the Committee of the
Zhongshan People's Hospital. The participants provided their
written informed consent to participate in this study.
Patient consent for publication
Not applicable.
Competing interests
The authors declare that they have no competing
interests.
Glossary
Abbreviations
Abbreviations:
|
PRG
|
pyroptosis-related gene
|
|
CRC
|
colorectal cancer
|
|
DEGs
|
differentially expressed genes
|
|
TCGA
|
The Cancer Genome Atlas
|
|
ssGSEA
|
single-sample Gene Set Enrichment
Analysis
|
|
GEO
|
Gene Expression Omnibus
|
|
AUC
|
area under the curve
|
|
GO
|
Gene Ontology
|
|
OS
|
overall survival
|
|
TME
|
tumor microenvironment
|
|
ROC
|
receiver operating characteristic
|
|
GSVA
|
Gene Set Variation Analysis
|
|
KEGG
|
Kyoto Encyclopedia of Genes and
Genomes
|
References
|
1
|
Siegel RL, Miller KD, Fuchs HE and Jemal
A: Cancer statistics, 2021. CA Cancer J Clin. 71:7–33. 2021.
View Article : Google Scholar : PubMed/NCBI
|
|
2
|
Wang L, Lo CH, He X, Hang D, Wang M, Wu K,
Chan AT, Ogino S, Giovannucci EL and Song M: Risk factor profiles
differ for cancers of different regions of the colorectum.
Gastroenterology. 159:241–256.e13. 2020. View Article : Google Scholar : PubMed/NCBI
|
|
3
|
Cree IA, Indave Ruiz BI, Zavadil J, McKay
J, Olivier M, Kozlakidis Z, Lazar AJ, Hyde C, Holdenrieder S,
Hastings R, et al: The international collaboration for cancer
classification and research. Int J Cancer. 148:560–571. 2021.
View Article : Google Scholar : PubMed/NCBI
|
|
4
|
Beck DE: Surgical management of colon and
rectal cancer. Ochsner J. 4:156–162. 2002.PubMed/NCBI
|
|
5
|
Cremolini C, Loupakis F, Antoniotti C,
Lupi C, Sensi E, Lonardi S, Mezi S, Tomasello G, Ronzoni M,
Zaniboni A, et al: FOLFOXIRI plus bevacizumab versus FOLFIRI plus
bevacizumab as first-line treatment of patients with metastatic
colorectal cancer: Updated overall survival and molecular subgroup
analyses of the open-label, phase 3 TRIBE study. Lancet Oncol.
16:1306–1315. 2015. View Article : Google Scholar : PubMed/NCBI
|
|
6
|
Kastrinos F, Kupfer SS and Gupta S:
Colorectal cancer risk assessment and precision approaches to
screening: Brave new world or worlds apart? Gastroenterology.
164:812–827. 2023. View Article : Google Scholar : PubMed/NCBI
|
|
7
|
Sadahiro S, Suzuki T, Ishikawa K, Nakamura
T, Tanaka Y, Masuda T, Mukoyama S, Yasuda S, Tajima T, Makuuchi H
and Murayama C: Recurrence patterns after curative resection of
colorectal cancer in patients followed for a minimum of ten years.
Hepatogastroenterology. 50:1362–1366. 2003.PubMed/NCBI
|
|
8
|
Fakih GM: Metastatic colorectal cancer:
Current state and future directions. J Clin Oncol. 33:1809–1824.
2015. View Article : Google Scholar : PubMed/NCBI
|
|
9
|
Sepulveda AR, Hamilton SR, Allegra CJ,
Grody W, Cushman-Vokoun AM, Funkhouser WK, Kopetz SE, Lieu C,
Lindor NM, Minsky BD, et al: Molecular biomarkers for the
evaluation of colorectal cancer: Guideline from the American
society for clinical pathology, college of American pathologists,
association for molecular pathology, and American society of
clinical oncology. J Mol Diagn. 19:187–225. 2017. View Article : Google Scholar : PubMed/NCBI
|
|
10
|
Wang Y, Gao W, Shi X, Ding J, Liu W, He H,
Wang K and Shao F: Chemotherapy drugs induce pyroptosis through
caspase-3 cleavage of a gasdermin. Nature. 547:99–103. 2017.
View Article : Google Scholar : PubMed/NCBI
|
|
11
|
Fink SL and Cookson BT:
Caspase-1-dependent pore formation during pyroptosis leads to
osmotic lysis of infected host macrophages. Cell Microbiol.
8:1812–1825. 2006. View Article : Google Scholar : PubMed/NCBI
|
|
12
|
Ding J, Wang K, Liu W, She Y, Sun Q, Shi
J, Sun H, Wang DC and Shao F: Pore-forming activity and structural
autoinhibition of the gasdermin family. Nature. 535:111–116. 2016.
View Article : Google Scholar : PubMed/NCBI
|
|
13
|
Shi J, Zhao Y, Wang K, Shi X, Wang Y,
Huang H, Zhuang Y, Cai T, Wang F and Shao F: Cleavage of GSDMD by
inflammatory caspases determines pyroptotic cell death. Nature.
526:660–665. 2015. View Article : Google Scholar : PubMed/NCBI
|
|
14
|
Al Mamun A, Mimi AA, Aziz MA, Zaeem M,
Ahmed T, Munir F and Xiao J: Role of pyroptosis in cancer and its
therapeutic regulation. Eur J Pharmacol. 910:1744442021. View Article : Google Scholar : PubMed/NCBI
|
|
15
|
Tan G, Huang C, Chen J and Zhi F: HMGB1
released from GSDME-mediated pyroptotic epithelial cells
participates in the tumorigenesis of colitis-associated colorectal
cancer through the ERK1/2 pathway. J Hematol Oncol. 13:1492020.
View Article : Google Scholar : PubMed/NCBI
|
|
16
|
Tang Z, Ji L, Han M, Xie J, Zhong F, Zhang
X, Su Q, Yang Z, Liu Z, Gao H and Jiang G: Pyroptosis is involved
in the inhibitory effect of FL118 on growth and metastasis in
colorectal cancer. Life Sci. 257:1180652020. View Article : Google Scholar : PubMed/NCBI
|
|
17
|
Guo J, Zheng J, Mu M, Chen Z, Xu Z, Zhao
C, Yang K, Qin X, Sun X and Yu J: GW4064 enhances the
chemosensitivity of colorectal cancer to oxaliplatin by inducing
pyroptosis. Biochem Biophys Res Commun. 548:60–66. 2021. View Article : Google Scholar : PubMed/NCBI
|
|
18
|
Wang Z, Jensen MA and Zenklusen JC: A
practical guide to the cancer genome atlas (TCGA). Methods Mol
Biol. 1418:111–141. 2016. View Article : Google Scholar : PubMed/NCBI
|
|
19
|
Marisa L, de Reyniès A, Duval A, Selves J,
Gaub MP, Vescovo L, Etienne-Grimaldi MC, Schiappa R, Guenot D,
Ayadi M, et al: Gene expression classification of colon cancer into
molecular subtypes: Characterization, validation, and prognostic
value. PLoS Med. 10:e10014532013. View Article : Google Scholar : PubMed/NCBI
|
|
20
|
Karki R and Kanneganti TD: Diverging
inflammasome signals in tumorigenesis and potential targeting. Nat
Rev Cancer. 19:197–214. 2019. View Article : Google Scholar : PubMed/NCBI
|
|
21
|
Wang B and Yin Q: AIM2 inflammasome
activation and regulation: A structural perspective. J Struct Biol.
200:279–282. 2017. View Article : Google Scholar : PubMed/NCBI
|
|
22
|
Man SM and Kanneganti TD: Regulation of
inflammasome activation. Immunol Rev. 265:6–21. 2015. View Article : Google Scholar : PubMed/NCBI
|
|
23
|
Hartigan JA and Wong MA: Algorithm AS 136:
A K-means clustering algorithm. J R Stat Soc C (Appl Stat).
28:100–108. 1979.
|
|
24
|
Wilkerson MD and Hayes DN:
ConsensusClusterPlus: A class discovery tool with confidence
assessments and item tracking. Bioinformatics. 26:1572–1573. 2010.
View Article : Google Scholar : PubMed/NCBI
|
|
25
|
Yao H, Wu H and Liu Y: Improvement of
prognostic and predictive network of colorectal cancer based upon
the 8th edition of AJCC colorectal cancer staging system. Zhonghua
Wei Chang Wai Ke Za Zhi. 20:24–27. 2017.(In Chinese). PubMed/NCBI
|
|
26
|
Livak KJ and Schmittgen TD: Analysis of
relative gene expression data using real-time quantitative PCR and
the 2(−Delta Delta C(T)) method. Methods. 25:402–408. 2001.
View Article : Google Scholar : PubMed/NCBI
|
|
27
|
Hänzelmann S, Castelo R and Guinney J:
GSVA: Gene set variation analysis for microarray and RNA-seq data.
BMC Bioinformatics. 14:72013. View Article : Google Scholar : PubMed/NCBI
|
|
28
|
Charoentong P, Angelova M, Efremova M,
Gallasch R, Hackl H, Galon J and Trajanoski Z: Bioinformatics for
cancer immunology and immunotherapy. Cancer Immunol Immunother.
61:1885–1903. 2012. View Article : Google Scholar : PubMed/NCBI
|
|
29
|
Quail DF and Joyce JA: Microenvironmental
regulation of tumor progression and metastasis. Nat Med.
19:1423–1437. 2013. View Article : Google Scholar : PubMed/NCBI
|
|
30
|
Pitt JM, Marabelle A, Eggermont A, Soria
JC, Kroemer G and Zitvogel L: Targeting the tumor microenvironment:
Removing obstruction to anticancer immune responses and
immunotherapy. Ann Oncol. 27:1482–1492. 2016. View Article : Google Scholar : PubMed/NCBI
|
|
31
|
Cristescu R, Mogg R, Ayers M, Albright A,
Murphy E, Yearley J, Sher X, Liu XQ, Lu H, Nebozhyn M, et al:
Pan-tumor genomic biomarkers for PD-1 checkpoint blockade-based
immunotherapy. Science. 362:eaar35932018. View Article : Google Scholar : PubMed/NCBI
|
|
32
|
Asaoka Y, Ijichi H and Koike K: PD-1
blockade in tumors with mismatch-repair deficiency. N Engl J Med.
373:19792015. View Article : Google Scholar : PubMed/NCBI
|
|
33
|
Overman MJ, McDermott R, Leach JL, Lonardi
S, Lenz HJ, Morse MA, Desai J, Hill A, Axelson M, Moss RA, et al:
Nivolumab in patients with metastatic DNA mismatch repair-deficient
or microsatellite instability-high colorectal cancer (CheckMate
142): An open-label, multicentre, phase 2 study. Lancet Oncol.
18:1182–1191. 2017. View Article : Google Scholar : PubMed/NCBI
|
|
34
|
Chénard-Poirier M and Smyth EC: Immune
checkpoint inhibitors in the treatment of gastroesophageal cancer.
Drugs. 79:1–10. 2019. View Article : Google Scholar : PubMed/NCBI
|
|
35
|
Vogelstein B, Papadopoulos N, Velculescu
VE, Zhou S, Diaz LA Jr and Kinzler KW: Cancer genome landscapes.
Science. 339:1546–1558. 2013. View Article : Google Scholar : PubMed/NCBI
|
|
36
|
Fearon ER and Vogelstein B: A genetic
model for colorectal tumorigenesis. Cell. 61:759–767. 1990.
View Article : Google Scholar : PubMed/NCBI
|
|
37
|
Ewing I, Hurley JJ, Josephides E and
Millar A: The molecular genetics of colorectal cancer. Frontline
Gastroenterol. 5:26–30. 2014. View Article : Google Scholar : PubMed/NCBI
|
|
38
|
Xia X, Wang X, Cheng Z, Qin W, Lei L,
Jiang J and Hu J: The role of pyroptosis in cancer: Pro-cancer or
pro-‘host’? Cell Death Dis. 10:6502019. View Article : Google Scholar : PubMed/NCBI
|
|
39
|
Wei Q, Zhu R, Zhu J, Zhao R and Li M:
E2-induced activation of the NLRP3 inflammasome triggers pyroptosis
and inhibits autophagy in HCC cells. Oncol Res. 27:827–834. 2019.
View Article : Google Scholar : PubMed/NCBI
|
|
40
|
Miguchi M, Hinoi T, Shimomura M, Adachi T,
Saito Y, Niitsu H, Kochi M, Sada H, Sotomaru Y, Ikenoue T, et al:
Gasdermin C is upregulated by inactivation of transforming growth
factor β receptor type II in the presence of mutated Apc, promoting
colorectal cancer proliferation. Plos One. 11:e01664222016.
View Article : Google Scholar : PubMed/NCBI
|
|
41
|
Loveless R, Bloomquist R and Teng Y:
Pyroptosis at the forefront of anticancer immunity. J Exp Clin
Cancer Res. 40:2642021. View Article : Google Scholar : PubMed/NCBI
|
|
42
|
Qian BZ and Pollard JW: Macrophage
diversity enhances tumor progression and metastasis. Cell.
141:39–51. 2010. View Article : Google Scholar : PubMed/NCBI
|
|
43
|
Schlößer HA, Theurich S,
Shimabukuro-Vornhagen A, Holtick U, Stippel DL and von
Bergwelt-Baildon M: Overcoming tumor-mediated immunosuppression.
Immunotherapy. 6:973–988. 2014. View Article : Google Scholar
|
|
44
|
Göschl L, Scheinecker C and Bonelli M:
Treg cells in autoimmunity: From identification to Treg-based
therapies. Semin Immunopathol. 41:301–314. 2019. View Article : Google Scholar : PubMed/NCBI
|
|
45
|
Van der Jeught K, Xu HC, Li YJ, Lu XB and
Ji G: Drug resistance and new therapies in colorectal cancer. World
J Gastroenterol. 24:3834–3848. 2018. View Article : Google Scholar : PubMed/NCBI
|
|
46
|
Wang TL, Diaz LA Jr, Romans K, Bardelli A,
Saha S, Galizia G, Choti M, Donehower R, Parmigiani G, Shih IeM, et
al: Digital karyotyping identifies thymidylate synthase
amplification as a mechanism of resistance to 5-fluorouracil in
metastatic colorectal cancer patients. Proc Natl Acad Sci USA.
101:3089–3094. 2004. View Article : Google Scholar : PubMed/NCBI
|
|
47
|
Zheng C and Tan Z: A novel identified
pyroptosis-related prognostic signature of colorectal cancer. Math
Biosci Eng. 18:8783–8796. 2021. View Article : Google Scholar : PubMed/NCBI
|
|
48
|
Li R, Zhang S and Liu G: Identification
and validation of a pyroptosis-related prognostic model for
colorectal cancer. Funct Integr Genomics. 23:212022. View Article : Google Scholar : PubMed/NCBI
|
|
49
|
Chen M, Zhang J, Lin X, Zhu X and Xie T: A
pyroptosis-related prognosis model to predict survival in
colorectal cancer patients. Int J Clin Exp Pathol. 15:168–182.
2022.PubMed/NCBI
|


