Introduction
Lung cancer ranks has the highest global cancer
incidence and mortality rates (1).
Lung squamous cell carcinoma (LUSC)has an age-standardized
incidence rate of 7.7 per 100,000 in male, accounting for
approximately30% of all non-small cell lung cancer (NSCLC) cases
and is the second most prevalent subtype of NSCLC (2). The diagnosis and therapeutic
intervention for individuals afflicted with pulmonary carcinoma are
of paramount significance. The traditional tumor (T)-node
(N)-metastasis (M) staging system (3) provides current cancer classification
guidelines (4); This
classification, based solely on tumor cell characteristics and
neglecting the patient's immune profile, paradoxically leads to
significant prognostic variability among patients within the same
TNM stage, with some in earlier stages faring worse than those in
later stages (5). Therefore, a
prognostic model that integrates robust biomarkers with the TNM
staging system has the potential to forecast patient prognoses with
greater precision.
Single-cell analysis of cell heterogeneity in
complex systems is a valuable tool. It can be used to define the
global gene expression profile of individual cells, thus
facilitating the analysis of previously unknown genes in cell
populations (6). Joanito et
al (7) reported the role of
epithelial cells in the evaluation of prognosis of patients with
colorectal cancer. Moreover, the contributions of epithelial cells
to cancer treatment were reviewed by Chen et al (8) and Huang et al (9) constructed an EIGs prognostic model for
predicting long-term prognosis in patients with gastric carcinoma.
However, the prognostic value of the ECIG for LUSC remains
unclear.
Therefore, the aim of the present study is to
explore the biological functions of EIGs in LUSC patients and
assess their potential value for prognostic prediction. The present
study constructed an EIGs prognostic model based mainly on
single-cell (sc) mixed bulk RNA sequencing (RNA-seq) and assessed
the prognosis of patients with LUSC using enrichment pathway
analysis, tumor mutation burden (TMB) analysis, tumor
microenvironment differentiation analysis and drug sensitivity
prediction, as well as an evaluation of its scientific value.
Materials and methods
Data sources and disposal
The Gene Expression Omnibus (GEO)
database(ncbi.nlm.nih.gov/geo/) contains scRNA-seq data for two
purified LUSC samples (GSM3304009 and GSM3304010). The Cancer
Genome Atlas (TCGA) (portal.gdc.cancer.gov/) provides bulk RNA-seq
data for patients with LUSC, covering 502 tumor cases and 51 normal
cases (dataset name: TCGA-LUSC). Following the elimination of
cancer patients lacking survival information, a total of 488 cancer
patients were incorporated into the study. In addition, the
GSE37745, GSE73403 and GSE74777 datasets were sourced from the GEO.
These datasets were combined into a single set and adjusted for
batch variations using the ‘ComBat’ function in the ‘sva’ package
(Version: 3.54.0), with all data transformed to log2
values (10).
Identifying epithelial marker genes
using scRNA-seq
The present study used the R packages ‘Seurat’,
‘Singler’ and ‘magrittr’ to analyze scRNA-seq data (11). Raw arrays for each sample were
filtered, excluding genes expressed in fewer than three individual
cells, cells with fewer than 50 genes, and cells with more than 5%
of genes encoded by mitochondria. First, the scRNA-seq dataset was
normalized using the ‘NormalizeData’ property in the Seurat R
bundle, and the statistics were transformed into standardized
scRNA-seq objects. The feature ‘FindVariableFeatures’ was used to
detect the first 1,500 highly variable genes. Second, a principal
component analysis (PCA) was performed. Previously, a JackStraw
evaluation was used to screen for essential PCs), and 20 PC cells
were selected for cluster assessment at P<0.05. The
FindNeighbors property was used to compute the closeness of
clusters, whilst the FindClusters property was used to analyze
mobile clusters. The mobile clusters were subsequently validated
with RunTSNE, and the FindAllMarkers property was used for each
cluster to compute the differentially expressed genes (DEGs), for
which logFoldChange=1 and the expression ratio of the least
differential genes=0.25. Subsequently, each cell cluster was
annotated with the ‘CreateSinglerObject’ property in the ‘Singler’
package. Finally, using the ‘monocle’ package in R, a quasitemporal
analysis was performed (12). Based
on the temporal gene expression of each cell, each cell was
arranged according to a quasitemporal pattern, and this model was
split once into multiple cell groups (states) based on gene
expression status to create an intuitive lineage improvement
tree.
Model construction and validation
Immune-related genes were retrieved from two
comprehensive databases(Immport gene list and InnateDB Innate
Immunity Genes), Immport (https://www.immport.org/home) and InnateDB (https://www.innatedb.ca/). By evaluating the
expression of epithelial marker genes filtered in the preceding
step, 278 EIGs were identified. To further assess the clinical
relevance of these identified EIGs, univariate Cox regression
analysis was performed. Genes exhibiting P<0.05 were deemed
prognostic indicators. The protein interaction community was then
evaluated using the protein-protein interaction network and the
hyper-linkages between the DEGs was consequently determined. To
improve the precision of the predictive gene screening, an
extensive evaluation using both least absolute shrinkage and
selection operator (LASSO) and Cox was performed. This analysis was
executed using the ‘glmnet’ software package, which is tailored for
fitting generalized linear models via penalized maximum likelihood.
The LASSO model was used to evaluate survival according to Cox, and
the ‘cv. glmnet’ capability was subsequently used to verify the
first-class model (13). LASSO and
Cox regression analysis were applied to elucidate genes with
significant prognostic value. The differentially expressed EIGs
coefficients are presented in Table
SI. This technique enabled the systematic analysis of gene
expression and risk factors, ultimately leading to the creation of
predictive models. Patients were stratified into distinct risk
categories using a risk score threshold of 0.91. The basic
information of patients in the test group and the training group
are presented in Table I. To assess
the predictive accuracy of the EIGs, the area under the curve (AUC)
was calculated using the ‘survival ROC’ package. A nomogram for 1-,
3- and 5-year outcomes was developed based on age, sex, tumor stage
and risk model with the ‘RMS’ package. Decision analysis was
performed using the ‘ggDCA’ package. The ‘survminer’ package and
Kaplan-Meier methods were used to perform survival analysis. To
mitigate the impact of confounding factors on survival curves, the
two-stage (TS) test was used to address potential issues of curve
crossover in survival analysis (14). Finally, survival analysis using an
independent dataset sourced from the GEO (accession nos. GSE37745,
GSE73403 and GSE74777; ncbi.nlm.nih.gov/geo) corroborated the
predictive capability of the model regarding survival outcomes.
 | Table I.Patient clinical information for the
test and training groups. |
Table I.
Patient clinical information for the
test and training groups.
| A, Training cohort
(n=245) |
|---|
|
|---|
| Characteristic | n (%) |
|---|
| Age |
|
| <65
years | 90 (36.73) |
| >65
years | 155 (63.27) |
| Status |
|
|
Alive | 136 (66.67) |
|
Dead | 109 (33.33) |
| Sex |
|
|
Female | 56 (22.86) |
|
Male | 189 (77.14) |
| Stage |
|
| I | 124 (50.61) |
| II | 80 (32.65) |
|
III | 34 (13.88) |
| IV | 4 (1.63) |
|
Unknown | 3 (1.22) |
| T stage |
|
| T1 | 50 (20.41) |
| T2 | 155 (63.27) |
| T3 | 31 (12.65) |
| T4 | 9 (3.67) |
| M stage |
|
| M0 | 193 (78.76) |
| M1 | 4 (1.63) |
| MX | 45 (18.37) |
|
Unknown | 3 (1.22) |
| N stage |
|
| N0 | 161 (65.71) |
| N1 | 65 (26.53) |
| N2 | 16 (6.53) |
| N3 | 2 (0.43) |
|
Unknown | 1 (0.22) |
|
| B, Test cohort
(n=244) |
|
|
Characteristic | n (%) |
|
| Age |
|
| <65
years | 99 (40.57) |
| >65
years | 145 (59.43) |
| Status |
|
|
Alive | 142 (58.2) |
|
Dead | 102 (41.8) |
| Sex |
|
|
Female | 71 (29.10) |
|
Male | 173 (70.90) |
| Stage |
|
| I | 115 (47.13) |
| II | 76 (31.15) |
|
III | 49 (20.08) |
| IV | 3 (1.23) |
|
Unknown | 1 (0.41) |
| T stage |
|
| T1 | 60 (24.59) |
| T2 | 130 (53.28) |
| T3 | 39 (15.98) |
| T4 | 15 (6.15) |
| M stage |
|
| M0 | 208 (85.25) |
| M1 | 3 (1.23) |
| MX | 32 (13.11) |
|
Unknown | 1 (0.41) |
| N stage |
|
| N0 | 151 (61.89) |
| N1 | 61 (25) |
| N2 | 24 (9.84) |
| N3 | 3 (1.23) |
|
Unknown | 5 (2.05) |
|
| C, Entire cohort
(n=489) |
|
|
Characteristic | n (%) |
|
| Age |
|
| <65
years | 189 (38.65) |
| >65
years | 300 (61.35) |
| Status |
|
|
Alive | 278 (56.85) |
|
Dead | 211 (43.15) |
| Sex |
|
|
Female | 127 (25.97) |
|
Male | 362 (74.03) |
| Stage |
|
| I | 239 (48.88) |
| II | 156 (31.9) |
|
III | 83 (16.97) |
| IV | 7 (1.43) |
|
Unknown | 4 (0.82) |
| T stage |
|
| T1 | 111 (22.70) |
| T2 | 285 (58.28) |
| T3 | 70 (14.32) |
| T4 | 23 (4.70) |
| M stage |
|
| M0 | 401 (82) |
| M1 | 7 (1.43) |
| MX | 77 (15.75) |
|
Unknown | 4 (0.82) |
| N stage |
|
| N0 | 312 (63.8) |
| N1 | 126 (25.78) |
| N2 | 40 (8.37) |
| N3 | 5 (1.02) |
|
Unknown | 6 (1.23) |
Enrichment analysis
Detailed and in-depth gene set enrichment analysis
(GSEA) was performed on the gene sets ‘c5.go.Hs.symbols.gmt’ and
‘c2.cp.kegg.Hs.symbols.gmt’ obtained from the MSigDB database
(docs.gsea-msigdb.org/#MSigDB/MSigDB_FAQ) (15). Furthermore, using the ‘Cluster
Profiler’ R package, Gene Ontology (GO) enrichment analysis was
performed to assess the cellular and molecular characteristics of
EIGs, and Kyoto Encyclopedia of Genes and Genomes (KEGG) pathway
enrichment analysis was used to evaluate their roles in several
metabolic and signaling pathways (16). The GO annotation was based on the
Bioconductor Project's complete genome annotation package
(org.Hs.eg.db). KEGG elucidated the advanced
functions, networks and applications of biological systems,
providing a foundation for further research. The ‘cluster profiler’
tool was utilized, which uses the Web API to query the most
up-to-date KEGG database, obtain path data and perform functional
analysis. The threshold of P<0.05 was applied to determine
enrichment. Distinct GO and KEGG plots were generated, illustrating
variations in gene numbers and selection criteria.
Tumor immune correlation analysis
Using the ‘biolinks’ software tool, LUSC mutation
information from TCGA database was analyzed to assess the
disparities in TMB between risk cohorts. A waterfall plot was
subsequently generated using the ‘maftools’ tool to display the top
20 genes with notable mutation differences. This visualization
enabled the comparison of the distinct variations in mutation
burden among different risk cohorts. Subsequently, the expression
data were processed using the ESTIMATE algorithm (1.0.13,
bioinformatics.mdanderson.org/), leading to the assessment of the
stromal score, immune score and overall ESTIMATE score in LUSC
(17). CIBERSORT(0.1.0, http://cibersortx.stanford.edu/) was subsequently
used to identify 22 invasive immune cells. Subsequently, immune
typing analysis was performed using the R package ‘RColorBrewer’
(18). single-sample GSEA (ssGSEA)
was then used to measure immune function in different risk groups.
Furthermore, TIDE score files were retrieved from the TIDE site
(tide.dfci.harvard.edu/) to compare the different scores among
different risk groups.
Immune checkpoint and IMvigor210
An analysis of the expression of 79 immune
checkpoint genes was performed across different groups to assess
tumor immunity, and the ‘ggpubr’ software suite was used to
scrutinize disparities in immunosuppressive molecules associated
with immune checkpoints (19).
Furthermore, gene transcription data from 298 patients with
uroepithelial carcinoma was retrieved from the IMvigor210 cohort
and their responsiveness to immunotherapy was forecasted to
appraise the immunotherapeutic efficacy of the risk model in the
present study and to prognosticate the outcome of the IMvigor210
immunotherapy regimen (20).
Drug sensitivity test
The drug susceptibility of LUSC was predicted using
the R-editing language ‘parallel’ and the ‘oncoPredict’ package.
Moreover, using the ‘ggplot2’ package, the susceptibility of the
high-risk group to 198 drugs was plotted, considering P<0.05
(21).
Validation by reverse
transcription-quantitative PCR (RT-qPCR)
To assess the proposed model, RT-qPCR analysis was
performed. RNA was extracted from human LUSC H2195, H711 and H1522
cells (Binhui Biotechnology) and from normal bronchial epithelium
16HBE cells (Binhui Biotechnology) using TRIzol reagent (Takara
Bio, Inc.). RT-qPCR was performed using the Probe One Step RT-qPCR
Kit (NM_004048, Beijing Quality Biotechnology Co., Ltd.). For
RT-PCR, begin with a 70°C incubation for 10 min, then synthesize
cDNA at 37°C for 65 min, hold at 15.8°C for 150 min, and finally
maintain at 4°C. For qPCR, use SYBR Green I (Vazyme Medical Co.,
Ltd.) as a fluorescent marker. Thermocycling conditions were as
follows: Initial denaturation at 95°C denaturation for 2–10 min,
followed by 40 cycles of 95°C for 10 sec and 60°C for 30 sec.
Finally, the 2−ΔΔCq method (22) was used to normalize sample gene
expression for the final result calculations. Normalization
involved using ΔCT and the efficiency measured for the reference
gene to calculate the ETΔCT/ERΔCT ratio (23). To compare the expression levels
between LUSC cells and normal cells, the unpaired t-test was used
for statistical analysis. The aforementioned method enabled precise
measurement and comparison of significant gene expression
variations across several cell types. The primers used in the
RT-qPCR experiment are listed in Table
SII.
Protein expression
To assess the protein expression differences in
patients with LUSC and healthy individuals, a thorough analysis was
performed using data obtained from the Human Protein Atlas (HPA)
database (AREG, MUC1 and FABP6; proteinatlas.org/). This
comprehensive dataset was used to assess the protein expression
profiles of the chosen EIGs in both LUSC and normal tissues and the
analytical method enabled the comprehensive understanding of the
expression patterns and variations of these genes across different
samples.
Statistical analysis
Statistical analyses were carried out using R
version 4.2.1, and the corresponding R packages were also based on
this version. A P-value threshold of less than 0.05 was used to
determine significance, except where explicitly stated
otherwise.
Results
Identification of epithelium-related
genes
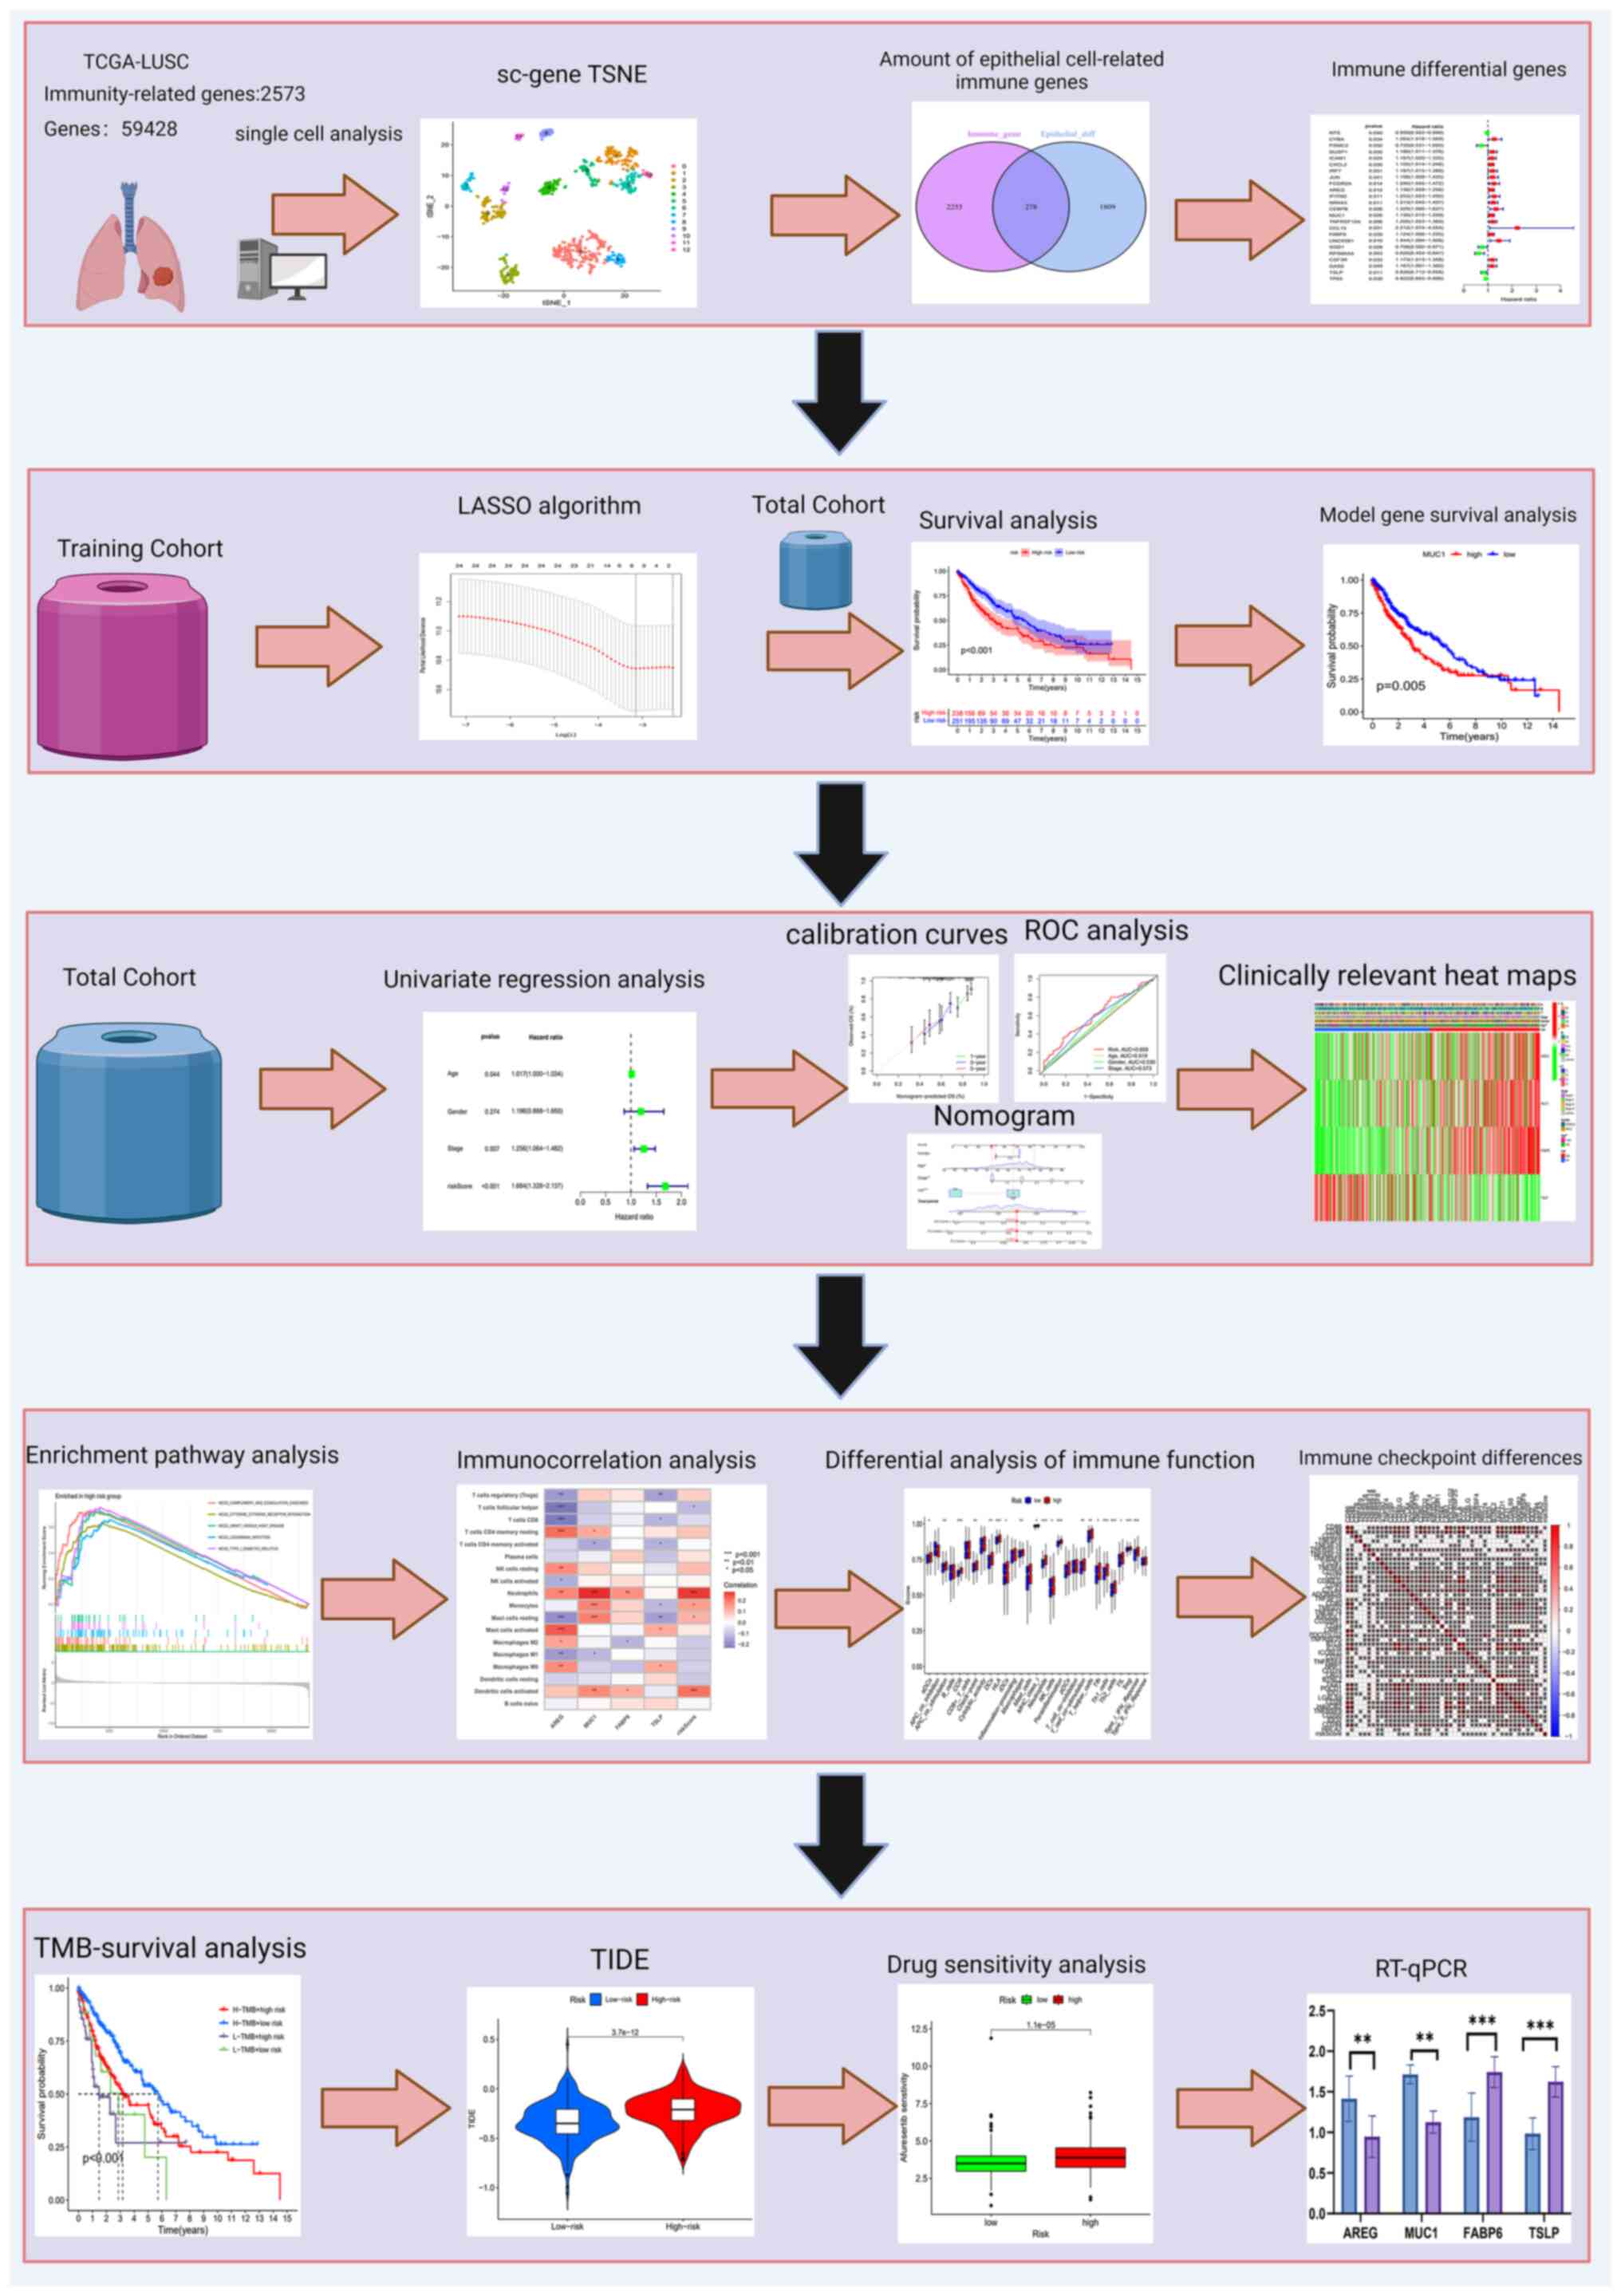
As illustrated in Fig.
1, which presents the study flowchart, scRNA-seq was performed
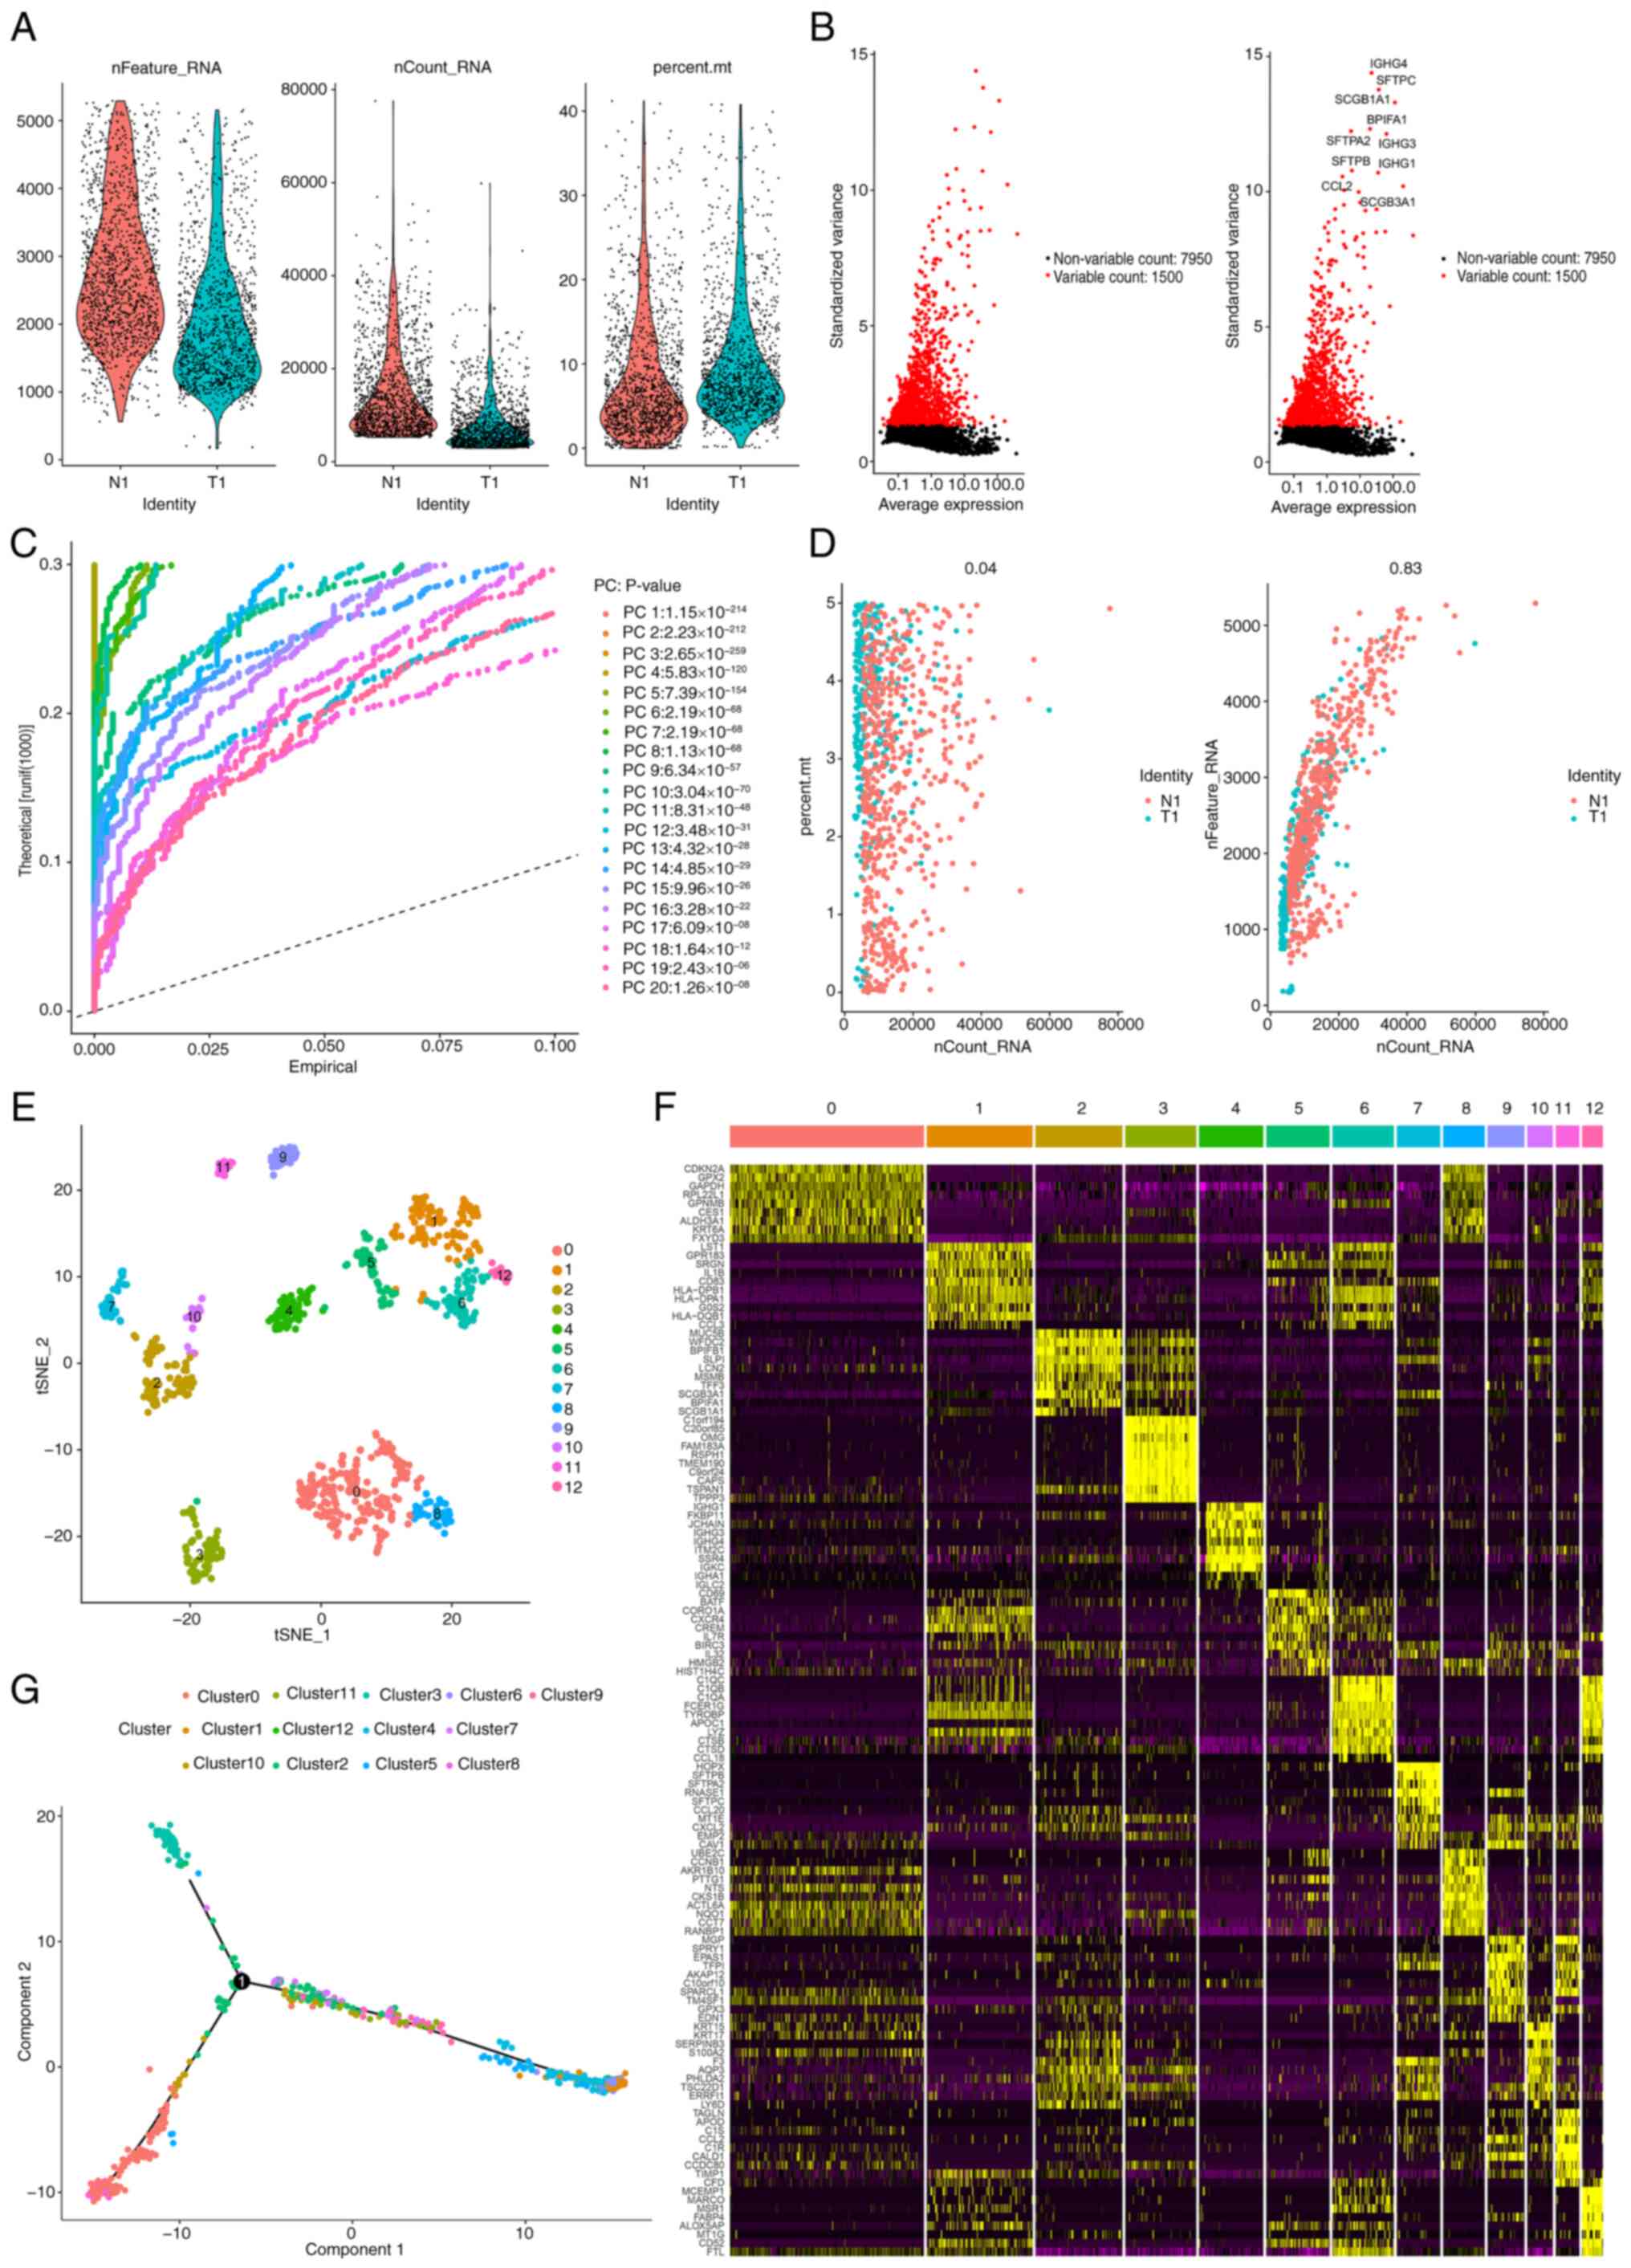
on a sequence of 2,470 LUSC samples. Furthermore, Fig. 2A demonstrates the range, sequencing
depth and % of mitochondria for each sample. After a quality
control filtration process was used to remove poor-quality cells,
the remaining cells were subjected to subsequent analysis. After
sample normalization, 7,950 low-mutation genes were excluded and
1,500 highly variable genes were selected (Fig. 2B). Subsequently, the PCA method was
applied to simplify the variables within the dataset (Fig. 2C and D). Moreover, to perform a more
detailed and in-depth analysis, 20 PCs) were selected, each
exhibiting P<0.05, ensuring their statistical significance.
Subsequently, the t-SNE algorithm (2.0, geeksforgeeks.org) was
used, which allowed the visual mapping and distinguishing of the 12
clusters present within the sample, thus providing a clearer
representation of the data distribution and relationships (Fig. 2E). Using the ‘single-R’ package in R
(bioconductor.org/packages/release/bioc/html/SingleR.html), it was
demonstrated that Clusters 0, 2, 3, 7 and 10 were classified as
epithelial cell subpopulations. The expression patterns of distinct
genes in individual cell clusters are shown in Fig. 2F. Finally, the developmental
trajectory of epithelial cells was assessed using pseudotime
analysis (Fig. 2G).
Model construction and validation
After the overlap of the immune gene set with genes
related to the epithelium was confirmed, 278 immune-related genes
were identified (Fig. S1A and
Table SIII). A single-variable Cox
regression analysis was performed using the TCGA LUSC cohort as a
training set, and 24 epithelium-related genes (Table SIV) were revealed to be
significantly related to overall survival (OS; Fig. S1B). Furthermore, a protein-protein
interaction network was constructed using Cytoscape (3.9 http://cn.string-db.org/), and the relationships among
the cox genes were demonstrated (Fig.
S1C). A total of 8 EIGs were then identified using LASSO
analysis, and 4 genes [amphiregulin (AREG), mucin (MUC)1, fatty
acid-binding protein 6 (FABP6) and thymic stromal lymphopoietin
(TSLP)] were selected for model construction after comparison with
Cox regression analysis (Fig. S1D and
E). The risk score was calculated as follows: (0.134 × AREG
expression) + (0.129 × MUC1 expression) + (0.249 × FABP6
expression) + (−0.199 × TSLP expression). This was followed by an
evaluation of the prognostic value of the model. According to the
risk score, clinical information of different risk groups was
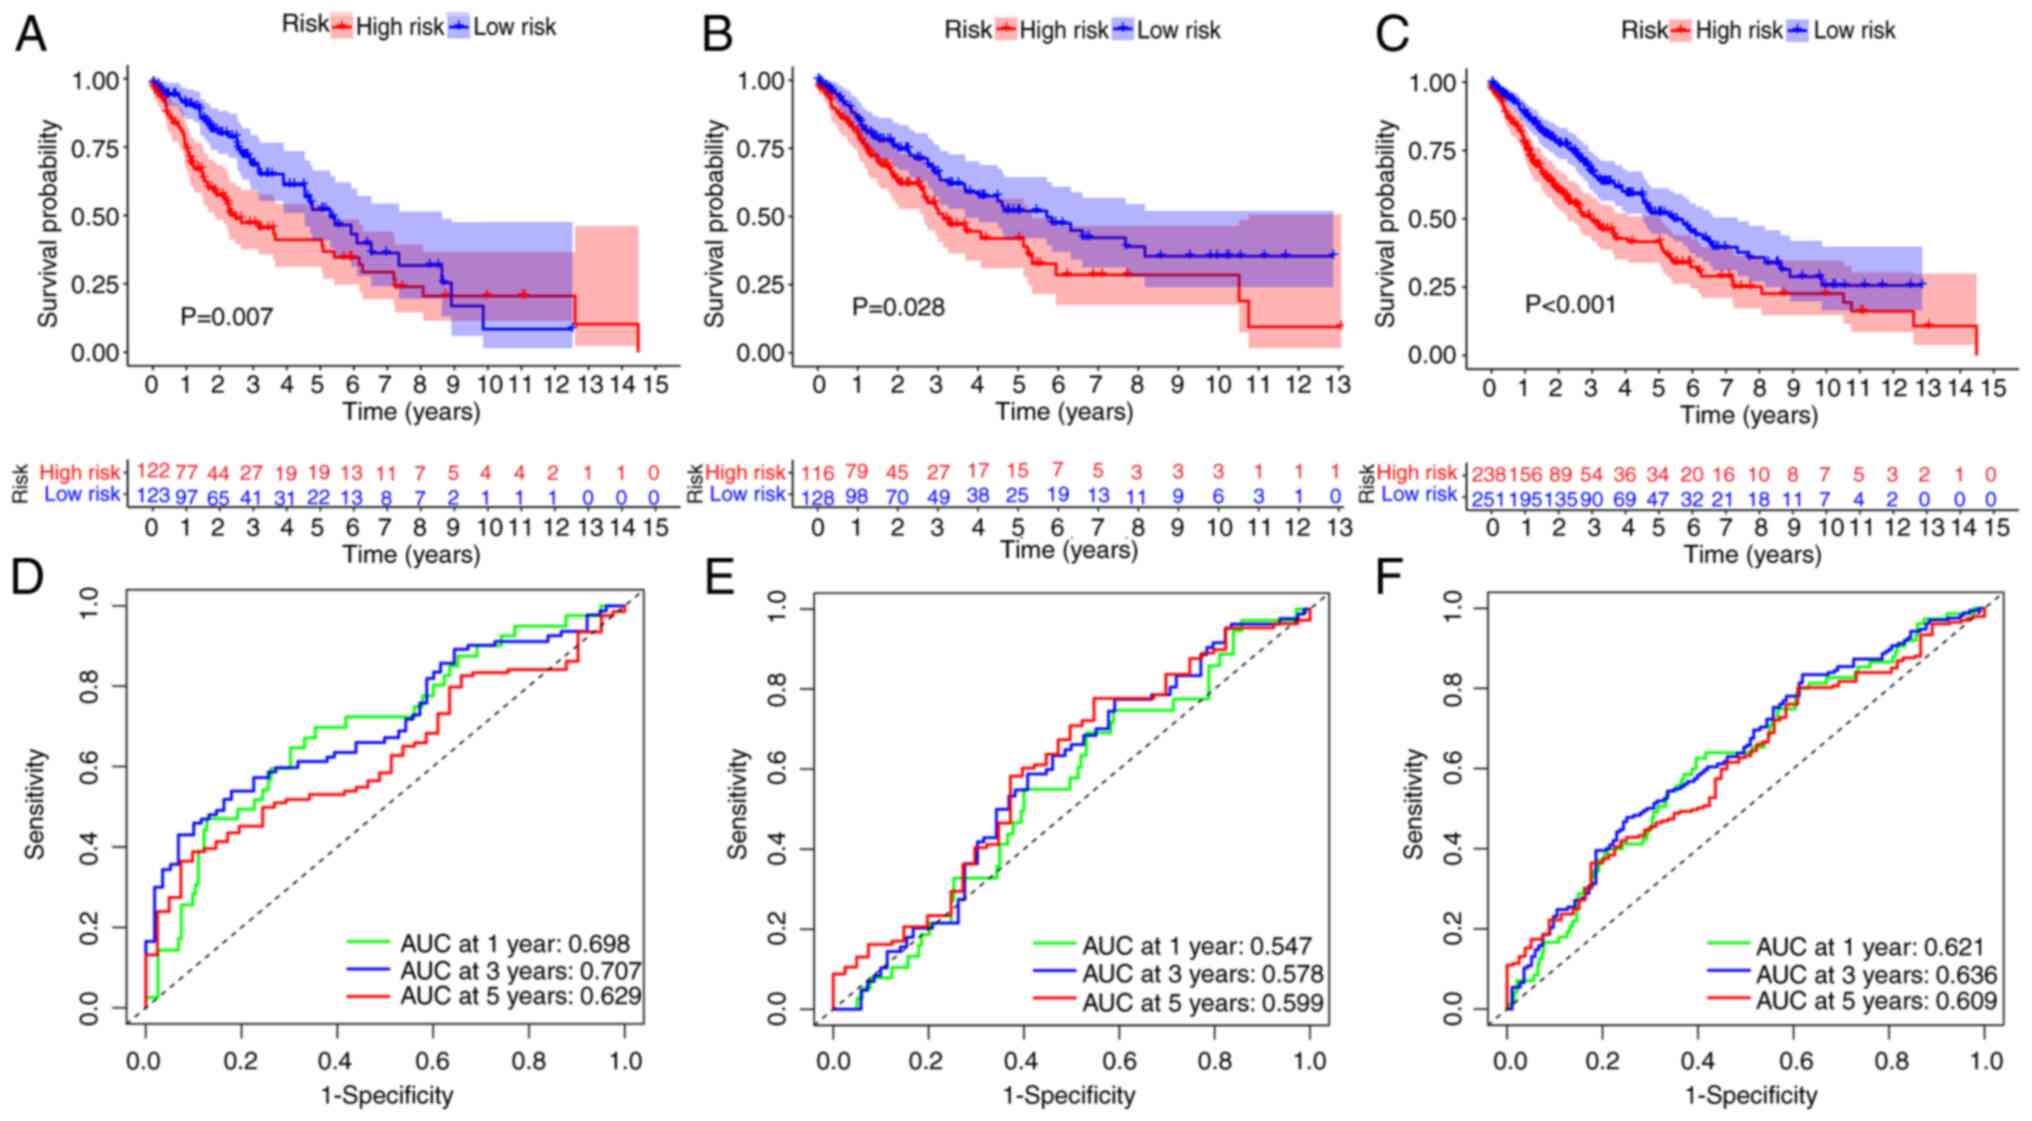
recorded (Table II). Survival
rates notably differed between the two risk groups, as indicated by
the survival analysis curves, with high-risk patients exhibiting a
significantly reduced survival rate, compared with that of the
low-risk patients (P=0.007; Fig.
3A). However, the generated curves intersected at the tail end
S(t)=0.2. The TS test demonstrated that there was still a
significant difference in survival between different risk groups
(P=0.00723), indicating that the intersection of the curves did not
affect the results. ROC curves were also used to evaluate the
prognostic ability of the model. Fig.
3B presents the AUC values at 1, 3 and 5 years, with OS rates
for patients with LUAD of 0.698, 0.707 and 0.629, respectively.
Similar results were demonstrated for both the experimental group
and the entire cohort (Fig. 3C-F),
confirming the feasibility of the model. Specifically, for the test
cohort, it was revealed that individuals in the high-risk category
had a significantly decreased OS rate, and this trend was
consistent across all the experimental results. Additionally,
through analysis of the expression levels of EIGs, it was revealed
that AREG, MUC1 and FABP6 were expressed at higher levels in
high-risk patients, indicating increased susceptibility to disease,
whilst TSLP was more highly expressed in low-risk patients,
suggesting greater resistance (Fig.
S2A-C). Moreover, scatter plot analysis indicated that OS was
markedly reduced and that the mortality rate was increased
(Fig. S2D-I). Kaplan-Meier curves
for survival analysis and differential expression of patients with
LUSC patients with four model-associated EIGs are shown in Fig. S3. AREG, FABP6, and MUC1 showed
decreased expression in the high-risk group compared to the
low-risk group, while their expression was elevated in the latter.
Conversely, TSLP exhibited lower expression in the low-risk group
but was relatively higher in the high-risk group. The survival
curves for the AREG and MUC1 genes intersected; therefore, the TS
test was performed. The resulting P-values were 0.0314459 and
0.02161114 for AREG and MUC1, respectively. This indicated that
despite the intersection, the genes still demonstrated a
significant difference in their prognostic implications for
survival outcomes.
| Table II.Clinical information of patients in
different risk groups. |
Table II.
Clinical information of patients in
different risk groups.
| A, High-risk group
(n=238) |
|---|
|
|---|
| Characteristic | n (%) |
|---|
| Age |
|
| <65
years | 75 (31.51) |
| >65
years | 163 (68.49) |
| Status |
|
|
Alive | 123 (51.68) |
|
Dead | 115 (48.32) |
| Sex |
|
|
Female | 65 (27.31) |
|
Male | 173 (72.69) |
| Stage |
|
| I | 127 (53.36) |
| II | 67 (28.15) |
|
III | 38 (15.97) |
| IV | 5 (2.1) |
|
Unknown | 1 (0.42) |
| T stage |
|
| T1 | 67 (28.15) |
| T2 | 126 (52.94) |
| T3 | 33 (13.87) |
| T4 | 12 (5.04) |
| M stage |
|
| M0 | 188 (78.99) |
| M1 | 5 (2.1) |
| MX | 43 (18.07) |
|
Unknown | 2 (0.84) |
| N stage |
|
| N0 | 160 (67.23) |
| N1 | 54 (22.69) |
| N2 | 16 (6.72) |
| N3 | 3 (1.26) |
|
Unknown | 5 (2.1) |
|
| B, Low-risk
group (n=251) |
|
| Age |
|
| <65
years | 114 (45.42) |
| >65
years | 137 (54.58) |
| Status |
|
|
Alive | 155 (61.75) |
|
Dead | 96 (38.25) |
| Sex |
|
|
Female | 62 (24.7) |
|
Male | 189 (75.3) |
| Stage |
|
| I | 110 (43.82) |
| II | 87 (34.67) |
|
III | 49 (19.52) |
| IV | 2 (0.80) |
|
Unknown | 3 (1.20) |
|
| B, Low-risk
group (n=251) |
|
|
Characteristic | n (%) |
|
| T stage |
|
| T1 | 43 (18.33) |
| T2 | 160 (63.75) |
| T3 | 37 (14.74) |
| T4 | 11 (4.38) |
| M stage |
|
| M0 | 213 (84.86) |
| M1 | 2 (0.8) |
| MX | 34 (13.54) |
|
Unknown | 2 (0.8) |
| N stage |
|
| N0 | 152 (60.56) |
| N1 | 72 (28.69) |
| N2 | 24 (9.55) |
| N3 | 2 (0.8) |
|
Unknown | 1 (0.4) |
Clinical OS prediction by the
independent prognostic models in patients with LUSC
Univariate and multivariate Cox regression analyses
revealed that the risk score held independent prognostic
significance in both types of analyses (Fig. S4A and B). Moreover, the clinical
circle and heatmap indicated that age and T stage may be
independent prognostic factors (Fig.
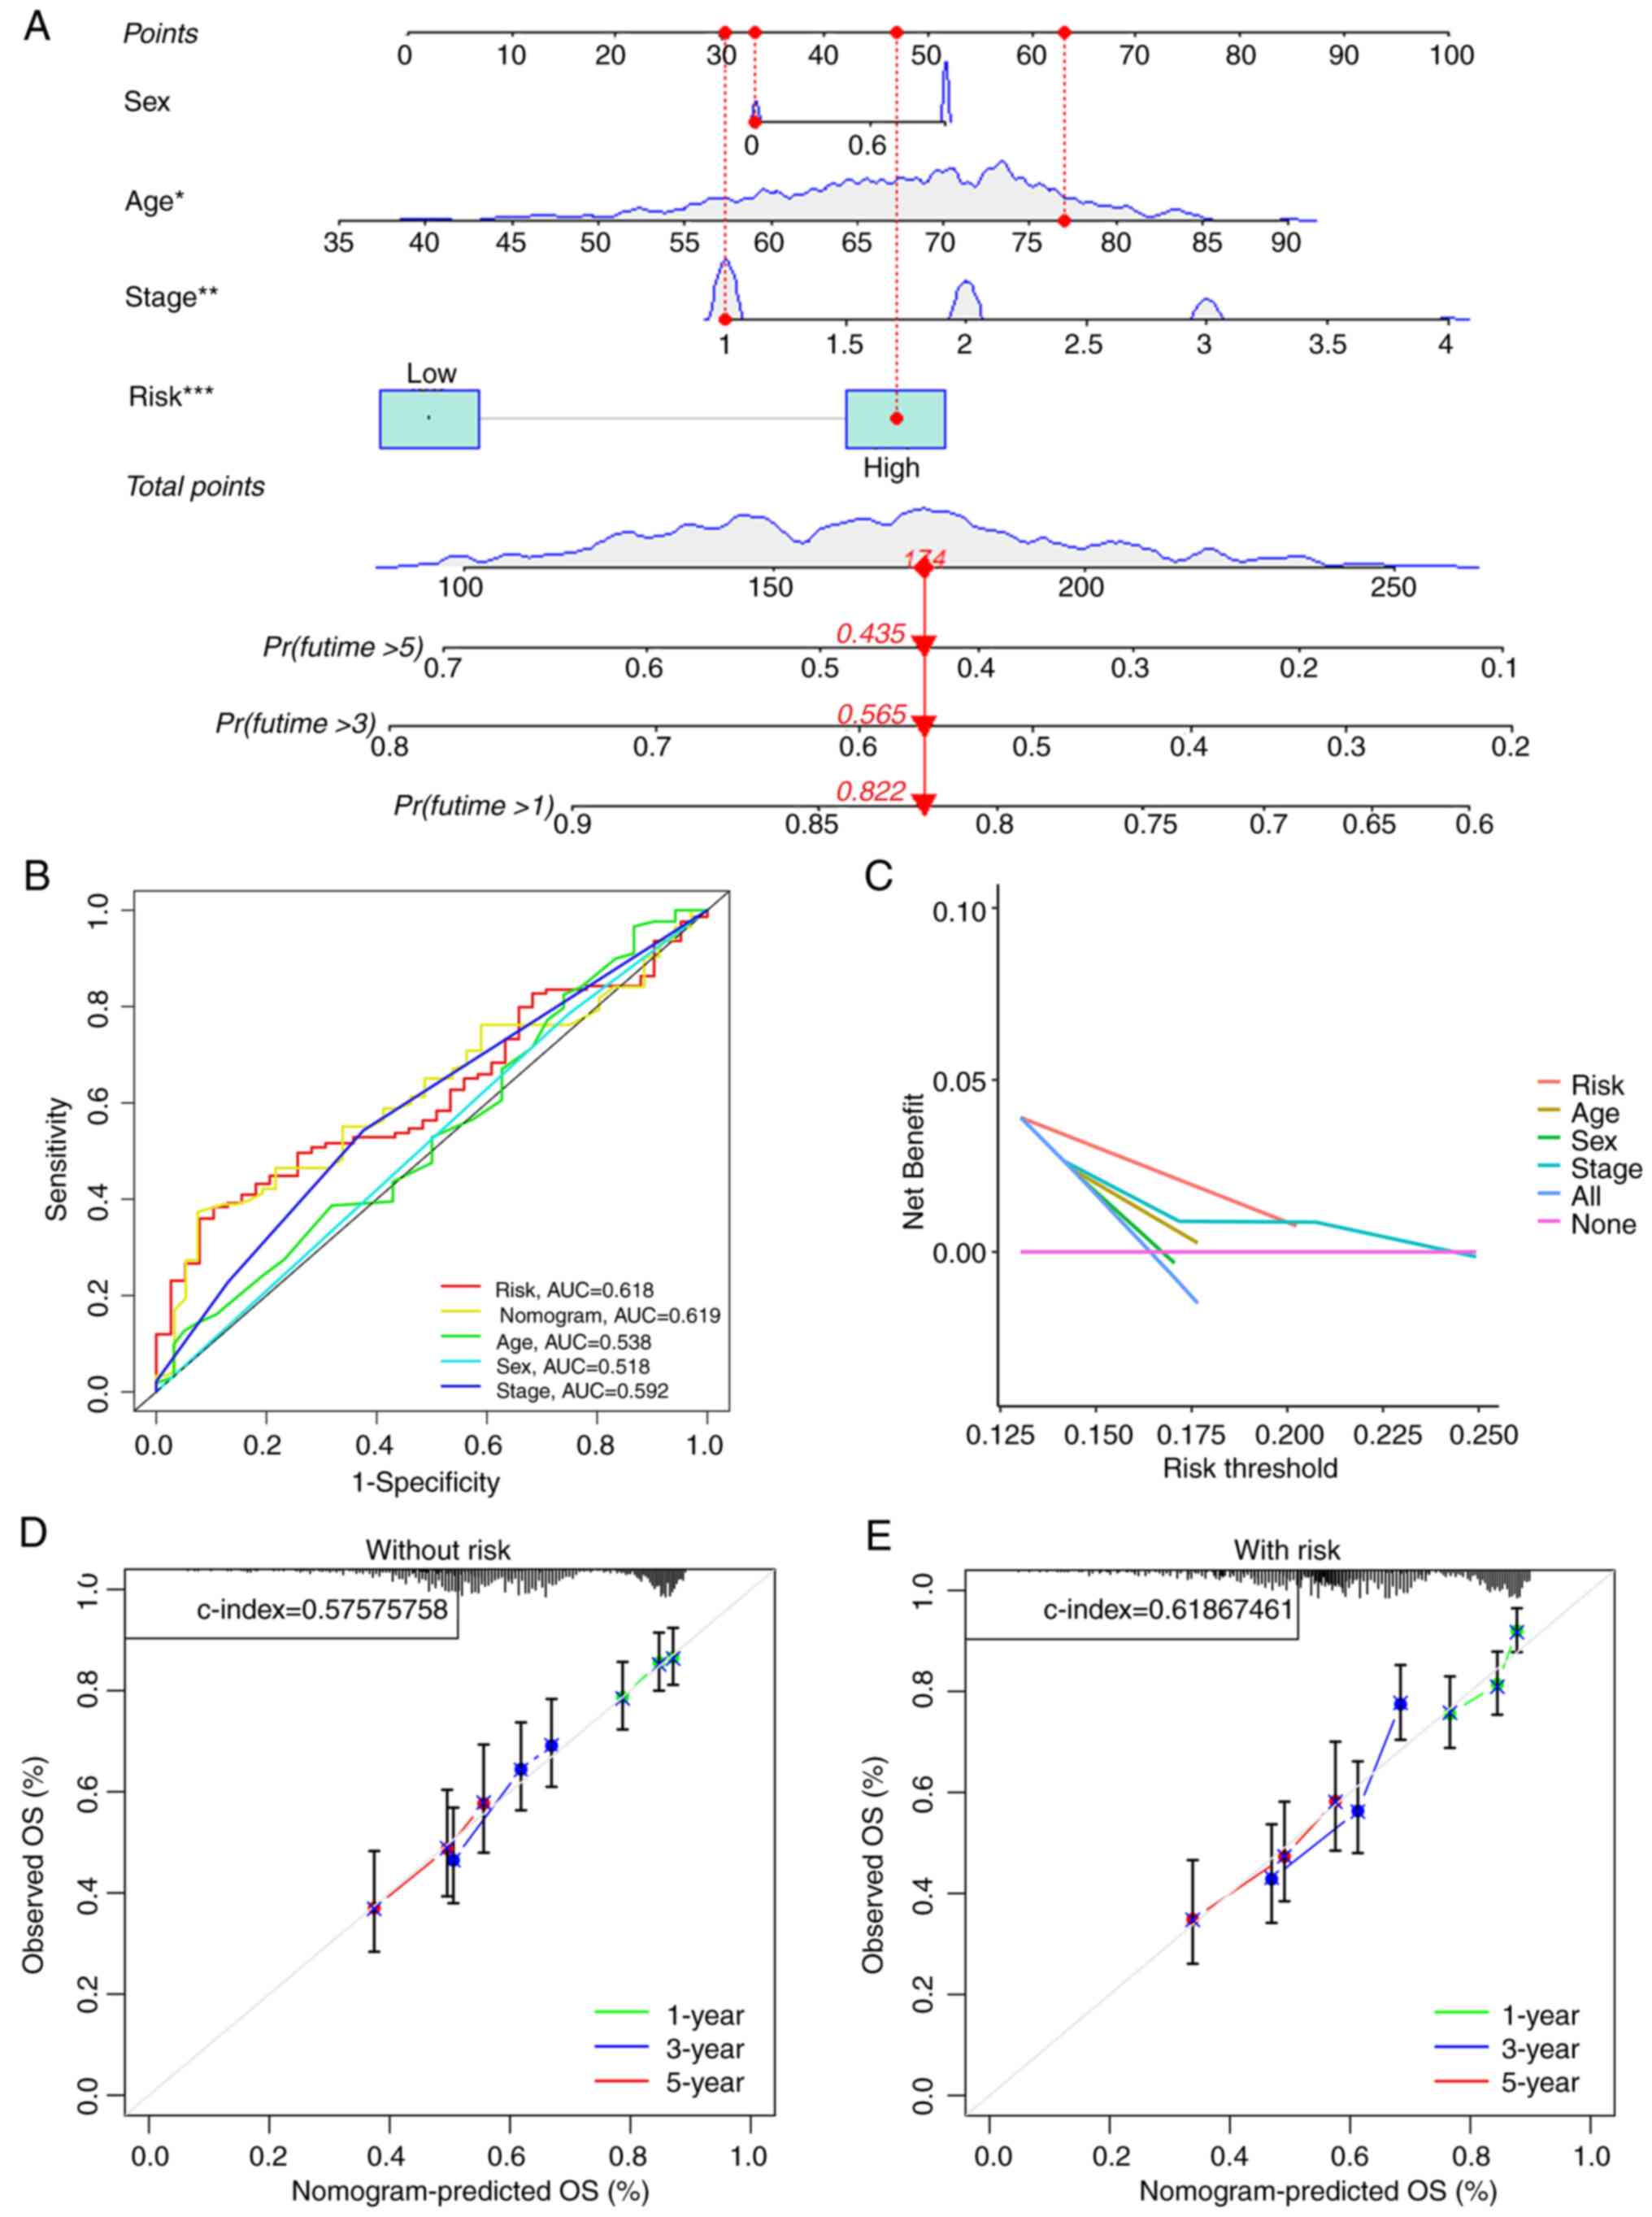
S4C and D). Furthermore, the risk models value was notably
greater than that of clinical traits in predicting patient
prognosis, according to the nomogram (Fig. 4A). The ROC survival curve also
demonstrated that the risk was more predictive than the majority of
clinical data (Fig. 4B).
Additionally, the decision curve revealed that the risk model had a
markedly greater net benefit than the other clinical factors
(Fig. 4C). The calibration curve
also demonstrated that having a model had a notably greater C-index
than having no risk model (Fig. 4D and
E). Subsequently, a prospective estimate of patients with LUSC
was performed according to age, risk, sex and disease stage
(Fig. S5A-C) and survival rates
were compared among patients of different ages, sexes, T stages and
N stages (Fig. S5D-H) to determine
the predictive effect. Notably, there were pronounced differences
in risk scores among those aged ≥65 and above, as well as between
patients with stage I and stage II tumors. The survival curves
plotted by combining clinical features such as age, sex, and tumor
stage with the model-predicted risk scores show significant
differences between the groups. GEO external data was validated and
it was demonstrated that the model is feasible (Fig. S5I).
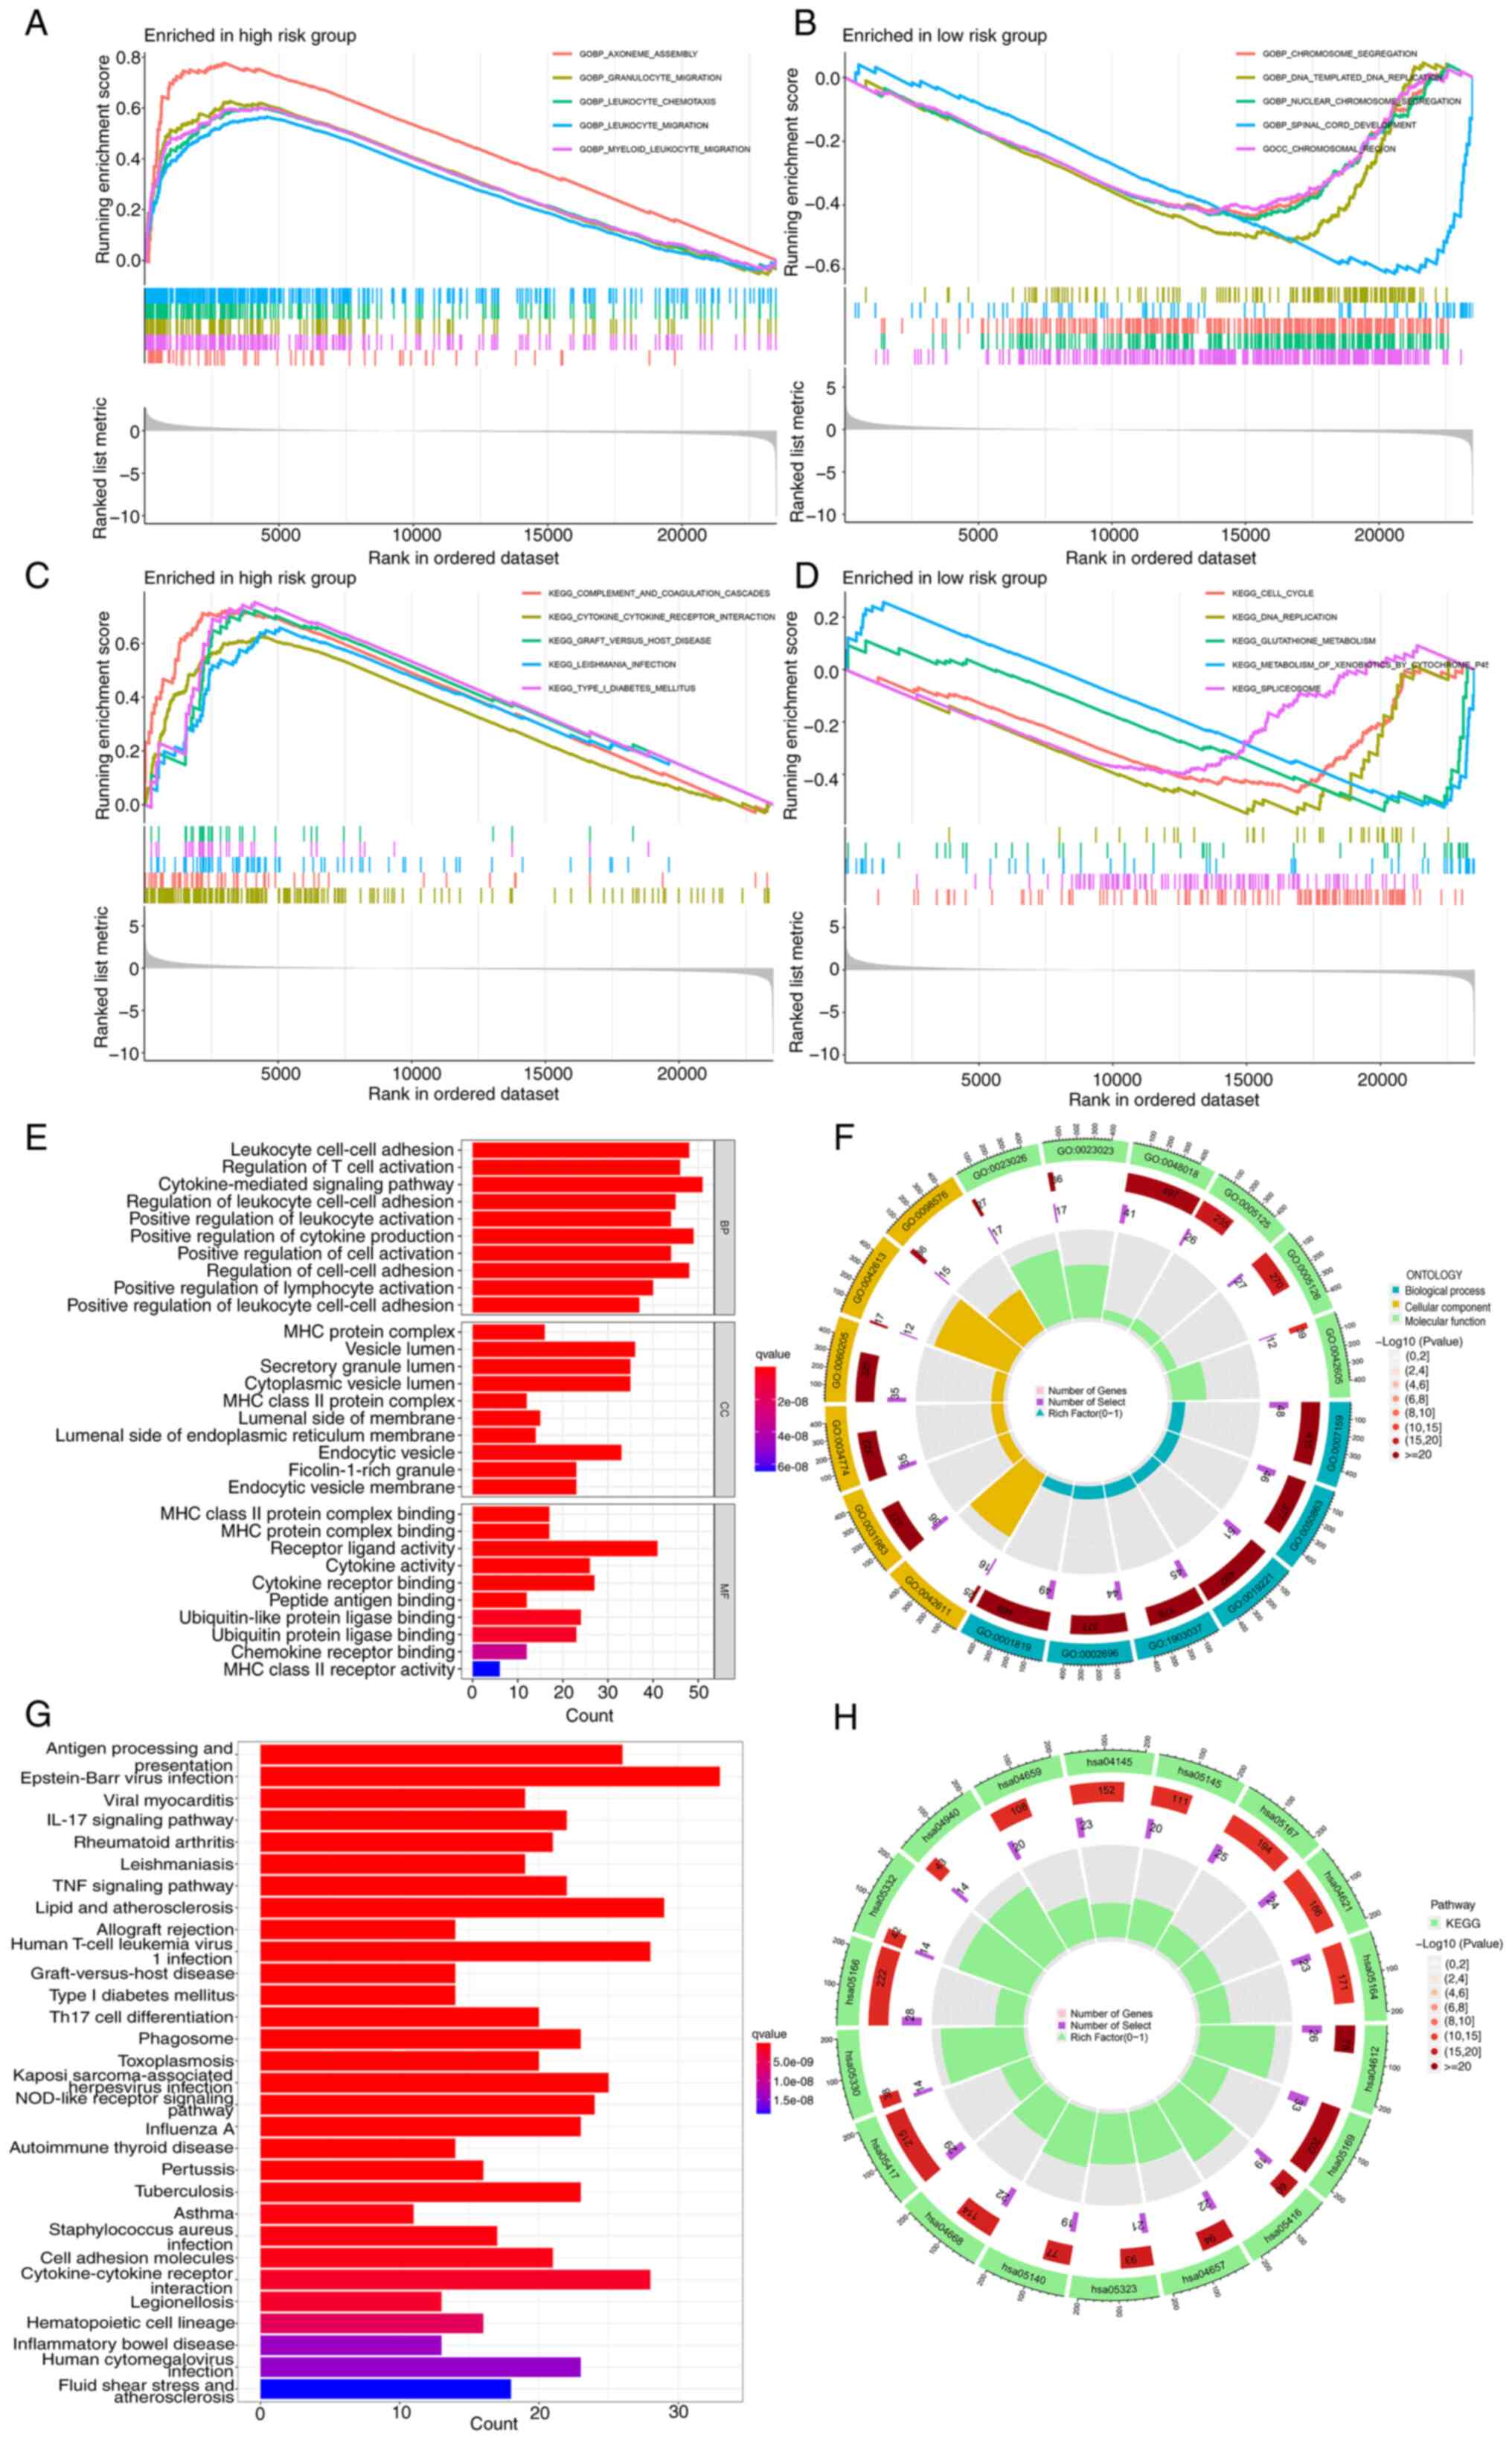
Enrichment analysis
The GSEA enrichment results indicated that the model
gene had a positive association with the ‘granulocytes migration’
and ‘leucocytes migration’, while it showed a negative association
with ‘chromosome segregation’ and ‘DNA replication’. Pathway
enrichment revealed a high association of the model genes with
three pathways related to ‘cytokine-cytokine receptor interaction’,
‘type I diabetes mellitus’ and ‘complement and coagulation
cascades’, whilst the association with the ‘DNA replication’
pathway was low (Fig. 5A-D). GO
analysis revealed the involvement of immune system genes, T cells,
cytokines and white blood cells (Fig.
5E and F). Moreover, KEGG analysis confirmed the close
relationship between these genes and the way in which antigen are
processed and presented (Fig. 5G and
H). According to KEGG analysis, antigen processing and
presentation pathways were enriched, and the high-risk group
revealed contamination with human T-cell leukemia virus 1. The
detailed findings are presented in Table SV. Finally, the potential
mechanisms initiated by relevant model genes during the progression
of tumors were illustrated (Fig.
6).
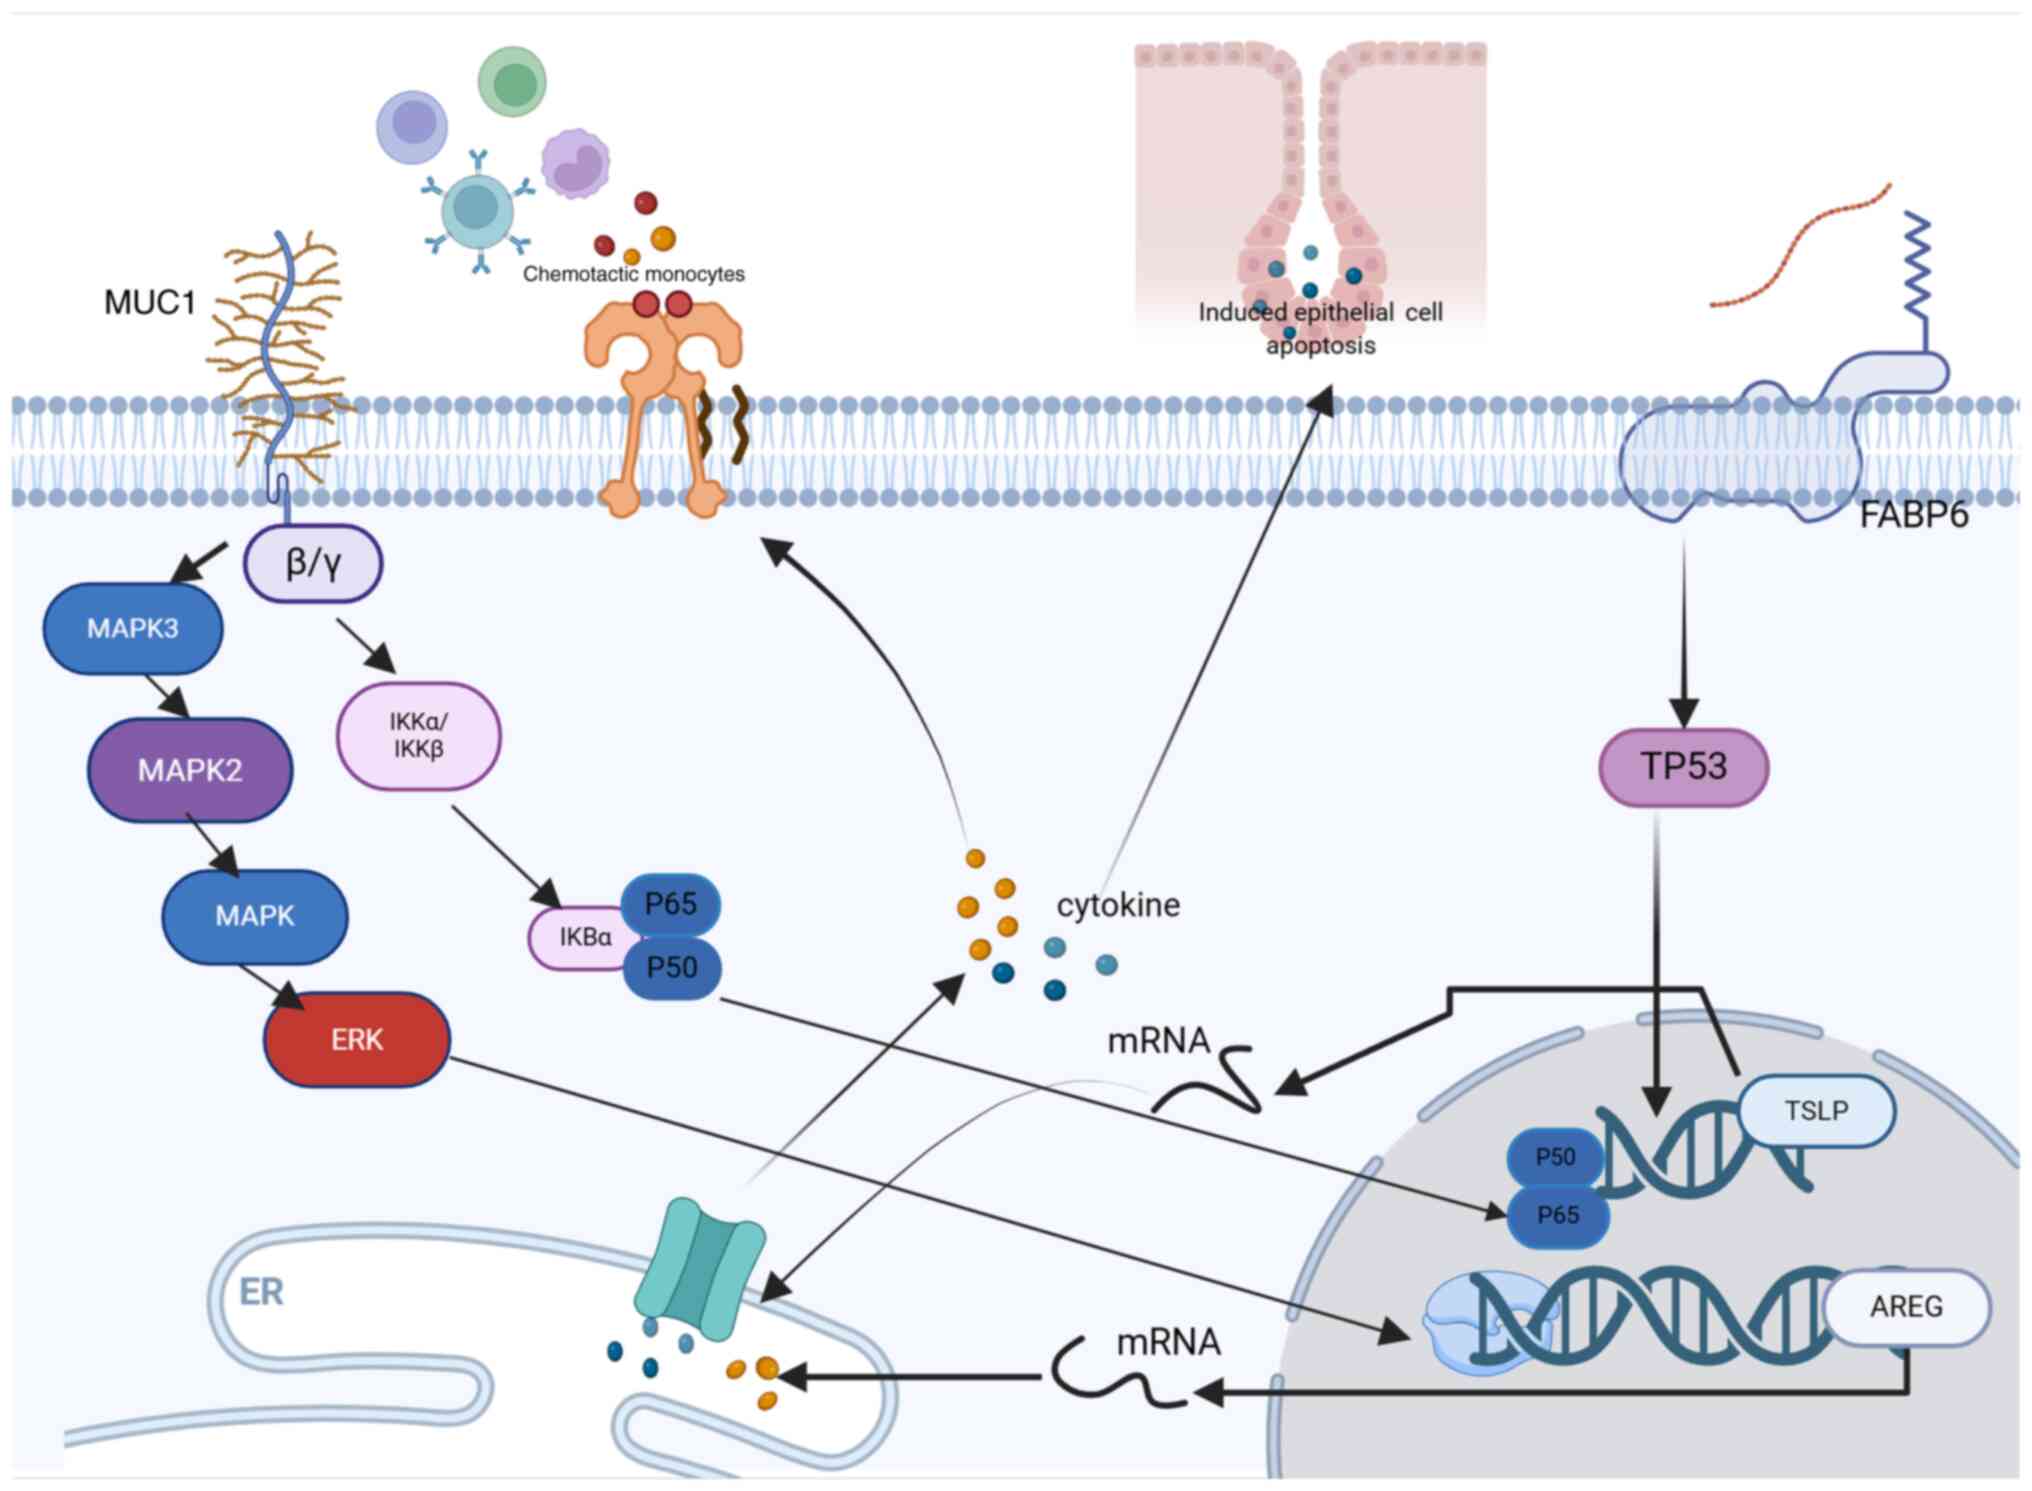 | Figure 6.Molecular mechanisms of 4 model genes
in tumor progression. AREG, amphiregulin; MUC1, mucin-1; FABP6,
fatty acid-binding protein 6; TSLP, thymic stromal lymphopoietin;
IKB, inhibitor of nuclear factor kappa B; IKK, inhibitor of kappa B
kinase; TP53, tumor protein 53; P60, Protein 60; P50, Protein 50;
mRNA, messenger RNA. |
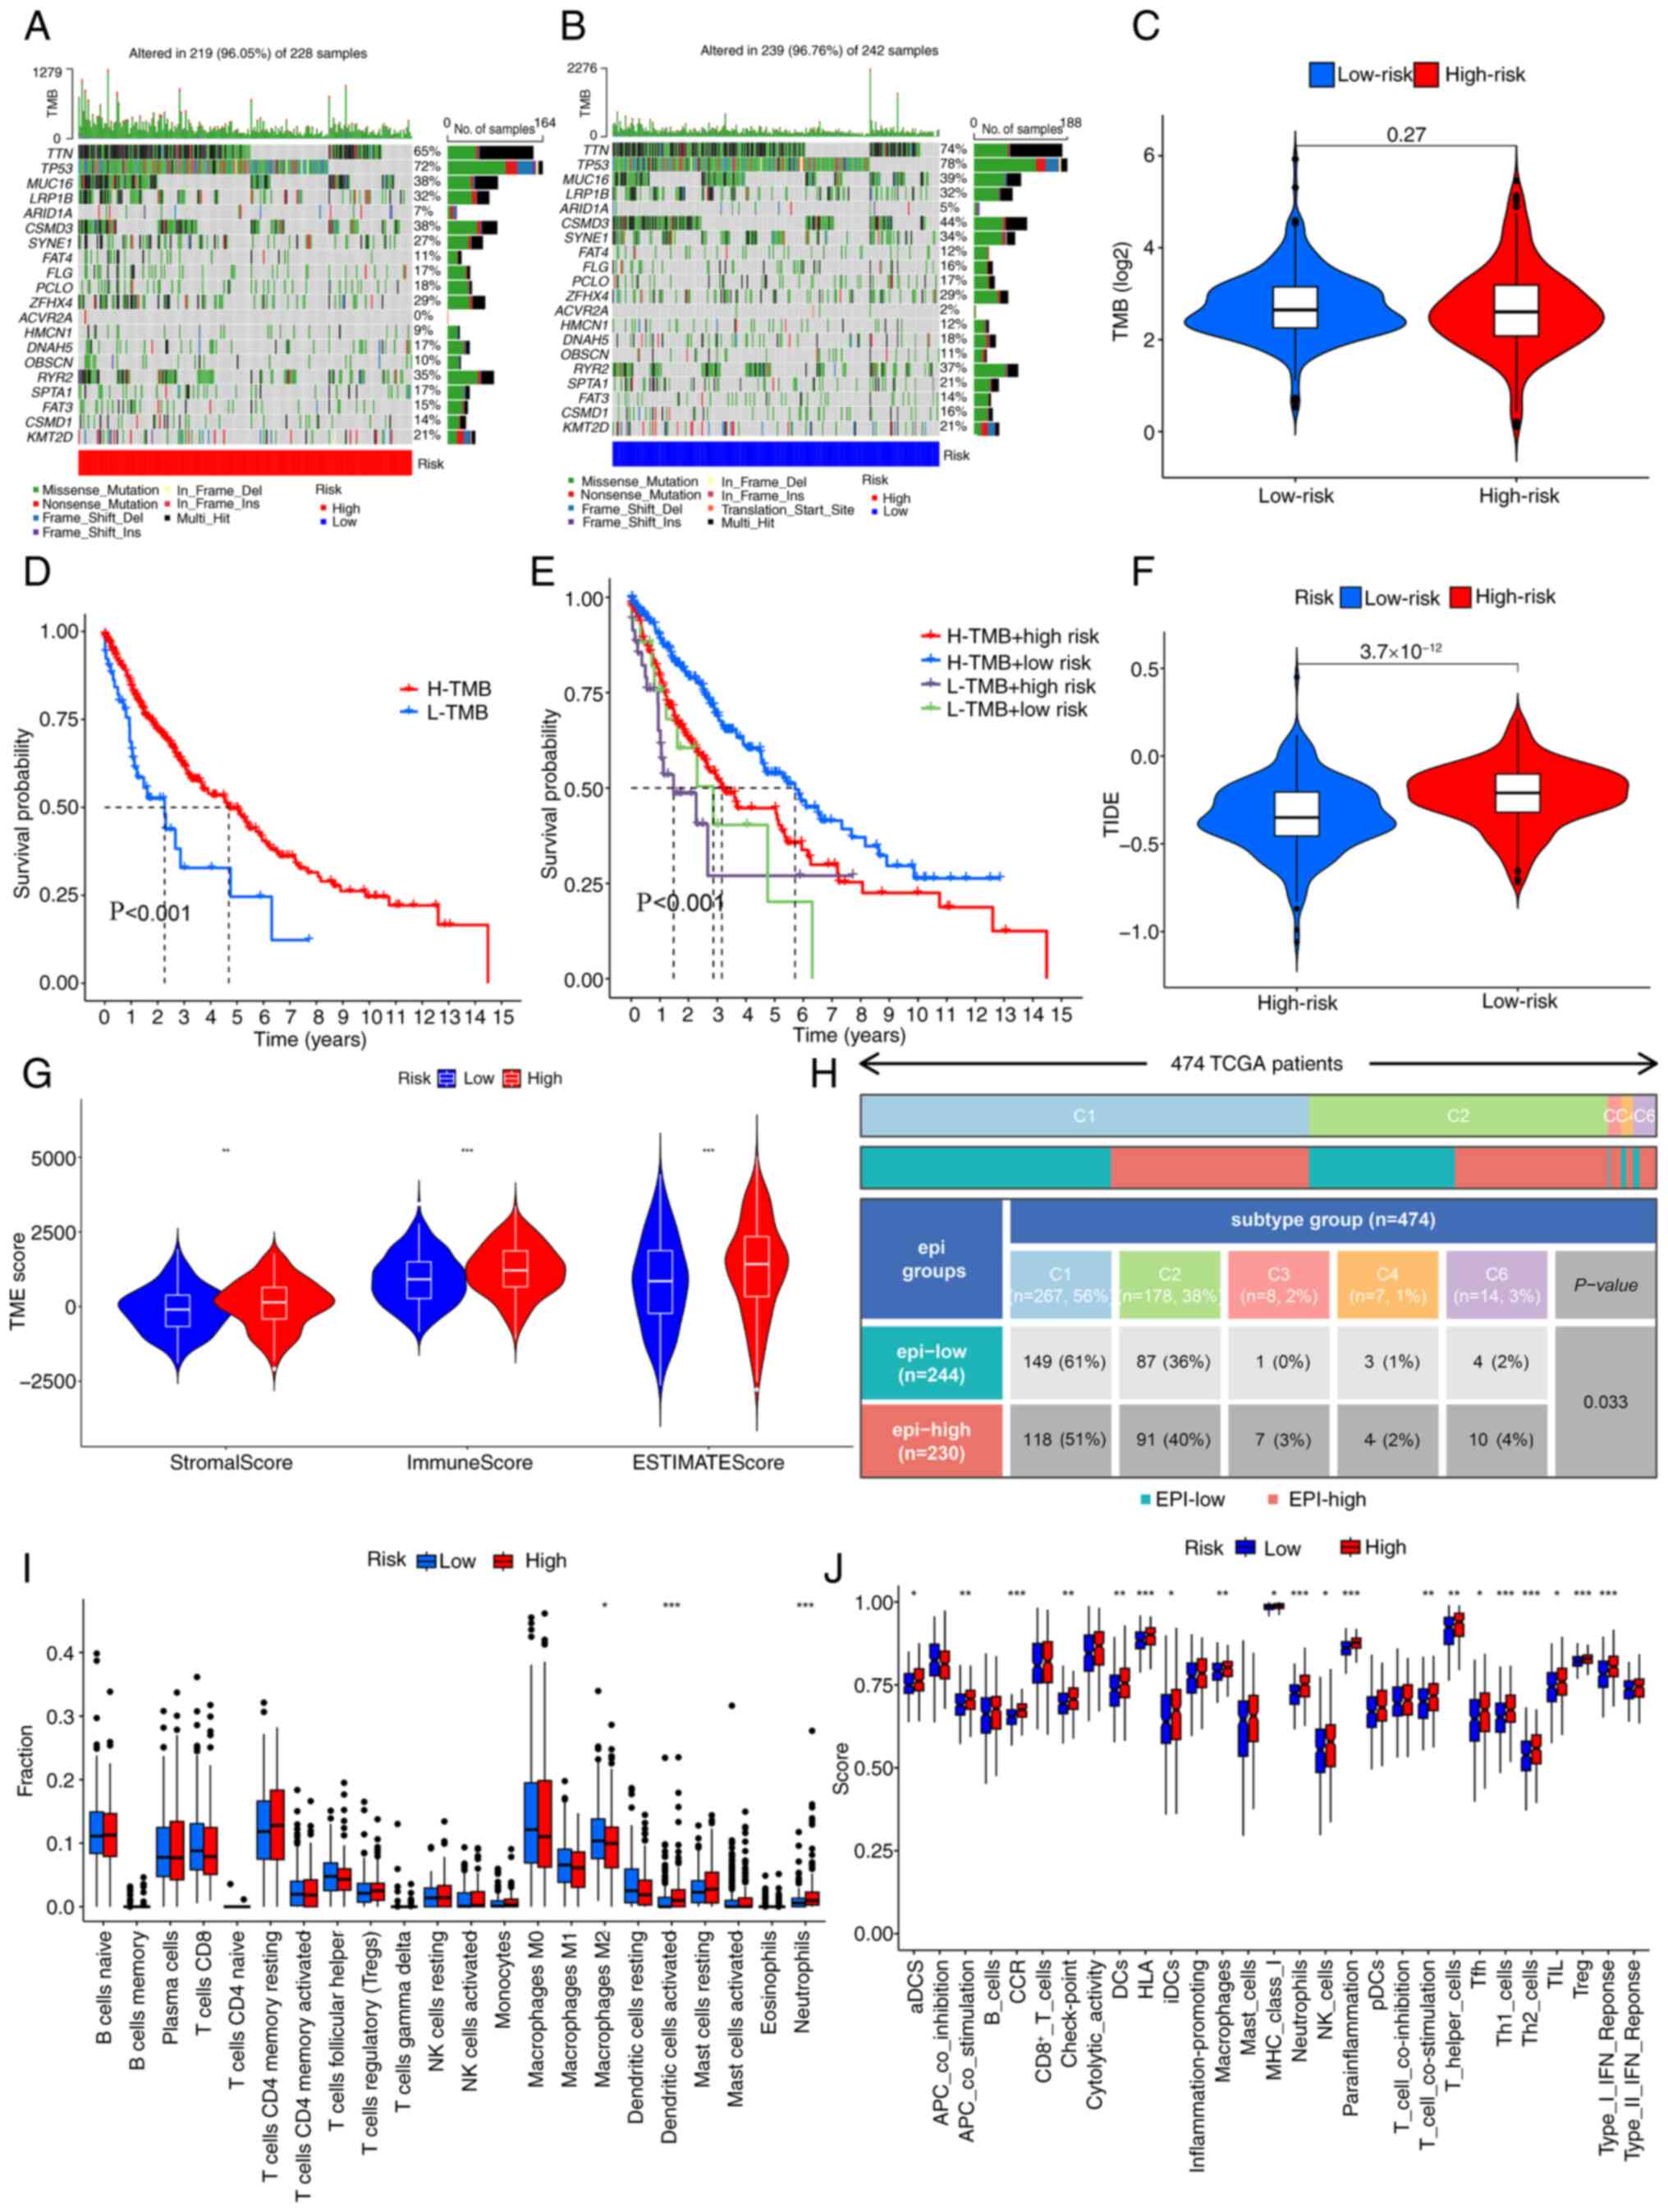
Tumor immune correlation analysis of
LUSC
The tumor mutation load was assessed in different
risk populations. It was demonstrated that the most common
mutations in the population were titin and MUC16 (Fig. 7A and B). When comparing TMB across
different risk groups, no significant difference was observed
(Fig. 7C). Consequently, the
outcomes of patients with high and low TMB levels were analyzed. A
more favorable prognosis was revealed in patients with a lower TMB
than in those with a higher TMB (Fig.
7D). Subsequently, after incorporating the TMB-based risk
model, high-risk and low TMB subgroups demonstrated a significantly
improved prognosis compared with that of the TMB and low-risk
subgroups (Fig. 7E). Although TMB
did not show significant differences when comparing different risk
groups individually, and even though survival was better in the
H-TMB group than in the L-TMB group, after integrating TMB with the
high- and low-risk groups defined by our model, survival
differences still persisted between different risk and TMB groups
(P<0.001). This shows the feasibility of the model in the
present study. Subsequently, differences between TIDE and EIGs were
assessed. A significant difference in TIDE scores was noted between
the two risk groups (Fig. 7F). Due
to the significant involvement of epithelial cells in the immune
response and migration of tumors, the infiltration of these cells
along with immune cells was assessed using data from patients with
LUSC. The high-risk cohort exhibited significant variances in
matrix scores, immune scores and estimated scores (Fig. 7G). Furthermore, the two risk
populations demonstrated markedly different immune types (P=0.033;
Fig. 7H). CIBERSORT analysis
revealed that in high-risk cases, the proportion of activated
dendritic cells, neutrophils and M2 macrophages was markedly higher
when contrasted with the levels found in other immune cell
populations. (Fig. 7I). Finally,
the ssGSEA algorithm revealed a markedly high level of resting
dendritic cells and neutrophils in the high-risk population, in
comparison with the low-risk population (Fig. 7J).
Immune checkpoint genes and
IMvigor210
To further assess the role of epithelial cells as
genetic predictors of immunotherapy efficacy, 210 patients in the
IMvigor210 cohort were analyzed. Survival analysis revealed
significantly lower survival rates after immunotherapy in high-risk
patients, compared with low-risk patients (Fig. S6A). Subsequently, the IMvigor210
immunotherapy analysis demonstrated that both high- and low-risk
groups exhibited poor sensitivity to immunotherapy (Fig. S6B and C); therefore, immune
checkpoints were searched for again. Immune checkpoint genes, which
are critical for bypassing autoreactivity, represent new targets
for cancer therapy (18). Immune
checkpoint proteins poliovirus replication cell adhesion molecule
and tumor necrosis factor receptor Superfamily Member 14 (TNFRSF14)
exhibit significant differences across various risk groups, and
their expression levels correlate with risk scores. (Fig. S6D-G). Significant disparities were
observed in the correlations between risk scores and a selection of
immune checkpoint proteins, such as cytotoxic
T-lymphocyte-associated protein 4, Inducible T Cell Costimulator
(ICOS), and CD20, etc. (Fig.
S7).
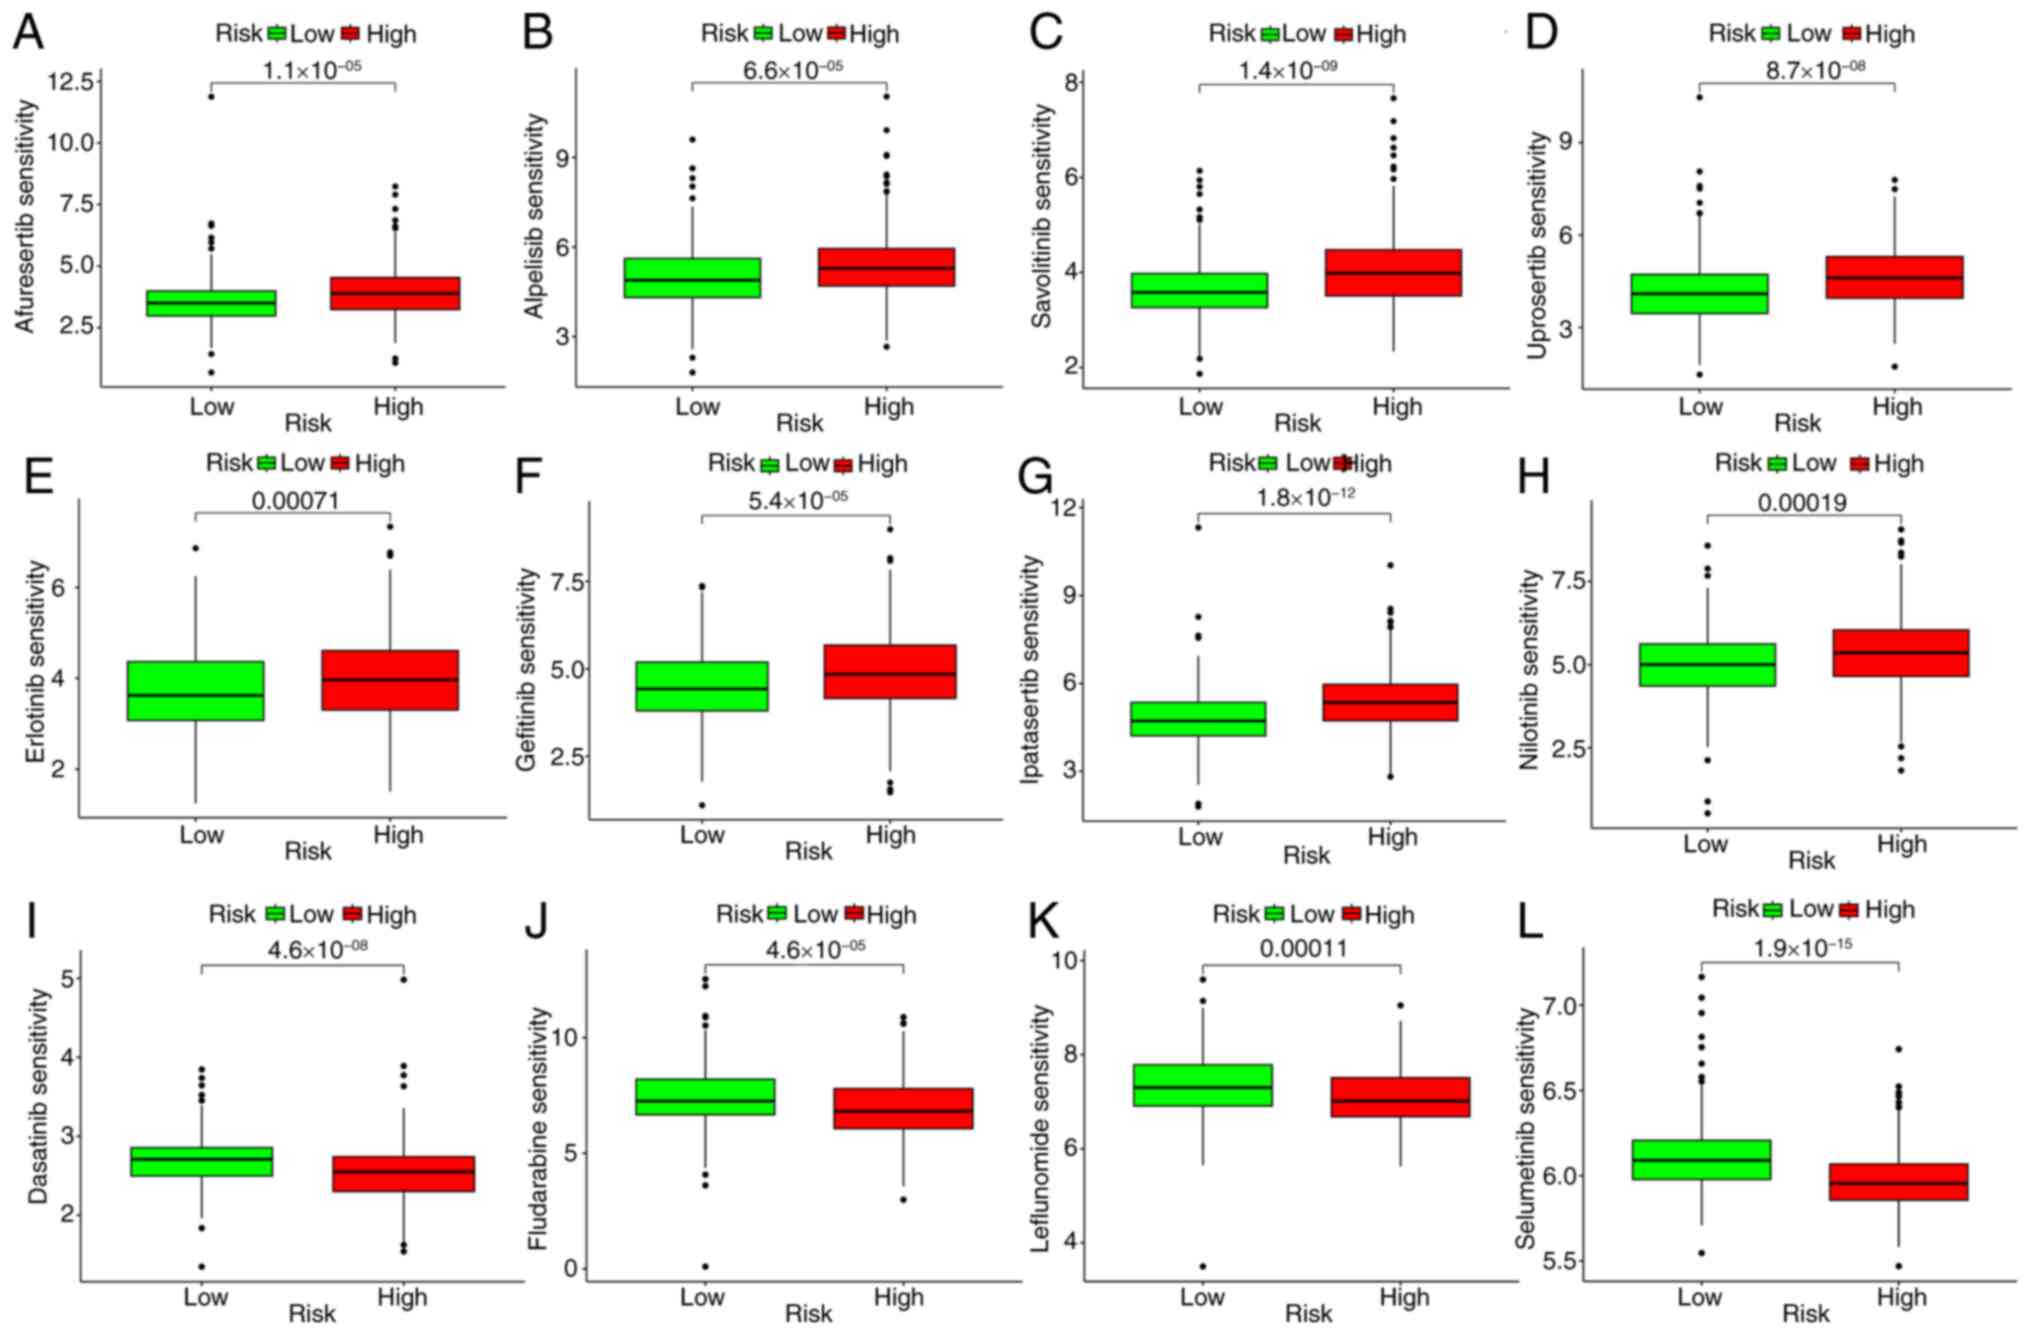
Drug sensitivity test
The present study also evaluated differences in
susceptibility between patients at low risk and those at high risk.
Reduced susceptibility to anticancer drugs, including gefitinib,
savolitinib, ipatasertib, erlotinib, uprosertib, afuresertib,
alpelisib and nilotinib (Fig.
8A-H), was demonstrated in patients at low risk of cancer. The
pharmaceuticals exhibiting heightened sensitivity within the
low-risk cohort are listed in Table
SVI. High-risk patients, on the other hand, had lower
susceptibility to anticancer agents such as dasatinib, fludarabine,
leflunomide, and selumetinib (Fig.
8I-L). Table SVII lists the
drugs that show greater sensitivity in the low-risk group. These
results indicate that EIGs may be good predictors of the efficacy
of anticancer drugs (Table
SVIII).
Validation of in vitro model
genes
Images of immunohistochemical tissue sections of
LUSC and normal tissues obtained from the HPA database demonstrated
the differential expression of the selected EIGs genes in both
tissue types (Fig. S8A). Analyzed
using immunohistochemistry techniques, these sections revealed
marked expression differences between cancerous and normal tissues.
Furthermore, the present study used RT-qPCR to determine the levels
of proteins in LUSC epithelial cells (AREG, FABP6, MUC1 and TSLP).
The results revealed a significantly higher expression of AREG and
MUC1 in normal tissues compared with that in tumor tissues, whereas
there was a significantly higher expression of TSLP and FABP6 in
tumor tissues compared with that in normal tissues (Fig. S8B). Overall, the RT-qPCR results
were consistent with the aforementioned bioinformatics results.
Discussion
LUSC is a prevalent cancer with a typically poor
prognosis (1). Furthermore,
traditional TNM staging is not a good predictor of patient
prognosis and, in parallel, biomarkers are crucial for identifying
biological agents (2). Overall, the
present study demonstrated that the prognostic model based on the
combination of biomarkers and statistical data was superior to that
based on TNM staging. Single-cell analysis, a valuable tool for
studying cell heterogeneity in complex systems, is used to analyze
previously unknown genes in cell populations (6). The results indicate that the risk
scores of four EIGs can act as independent prognostic indicators,
with the high-risk group demonstrating worse prognoses. Therefore,
the nomogram in the present study has high predictive value.
Moreover, the results of immunoinfiltration indicated that the
infiltration of activated dendritic cells and neutrophils was
greater than that of M0 macrophages. Enrichment analysis also
indicated that the presentation of antigens and virus infection may
be related to high-risk subgroups. Therefore, the model could be
used as a reference for the choice of antitumor agents in patients
with LUSC.
The diversity and plasticity of the lung epithelium
serve significant roles in the heterogeneity of lung cancer
(2). Furthermore, a prognostic
model based on the epithelium may be useful for predicting other
types of cancer. Joanito et al (7) established a model for evaluating the
prognosis of patients with colorectal cancer, whilst Chen et
al (8) described the function
of epithelial cells in tumor invasion and metastasis. The model in
the present study has good forecasting value. Based on the
prognostic model, individuals with high-risk EIGs show decreased
survival rates. This disparity is attributed to the greater
invasive and metastatic capabilities of the high-risk subgroup,
leading to a worse prognosis. A total of four prognostic markers
EIGs, AREG, MUC1, FABP6 and TSLP were identified. It has been
reported that AREG, an epidermal growth factor, contributes to the
development of type 2 resistance and tolerability (24). T cells promote fibrotic and
immunosuppressive functional states of cancer-associated
fibroblasts. AREG monoclonal antibody and IL-33 synergistically
inhibit tumor growth (25). MUC1
becomes aberrantly glycosylated in cancers, facilitating the
transition to malignancy, promoting tumor progression, and
contributing to treatment resistance. MUC1 stabilizes the
hypoxia-inducing factor spermidine/spermidine N1-acetyltransferase
1 (SAT1), leading to an increase in SAT1 expression, which induces
carbon flux into the tricarboxylic acid cycle (26). As a result, MUC1 is an important
mark in developing cancer vaccines (27). Inhibiting FABP6 could offer
therapeutic benefits in treating LUSC, making it a promising target
for therapy. At present, there are no published FABP6 inhibitors
available, and the target is considered susceptible to
fragmentation (28). Although TSLP
has been extensively studied in the field of type 2 immunity, more
recent research has identified an increasing role of TSLP in
inflammation and cancer (29). TSLP
induces several cytokines, including IL-13, to affect cell
proliferation by associating with several macrophages (30). The results of these studies indicate
that these genes may be potential targets for experiments to
elucidate the underlying molecular mechanisms of LUSC. In addition,
a number of studies have reported that AREG has an inhibitory
effect in pancreatic cancer and glioma (25,31),
TSLP and MUC1 serve an important role in the pathogenesis of breast
cancer and pancreatic cancer (26,27),
and FABP6 is closely related to digestive system tumors (28). This suggests that other patients
with cancer could also benefit from using the model in the present
study.
In the present study, the molecular mechanisms
involved in disease development process were identified through an
enrichment analysis. GSEA identified several antigen-presenting
pathways related to enrichment in high-risk subgroups. Epithelial
cell surface receptors may mediate tumor immune signaling, which
results in antitumor immunity. Furthermore, KEGG analysis revealed
an association between the incidence of LUSC and several viral
infections, such as human T-cell leukemia virus 1 and Epstein-Barr
virus (EBV), and that EBV infection is characteristic of lung
lymphoepithelioma cancer. Small cell lung cancer is closely linked
to human T-cell leukemia virus 1 infection (32). Therefore, a patient with a high risk
score has a poor prognosis, partly due to the presence of tumor
antigens and viral infection, which are associated with the
proliferation and progression of LUSC. In the present study,
different methodologies were applied to compare immune cell
abundance among the risk groups. The results indicated that in
high-risk tumors, immune cells, especially macrophages and DCs,
were infiltrating, pointing to the essential function of immune
cells in the development of LUSC.
Furthermore, the expression levels of HAVCR2, HLA-A,
CEACAM1, indoleamine 2,3-dioxygenase 1, VTCN1 and TNFRSF14 were
revealed to differ substantially between the two risk groups,
suggesting their potential involvement in the pathogenesis of
tumors. The weak association between immune checkpoint proteins
exhibit a low correlation with risk scores might be attributed to
limited sample size and patient numbers, potentially impairing the
study's statistical power and hindering the identification of
substantial correlations between these proteins and risk scores.
Furthermore, it's possible that after adjustments for multiple
testing, these correlations could cease to be statistically
significant. Among them, the expression of HLA and TNF-α were most
notable. In the same way that infliximab is used to treat breast
cancer and trastuzumab is used to treat severe Crohn's disease
(33,34), we hypothesize that the two
monoclonal antibodies that act on HLA and TNF are potentially
useful in treating LUSC. This may be a potential new discovery in
the field of cancer treatment. To provide guidance for treating
LUSC, 198 different risk groups were assessed and it was
demonstrated that certain agents, such as erlotinib and gefitinib,
have been used as first-line treatments. Notably, most of the drugs
affect EGFR, which is in line with the present research on the
relevant pathways.
The present study has certain merits. Currently, to
the best of our knowledge, there are no other studies that have
reported the success of the EIGs model in predicting the outcome of
LUSC. sc-RNAseq was used to investigate gene expression diversity
at the cellular level. This advanced method is complemented by the
addition of bulk RNA sequencing, allowing us to blend data from
epithelial cell marker genes with immune-related gene sets. The
present model combined epithelial cell biology and tumor immunity,
which has demonstrated a robust predictive capability. To assess
the precision of this risk model, a comparative analysis was
performed with studies of a similar nature. Firstly, compared with
the T-cell-related prognostic model for LUSC constructed by Shi
et al (35), our study
delves more deeply into the immune checkpoint responses and
explores their potential application in guiding anticancer drug
selection for LUSC patients. Second, compared with the fibroblast
model used by Lai et al (36), the model in the present study was
validated using RT-qPCR. However, the research is based on one of
several databases, and additional supporting data are needed.
Therefore, additional clinical investigations are essential to
validate the findings of these studies.
The present study has certain limitations, including
generalizability across different datasets and potential batch
processing effects on results. To mitigate these issues, data was
used from a single source in one database for both experimental and
control groups and randomization was applied. The single-cell
datasets were also sourced from the same institution using
consistent methods. Rather than combining two datasets for
single-cell and large-scale RNA sequencing, gene intersections were
focused on. For external validation with GEO datasets, the ComBat
function from the R package ‘sva’ was used, which removes batch
effects by treating the batch variable as a separate argument. This
produces calibrated measurements, allowing for standard analytical
techniques or further adjustments to eliminate unwanted variation,
thereby enhancing the reliability of the combined datasets.
In conclusion, the model based on EIGs and the
nomogram demonstrated high effectiveness in predicting prognosis
for patients with LUSC. The high risk group was associated with
viral infections and antigen presentation. Furthermore, drug
sensitivity analysis revealed that the high-risk group exhibited
heightened sensitivity to drugs, such as gefitinib and savolitinib.
However, these conclusions need to be substantiated through further
experimental and clinical studies.
Supplementary Material
Supporting Data
Supporting Data
Acknowledgements
Not applicable.
Funding
The present study was supported by National Natural Science
Foundation of China (grant no. 81560345).
Availability of data and materials
The data generated in the present study may be
requested from the corresponding author.
Authors' contributions
JW, ZL, WZ, ZH, KG, JY and WZ conceived the study,
wrote the manuscript and revised it. JW, ZL, WZ and JY performed
experiments and data analysis. JW, ZL, WZ, ZH, KG, JY and WZ
analysis or contributed to interpretation of data. JW, JY and WZ
also revised the manuscript. JY and JW confirm the authenticity of
all the raw data. All authors have read and approved the final
manuscript, agreed to be accountable for all aspects of the work
and contributed to data analysis as well as drafting or revising
the article.
Ethics approval and consent to
participate
Not applicable.
Patient consent for publication
Not applicable.
Competing interests
The authors declare that they have no competing
interests.
Glossary
Abbreviations
Abbreviations:
|
EIGs
|
epithelial immune-related genes
|
|
DEG
|
differential expression genes
|
|
GSEA
|
gene set enrichment analysis
|
|
KEGG
|
Kyoto Encyclopedia of Genes and
Genomes
|
|
LUSC
|
lung squamous cell carcinoma
|
|
NSCLC
|
non-small cell lung cancer
|
|
OS
|
overall survival
|
|
PCA
|
principal component analysis
|
|
ROC
|
receiver operating characteristic
|
|
TCGA
|
The Cancer Genome Atlas
|
|
TMB
|
tumor mutation burden
|
|
TIDE
|
tumor immune dysfunction and
exclusion
|
References
|
1
|
Bray F, Laversanne M, Sung H, Ferlay J,
Siegel RL, Soerjomataram I and Jemal A: Global cancer statistics
2022: GLOBOCAN estimates of incidence and mortality worldwide for
36 cancers in 185 countries. CA Cancer J Clin. 74:229–263. 2024.
View Article : Google Scholar : PubMed/NCBI
|
|
2
|
Rodak O, Peris-Díaz MD, Olbromski M,
Podhorska-Okołów M and Dzięgiel P: Current landscape of non-small
cell lung cancer: Epidemiology, histological classification,
targeted therapies, and immunotherapy. Cancers (Basel).
13:47052021. View Article : Google Scholar : PubMed/NCBI
|
|
3
|
Piñeros M, Parkin DM, Ward K, Chokunonga
E, Ervik M, Farrugia H, Farrugia H, Gospodarowicz M, O'Sullivan B,
Soerjomataram I, et al: Essential TNM: A registry tool to reduce
gaps in cancer staging information. Lancet Oncol. 20:e103–e111.
2019. View Article : Google Scholar : PubMed/NCBI
|
|
4
|
Bruni D, Angell HK and Galon J: The immune
contexture and immunoscore in cancer prognosis and therapeutic
efficacy. Nat Rev Cancer. 20:662–680. 2020. View Article : Google Scholar : PubMed/NCBI
|
|
5
|
Sands JM, Nguyen T, Shivdasani P, Sacher
AG, Cheng ML, Alden RS, Jänne PA, Kuo FC, Oxnard GR and Sholl LM:
Next-generation sequencing informs diagnosis and identifies
unexpected therapeutic targets in lung squamous cell carcinomas.
Lung Cancer. 140:35–41. 2020. View Article : Google Scholar : PubMed/NCBI
|
|
6
|
Han X, Zhou Z, Fei L, Sun H, Wang R, Chen
Y, Chen H, Wang J, Tang H, Ge W, et al: Construction of a human
cell landscape at single-cell level. Nature. 581:303–309. 2020.
View Article : Google Scholar : PubMed/NCBI
|
|
7
|
Joanito I, Wirapati P, Zhao N, Nawaz Z,
Yeo G, Lee F, Eng CLP, Macalinao DC, Kahraman M, Srinivasan H, et
al: Single-cell and bulk transcriptome sequencing identifies two
epithelial tumor cell states and refines the consensus molecular
classification of colorectal cancer. Nat Genet. 54:963–975. 2022.
View Article : Google Scholar : PubMed/NCBI
|
|
8
|
Chen HT, Liu H, Mao MJ, Tan Y and Mo XQ:
Crosstalk between autophagy and epithelial-mesenchymal transition
and its application in cancer therapy. Mol Cancer. 18:1012019.
View Article : Google Scholar : PubMed/NCBI
|
|
9
|
Huang Z, Wu C, Liu X, Lu S, You L, Guo F,
Stalin A, Zhang J, Zhang F, Wu Z, et al: Single-cell and bulk RNA
sequencing reveal malignant epithelial cell heterogeneity and
prognosis signatures in gastric carcinoma. Cells. 11:25502022.
View Article : Google Scholar : PubMed/NCBI
|
|
10
|
Yu K, Lin CJ, Hatcher A, Lozzi B, Kong K,
Huang-Hobbs E, Cheng YT, Beechar VB, Zhu W, Zhang Y, et al: PIK3CA
variants selectively initiate brain hyperactivity during
gliomagenesis. Nature. 578:166–171. 2020. View Article : Google Scholar : PubMed/NCBI
|
|
11
|
Aran D, Looney AP, Liu L, Wu E, Fong V,
Hsu A, Chak S, Naikawadi RP, Wolters PJ, Abate AR, et al:
Reference-based analysis of lung single-cell sequencing reveals a
transitional profibrotic macrophage. Nat Immunol. 20:163–172. 2019.
View Article : Google Scholar : PubMed/NCBI
|
|
12
|
Cao J, Spielmann M, Qiu X, Huang X,
Ibrahim DM, Hill AJ, Zhang F, Mundlos S, Christiansen L, Steemers
FJ, et al: The single-cell transcriptional landscape of mammalian
organogenesis. Nature. 566:496–502. 2019. View Article : Google Scholar : PubMed/NCBI
|
|
13
|
Wang Q, Qiao W, Zhang H, Liu B, Li J, Zang
C, Mei T, Zheng J and Zhang Y: Nomogram established on account of
Lasso-Cox regression for predicting recurrence in patients with
early-stage hepatocellular carcinoma. Front Immunol.
13:10196382022. View Article : Google Scholar : PubMed/NCBI
|
|
14
|
Li H, Han D, Hou Y, Chen H and Chen Z:
Statistical inference methods for two crossing survival curves: A
comparison of methods. PLoS One. 10:e01167742015. View Article : Google Scholar : PubMed/NCBI
|
|
15
|
Huang J, Zhang JL, Ang L, Li MC, Zhao M,
Wang Y and Wu Q: Proposing a novel molecular subtyping scheme for
predicting distant recurrence-free survival in breast cancer
post-neoadjuvant chemotherapy with close correlation to metabolism
and senescence. Front Endocrinol (Lausanne). 14:12655202023.
View Article : Google Scholar : PubMed/NCBI
|
|
16
|
Petegrosso R, Li Z and Kuang R: Machine
learning and statistical methods for clustering single-cell
RNA-sequencing data. Brief Bioinform. 21:1209–1223. 2020.
View Article : Google Scholar : PubMed/NCBI
|
|
17
|
Smith-Miles K and Geng X: Revisiting
facial age estimation with new insights from instance space
analysis. IEEE Trans Pattern Anal Mach Intell. 44:2689–2697. 2022.
View Article : Google Scholar : PubMed/NCBI
|
|
18
|
Singh S, Singh VK and Rai G:
Identification of differentially expressed hematopoiesis-associated
genes in term low birth weight newborns by systems genomics
approach. Curr Genomics. 20:469–482. 2022. View Article : Google Scholar : PubMed/NCBI
|
|
19
|
Postow MA, Sidlow R and Hellmann MD:
Immune-related adverse events associated with immune checkpoint
blockade. N Engl J Med. 378:158–168. 2018. View Article : Google Scholar : PubMed/NCBI
|
|
20
|
Xie T, Peng S, Liu S, Zheng M, Diao W,
Ding M, Fu Y, Guo H, Zhao W and Zhuang J: Multi-cohort validation
of ascore: An anoikis-based prognostic signature for predicting
disease progression and immunotherapy response in bladder cancer.
Mol Cancer. 23:302024. View Article : Google Scholar : PubMed/NCBI
|
|
21
|
Maeser D, Gruener RF and Huang RS:
oncoPredict: An R package for predicting in vivo or cancer patient
drug response and biomarkers from cell line screening data. Brief
Bioinform. 22:bbab2602021. View Article : Google Scholar : PubMed/NCBI
|
|
22
|
Livak KJ and Schmittgen TD: Analysis of
relative gene expression data using real-time quantitative PCR and
the 2(−Delta Delta C(T)) method. Methods. 25:402–428. 2001.
View Article : Google Scholar : PubMed/NCBI
|
|
23
|
Guénin S, Mauriat M, Pelloux J, Van
Wuytswinkel O, Bellini C and Gutierrez L: Normalization of qRT-PCR
data: The necessity of adopting a systematic, experimental
conditions-specific, validation of references. J Exp Bot.
60:487–493. 2009. View Article : Google Scholar : PubMed/NCBI
|
|
24
|
Zaiss DMW, Gause WC, Osborne LC and Artis
D: Emerging functions of amphiregulin in orchestrating immunity,
inflammation, and tissue repair. Immunity. 42:216–226. 2015.
View Article : Google Scholar : PubMed/NCBI
|
|
25
|
Sun R, Zhao H, Gao DS, Ni A, Li H, Chen L,
Lu X, Chen K and Lu B: Amphiregulin couples IL1RL1+ regulatory T
cells and cancer-associated fibroblasts to impede antitumor
immunity. Sci Adv. 9:eadd73992023. View Article : Google Scholar : PubMed/NCBI
|
|
26
|
Jiang S, Deng T, Cheng H, Liu W, Shi D,
Yuan J, He Z, Wang W, Chen B, Ma L, et al: Macrophage-organoid
co-culture model for identifying treatment strategies against
macrophage-related gemcitabine resistance. J Exp Clin Cancer Res.
42:1992023. View Article : Google Scholar : PubMed/NCBI
|
|
27
|
Murthy D, Attri KS, Suresh V, Rajacharya
GH, Valenzuela CA, Thakur R, Zhao J, Shukla SK, Chaika NV, LaBreck
D, et al: The MUC1-HIF-1α signaling axis regulates pancreatic
cancer pathogenesis through polyamine metabolism remodeling. Proc
Natl Acad Sci USA. 121:e23155091212024. View Article : Google Scholar : PubMed/NCBI
|
|
28
|
Li XX, Wang LJ, Hou J, Liu HY, Wang R,
Wang C and Xie WH: Identification of long noncoding RNAs as
predictors of survival in triple-negative breast cancer based on
network analysis. Biomed Res Int. 2020:89703402020. View Article : Google Scholar : PubMed/NCBI
|
|
29
|
Gao T, Cen Q and Lei H: A review on
development of MUC1-based cancer vaccine. Biomed Pharmacother.
132:1108882020. View Article : Google Scholar : PubMed/NCBI
|
|
30
|
Hendrick AG, Müller I, Willems H, Leonard
PM, Irving S, Davenport R, Ito T, Reeves J, Wright S, Allen V, et
al: Identification and investigation of novel binding fragments in
the fatty acid binding protein 6. J Med Chem. 59:8094–8102. 2020.
View Article : Google Scholar
|
|
31
|
Braile M, Fiorelli A, Sorriento D, Di
Crescenzo RM, Galdiero MR, Marone G, Santini M, Varricchi G and
Loffredo S: Human lung-resident macrophages express and are targets
of thymic stromal lymphopoietin in the tumor microenvironment.
Cells. 10:20122021. View Article : Google Scholar : PubMed/NCBI
|
|
32
|
Corren J and Ziegler SF: TSLP: From
allergy to cancer. Nat Immunol. 20:1603–1609. 2019. View Article : Google Scholar : PubMed/NCBI
|
|
33
|
Matsuzaki H, Asou N, Kawaguchi Y, Hata H,
Yoshinaga T, Kinuwaki E, Ishii T, Yamaguchi K and Takatsuki K:
Human T-cell leukemia virus type 1 associated with small cell lung
cancer. Cancer. 66:1763–1768. 1990. View Article : Google Scholar : PubMed/NCBI
|
|
34
|
Mamtani R, Clark AS, Scott FI, Brensinger
CM, Boursi B, Chen L, Xie F, Yun H, Osterman MT, Curtis JR and
Lewis JD: Association between breast cancer recurrence and
immunosuppression in rheumatoid arthritis and inflammatory bowel
disease: A cohort study. Arthritis Rheumatol. 68:2403–2411. 2016.
View Article : Google Scholar : PubMed/NCBI
|
|
35
|
Shi X, Dong A, Jia X, Zheng G, Wang N,
Wang Y, Yang C, Lu J and Yang Y: Integrated analysis of single-cell
and bulk RNA-sequencing identifies a signature based on T-cell
marker genes to predict prognosis and therapeutic response in lung
squamous cell carcinoma. Front Immunol. 13:9929902022. View Article : Google Scholar : PubMed/NCBI
|
|
36
|
Lai X, Fu G, Du H, Xie Z, Lin S, Li Q and
Lin K: Identification of a cancer-associated fibroblast classifier
for predicting prognosis and therapeutic response in lung squamous
cell carcinoma. Medicine (Baltimore). 102:e350052023. View Article : Google Scholar : PubMed/NCBI
|