Introduction
According to the 2020 Global Cancer Epidemiology
Database (GLOBOCAN), the incidence of esophageal cancer ranks
seventh among all cancer types, and the mortality rate ranks sixth,
with China having the highest proportion of patients with
esophageal cancer (1). The 2023
National Cancer Report by the China Cancer Center showed that there
were 253,000 new patients with esophageal cancer in China in 2016.
Patients with esophageal cancer impose a heavy burden on society,
and thus, improving treatment outcomes and reducing mortality rates
is of great importance. Patients with esophageal cancer often
suffer from dysphagia or digestive obstructions, resulting in a
higher incidence of malnutrition (2). Malnutrition not only affects treatment
plans but may also increase the likelihood of complications and
mortality rates, lower a patient's quality of life and subsequently
impact clinical outcomes (3,4).
Currently, guidelines and standards for nutritional support therapy
for tumors have been established both domestically and
internationally (5,6). Patients with esophageal cancer should
undergo nutritional risk screening, assessment, and related
guidance and treatment before, during and after treatment.
The Nutritional Risk Screening 2002 (NRS2002) is a
nutritional assessment tool developed by an expert group led by
Kondrup under the European Society for Clinical Nutrition and
Metabolism in 2002, based on 128 randomized controlled clinical
studies (7). It has high
evidence-based credibility and effectively identifies the
nutritional risk of hospitalized patients, for whom reasonable
nutritional support should be provided. The Global Leadership
Initiative on Malnutrition (GLIM) is a diagnostic standard for
malnutrition jointly developed by the four major global nutrition
societies in 2018, aiming to unify the diagnostic standards for
malnutrition (6). The
Patient-generated Subjective Global Assessment (PG-SGA), adapted by
Ottery (8) in 1994, is based on the
SGA scale (9) and is a subjective
assessment method designed for patients with cancer. The PG-SGA is
the preferred method for the nutritional assessment of patients
with cancer and is recommended by the Academy of Nutrition and
Dietics and the Professional Committee on Tumor Nutrition and
Supportive Care, China Anti-Cancer Association (10). In addition, certain indicators, such
as albumin and cholesterol, can serve as references for nutritional
assessment. In recent years, certain inflammatory and immune
indicators have been significantly associated with the prognosis of
various types of cancer (11,12),
such as the neutrophil-to-lymphocyte ratio (NLR) for
gastroesophageal tumours, platelet-to-lymphocyte ratio (PLR) for
small cell lung cancer, nutritional prognostic index (PNI) for
hepatocellular carcinoma and systemic immune-inflammation index
(SII) for small cell lung cancer. Additionally, malnutrition is
related to inflammation and immune status. Thus, studying the
association between these indicators, malnutrition and its risks
may assist in identifying novel clinical markers that can be used
to diagnose or predict malnutrition. Currently, there is a wide
array of tools for assessing malnutrition and numerous
nutrition-related indicators. However, the variations in their
effectiveness and accuracy pose challenges in clinical practice.
The aim of the present study was to explore the efficacy of some of
these tools and indicators for assessing malnutrition in patients
with esophageal cancer.
Patients and methods
Patients and study design
The present study was a single-center
cross-sectional study of patients newly diagnosed with esophageal
cancer at Tengzhou Central People's Hospital (Tengzhou, China)
between January 2023 and December 2023. The inclusion criteria were
as follows: i) Esophageal malignancy pathologically diagnosed
within 8 weeks before enrollment, staged III–IV according to the
Tumor Node Metastasis (TNM) Classification of Malignant Tumours,
8th edition (13) developed by the
Union for International Cancer Control and the American Joint
Committee on Cancer; ii) age, ≥18 years; iii) expected survival
time, ≥3 months; and iv) voluntary participation with signed
informed consent. The exclusion criteria were as follows: i)
Pregnant or lactating women; ii) patients with severe mental
illness and poor compliance; or iii) patients with other diseases
that may affect the study results such as the presence of two or
more tumors or esophageal fistula.
A total of 160 patients with esophageal cancer were
recruited to investigate the incidence of malnutrition, differences
in diagnostic methods, and the role and potential application value
of nutritional, inflammatory and immune indicators such as NLR,
PLR, PNI and SII in nutritional risk assessment.
The present study was approved by the Medical Ethics
Committee of Tengzhou Central People's Hospital (approval no.
2023-Ethics Review-02). Prior to patient testing, the patients and
representatives were fully informed, and signed informed consent
was obtained from the patient or their designated
representative.
NRS2002, GLIM and PG-SGA
evaluation
Within 24 h of admission, patients were assessed for
nutritional risk using NRS2002. The NRS2002 includes three aspects:
Disease severity, nutritional status and age. A score of ≥3
(high-risk) indicates a risk of malnutrition and a score of <3
(low risk) indicates no risk of malnutrition. Based on whether
NRS2002 screening was performed, all patients underwent GLIM
diagnosis, resulting in two outcomes: i) GLIM diagnosis for
patients with NRS2002 scores ≥3 (NRS2002-GLIM group) or ii) a
direct GLIM diagnosis for all patients (GLIM group). The GLIM
criteria encompass two aspects, namely phenotypical and etiological
indicators. Phenotypical indicators include involuntary weight
loss, low body mass index (BMI) and loss of muscle mass, while
etiological indicators include reduced food intake/absorption and
inflammation/disease burden. The presence of any one indicator from
each category is adequate for a diagnosis of malnutrition, which
can be further categorized as moderate or severe malnutrition.
Simultaneously, PG-SGA was employed for the nutritional assessment
of patients. This assessment method consists of self-assessment and
healthcare professional assessment components, with assessment
outcomes classified as well-nourished or mildly malnourished (0–3
points), suspected or moderately malnourished (4–8 points) and
severely malnourished (≥9 points).
Physical and laboratory
examinations
Patient's sex, age, height, weight and fasting blood
results before treatment, including neutrophil, lymphocyte and
platelet counts, albumin, cholesterol, interleukin-6 (IL-6) and
tumor necrosis factor-α (TNF-α) levels, and peripheral blood
cluster of differentiation 3-positive/programmed cell death protein
1-postive (CD3+PD-1+),
CD4+PD-1+ and CD8+PD-1+
cell counts.
Calculation of relevant
indicators
The following parameters were calculated using the
following formulae: NLR=neutrophil count
(×109/l)/lymphocyte count (×109/l);
PLR=platelet count (×109/l)/lymphocyte count
(×109/l); PNI=serum albumin level (g/l) + 5 × lymphocyte
count (×109/l); SII=platelet count (×109/l) ×
neutrophil count (×109/l)/lymphocyte count
(×109/l); and BMI=weight (kg)/height2
(m2).
Statistical analysis
Data analysis was performed using SPSS version 23.0
(IBM Corp.). A Shapiro-Wilk normality test was used to assess for
normality. Discrete data are presented as numbers or percentages
and compared using a χ2 test. Normally distributed
continuous data are presented as the mean ± SD, and were compared
using an independent samples t-test for comparisons between two
independent groups or a one-way ANOVA for comparison between ≥3
groups, and the post-hoc test performed after ANOVA was the
Bonferroni method. Non-normally distributed data are presented as
the median and interquartile range and were compared using a
non-parametric test - the Mann-Whitney U-test was used for two
samples, the Kruskal-Wallis test was used for three samples, and
the Bonferroni method was used to correct for significance level
for post-hoc testing. The consistency was assessed using a κ test,
with κ values of 0.2–0.4 indicating weak consistency, values of
0.4–0.6 indicating moderate consistency and values of 0.6–0.8
indicating strong consistency. Spearman's correlation analysis was
employed for assessing relationships, with correlations ranging
from 0–0.2 considered very weak, 0.2–0.4 weak and 0.4–0.7 moderate.
Among the 160 samples in the present study, 7 samples had missing
data, accounting for <5% of the total. Specifically, albumin
level and neutrophil count each had one missing data point, with a
missing proportion of 0.623, IL-6 level had five missing data
points, with a missing proportion of 3.13%, and PNI had two missing
data points, with a missing proportion of 1.25%. To explore the
influencing factors of PG-SGA and GLIM, the method of multiple
imputation was applied. Mean imputation, median imputation and mode
imputation assign a specific value based on known data, while
multiple imputation, in this study facilitated by the R4.1.3
language Multivariate Imputation by Chained Equations package with
5 imputations, generated 5 datasets, each yielding distinct
results. This method, grounded in Bayesian estimation, posits that
the values to be imputed are random, thereby reducing bias. The
Akaike Information Criterion values across the five datasets were
equivalent (14), one dataset was
randomly selected for multivariate logistic regression, a criterion
of P<0.100 in univariate analysis was employed as the threshold
for inclusion in the logistic regression model, and the results
were analyzed using a receiver operating characteristic (ROC)
curve. P<0.05 was considered to indicate a statistically
significant difference.
Results
Baseline characteristics, prevalence
of nutritional risk and malnutrition of the population
Based on the inclusion and exclusion criteria, a
total of 160 newly diagnosed patients with stage III–IV esophageal
cancer were enrolled, consisting of 117 men (73.13%) and 43 women
(26.88%), aged 18–84 years [median age, 69 (interquartile range,
61–74) years]. According to the NRS2002, there were 76 patients
(47.50%) in the high-risk group and 84 patients (52.50%) in the
low-risk group. Following NRS2002 screening, 66 individuals
(41.25%) were considered to exhibit malnutrition. When using GLIM
without prior NRS2002 screening, 83 individuals (51.88%) were
considered to exhibit malnutrition. Subsequently, utilizing the
unscreened GLIM as the standard, these individuals were further
categorized into moderate malnutrition (35 individuals, 21.88%) and
severe malnutrition (48 individuals, 30.00%). Regarding PG-SGA
scores, 40 individuals (25.00%) were classified as well-nourished
or mildly malnourished, 53 individuals (33.13%) as suspected or
moderately malnourished, and 67 individuals (41.88%) as severely
malnourished. These results indicate that the proportion of
malnutrition assessed by PG-SGA was the highest, followed by GLIM
assessment, with NRS2002-GLIM showing the lowest proportion of
malnutrition.
Consistency testing between PG-SGA and
GLIM standards
Based on the aforementioned results, malnutrition
was defined as a PG-SGA score of ≥4, and its consistency with GLIM
was assessed. The κ value between the PG-SGA and the GLIM tools was
0.379, indicating a moderate to weak level of consistency. The
sensitivity was 64.17%, the specificity was 85.00%, the positive
predictive value was 92.77% and the negative predictive value was
44.16%. Compared with PG-SGA and NRS2002-GLIM, the κ value was
0.376, indicating a generally weak consistency. The sensitivity was
55.00%, the specificity was 100.00%, the positive predictive value
was 100.00% and the negative predictive value was 42.55% (Table I). The κ value between the
NRS2002-GLIM and the unscreened GLIM was 0.789, indicating a
relatively strong level of consistency. The sensitivity was 79.50%,
the specificity was 100%, the positive predictive value was 100%
and the negative predictive value was 81.91%. Additionally, a
McNemar test was performed, revealing statistically significant
differences (Table II).
 | Table I.Agreement between GLIM and
PG-SGA. |
Table I.
Agreement between GLIM and
PG-SGA.
|
| Malnourished |
|
|
|
|
|
|
|---|
|
|
|
|
|
|
|
|
|
|---|
| Screening | PG-SGA | GLIM | Sensitivity, % | Specificity, % | κ | P-value | PPV, % | NPV, % |
|---|
| Without
screening | 120 | 83 | 64.17 | 85.00 | 0.379 | <0.001 | 92.77 | 44.16 |
| NRS2002-GLIM | 120 | 66 | 55.00 | 100.00 | 0.376 | <0.001 | 100.00 | 42.55 |
| Table II.Agreement between GLIM with and
without NRS2002 screening. |
Table II.
Agreement between GLIM with and
without NRS2002 screening.
|
| GLIM without
screening |
|
|
|
|
|
|
|---|
|
|
|
|
|
|
|
|
|
|---|
| NRS2002-GLIM | Malnourished | Normal | Sensitivity, % | Specificity, % | κ | P-value | PPV, % | NPV, % |
|---|
| Malnourished | 66 | 0 | 79.50 | 100.00 | 0.789 | <0.001 | 100.00 | 81.91 |
| Normal | 17 | 77 |
|
|
|
|
|
|
Association between PG-SGA scores and
related nutritional and inflammatory indicators
Based on PG-SGA scores, statistically significant
differences (P<0.05) were observed for age, neutrophil count,
albumin level, IL-6 level and BMI among the three malnutrition
groups. No statistically significant differences were found in
terms of sex, cholesterol level, lymphocyte count, platelet count,
TNF-α level, CD3+PD-1+,
CD4+PD-1+ and CD8+PD-1+
cell counts, and PNI, NLR, SII or PLR. Correlation analysis between
PG-SGA and nutritional as well as inflammatory markers revealed a
moderate negative correlation with BMI (rs=−0.460), weak
positive correlations with age (rs=0.234) and IL-6 level
(rs=0.249), and very weak negative correlations with
albumin level (rs=−0.178) and PNI (rs=−0.168)
(Table III).
| Table III.Association between PG-SGA and
related nutritional and inflammatory indicators. |
Table III.
Association between PG-SGA and
related nutritional and inflammatory indicators.
| Variable | Mild
malnutrition | Moderate
malnutrition | Severe
malnutrition |
F/χ2 | P-value for
F/χ2 | rs | P-value for
rs |
|---|
| Agea | 62.18±11.99 | 67.17±8.32 | 68.58±9.22 | 5.629 | 0.004b | 0.234 | 0.003b |
| Sexc |
|
|
| 0.140 | 0.933 | - | - |
|
Male | 29 (72.50) | 38 (71.70) | 50 (74.63) |
|
|
|
|
|
Female | 11 (27.50) | 15 (28.30) | 17 (25.37) |
|
|
|
|
| ALBd | 36.13 (40.25,
43.10) | 36.25 (40.50,
3.30) | 35.45 (37.75,
0.45) | 6.432 | 0.040e | −0.178 | 0.024e |
| TCa | 4.29±1.17 | 4.35±0.96 | 4.52±0.96 | 0.734 | 0.482 | 0.099 | 0.224 |
| NEUd | 3.05 (4.08,
5.14) | 2.61 (3.64,
4.68) | 3.24 (4.22,
6.32) | 8.044 | 0.018e | 0.124 | 0.121 |
| LYMd | 1.06 (1.41,
1.84) | 1.00 (1.34,
1.59) | 0.99 (1.30,
1.67) | 0.820 | 0.663 | −0.056 | 0.482 |
| PLTa | 266.75±97.50 | 237.96±77.13 | 253.75±101.46 | 1.117 | 0.330 | 0.004 | 0.961 |
| IL-6d | 2.33 (4.66,
8.86) | 2.59 (5.94,
11.41) | 4.12 (7.78,
15.59) | 9.682 | 0.008b | 0.249 | 0.002b |
| TNF-αd | 0.47
(0.76,2.34) | 0.43 (0.81,
1.73) | 0.48 (0.99,
1.93) | 0.300 | 0.861 | 0.038 | 0.640 |
|
CD3+PD-1+d | 4.15 (6.60,
15.55) | 2.50 (6.50,
11.85) | 3.85 (7.60,
12.00) | 1.669 | 0.434 | −0.005 | 0.946 |
|
CD4+PD-1+d | 2.80 (6.90,
11.25) | 2.35 (3.70,
7.90) | 3.25 (6.00,
10.05) | 4.060 | 0.131 | 0.004 | 0.958 |
|
CD8+PD-1+d | 1.10 (2.40,
4.20) | 0.60 (1.40,
3.35) | 0.90 (2.00,
4.15) | 3.370 | 0.185 | −0.034 | 0.672 |
| BMIa | 24.13±3.39 | 23.07±3.50 | 20.41±2.58 | 20.780 |
<0.001f | −0.460 |
<0.001f |
| PNIa | 48.15±9.02 | 46.70±5.34 | 44.92±6.86 | 2.705 | 0.070 | −0. 168 | 0.035e |
| NLRd | 2.04 (2.78,
3.89) | 2.02 (2.73,
4.47) | 2.20 (3.37,
5.74) | 4.301 | 0.116 | 0.148 | 0.062 |
| SIId | 472.52 (728.96,
1,097.04) | 409.29 (718.37,
938.05) | 482.17 (741.16,
1,600.65) | 2.098 | 0.350 | 0.04 | 0.615 |
| PLRd | 138.75 (175.23,
269.60) | 138.82 (183.17,
246.66) | 134.86 (196.87,
265.04) | 0.178 | 0.915 | 0.021 | 0.790 |
Regarding the classification based on the GLIM
criteria, statistically significant differences were found for age,
albumin level, BMI and PNI among the three nutritional status
groups (P<0.05). No statistically significant differences were
observed in the other indicators. Correlation analysis between the
GLIM classification and nutritional as well as inflammatory markers
showed a moderate negative correlation with BMI
(rs=−0.627), weak positive correlations with age
(rs=0.207) and IL-6 level (rs=0.177), and
weak negative correlations with albumin level
(rs=−0.264) and PNI (rs=0.247). The
indicators showing correlations with both PG-SGA and GLIM were
consistent, albeit with slight variations in the strength of the
correlations (Table IV).
| Table IV.Relationship between GLIM and related
nutritional and inflammatory indicators. |
Table IV.
Relationship between GLIM and related
nutritional and inflammatory indicators.
| Variables | Normal
nutrition | Moderate
malnutrition | Severe
malnutrition |
F/χ2 | P-value for
F/χ2 | rs | P-value for
rs |
|---|
| Agea | 65 (58.5,
73.5) | 69 (60, 71) | 71.5 (65.25,
75.00) | 7.702 | 0.021b | 0.207 | 0.009c |
| Sexd |
|
|
| 2.410 | 0.300 | - | - |
|
Male | 53 (68.83) | 29 (82.86) | 35 (72.92) |
|
|
|
|
|
Female | 24 (31.17) | 6 (17.14) | 13 (27.08) |
|
|
|
|
| ALBa | 40.50 (36.65,
43,30) | 38.10 (36.20,
41.78) | 37.65 (33.78,
40.26) | 11.055 | 0.004c | −0.264 |
<0.001e |
| TCf | 4.36±1.07 | 4.57±0.94 | 4.35±0.99 | 0.565 | 0.569 | 0.004 | 0.957 |
| NEUa | 3.94 (3.02,
5.12) | 4.09 (2.69,
5.46) | 4.06 (2.78,
5.98) | 0.322 | 0.852 | 0.043 | 0.597 |
| LYMa | 1.40 (1.04,
1.67) | 1.28 (0.94,
1.82) | 1.29 (0.93,
1.54) | 1.193 | 0.551 | −0.087 | 0.278 |
| PLTf | 248.39±87.20 | 244.00±95.56 | 262.86±102.23 | 0.510 | 0.602 | 0.090 | 0.257 |
| IL-6a | 5.38 (2.42,
7.80) | 7.93 (3.86,
16.01) | 7.46 (2.96,
14.30) | 2.270 | 0.321 | 0.177 | 0.027b |
| TNF-αa | 0.81 (0.44,
1.82) | 0.83 (0.55,
1.72) | 0.92 (0.40,
2.12) | 0.028 | 0.986 | −0.013 | 0.868 |
|
CD3+PD-1+a | 6.30 (3.13,
13.00) | 8.60 (3.18,
11.80) | 8.50 (4.00,
13.70) | 2.112 | 0.348 | 0.114 | 0.159 |
|
CD4+PD-1+a | 4.5 (2.48,
8.70) | 5.50 (3.15,
8.45) | 6.50 (3.50,
10.20) | 2.056 | 0.358 | 0.105 | 0.194 |
|
CD8+PD-1+a | 1.95 (0.80,
3.58) | 1.75 (0.48,
4.23) | 1.80 (0.90,
3.80) | 0.027 | 0.987 | −0.013 | 0.871 |
| BMIa | 23.60 (22.05,
26.09) | 21.30 (19.80,
22.90) | 18.95 (17.93,
20.65) | 62.465 |
<0.001e | −0.627 |
<0.001e |
| PNIa | 47.55 (43.95,
51.48) | 44.90 (41.64,
49.36) | 44.05 (41.05,
47.25) | 9.662 | 0.008c | 0.247 | 0.002c |
| NLRa | 2.80 (2.09,
3.95) | 3.27 (1.88,
4.99) | 3.06 (2.19,
5.22) | 1.219 | 0.544 | 0.087 | 0.274 |
| SIIa | 1,032.30 (640.70,
1,256.96) | 987.35 (511.94,
1,476.49) | 1,055.60 (575.75,
1,550.01) | 0.437 | 0.804 | 0.044 | 0.850 |
| PLRa | 177.89 (135.20,
229.07) | 191.55 (122.33,
280.95) | 219.76 (151.51,
270.24) | 3.302 | 0.192 | 0.139 | 0.081 |
Logistic regression analysis of PG-SGA
and GLIM scores
Using PG-SGA scores divided into three groups as the
dependent variable, based on the aforementioned test results,
statistically significant variables, including age, albumin level,
neutrophil count, IL-6 level and BMI, were included in a logistic
regression model. Additionally, PNI was also included in the model
due to a P-value of <0.100. Using severe malnutrition as the
reference group, the results revealed that age of the mild
malnutrition group, and the neutrophil count and BMI of the mild
and moderate malnutrition group, were independent risk factors for
malnutrition. The probability of severe malnutrition increased with
age, higher neutrophil count and lower BMI (Table V).
| Table V.Logistic regression analysis of
PG-SGA and GLIM.d |
Table V.
Logistic regression analysis of
PG-SGA and GLIM.d
| A, PG-SGA |
|---|
|
|---|
| Group | Variable | β | Standard error | Odds ratio | Wald index | 95% confidence
interval | P-value |
|---|
| Mild malnutrition
group | Intercept | −3.924 | 2.953 | - | 1.766 | - | - | 0.184 |
|
| Age | −0.070 | 0.027 | 0.932 | 6.883 | 0.884 | 0.982 | 0.009b |
|
| ALB | −0.033 | 0.080 | 0.968 | 0.170 | 0.828 | 1.131 | 0.680 |
|
| NEU | −0.292 | 0.144 | 0.746 | 4.134 | 0.563 | 0.990 | 0.042c |
|
| IL-6 | −0.033 | 0.022 | 0.976 | 2.285 | 0.928 | 1.010 | 0.131 |
|
| BMI | 0.449 | 0.093 | 1.567 | 23.305 | 1.306 | 1.880 |
<0.001d |
|
| PNI | −0.024 | 0.060 | 1.024 | 0.157 | 0.910 | 1.152 | 0.692 |
| Moderate
malnutrition group | Intercept | −4.951 | 2.726 | - | 3.298 | - | - | 0.069 |
|
| Age | −0.025 | 0.025 | 0.975 | 1.026 | 0.928 | 1.024 | 0.311 |
|
| ALB | 0.066 | 0.078 | 1.068 | 0.703 | 0.916 | 1.244 | 0.402 |
|
| NEU | −0.476 | 0.132 | 0.622 | 13.059 | 0.480 | 0.804 |
<0.001d |
|
| IL-6 | 0.000 | 0.007 | 1.000 | 0.000 | 0.986 | 1.014 | 0.999 |
|
| BMI | 0.376 | 0.085 | 1.456 | 19.525 | 1.233 | 1.720 |
<0.001d |
|
| PNI | −0.048 | 0.066 | 0.953 | 0.519 | 0.837 | 1.086 | 0.471 |
|
| B, GLIM |
|
| Group |
Variable | β | Standard
error | Odds
ratio | Wald
index | 95% confidence
interval | P-value |
|
|
Normal/moderate-severe | Intercept | −8.804 | 2.335 | - | 14.215 | −13.38 | −4.227 |
<0.001d |
|
Normal-moderate/severe | Intercept | −7.391 | 2.298 | - | 10.343 | −11.896 | −2.2887 | 0.001d |
|
| Age | 0.041 | 0.02 | 1.042 | 4.309 | 0.002 | 0.08 | 0.0038b |
|
| ALB | 0.029 | 0.061 | 0.971 | 0.229 | −0.15 | 0.091 | 0.632 |
|
| BMI | −0.041 | 0.076 | 0.611 | 41.514 | −0.641 | −0.342 |
<0.001d |
|
| PNI | 0.012 | 0.048 | 1.012 | 0.06 | −0.082 | 0.106 | 0.807 |
Using the three different nutritional statuses based
on the GLIM criteria as the dependent variable, statistically
significant variables were included based on the aforementioned
test results. It was found that age and BMI were independent risk
factors for malnutrition. The probability of malnutrition increased
with age and lower BMI, leading to a higher risk of severe
malnutrition (Table V).
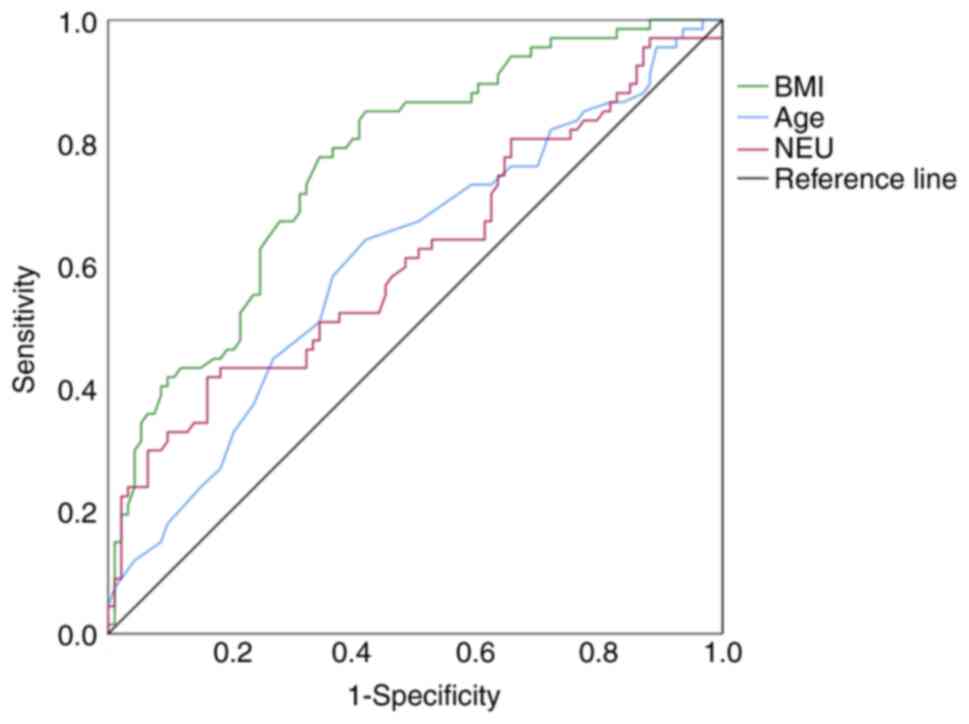
ROC curve analysis
Utilizing the PG-SGA regression equation to
delineate the ROC curve, the results indicated that age, neutrophil
count and BMI had predictive significance for malnutrition. The
optimal cutoff value for age was 68.50 years, with an AUC of 0.610,
a sensitivity of 64.20% and a specificity of 58.10%. For neutrophil
counts, the optimal cutoff value was 9.25×10⁹/l,
yielding an AUC of 0.615, a sensitivity of 41.80% and a specificity
of 83.90%. The optimal cutoff value for BMI was 22.05
kg/m2, resulting in an AUC of 0.765, a sensitivity of
77.60% and a specificity of 65.60% (Table VI; Fig.
1).
| Table VI.AUC values for PG-SGA and GLIM. |
Table VI.
AUC values for PG-SGA and GLIM.
| Scoring method | Variable | AUC (95% CI) | Cut-off | Sensitivity | Specificity | P-value |
|---|
| PG-SGA | NEU | 0.615
(0.521–0.699) | 5.33 | 0.418 | 0.839 | 0.013a |
|
| Age | 0.610
(0.525–0.706) | 68.5 | 0.642 | 0.581 | 0.018a |
|
| BMI | 0.765
(0.692–0.838) | 22.05 | 0.776 | 0.656 |
<0.001b |
| GLIM | Age | 0.597
(0.507–0.686) | 68.50 | 0.627 | 0.610 | 0.035a |
|
| BMI | 0.836
(0.774–0.897) | 22.30 | 0.807 | 0.740 |
<0.001b |
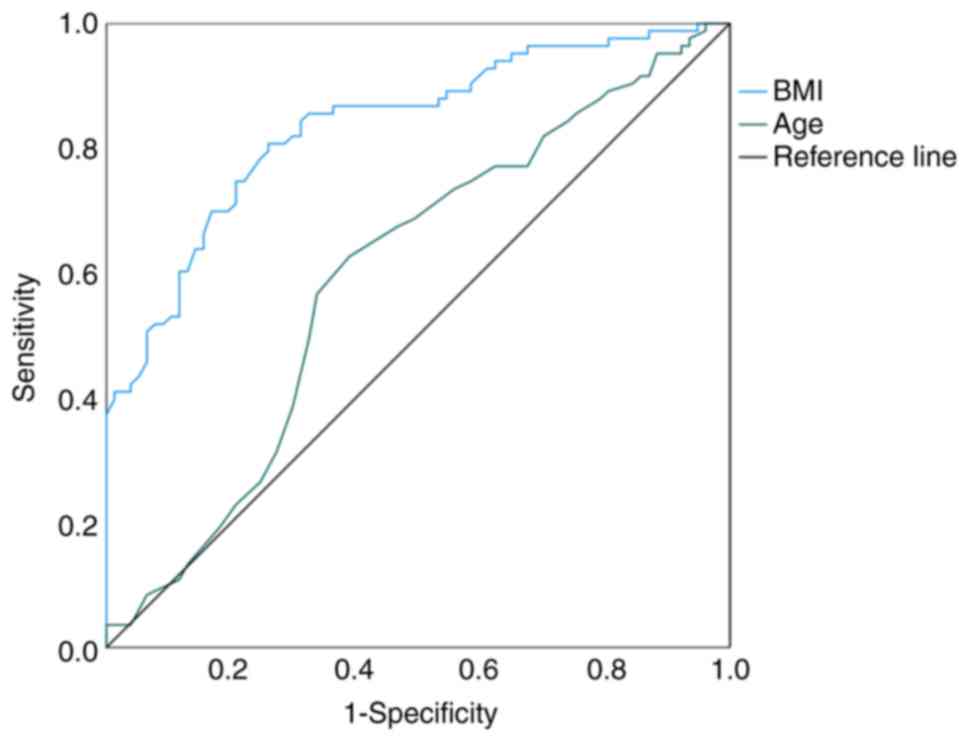
Using the GLIM regression equation to construct the
ROC curve, the results demonstrated that age and BMI had predictive
significance for malnutrition. The optimal cutoff value for age was
68.50 years, with an AUC of 0.579, a sensitivity of 62.70% and
specificity of 61.00%. For BMI, the optimal cutoff value was 22.30
kg/m2, yielding an AUC of 0.836, a sensitivity of 80.70%
and specificity of 74.00% (Table
VI; Fig. 2).
Discussion
Malnutrition can directly affect the efficacy of
tumor treatment, increase the incidence of complications, reduce
the quality of life and even affect prognosis (3,4). It
has been reported that 40% of patients with a tumor die directly
from malnutrition (15). In 2020,
Cao et al (2) assessed 1,482
patients with esophageal cancer from 72 hospitals in China using
PG-SGA. The results showed that 17.98% of patients scored 0–3,
35.09% scored 4–8 and 41.39% scored ≥9, consistent with the present
findings. Additionally, the incidence of malnutrition diagnosed
using GLIM was 41.25%, and it was 51.88% without NRS2002 screening,
which is similar to the findings of Clark et al (16) in elderly rehabilitation patients.
Utilizing different diagnostic tools can result in contrasting
outcomes. The results of the present study revealed a significantly
higher prevalence of malnutrition diagnosed by PG-SGA compared with
diagnoses made by GLIM. Specifically, 43 individuals were diagnosed
as malnourished by PG-SGA who were otherwise assessed as
nutritionally normal by GLIM. This disparity can be attributed to
the common symptoms experienced by patients with late-stage
esophageal cancer, such as difficulties in eating, retrosternal
pain, a decreased appetite and alterations in dietary patterns.
These symptoms can lead to inflated self-assessment scores,
resulting in elevated overall scores and a subsequent diagnosis of
malnutrition when using PG-SGA, potentially influenced by the
specific cancer type studied in the present study. Additionally,
six individuals were classified as having a normal nutritional
status by PG-SGA but were diagnosed as malnourished by GLIM. Among
them, three individuals were affected by the fact that PG-SGA tends
to rely on weight changes within a month, whereas the diagnostic
criteria of GLIM are based on weight changes over a 6-month period.
The remaining three individuals were classified based on their low
baseline weight and BMI. Furthermore, within the GLIM evaluation,
the absence of screening tools led to a 10.63% higher prevalence of
malnutrition compared to assessments utilizing the NRS2002
screening tool, resulting in the exclusion of 17 individuals.
Subsequent reevaluation of these 17 individuals revealed that this
discrepancy stemmed from the NRS2002 tool primarily taking into
consideration 3-month changes. For example, seven patients
exhibited a significant weight loss of >5% within 6 months,
despite minimal recent fluctuations or even a slight upward trend
in weight. Additionally, five patients experienced a gradual weight
loss of >5% within 6 months but had notably higher baseline
weights and BMIs compared to typical obese individuals.
Furthermore, five patients showed a weight loss of <5% within 6
months or no significant changes, yet had exceptionally low
baseline BMIs. These variations may be influenced by differences in
BMI values across various countries, regions and ethnicities. The
use of screening tools during the diagnostic process may
potentially lead to overlooking certain malnourished patients.
Currently, a variety of nutritional assessment methods are commonly
employed in clinical settings, each with inherent limitations.
Therefore, there is a further need for more accurate and convenient
clinical screening and assessment tools.
In September 2018, the Global Nutrition Leadership
issued a consensus on malnutrition diagnostic criteria (6). Since then, researchers worldwide have
begun clinical validation of its diagnostic value. PG-SGA is still
recommended as the gold standard for evaluating the performance of
other nutritional screening tools (17). In the present study, a validation
analysis between the PG-SGA scale and GLIM was performed, with a κ
value of 0.379. Huo et al (18) used PG-SGA to assess malnutrition in
patients with stage III–IV lung cancer, and found a κ value of 0.38
with GLIM, with a sensitivity of 48.3% and a specificity of 78.4%,
similar to the results of the present study. However, Zhou et
al (19) used GLIM as the
standard to test the consistency between PG-SGA and GLIM in
patients, and found a κ value of 0.814, with a sensitivity of 81.1%
and a specificity of 98.9%, indicating higher consistency. This may
be since the study population primarily included patients with
biliary and pancreatic cancer. Rosnes et al (20) conducted a consistency study between
GLIM and PG-SGA in the nutrition clinic of the Cancer Medicine
Department at Oslo University Hospital, Norway. The κ value was
0.37, increasing to 0.51 without NRS-2002 screening. Better
consistency without screening may be due to PG-SGA being more
suitable for patients with cancer, whereas the GLIM standard has
broader applicability. PG-SGA and GLIM employ distinct diagnostic
criteria, leading to inevitable differences in diagnostic
consistency between the two tools. While PG-SGA does not consider
BMI, it incorporates more diagnostic dimensions than GLIM. For
patients with esophageal cancer, PG-SGA may exhibit higher
sensitivity. Currently, it is crucial to recognize that these tools
cannot be used interchangeably in clinical practice.
The GLIM diagnosis requires at least one
phenotypical criterion and one etiological criterion. Phenotypical
criteria include involuntary weight loss, low BMI and loss of
muscle mass. Involuntary weight loss is the most direct
manifestation of malnutrition, with the loss of muscle mass leading
to weight reduction and a consequent decrease in BMI. This also
explains the moderate predictive ability of BMI for malnutrition.
Currently, the World Health Organization defines a BMI of <18.5
kg/m2 as the threshold for being underweight in the
general population (21). However,
BMI varies across different countries, regions, ethnicities and age
groups. Epidemiological data suggests that the optimal BMI range
for older individuals is higher than that for younger individuals.
The population under study in the present research was skewed
towards older age groups, leading to a higher optimal cutoff value
for BMI in the ROC curve. This aligns with the BMI cutoff values
used in diagnosing malnutrition in individuals >70 years old in
Western populations. Considering the study population was from the
coastal regions of northern China, BMI values were expected to be
higher compared to southern and more remote areas. Economic
development is associated with an increase in obesity rates, posing
new challenges in determining BMI values. Additionally, patients
may experience a weight loss of >10% within a certain period
while still maintaining a normal BMI. Further research is needed to
establish BMI values, particularly in a geographically diverse
country such as China, where significant population variations
exist. BMI values may need to be interpreted in conjunction with
weight loss for accurate diagnosis. The present study suggested
that BMI is an independent factor affecting malnutrition, with
patients with esophageal cancer and a low BMI having a higher risk
of malnutrition and higher PG-SGA scores. The study by Martin et
al (22) confirmed that weight
loss and low BMI predict decreased survival rates and are
independent prognostic factors for the survival of patients with
cancer. Etiological criteria include reduced food intake/absorption
and inflammation/disease burden. Inflammation is a key factor in
the risk of malnutrition and plays a significant role in tumor
development and progression. Currently, markers such as serum
C-reactive protein, albumin or prealbumin are considered potential
substitutes (23), but this is not
yet conclusive. The present study found that IL-6 level and
neutrophil count are risk factors for malnutrition. IL-6 is a
pro-inflammatory cytokine with a range of biological functions that
serves as a crucial link between inflammation and cancer (22). The persistent presence of
inflammation can lead to inhibition of protein synthesis, increased
protein breakdown, reduced muscle tissue, and subsequently,
malnutrition (24). Puppa et
al (25) demonstrated that in
mice carrying tumors, an increase in plasma IL-6 levels was
associated with tumor growth and the development of cachexia. IL-6
can also impact the metabolism of fat and muscle tissues. Rupert
et al (26) discovered that,
in pancreatic cancer cells, IL-6 depletion can halve fat
consumption, eliminate muscle wasting, and suggests the presence of
a feedback mechanism between fat and muscle tissues, with fat
tissue loss preceding muscle fiber atrophy. IL-6 activates
metabolic breakdown in skeletal muscle and also inhibits synthesis
of metabolic signals (27). IL-6
can induce muscle wasting by activating the STAT3 cellular pathway
(28). Haddad et al
(29) showed that an intramuscular
IL-6 infusion can reduce the phosphorylation of S6K1, which is
associated with breakdown metabolism, a reduction linked to the
loss of protein synthesis capacity. Furthermore, IL-6 not only acts
on peripheral organs but also appears to influence the brain,
potentially contributing to the development of cachexia (30), although the precise mechanisms
remain unclear. Schéle et al (31) found that, in mice, IL-6 can affect
adiposity and appetite through the hypothalamic arcuate nucleus.
Based on the findings of the present study, it is plausible to
consider IL-6 as a potential etiological marker. Neutrophils play a
significant role in tumor initiation and progression. Penafuerte
et al (32) observed a
significant increase in absolute neutrophil count and
neutrophil-derived proteases in patients in pre-cachexia and
cachexia states, suggesting their potential involvement in cachexia
development. Neutrophil-derived proteases can stimulate the
generation of angiotensin II, which through various mechanisms,
such as inducing protein degradation and inhibiting protein
synthesis, promotes cachexia (33).
Deng et al (34) found that
neutrophils in patients with cachexia with pancreatic cancer can
secrete lipopolysaccharide-binding protein-2, which has been
associated with anorexia, fat loss, and muscle loss in murine
models of pancreatic cancer cachexia (35), suggesting a potential association
with malnutrition. Neutrophils appear to induce muscle damage by
adhering to myofibers through CD18 and generating iron-dependent
hydroxyl radicals (36). In the
present study, it was found that the optimal cutoff value for
absolute neutrophil count was 9.25×10⁹/l. When a
patient's absolute neutrophil count exceeds this value, the
probability of malnutrition increases. However, neutrophils are
susceptible to the influence of cancer treatments such as radiation
and chemotherapy, leading to significant variability in values and
hindering the monitoring of malnutrition progression.
The NLR is an indicator used to assess inflammatory
responses. The present study did not find an association between
NLR and malnutrition. In an analysis of patients with esophageal
cancer before radiotherapy, the study by Liang et al
(37) also did not find significant
associations between the NLR, the PLR and sarcopenia. However,
Penafuerte et al (32)
observed a significant increase in the NLR in pre-cachectic and
cachectic patients compared with non-cachectic individuals, with no
difference in absolute lymphocyte count but a notable increase in
absolute neutrophil count. This discrepancy may be related to the
disease status, as for newly diagnosed patients and those severely
malnourished in the present study, the neutrophil counts were
higher compared with those with mild to moderate malnutrition. In
the present study, patients' absolute neutrophil counts were within
the normal range, while the patients in the study by Penafuerte
et al (32) had a more
advanced stage of malnutrition, suggesting that neutrophil levels
may increase as malnutrition worsens. In patients with gastric
cancer undergoing surgical treatment, Ruan et al (38) found that NLR was a predictive
indicator of nutritional risk but was not an independent
influencing factor for malnutrition. The SII is calculated from
platelet, lymphocyte and neutrophil counts, while the PLR is
derived from the ratio of platelets to lymphocytes. Both serve as
indicators reflecting the immune and inflammatory status within the
body. Elevated levels of SII and PLR typically signify a poor
prognosis in malignant tumors. Lipshitz et al (39) found that, in an analysis of patients
with advanced cancer cachexia, neutrophil, lymphocyte and platelet
counts remained within normal ranges, and that lymphocyte and
platelet counts, NLR, SII and PLR showed no significant correlation
with cachexia, in agreement with the results of the present study.
The number of neutrophils is influenced by various confounding
factors, such as age, disease severity and treatment regimens
(40). The patients in the
experimental group of the present study were at different stages of
chemotherapy, which could have had an impact. Lipshitz et al
(41) also discovered a significant
correlation between the cachexia assessment tool scores and NLR,
SII and PLR, suggesting that different reference standards and
assessment perspectives may yield varying results. Conversely, in a
study on patients with gastric cancer post-surgery, Lin et
al (42) found a significant
association between NLR and PLR with cachexia, possibly linked to
surgical alterations in the body's inflammatory and immune
status.
In 2019, Song et al (23) conducted a demographic study on
24,354 patients with common malignant tumors and found a positive
correlation between age and PG-SGA. The present study also found
that age was a significant factor influencing malnutrition, with
older age correlating with higher malnutrition scores. The ROC
curve suggested that the optimal cutoff age for this population was
68.5 years, with a significant increase in the probability of
malnutrition beyond this age. When developing the NRS2002 scale, a
logistic regression analysis of baseline characteristics from 114
studies containing information on age indicated that a score
weighted age of ≥70 years was the highest weight (6). This suggests a significant increase in
the risk of malnutrition in individuals aged ≥70 years, leading to
its inclusion as a standalone scoring criterion in the NRS2002
scale. Consensus standards for malnutrition, such as GLIM and the
European Society of Clinical Nutrition and Metabolism 2015
diagnostic criteria (5) for
malnutrition, use the age of 70 as a delineating point for BMI
categorization. Given the potential differences in populations and
diseases, and the relatively small sample size, these results may
show slight variations. With advancing age, a reduction in the
synthesis of various hormones such as testosterone, estrogens and
growth hormone may contribute to decreased metabolic function in
patients with malnutrition (43).
In addition, the present results indicated that patients with
esophageal cancer with hypoalbuminemia were more prone to
malnutrition. Serum albumin concentration is a reliable indicator
of nutritional status and systemic inflammation. Low serum albumin
levels in patients with diverse cancer types are associated with
poor survival outcomes (6). A study
by Wu et al (44) showed
that pre-treatment hypoalbuminemia is an independent risk factor
for the prognosis of patients with esophageal cancer undergoing
radical surgery and can be used as an indicator to evaluate
treatment and prognosis.
The PNI, originally proposed by Japanese scholars in
1984 and subsequently refined by Onodera et al (45), is calculated based on serum albumin
and lymphocyte counts. PNI is used for assessing the immune and
nutritional status of patients with cancer. Wang et al
(43) explored various screening
methods and found that the performance of PNI screening in
diagnosing and classifying malnutrition according to the GLIM was
suboptimal. The κ value between PNI screening and unfiltered GLIM
diagnosis was only 0.045, indirectly indicating a weak correlation
between PNI and malnutrition. Cholesterol is primarily used as an
indicator in the controlling nutritional status (CONUT) score
(46) for assessing patients'
nutritional status. Yoshida et al (47) confirmed that the CONUT score was
associated with postoperative complications in patients with
esophageal cancer, with a higher probability of complications in
those with moderate to severe malnutrition compared to those with
no or mild malnutrition. However, cholesterol is rarely used as a
standalone indicator for assessing the nutritional status of
patients with tumors. In the present study, there was no
correlation between cholesterol levels and malnutrition in patients
with esophageal cancer.
The present study has some limitations. First, it
was a single-center study with a relatively small sample size,
potentially limiting the generalizability of the findings to other
demographics. Future efforts should focus on expanding the clinical
sample size, conducting multicenter prospective clinical studies to
further validate the research outcomes and investigating regional
variations. Second, the present study primarily observed the
nutritional status and risk of patients upon admission but did not
monitor the dynamic changes and associations between nutritional
risk and related indicators. Future high-quality prospective
clinical studies are required to explore the correlation between
nutritional status, related indicators and clinical outcomes.
In summary, patients with esophageal cancer exhibit
a higher prevalence of malnutrition, which is closely associated
with age, albumin levels and inflammatory markers. These related
indicators may play a beneficial role in guiding future nutritional
support for the clinical management of patients with esophageal
cancer. The diagnosis of malnutrition relies on various diagnostic
approaches. Further clinical validation is necessary to establish
the specific application of the GLIM score in practice. Future
prospective cohort studies with larger sample sizes are needed to
monitor the dynamic changes of malnutrition and related indicators
in patients using different measurement tools, to assess the
effectiveness of these tools and to investigate the variations in
indicators across different nutritional states of patients.
Acknowledgements
Not applicable.
Funding
This study was supported by Shandong Provincial Natural Science
Foundation Project (grant no. ZR2020LZL019) and The Affiliated
Hospital of Xuzhou Medical University Science and Technology
Development Fund Outstanding Talent Program (grant no.
XYFM202216).
Availability of data and materials
The data generated in the present study may be
requested from the corresponding author.
Authors' contributions
XK, PL, GW, SS, and LL collected and analyzed the
data. XK wrote the first draft. LL reviewed and edited the
manuscript. XK and PL confirm the authenticity of all the raw data.
All authors have read and approved the final manuscript.
Ethics approval and consent to
participate
The present study was performed in accordance with
the Declaration of Helsinki and was approved by the Medical Ethics
Committee of Tengzhou Central People's Hospital (approval no.
2023-Ethics Review-02). All subjects included in the study provided
written informed consent.
Patient consent for publication
Not applicable.
Competing interests
The authors declare that they have no competing
interests.
References
|
1
|
Sung H, Ferlay J, Siegel RL, Laversanne M,
Soerjomataram I, Jemal A and Bray F: Global cancer statistics 2020:
GLOBOCAN estimates of incidence and mortality worldwide for 36
cancers in 185 countries. CA Cancer J Clin. 71:209–249. 2021.
View Article : Google Scholar : PubMed/NCBI
|
|
2
|
Cao J, Xu H, Li W, Guo Z, Lin Y, Shi Y, Hu
W, Ba Y, Li S, Li Z, et al: Nutritional assessment and risk factors
associated to malnutrition in patients with esophageal cancer. Curr
Probl Cancer. 45:1006382021. View Article : Google Scholar : PubMed/NCBI
|
|
3
|
Yamano T, Yoshimura M, Kobayashi M, Beppu
N, Hamanaka M, Babaya A, Tsukamoto K, Noda M, Matsubara N and
Tomita N: Malnutrition in rectal cancer patients receiving
preoperative chemoradiotherapy is common and associated with
treatment tolerability and anastomotic leakage. Int J Colorectal
Dis. 31:877–884. 2016. View Article : Google Scholar : PubMed/NCBI
|
|
4
|
Illa P, Tomiskova M and Skrickova J:
Nutritional risk screening predicts tumor response in lung cancer
patients. J Am Coll Nutr. 34:425–429. 2015. View Article : Google Scholar : PubMed/NCBI
|
|
5
|
Cederholm T, Bosaeus I, Barazzoni R, Bauer
J, Van Gossum A, Klek S, Muscaritoli M, Nyulasi I, Ockenga J,
Schneider SM, et al: Diagnostic criteria for malnutrition - An
ESPEN consensus statement. Clin Nutr. 34:335–340. 2015. View Article : Google Scholar : PubMed/NCBI
|
|
6
|
Cederholm T, Jensen GL, Correia MITD,
Gonzalez MC, Fukushima R, Higashiguchi T, Baptista G, Barazzoni R,
Blaauw R, Coats AJS, et al: GLIM criteria for the diagnosis of
malnutrition-A consensus report from the global clinical nutrition
community. J Cachexia Sarcopenia Muscle. 10:207–217. 2019.
View Article : Google Scholar : PubMed/NCBI
|
|
7
|
Kondrup J, Rasmussen HH, Hamberg O and
Stanga Z; Ad Hoc ESPEN Working Group, : Nutritional risk screening
(NRS 2002): A new method based on an analysis of controlled
clinical trials. Clin Nutr. 22:321–336. 2003. View Article : Google Scholar : PubMed/NCBI
|
|
8
|
Ottery FD: Rethinking nutritional support
of the cancer patient: The new field of nutritional oncology. Semin
Oncol. 21:770–778. 1994.PubMed/NCBI
|
|
9
|
Detsky AS, McLaughlin JR, Baker JP,
Johnston N, Whittaker S, Mendelson RA and Jeejeebhoy KN: What is
subjective global assessment of nutritional status? JPEN J Parenter
Enteral Nutr. 11:8–13. 1987. View Article : Google Scholar : PubMed/NCBI
|
|
10
|
Jager-Wittenaar H and Ottery FD: Assessing
nutritional status in cancer: Role of the patient-generated
subjective global assessment. Curr Opin Clin Nutr Metab Care.
20:322–329. 2017. View Article : Google Scholar : PubMed/NCBI
|
|
11
|
Pirozzolo G, Gisbertz SS, Castoro C, van
Berge Henegouwen MI and Scarpa M: Neutrophil-to-lymphocyte ratio as
prognostic marker in esophageal cancer: A systematic review and
meta-analysis. J Thorac Dis. 11:3136–3145. 2019. View Article : Google Scholar : PubMed/NCBI
|
|
12
|
Hong X, Cui B, Wang M, Yang Z, Wang L and
Xu Q: Systemic immune-inflammation index, based on platelet counts
and neutrophil-lymphocyte ratio, is useful for predicting prognosis
in small cell lung cancer. Tohoku J Exp Med. 236:297–304. 2015.
View Article : Google Scholar : PubMed/NCBI
|
|
13
|
Brierley JD, Gospodarowicz MK and
Wittekind C: TNM Classification of Malignant Tumours. 8th Edition.
Wiley-Blackwell; Chichester: 2017
|
|
14
|
Noghrehchi F, Stoklosa J, Penev S and
Warton DI: Selecting the model for multiple imputation of missing
data: Just use an IC! Stat Med. 40:2467–2497. 2021. View Article : Google Scholar : PubMed/NCBI
|
|
15
|
Isenring E, Cross G, Kellett E, Koczwara B
and Daniels L: Nutritional status and information needs of medical
oncology patients receiving treatment at an Australian public
hospital. Nutr Cancer. 62:220–228. 2010. View Article : Google Scholar : PubMed/NCBI
|
|
16
|
Clark AB, Reijnierse EM, Lim WK and Maier
AB: Prevalence of malnutrition comparing the GLIM criteria, ESPEN
definition and MST malnutrition risk in geriatric rehabilitation
patients: RESORT. Clin Nutr. 39:3504–3511. 2020. View Article : Google Scholar : PubMed/NCBI
|
|
17
|
Wu M, Lian XJ, Jia JM, Cao WT, Yan N, Xin
YM, Liu ZR, Li HY, Fan ZF and Sun P: The role of the
Patient-Generated Subjective Global Assessment (PG-SGA) and
biochemical markers in predicting anemia patients with cancer.
Support Care Cancer. 27:1443–1448. 2019. View Article : Google Scholar : PubMed/NCBI
|
|
18
|
Huo Z, Chong F, Yin L, Li N, Liu J, Zhang
M, Guo J, Fan Y, Zhang L, Lin X, et al: Comparison of the
performance of the GLIM criteria, PG-SGA and mPG-SGA in diagnosing
malnutrition and predicting survival among lung cancer patients: A
multicenter study. Clin Nutr. 42:1048–1058. 2023. View Article : Google Scholar : PubMed/NCBI
|
|
19
|
Zhou L, Fu J, Ding Z, Jin K, Wu R and Ye
LX: Comparison of GLIM, SGA, PG-SGA, and PNI in diagnosing
malnutrition among hepatobiliary-pancreatic surgery patients. Front
Nutr. 10:11162432023. View Article : Google Scholar : PubMed/NCBI
|
|
20
|
Rosnes KS, Henriksen C, Hoidalen A and
Paur I: Agreement between the GLIM criteria and PG-SGA in a mixed
patient population at a nutrition outpatient clinic. Clin Nutr.
40:5030–5037. 2021. View Article : Google Scholar : PubMed/NCBI
|
|
21
|
Physical status: The use and
interpretation of anthropometry. Report of a WHO expert committee.
World Health Organ Tech Rep Ser. 854:1–452. 1995.PubMed/NCBI
|
|
22
|
Martin L, Senesse P, Gioulbasanis I,
Antoun S, Bozzetti F, Deans C, Strasser F, Thoresen L, Jagoe RT,
Chasen M, et al: Diagnostic criteria for the classification of
cancer-associated weight loss. J Clin Oncol. 33:90–99. 2015.
View Article : Google Scholar : PubMed/NCBI
|
|
23
|
Song C, Cao J, Zhang F, Wang C, Guo Z, Lin
Y, Shi Y, Hu W, Ba Y, Xu H, et al: Nutritional risk assessment by
scored patient-generated subjective global assessment associated
with demographic characteristics in 23,904 common malignant tumors
patients. Nutr Cancer. 71:50–60. 2019. View Article : Google Scholar : PubMed/NCBI
|
|
24
|
Howard EE, Pasiakos SM, Blesso CN, Fussell
MA and Rodriguez NR: Divergent roles of inflammation in skeletal
muscle recovery from injury. Front Physiol. 11:872020. View Article : Google Scholar : PubMed/NCBI
|
|
25
|
Puppa MJ, White JP, Sato S, Cairns M,
Baynes JW and Carson JA: Gut barrier dysfunction in the ApcMin/+
mouse model of colon cancer cachexia. Biochim Biophys Acta.
1812:1601–1606. 2011. View Article : Google Scholar : PubMed/NCBI
|
|
26
|
Rupert JE, Narasimhan A, Jengelley DHA,
Jiang Y, Liu J, Au E, Silverman LM, Sandusky G, Bonetto A, Cao S,
et al: Tumor-derived IL-6 and trans-signaling among tumor, fat, and
muscle mediate pancreatic cancer cachexia. J Exp Med.
218:e201904502021. View Article : Google Scholar : PubMed/NCBI
|
|
27
|
Pototschnig I, Feiler U, Diwoky C, Vesely
PW, Rauchenwald T, Paar M, Bakiri L, Pajed L, Hofer P, Kashofer K,
et al: Interleukin-6 initiates muscle- and adipose tissue wasting
in a novel C57BL/6 model of cancer-associated cachexia. J Cachexia
Sarcopenia Muscle. 14:93–107. 2023. View Article : Google Scholar : PubMed/NCBI
|
|
28
|
Bonetto A, Aydogdu T, Jin X, Zhang Z, Zhan
R, Puzis L, Koniaris LG and Zimmers TA: JAK/STAT3 pathway
inhibition blocks skeletal muscle wasting downstream of IL-6 and in
experimental cancer cachexia. Am J Physiol Endocrinol Metab.
303:E410–E421. 2012. View Article : Google Scholar : PubMed/NCBI
|
|
29
|
Haddad F, Zaldivar F, Cooper DM and Adams
GR: IL-6-induced skeletal muscle atrophy. J Appl Physiol (1985).
98:911–917. 2005. View Article : Google Scholar : PubMed/NCBI
|
|
30
|
Sun Q, van de Lisdonk D, Ferrer M,
Gegenhuber B, Wu M, Park Y, Tuveson DA, Tollkuhn J, Janowitz T and
Li B: Area postrema neurons mediate interleukin-6 function in
cancer cachexia. Nat Commun. 15:46822024. View Article : Google Scholar : PubMed/NCBI
|
|
31
|
Schéle E, Benrick A, Grahnemo L, Egecioglu
E, Anesten F, Pálsdóttir V and Jansson JO: Inter-relation between
interleukin (IL)-1, IL-6 and body fat regulating circuits of the
hypothalamic arcuate nucleus. J Neuroendocrinol. 25:580–589. 2013.
View Article : Google Scholar : PubMed/NCBI
|
|
32
|
Penafuerte CA, Gagnon B, Sirois J, Murphy
J, MacDonald N and Tremblay ML: Identification of
neutrophil-derived proteases and angiotensin II as biomarkers of
cancer cachexia. Br J Cancer. 114:680–687. 2016. View Article : Google Scholar : PubMed/NCBI
|
|
33
|
Trobec K, von Haehling S, Anker SD and
Lainscak M: Growth hormone, insulin-like growth factor 1, and
insulin signaling-a pharmacological target in body wasting and
cachexia. J Cachexia Sarcopenia Muscle. 2:191–200. 2011. View Article : Google Scholar : PubMed/NCBI
|
|
34
|
Deng M, Aberle MR, van Bijnen AAJHM, van
der Kroft G, Lenaerts K, Neumann UP, Wiltberger G, Schaap FG, Olde
Damink SWM and Rensen SS: Lipocalin-2 and neutrophil activation in
pancreatic cancer cachexia. Front Immunol. 14:11594112023.
View Article : Google Scholar : PubMed/NCBI
|
|
35
|
Olson B, Zhu X, Norgard MA, Levasseur PR,
Butler JT, Buenafe A, Burfeind KG, Michaelis KA, Pelz KR, Mendez H,
et al: Lipocalin 2 mediates appetite suppression during pancreatic
cancer cachexia. Nat Commun. 12:20572021. View Article : Google Scholar : PubMed/NCBI
|
|
36
|
McLoughlin TJ, Tsivitse SK, Edwards JA,
Aiken BA and Pizza FX: Deferoxamine reduces and nitric oxide
synthase inhibition increases neutrophil-mediated myotube injury.
Cell Tissue Res. 313:313–319. 2003. View Article : Google Scholar : PubMed/NCBI
|
|
37
|
Liang H, Peng H and Chen L: Prognostic
value of sarcopenia and systemic inflammation markers in patients
undergoing definitive radiotherapy for esophageal cancer. Cancer
Manag Res. 13:181–192. 2021. View Article : Google Scholar : PubMed/NCBI
|
|
38
|
Ruan HC, Wu XH, Huang DL, Fu XB, Zhang C,
Zhou K, Zhu GY, Liu D, Cai JT and Tan MH: The Role of the PNI and
NLR in nutritional risk screening and assessment of gastric cancer
patients. J Nutr Oncol. 7:192–198. 2022.
|
|
39
|
Lipshitz M, Visser J, Anderson R, Nel DG,
Smit T, Steel HC and Rapoport B: Emerging markers of cancer
cachexia and their relationship to sarcopenia. J Cancer Res Clin
Oncol. 149:17511–17527. 2023. View Article : Google Scholar : PubMed/NCBI
|
|
40
|
Giese MA, Hind LE and Huttenlocher A:
Neutrophil plasticity in the tumor microenvironment. Blood.
133:2159–2167. 2019. View Article : Google Scholar : PubMed/NCBI
|
|
41
|
Lipshitz M, Visser J, Anderson R, Nel DG,
Smit T, Steel HC and Rapoport BL: Relationships of emerging
biomarkers of cancer cachexia with quality of life, appetite, and
cachexia. Support Care Cancer. 32:3492024. View Article : Google Scholar : PubMed/NCBI
|
|
42
|
Lin J, Zhang W, Huang Y, Chen W, Wu R,
Chen X, Lou N and Wang P: Sarcopenia is associated with the
neutrophil/lymphocyte and platelet/lymphocyte ratios in operable
gastric cancer patients: A prospective study. Cancer Manag Res.
10:4935–4944. 2018. View Article : Google Scholar : PubMed/NCBI
|
|
43
|
Wang P, Chen X, Liu Q, Liu X and Li Y:
Good performance of the Global Leadership Initiative on
Malnutrition criteria for diagnosing and classifying malnutrition
in people with esophageal cancer undergoing esophagectomy.
Nutrition. 91-92:1114202021. View Article : Google Scholar : PubMed/NCBI
|
|
44
|
Wu N, Chen G, Hu H, Pang L and Chen Z: Low
pretherapeutic serum albumin as a risk factor for poor outcome in
esophageal squamous cell carcinomas. Nutr Cancer. 67:481–485. 2015.
View Article : Google Scholar : PubMed/NCBI
|
|
45
|
Onodera T, Goseki N and Kosaki G:
Prognostic nutritional index in gastrointestinal surgery of
malnourished cancer patients. Nihon Geka Gakkai Zasshi.
85:1001–1005. 1984.(In Japanese). PubMed/NCBI
|
|
46
|
Ignacio de Ulíbarri J, González-Madroo A,
de Villar NG, González P, González B, Mancha A, Rodríguez F and
Fernández G: CONUT: A tool for controlling nutritional status.
First validation in a hospital population. Nutr Hosp. 20:38–45.
2005.PubMed/NCBI
|
|
47
|
Yoshida N, Harada K, Baba Y, Kosumi K,
Iwatsuki M, Kinoshita K, Nakamura K, Sakamoto Y, Miyamoto Y,
Karashima R, et al: Preoperative controlling nutritional status
(CONUT) is useful to estimate the prognosis after esophagectomy for
esophageal cancer. Langenbecks Arch Surg. 402:333–341. 2017.
View Article : Google Scholar : PubMed/NCBI
|