Introduction
Hepatocellular carcinoma (HCC) is a malignant
disease with the sixth highest incidence and the third highest
mortality worldwide (1). The
crucial reasons for the high mortality of HCC include difficulty in
early diagnosis, tumor heterogeneity and poor efficacy of late
stage treatment (2). Tumor
heterogeneity includes both the heterogeneity of tumor cells and
the tumor microenvironment (3). An
increasing number of studies have reported that the heterogeneity
of HCC is at the forefront of malignant tumors and has a profound
impact on the prognosis and treatment of HCC (3,4). In
addition, studies based on bioinformatics analysis of molecular
typing and prognostic prediction of HCC have emerged and
demonstrated clinical potential (4–6).
Unfortunately, the progression of HCC is a multifactor, multistage
and constantly changing process due to its heterogeneity, which
leads to certain limitations of the models (7). Therefore, it is necessary to explore
the novel molecular subtypes and models of HCC for evaluating
prognosis.
Forkhead box O3 (FOXO3), a member of the Forkhead
box (Fox) transcription factors, is named for its highly conserved
DNA-binding domain (DBD) (8). In
addition to the DBD, FOXO3 has three other functional domains: a
nuclear export signal, a nuclear localization signal and a
transactivation domain (9). In the
1990s, FOXO3 was demonstrated to be present at sites of chromosomal
translocations, creating oncogenic fusions with the DNA-binding
moiety of either paired box gene 3/7 or lysine methyltransferase 2A
(10,11). Previous studies have shown that the
FOX protein is a tumor suppressor that is often inactivated in
cancer (12–14). Gene-editing mouse models have
confirmed that knocking out FOXO3 causes hemangiomas (14). Reactivation of FOXO3 by drugs
(metformin and SN-38) also mediates the transformation of ovarian
and breast cancer cells into non-cancer cells (15). These phenotypes indicate that FOXO3
may have an antitumor role. Currently, the role of FOX3O in HCC
seems to be controversial. On the one hand, knockdown of FOXO3
inhibits HCC cell proliferation and promotes HCC cell apoptosis via
BNIP3 inhibition (16,17). On the other hand, ursolic acid
inhibits HCC cell proliferation by upregulating FOXO3 expression
while low expression of FOXO3 augments autophagic flux, promoting
sorafenib resistance of HCC cells (18,19).
These studies suggest that FOXO3 may serve a different role in HCC
from other tumors.
The present study aimed to explore the role of FOXO3
in HCC, construct a novel prognostic model and identify biomarkers
for HCC prognosis. To accomplish these aims, The Cancer Genome
Atlas (TCGA) and International Cancer Genome Consortium (ICGC)
databases were used and weighted correlation network analysis
(WGCNA) analysis was used to screen FOXO3-related genes.
Subsequently, univariate Cox-least absolute shrinkage and selection
operator (LASSO) analysis was used to identify signatures and
construct a novel prognostic model. Furthermore, clinical samples
of patients with HCC were used to assess mRNA and protein
expression of DEAD-box helicase 55 (DDX55), RAB10, member RAS
oncogene family (RAB10), RAB7A, TATA-box binding protein associated
factor, RNA polymerase I subunit B (TAF1B) and TAF3. Finally, a
Cell Counting Kit-8 (CCK-8) assay was used to evaluate the effect
of RAB10, RAB7A and TAF3 on proliferation of Huh7 cells.
Materials and methods
Data collection and processing
The RNA-sequencing (RNA-Seq) transcriptome profile
(TCGA- LIHC) of transcripts per kilobase of exon model per million
mapped reads format, including 365 HCC tissues and 50 normal
hepatic tissues, were acquired from TCGA database (TCGA-LIHC,
http://portal.gdc.cancer.gov) using the
TCGAbiolinks package ((https://bioconductor.org/p-ackages/release/bioc/html/TCGAbiolinks.html,
version 2.28.4) (20) in R (version
4.3). The accompanying clinical information of 365 patients with
HCC was also obtained by the TCGAbiolinks package in R (version
4.3). For duplicate samples, the mean was calculated and used as
the final sample gene expression value. Samples clearly identified
as HCC were included and samples with missing or incomplete
clinical information [age, sex, tumor, node, metastasis (TNM)
staging, survival time and status] were removed in subsequent
prognostic and modeling analyses. The patients were then divided
into high- and low-FOXO3 expression groups according to X-tile
software (version 3.6.1, /x-tile.software.informer.com/), with a
cut-off value of 4.206.
The RNA-seq transcriptome data and corresponding
clinical information of 206 patients with HCC (ICGC-LIRI-JP),
including 206 HCC tissues and 177 normal hepatic tissues, were
downloaded from the ICGC database (ICGC-LIRI-JP, http://dcc.icgc.org/). The data from ICGC was
processed in the same way as the aforementioned database.
WGCNA
An mRNA co-expression network of the TCGA-LIHC
dataset was constructed using the WGCNA R package (version1 73)
(21). Briefly, the Pearson
correlation between each pair of genes was calculated and the
similarity matrix was acquired. The power function was used to
transform the similarity matrix to an adjacency matrix using the
WGCNA R package and the β was determined through the scale-free
topological fit test for constructing scale-free weighted network.
A threshold of R2>0.9 (soft threshold=32) was
selected to acquire a high-confidence scale free network.
Co-expression modules were acquired through the pairwise
topological overlap between genes and highly correlated modules
were further merged. The hub module was designated as that with the
highest Pearson correlation coefficient and P<0.05. Furthermore,
module membership (MM) and gene significance (GS) were calculated
and genes with MM >0.8 and GS >0.2 in the hub module were
selected as the hub genes.
LASSO regression analysis and
protein-protein interaction (PPI) network
LASSO regression analysis was performed using the
glmnet (version 4.1-4) (22) and
survival (version 3.8-3) (23) R
packages. LASSO was then used to identify the final gene signature
for constructing the prognostic model according to the minimum λ
value. The PPI network was constructed using the STRING database
(version 12.0; string-db.org/) and visualized by Cytoscape (version
3.9.1, http://cytoscape.org/).
Construction and validation of the
prognostic model
Univariate Cox analysis was used to identify the hub
genes and genes with P<0.05 were retained for subsequent
analysis. LASSO analysis was performed and five genes were
identified for constructing the model according to the minimum λ
value (24). The risk score (RS) of
each HCC sample was calculated using the following formula: RS=
Σni=1coef (genei) ×
expr (genei). The patients were then divided into high-
and low-risk groups according to X-tile software.
Clinical potential evaluation of the
prognostic model
Time-dependent receiver operating characteristic
(ROC) curves were generated using the pROC R package (version
1.18.5) (25). Univariate and
multivariate Cox analyses were performed and visualized using the
survival R package, SPSS (version 23; IBM Corp.) and the ggplot2 R
package (version 3.5.1) (26).
Nomogram and calibration curves were generated using the rms R
package (version 7.0) (27).
Gene set enrichment analysis (GSEA)
and immune analysis
GSEA of the training (TCGA cohort) and validation
sets (ICGC cohort) was performed using GSEA software (version
4.3.2, gsea-msigdb.org/gsea/index.jsp). Hallmark gene sets from the
molecular signature database (MSigDB; http://www.gseamsigd-b.org/gsea/msigdb/index.jsp)
were defined as the reference gene set database. Pathways with
P<0.05 and false discovery rate (FDR) <0.25 were considered
statistically different between the high- and low-risk groups.
Infiltration of 22 immune cell types in the tumor microenvironment
was analyzed using the CIBERSORTx website
(cibersortx.stanford.edu/). Results were visualized using the
ggplot2 package.
Reverse transcription-quantitative
polymerase chain reaction (RT-qPCR)
A total of 10 paired tumor and tumor-adjacent
tissues from patients with HCC were collected by hepatectomy
between May 2024 and August 2024 from the Second Affiliated
Hospital of Guangdong Medical University (Zhanjiang, China). The
use of samples was approved by Research Ethics Committee of the
Second Affiliated Hospital of Guangdong Medical University
(approval no. PJKT-2024-042).
A total of 10 HCC samples obtained were included in
accordance with the following inclusion criteria: i) The patient
received hepatectomy; ii) all samples were confirmed to have a
clinicopathological diagnosis of HCC through pathology reports; and
iii) patients had no severe infection and stable vital signs. The
exclusion criteria were: i) Patients with secondary and recurrent
liver cancer; ii) patients with liver cancer who had received any
medication prior to surgery; and iii) patients with multiple
primary tumors. The clinical information of 10 patients with HCC is
presented the Table SI. Total RNA
from HCC and paired paracancerous tissues was extracted using the
Total RNA Isolation Kit (cat. no. RE-03011; Foregene Co., Ltd.)
according to the manufacturer's instructions. RNA was reverse
transcribed to cDNA using a cDNA synthesis kit (cat. no. 1708891;
Bio-Rad Laboratories, Inc.) and the following conditions: 5 min at
25°C, 20 min at 46°C, 1 min at 95°C and holding at 4°C. cDNA was
quantified using Universal SYBR Green Supermix (cat. no. 1708891;
Bio-Rad Laboratories, Inc.) according to the manufacturer's
instructions (denaturation for 5 sec at 95°C, extension: 30 sec at
60°C, 40 cycles). Relative mRNA expression was obtained using the
2−∆∆Cq method (28) with
GAPDH as the internal reference. The following primers were used:
GAPDH forward, 5′-GGAGCGAGATCCCTCCAAAAT-3′; GAPDH reverse,
5′-GGCTGTTGTCATACTTCTCATGG-3′; DDX55 forward,
5′-AGCTGGGCTTCCCGTACAT-3′; DDX55 reverse,
5′-CAGCGACATCTTTGTTTCGCA-3′; RAB10 forward,
5′-CTGCTCCTGATCGGGGATTC-3′, RAB10 reverse,
5′-TGATGGTGTGAAATCGCTCCT-3′; RAB7A forward,
5′-GTGTTGCTGAAGGTTATCATCCT-3′; RAB7A reverse,
5′-GCTCCTATTGTGGCTTTGTACTG-3′; TAF1B forward,
5′-AAAGAACGCTGTACTCAGTGTG-3′; TAF1B reverse,
5′-CCCCGGTTGAGGGCTTTTA-3′; TAF3 forward,
5′-ATGTGCGAGAGTTACTCCAGG-3′; and TAF3 reverse,
5′-GGGTCTGTTCGGCCATAGAG-3′.
Western blot analysis
Protein from HCC and paired paracancerous tissues
were extracted using radioimmunoprecipitation assay buffer with
protease and phosphatase inhibitors (cat. no. P0013C; Beyotime
Institute of Biotechnology) according to the manufacturer's
instructions. Protein samples were quantification by the BCA kit
(cat. no. P0012S, Beyotime Institute of Biotechnology). Protein
samples were heated at 70°C for 10 min after mixing with sodium
dodecyl sulfate-polyacrylamide gel electrophoresis (SDS-PAGE)
buffer (cat. no. P0015A; Beyotime Institute of Biotechnology) and
then added into a pre-prepared 10% gel for electrophoresis (15 µg
per lane). The protein was transferred to polyvinylidene fluoride
membranes. Subsequently, the membranes were blocked with 5% skim
milk at room temperature for 2 h and then incubated with primary
antibody at 4°C overnight. After incubation, the membranes were
placed on a shaker and washed with TBST buffer (1 l TBS buffer with
1 ml Tween-20) for 7 min. After washing three times, the membranes
were incubated with the secondary antibody at room temperature for
1 h. Finally, the membranes were washed and developed by
chemiluminescence. The gray values were obtained by ImageJ
(National Institutes of Health, version 1.54h) and analyzed using
GraphPad Prism (Dotmatics, version 10.2.3). The following
antibodies were used: β-actin (1:1,000; cat. no. ET1702-52;
HUABIO), DDX55 (1:1,000; cat. no. ER63225; HUABIO), RAB10 (1:1,000;
cat. no. 11808-1-AP; Proteintech Group, Inc.), RAB7A (1:1,500; cat.
no. 55469-1-AP; Proteintech Group, Inc.), TAF1B (1:500; cat. no.
12818-1-AP; Proteintech Group, Inc.), FOXO3 (1:1,000; cat. no.
A9270; ABclonal Biotech Co., Ltd.) and TAF3 (1:500; cat. no.
18901-1-AP; Proteintech Group, Inc.), HRP conjugated goat
anti-rabbit IgG polyclonal antibody (1:30000, HA1001, HUABIO), HRP
conjugated goat anti-mouse IgG polyclonal antibody (1:30,000,
HA1006, HUABIO).
Cell transfection
The Huh7 cell was obtained from Cell Bank of the
Chinese Academy of Sciences (Shanghai, China) and cells
(10,000/well) were seeded into 6-well plates. Cells were cultured
using DMEM (Gibco, USA) supplemented with 10% FBS) (ScienCell, USA)
and 1% penicillin and streptomycin (HyClone). After the cell
density reached 20%, the cells were transfected with small
interfering RNAs (siRNA; Shanghai GenePharma Co., Ltd.). Briefly,
the siRNA, serum-free medium and siRNA-Mate transfer agent (cat.
no. G04003; Shanghai GenePharma Co., Ltd.) were mixed, added to the
cells at a final concentration of 100 nM and shaken well according
to the manufacturer's instructions. After 72 h transfection, the
protein was extracted to detect the knockdown efficiency via
western blot analysis. The following siRNA sequences were used:
RAB10 sense, 5′-CCAUAGGAAUAGACUUCAAGA-3′; antisense,
5′-UUGAAGUCUAUUCCUAUGGUG-3′; RAB7A sense,
5′-GGAAGAAAGUGUUGCUGAAGG-3′; antisense,
5′-UUCAGCAACACUUUCUUCCUA-3′; TAF3 sense,
5′-GCGGGAUGUGCGAGAGUUACU-3′; antisense,
5′-UAACUCUCGCACAUCCCGCUG-3′; FOXO3 sense,
5′-AACUAAACCCUUUAGUGACAU-3′; antisense,
5′-GUCACUAAAGGGUUUAGUUUU-3′; negative control sense,
5′-CAUAAAUCUACAGGAUGAUTT-3′; antisense,
5′-AUCAUCCUGUAGAUUUAUGTT-3′.
CCK-8 assay
The cells (5,000/well) were seeded in 96-well plates
with three replicates per group. According to the manufacturer's
instructions, the absorbance at 450 nm was detected using a CCK-8
kit after incubation for 2 h (cat. no. ZP328-3; Beijing Zoman
Biotechnology Co., Ltd.) at 6, 24, 48 and 72 h after seeding the
cells. The absorbance value detected 6 h after seeding the cells
was considered as 0 h.
Statistical analysis
Data with normal distribution and skewed
distribution was analyzed by t test and Wilcoxon rank-sum test,
respectively. The results of the bioinformatics analysis were
analyzed using R software (version 4.2.0) and the Wilcoxon rank-sum
test. Kaplan-Meier survival curves were compared using the log-rank
test or two-stage method. The survival curves were plotted and
cut-off was selected by the survival package in R. The results of
RT-qPCR, western blot analysis and CCK-8 assay were analyzed using
Student's t-test. All statistical analyses were performed using R,
SPSS and GraphPad Prism (version 9.3.1; Dotmatics). P<0.05 was
considered to indicate a statistically significant difference.
Results
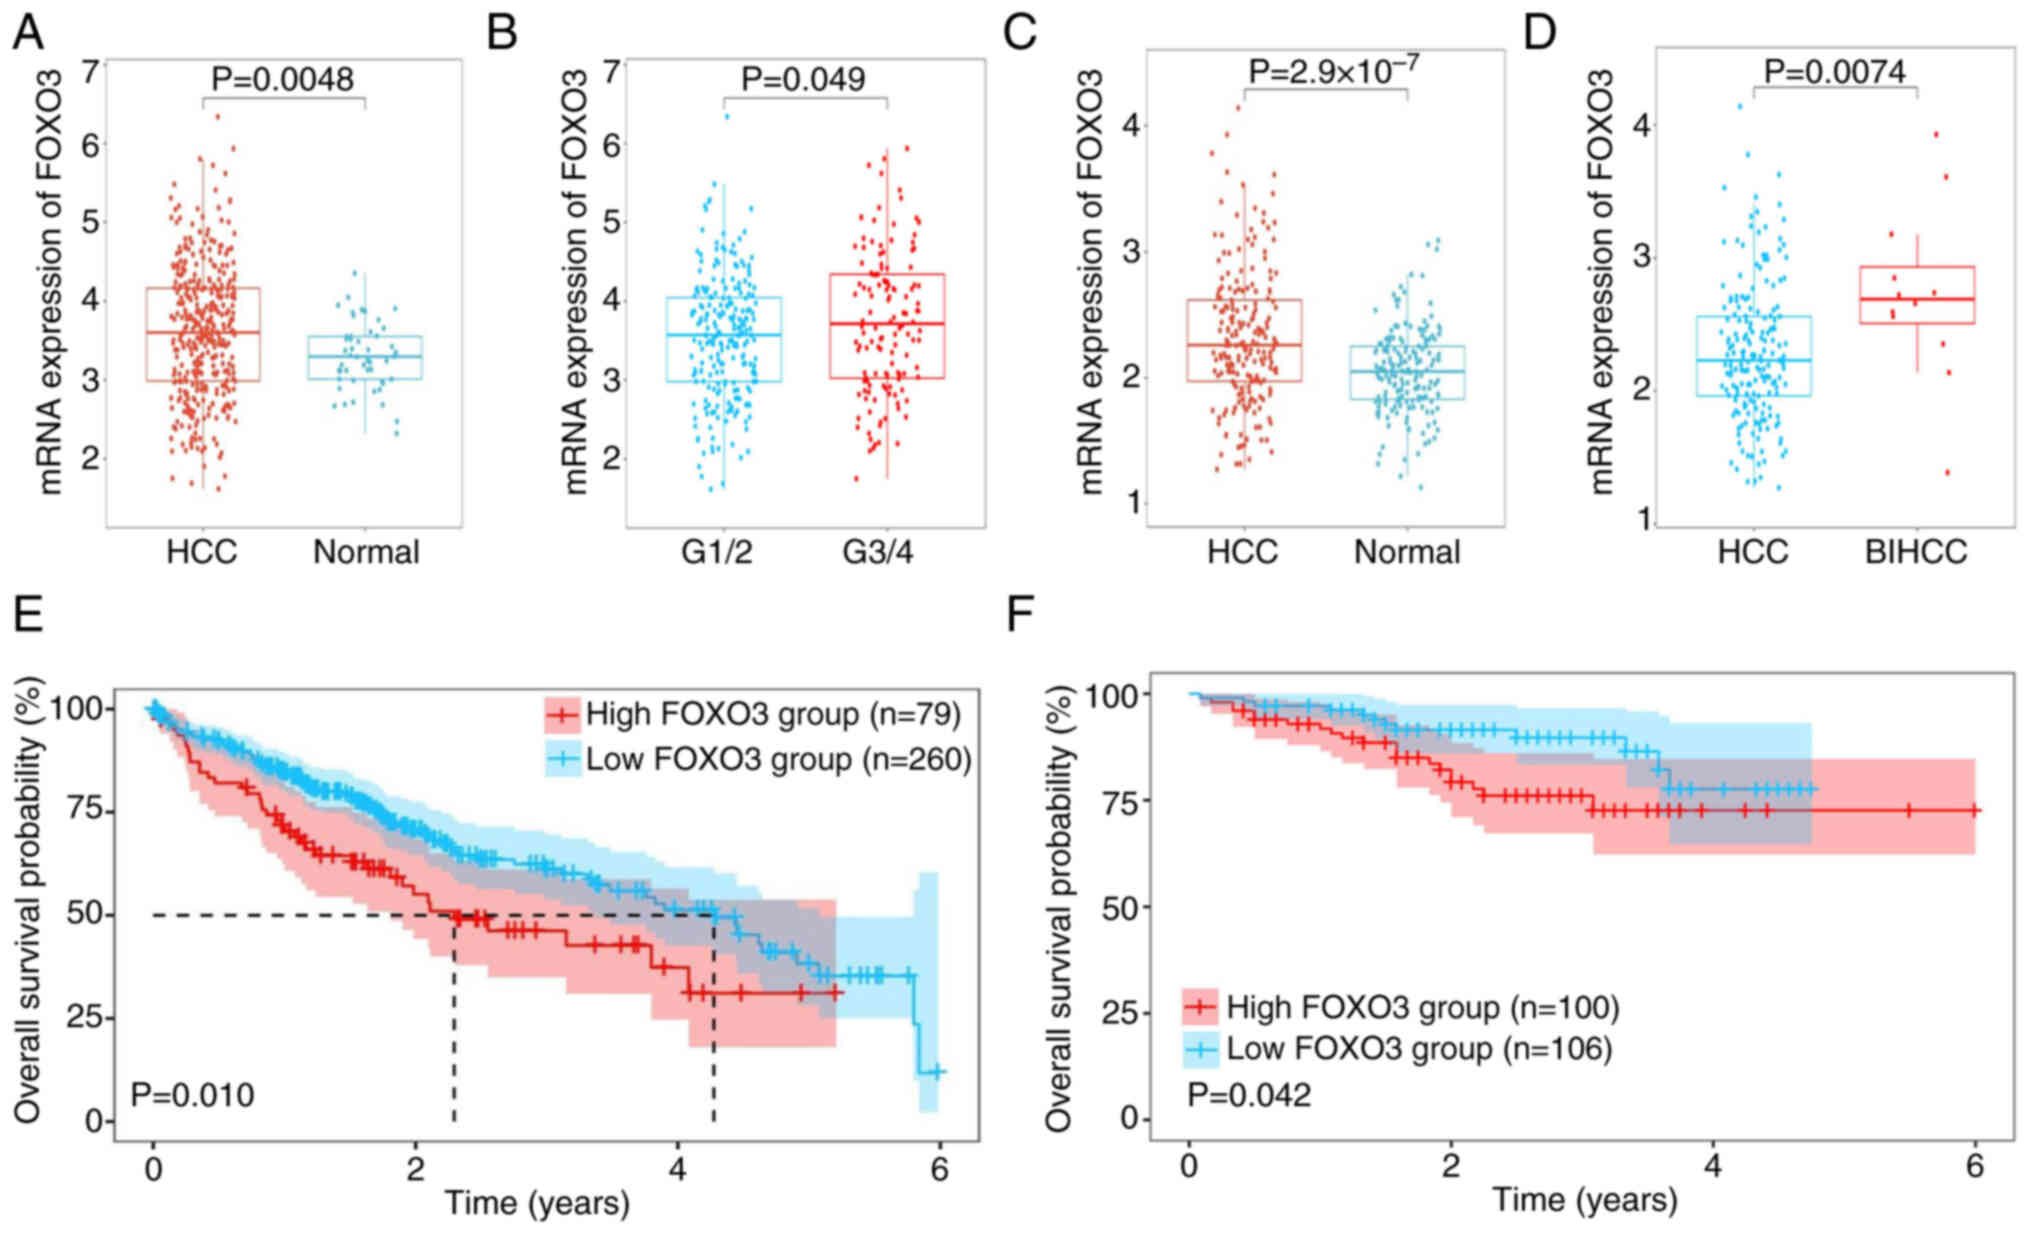
FOXO3 is highly expressed and
associated with poor prognosis in HCC
To evaluate the mRNA expression of FOXO3, the
transcriptome and corresponding clinical profiles of 365 patients
with HCC and 206 patients with HCC were obtained from TCGA and
ICGC-LIRI-JP, respectively. The mRNA expression of FOXO3 in HCC
tissues was higher compared with that in normal tissues in the TCGA
dataset (Fig. 1A). Moreover, the
patients with pathology grade G3/4 had higher expression of FOXO3
compared with grade G1/2 (Fig. 1B),
but the mRNA expression of FOXO3 was not associated with TNM
staging and vascular invasion (Fig.
S1A and B). The ICGC database was used to further validate
these findings. FOXO3 expression was significantly higher in HCC
tissues compared with normal tissues (Fig. 1C). Moreover, FOXO3 was significantly
higher in tissues with expressed in bile duct invasion HCC compared
with HCC (Fig. 1D), but the mRNA
expression of FOXO3 did not differ with higher TNM staging or with
vascular invasion (Fig. S1C and
D). Both databases indicate that high expression of FOXO3 was
strongly associated with poor prognosis in HCC (Fig. 1E and F).
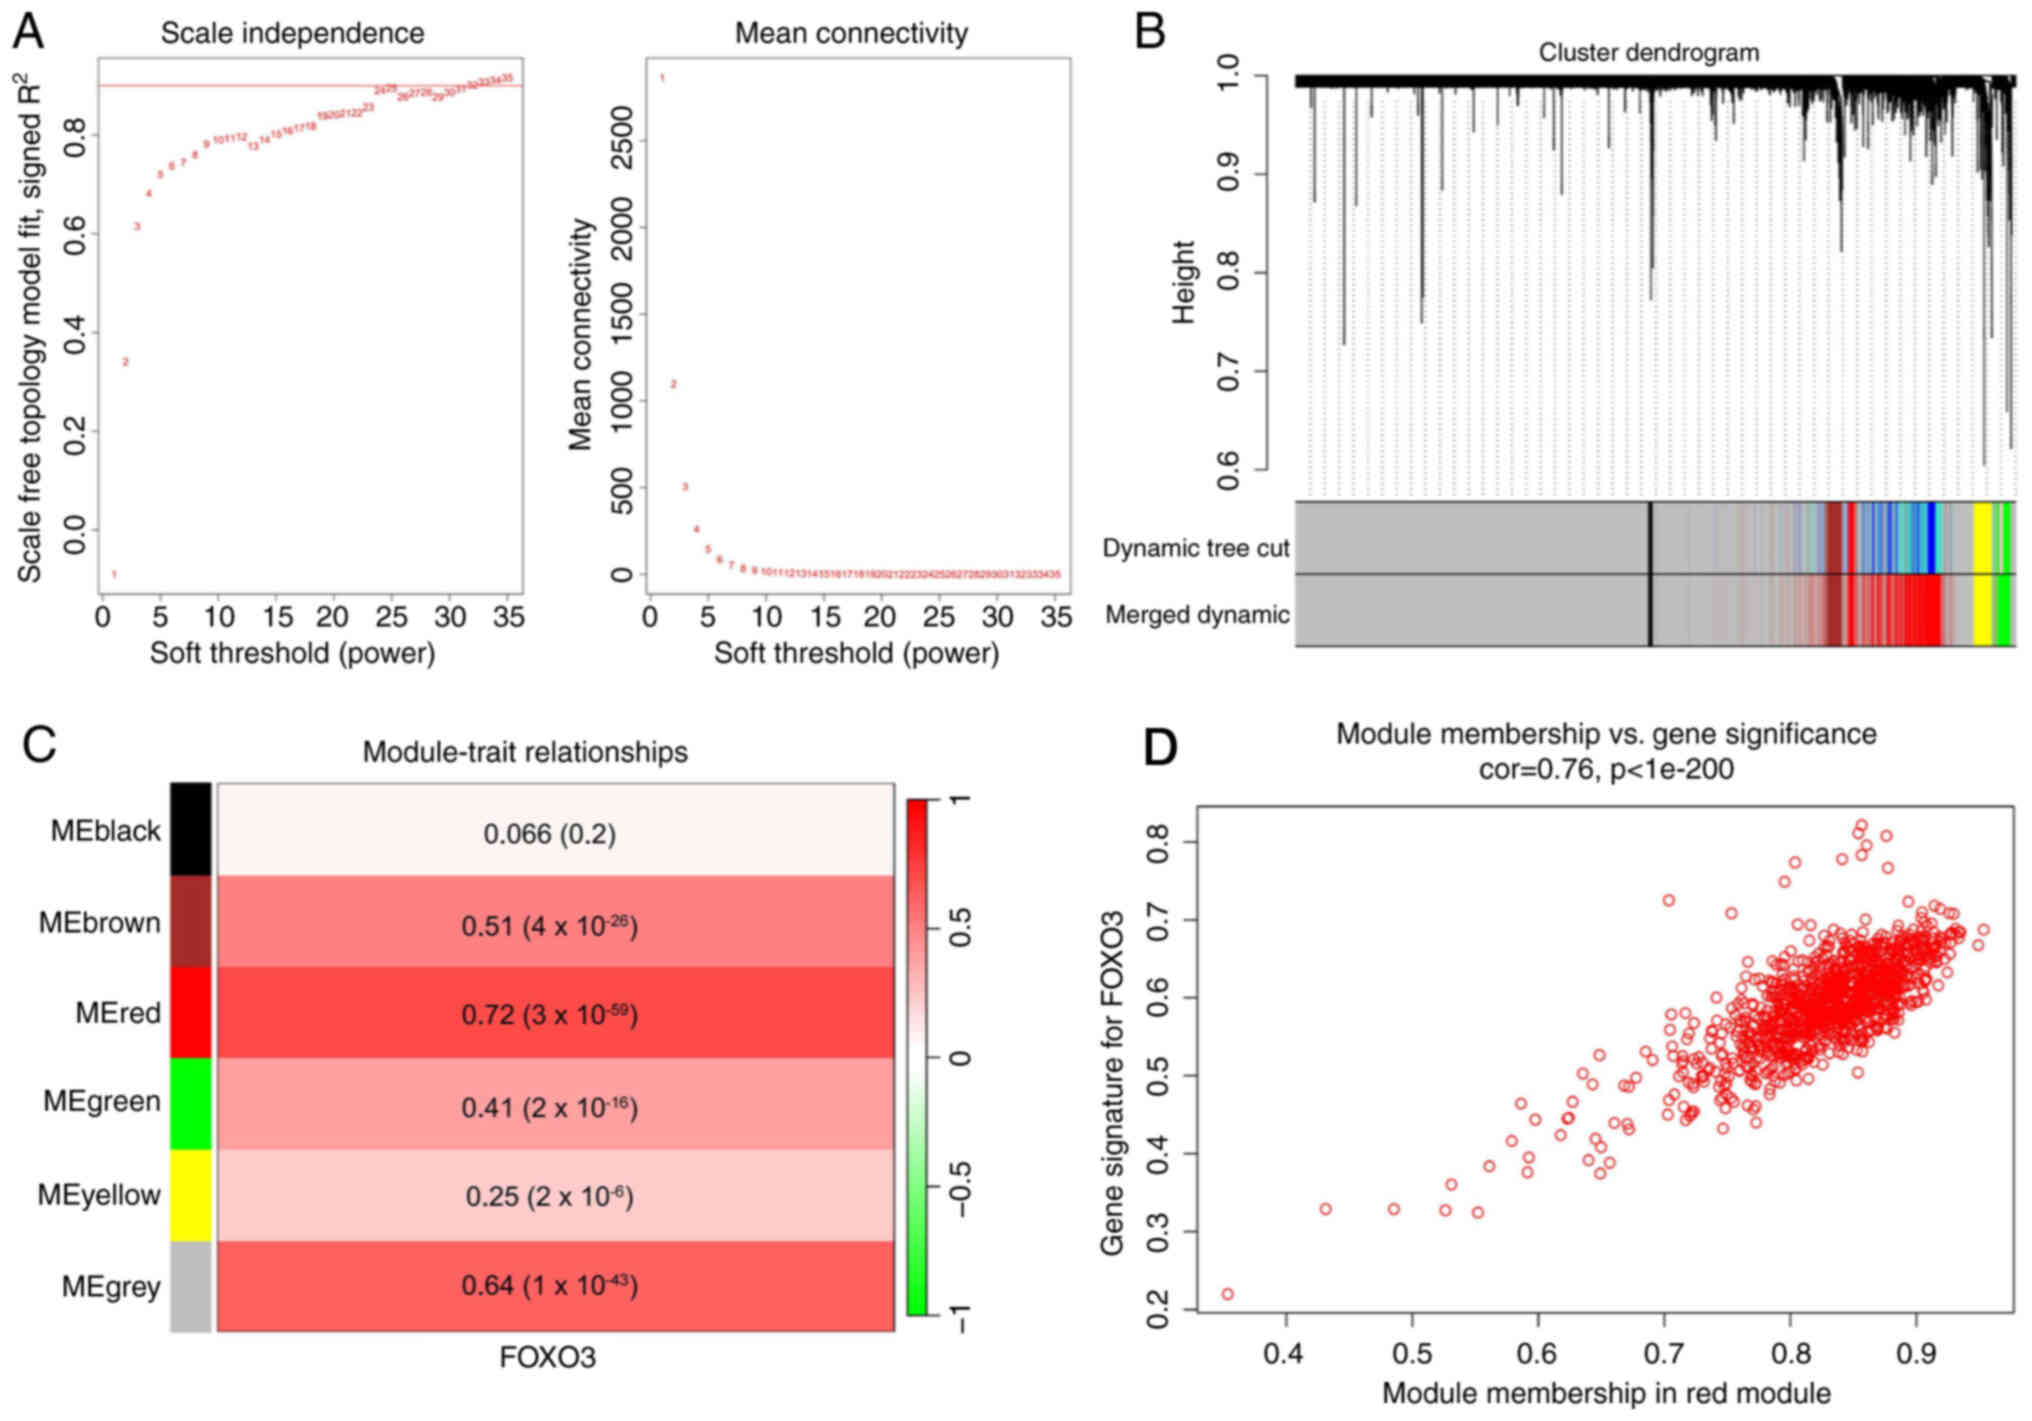
Identification of the FOXO3-associated
gene module in HCC
FOXO3, as a transcription factor, may serve an
important role in HCC; therefore, WGCNA was used to identify a
FOXO3-associated gene module. A scale-free network was constructed
using WGCNA in 365 patients with HCC from TCGA (Fig. 2A). The average-linkage hierarchical
clustering method was used to cluster genes and modules with
>80% similarity were merged (Fig.
2B), resulting in six modules. The correlations between each
module and the mRNA expression of FOXO3 in HCC were analyzed
(Fig. 2C), which indicated that the
red module was most closely related to FOXO3 (Pearson coefficient
of 0.72). The gene distribution in the red module was further
analyzed, which demonstrated that GS and MM were significantly
correlated, suggesting that genes in the red module were strongly
associated with FOXO3 (Fig.
2D).
Identification of FOXO3-associated key
gene signature in HCC
Based on the criteria of MM >0.8 and GS >0.2,
hub genes in the red module were identified, resulting in 875 hub
genes. Univariate Cox regression analysis was then used to screen
294 prognosis-associated genes from 875 genes with a P-value of
<0.05 (Fig. 3A). To further
narrow the range of variables, LASSO regression analysis was
performed, which identified five genes (DDX55, TAF1B, TAF3, RAB10
and RAB7A) for constructing the model according to the minimum λ
value (Fig. 3B and C). Fig. 3D shows the PPI network between FOXO3
and the 294 proteins obtained from univariate Cox regression
analysis.
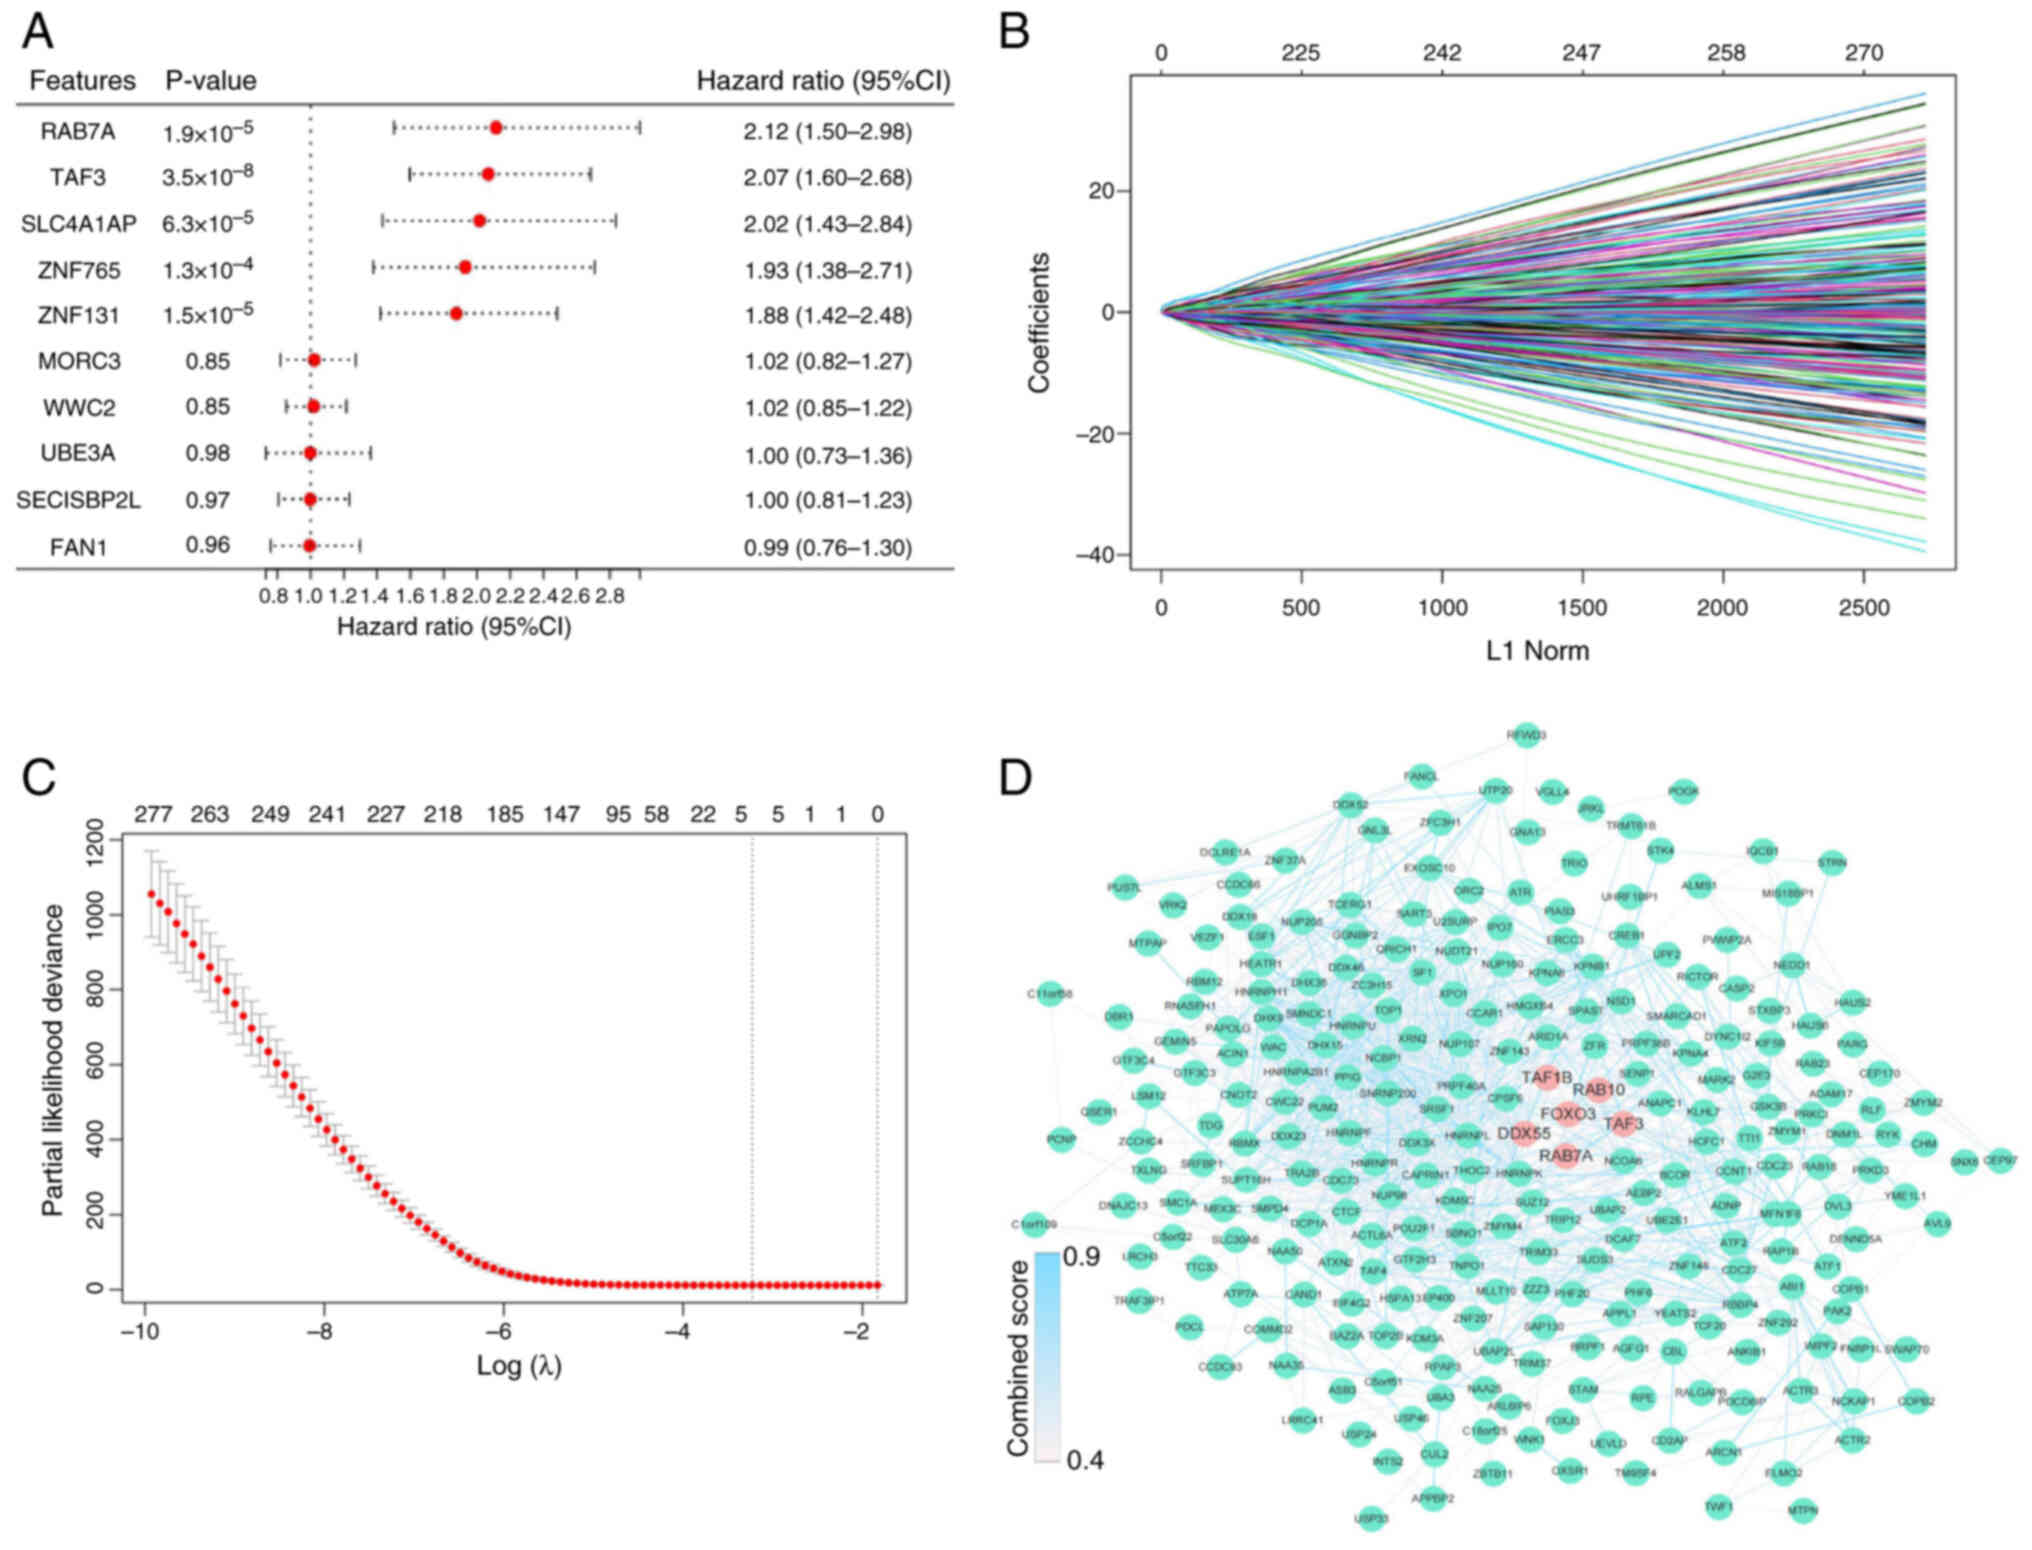 | Figure 3.Identification of the 5-gene
signature. (A) Forest plot of univariate Cox regression analysis in
The Cancer Genome Atlas dataset. Cox results for the top five and
bottom five genes. (B) Least absolute shrinkage and selection
operator regression analysis. (C) λ curves show the least absolute
shrinkage and the best λ was selected based on the minimum
criteria. (D) The protein-protein interaction network between FOXO3
and 294 genes. FOXO3, DDX55, RAB10, RAB7A, TAF1B and TAF3 are
highlighted by red dots and the remaining genes are represented by
green dots. The color of the edges was determined by the combined
score obtained from STRING. FOXO3, Forkhead box O3; DDX55, DEAD-box
helicase 55; RAB10, RAB10, member RAS oncogene family; RAB7A,
RAB7A, member RAS oncogene family; TAF1B, TATA-box binding protein
associated factor, RNA polymerase I subunit B; TAF3, TATA-box
binding protein associated factor 3; SLC4A1AP, solute carrier
family 4 member 1 adaptor protein; ZNF765, zinc finger protein 765;
MORC3, MORC family CW-type zinc finger 3; WWC2, WW and C2 domain
containing 2; UBE3A, ubiquitin protein ligase E3A; SECISBP2L, SECIS
binding protein 2 like; FAN1, FANCD2 And FANCI associated nuclease
1. |
Construction and validation of a
prognostic model based on the five genes
According to the results of LASSO regression
analysis, the expression values and regression coefficients of
these five genes for each sample were used to calculate the RS of
each sample. Subsequently, the cut-off values of the RS were
obtained using X-tile software and the patients were divided into
high-risk and low-risk groups (Fig.
4A). All five genes were more highly expressed in the high-risk
group and the patients with HCC in the high-risk group had a worse
prognosis compared with the low-risk group (Fig. 4B). The time-dependent ROC curve
showed that the area under the curve (AUC) values for 1, 3 and 5
years were 0.73, 0.69 and 0.71, respectively (Fig. 4C). ICGC data was used to evaluate
the robustness of the model and similar results were obtained
(Fig. 4D-F). Moreover, the present
model was compared with other prognostic models which found the AUC
values (1-year) of the present model were higher compared with the
AUC values (1-year) of other models in training and validation sets
(Table SII) (29–33).
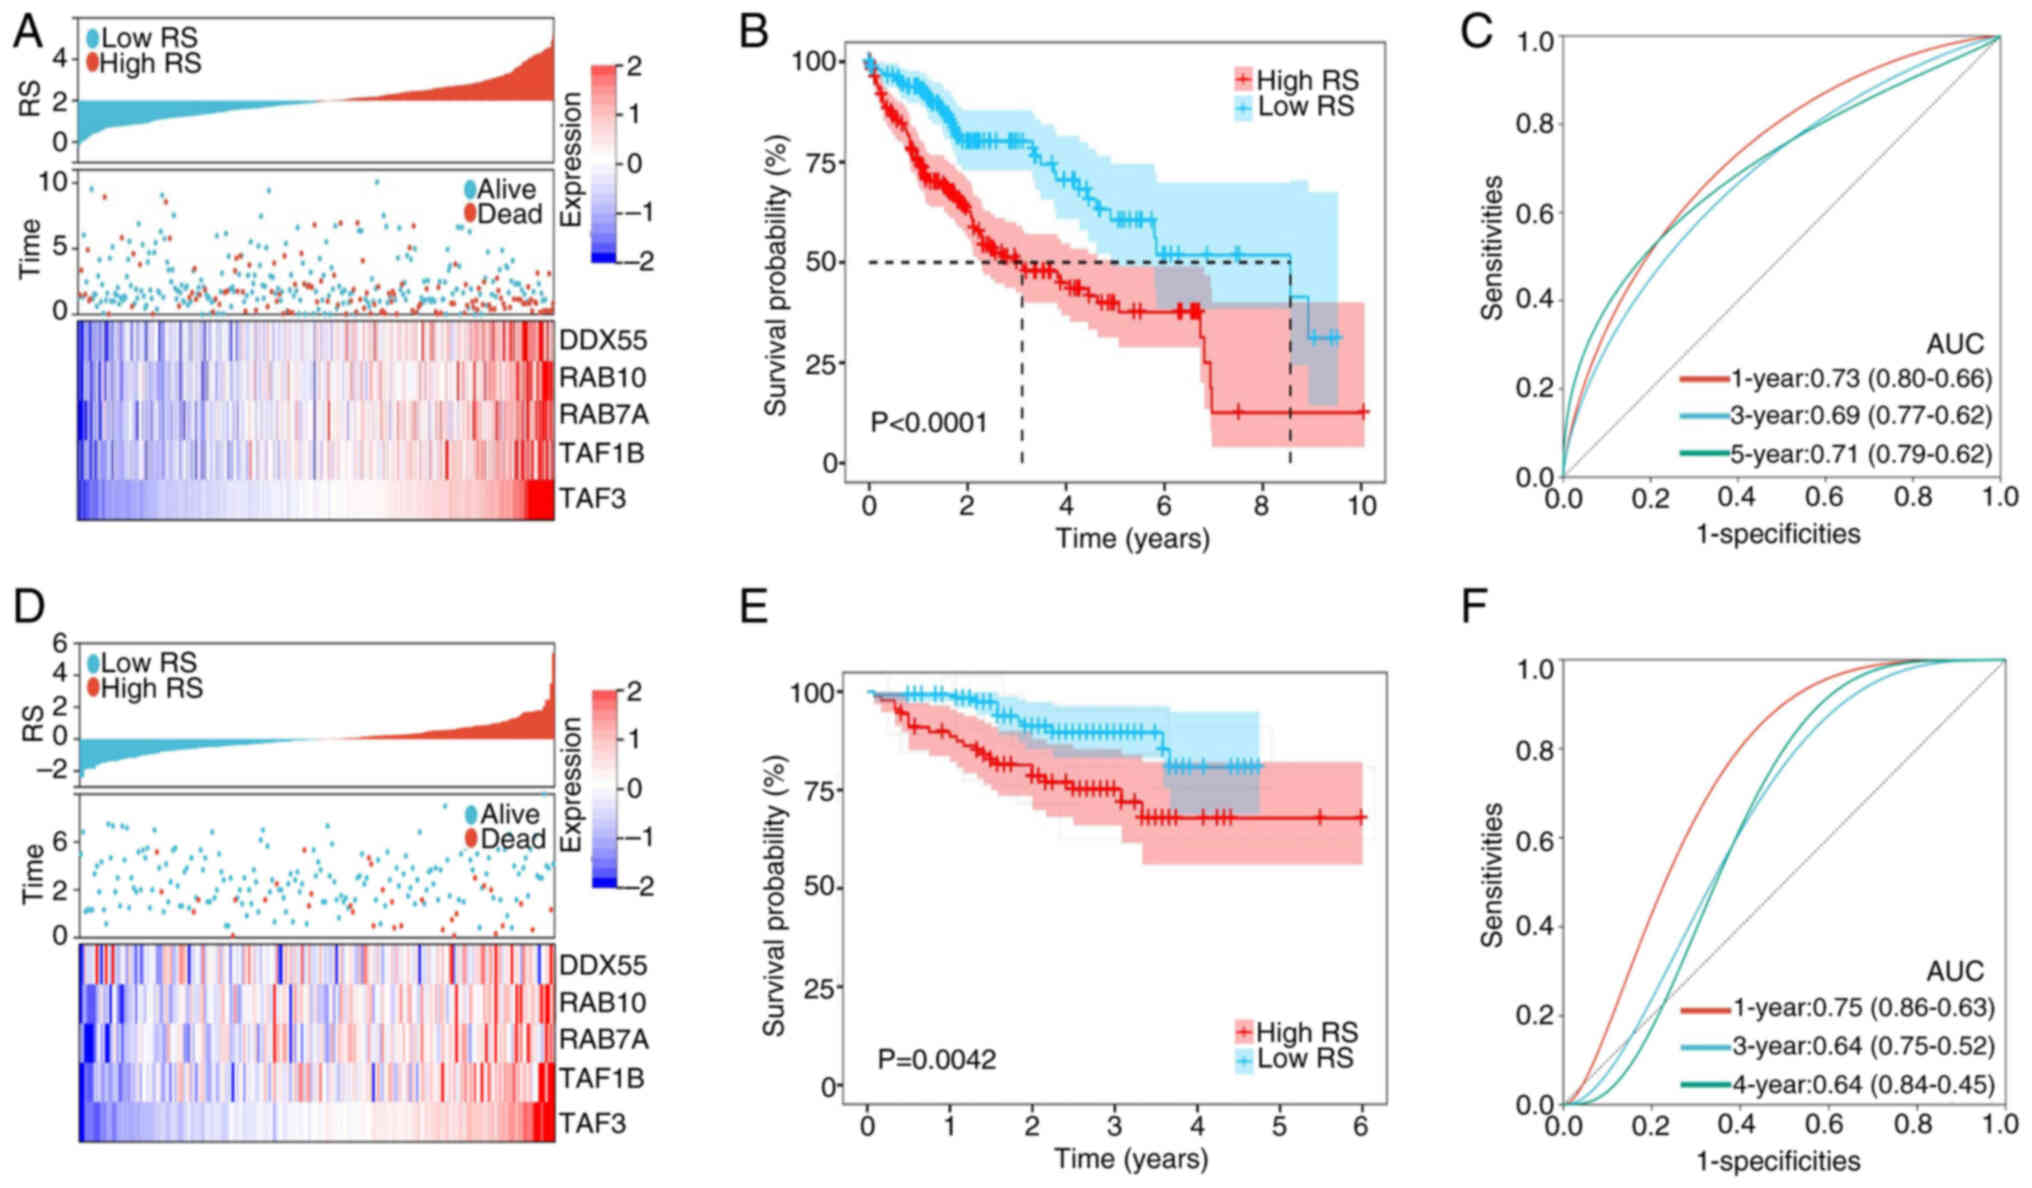 | Figure 4.Construction and validation of a
5-gene prognostic model. (A) The distribution of RS, survival
status and expression of the 5-gene signature between the high- and
low-risk groups in TCGA dataset. (B) Overall survival of patients
with HCC in the high- and low- RS groups in TCGA dataset. (C)
Time-dependent ROC curve of RS in TCGA dataset. (D) The
distribution of RS, survival status and expression of the 5-gene
signature between the high- and low-risk groups in the ICGC
dataset. (E) Overall survival of patients with HCC in the high- and
low-RS groups in the ICGC dataset. (F) Time-dependent ROC curve of
RS in the ICGC dataset. RS, risk score; TCGA, The Cancer Genome
Atlas; ICGC, International Cancer Genome Consortium; ROC, receiver
operating characteristic; DDX55, DEAD-box helicase 55; RAB10,
RAB10, member RAS oncogene family; RAB7A, RAB7A, member RAS
oncogene family; TAF1B, TATA-box binding protein associated factor,
RNA polymerase I subunit B; TAF3, TATA-box binding protein
associated factor 3; AUC, area under the curve. |
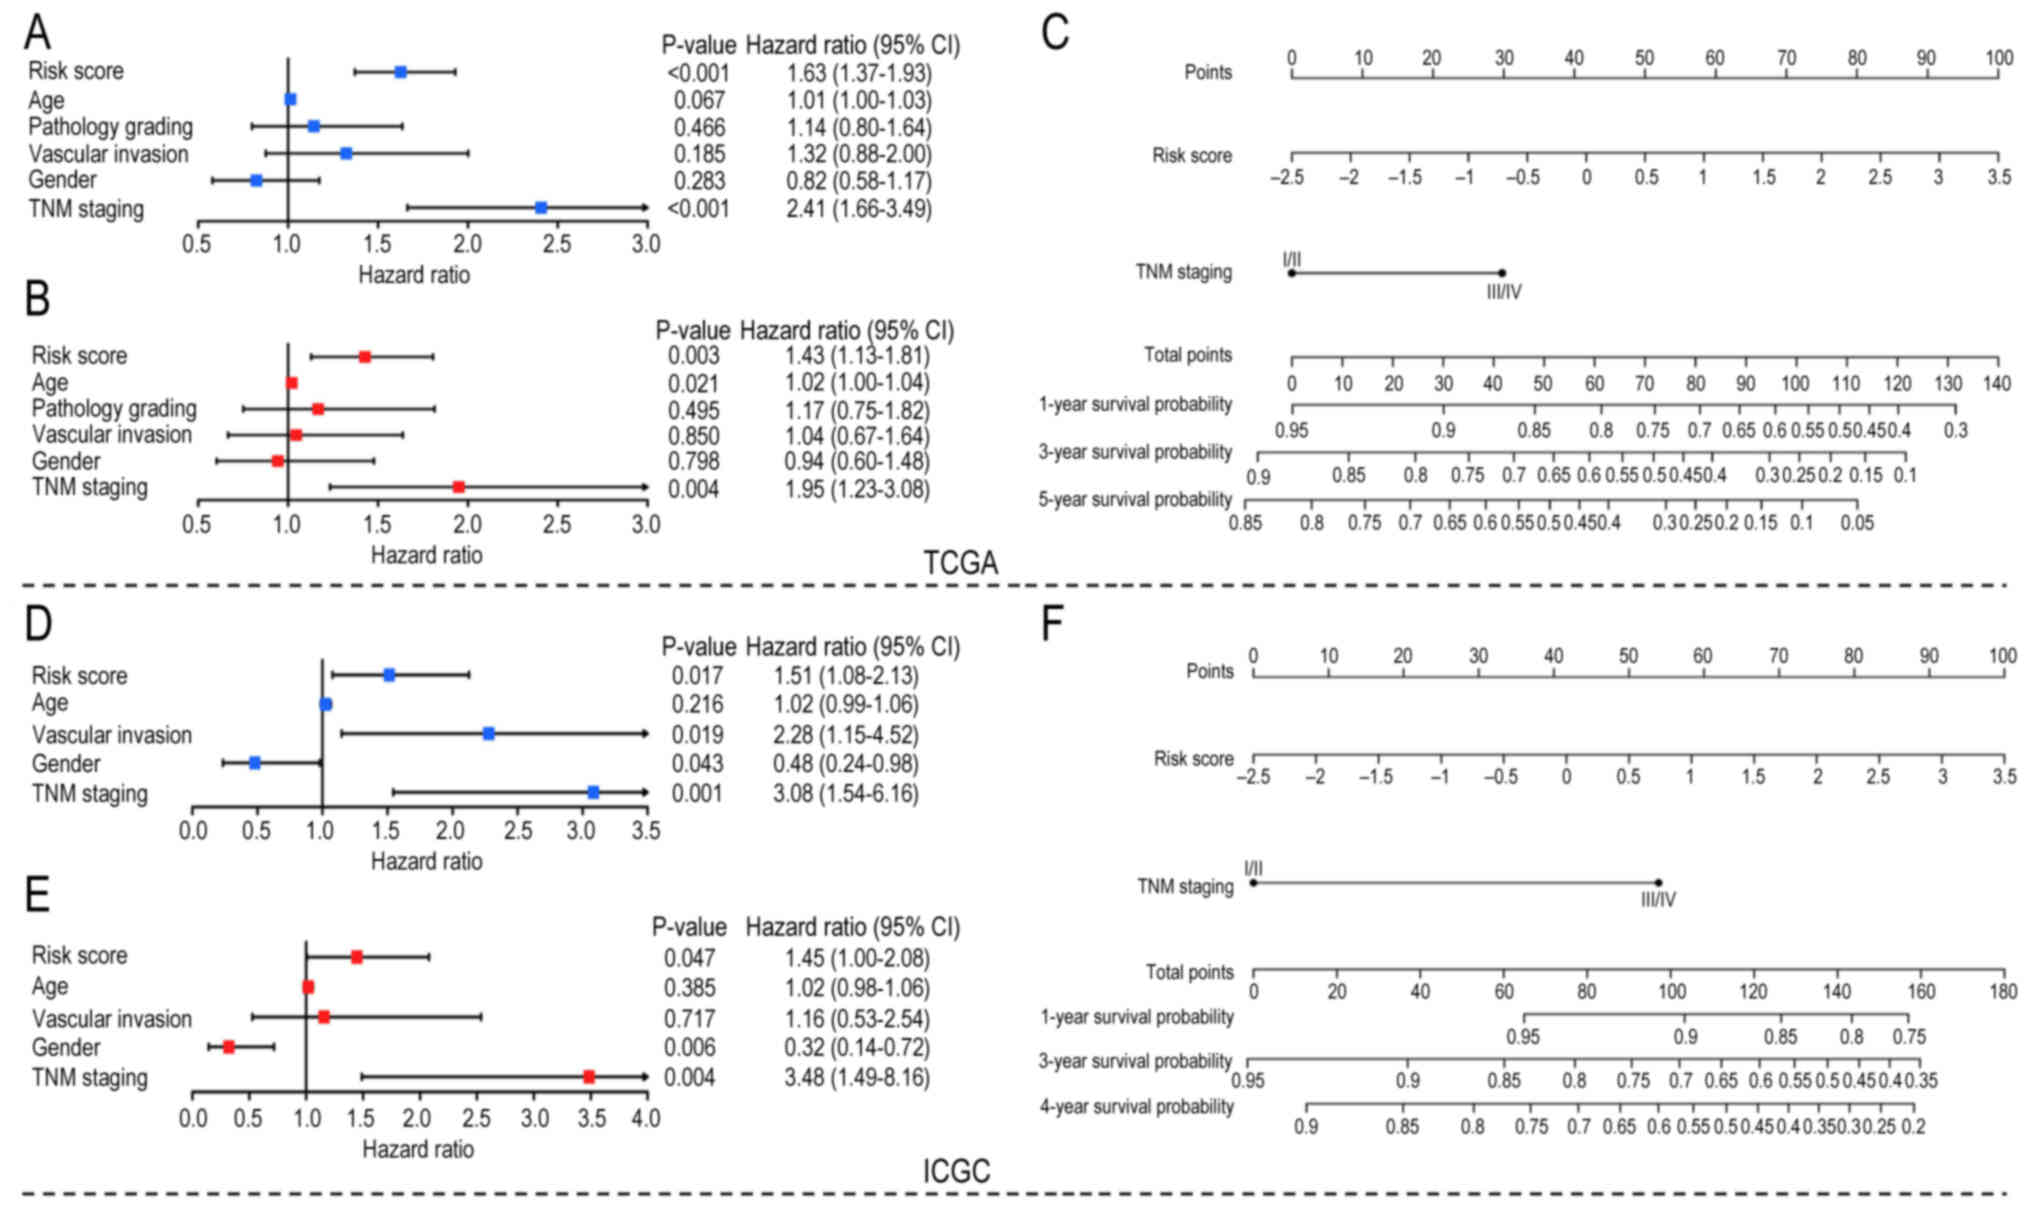
RS potential to evaluate HCC
prognosis
To further evaluate the clinical value of the model,
univariate and multivariate Cox regression analyses were used to
analyze the RS and other clinical factors (age, sex, TNM staging
and vascular invasion) in both datasets. Both univariate Cox
analysis (Fig. 5A and D) and
multivariate Cox analysis (Fig. 5B and
E) showed that RS and TNM staging were risk factors in both
datasets. Considering that TNM staging has been accepted as a
standard prognostic method, these results suggested that RS has
potential for clinical prognostic evaluation. In addition, RS and
TNM staging in TCGA and ICGC Cox analysis showed similar
statistical significance, although TNM staging has a higher hazard
ratio. However, age, sex and vascular invasion were statistically
significant only in partial Cox analyses. TNM staging and RS were
used to construct nomograms in both datasets to quantify prognostic
scores for patients with HCC. For TCGA dataset, the survival
probability of patients with HCC with total points >100 was
<0.6 (Fig. 5C). Similarly, the
4-year survival probability of patients with HCC with total points
>100 was <0.6 in the ICGC dataset (Fig. 5F). The calibration curves of TCGA
and ICGC datasets are shown in Fig.
S2.
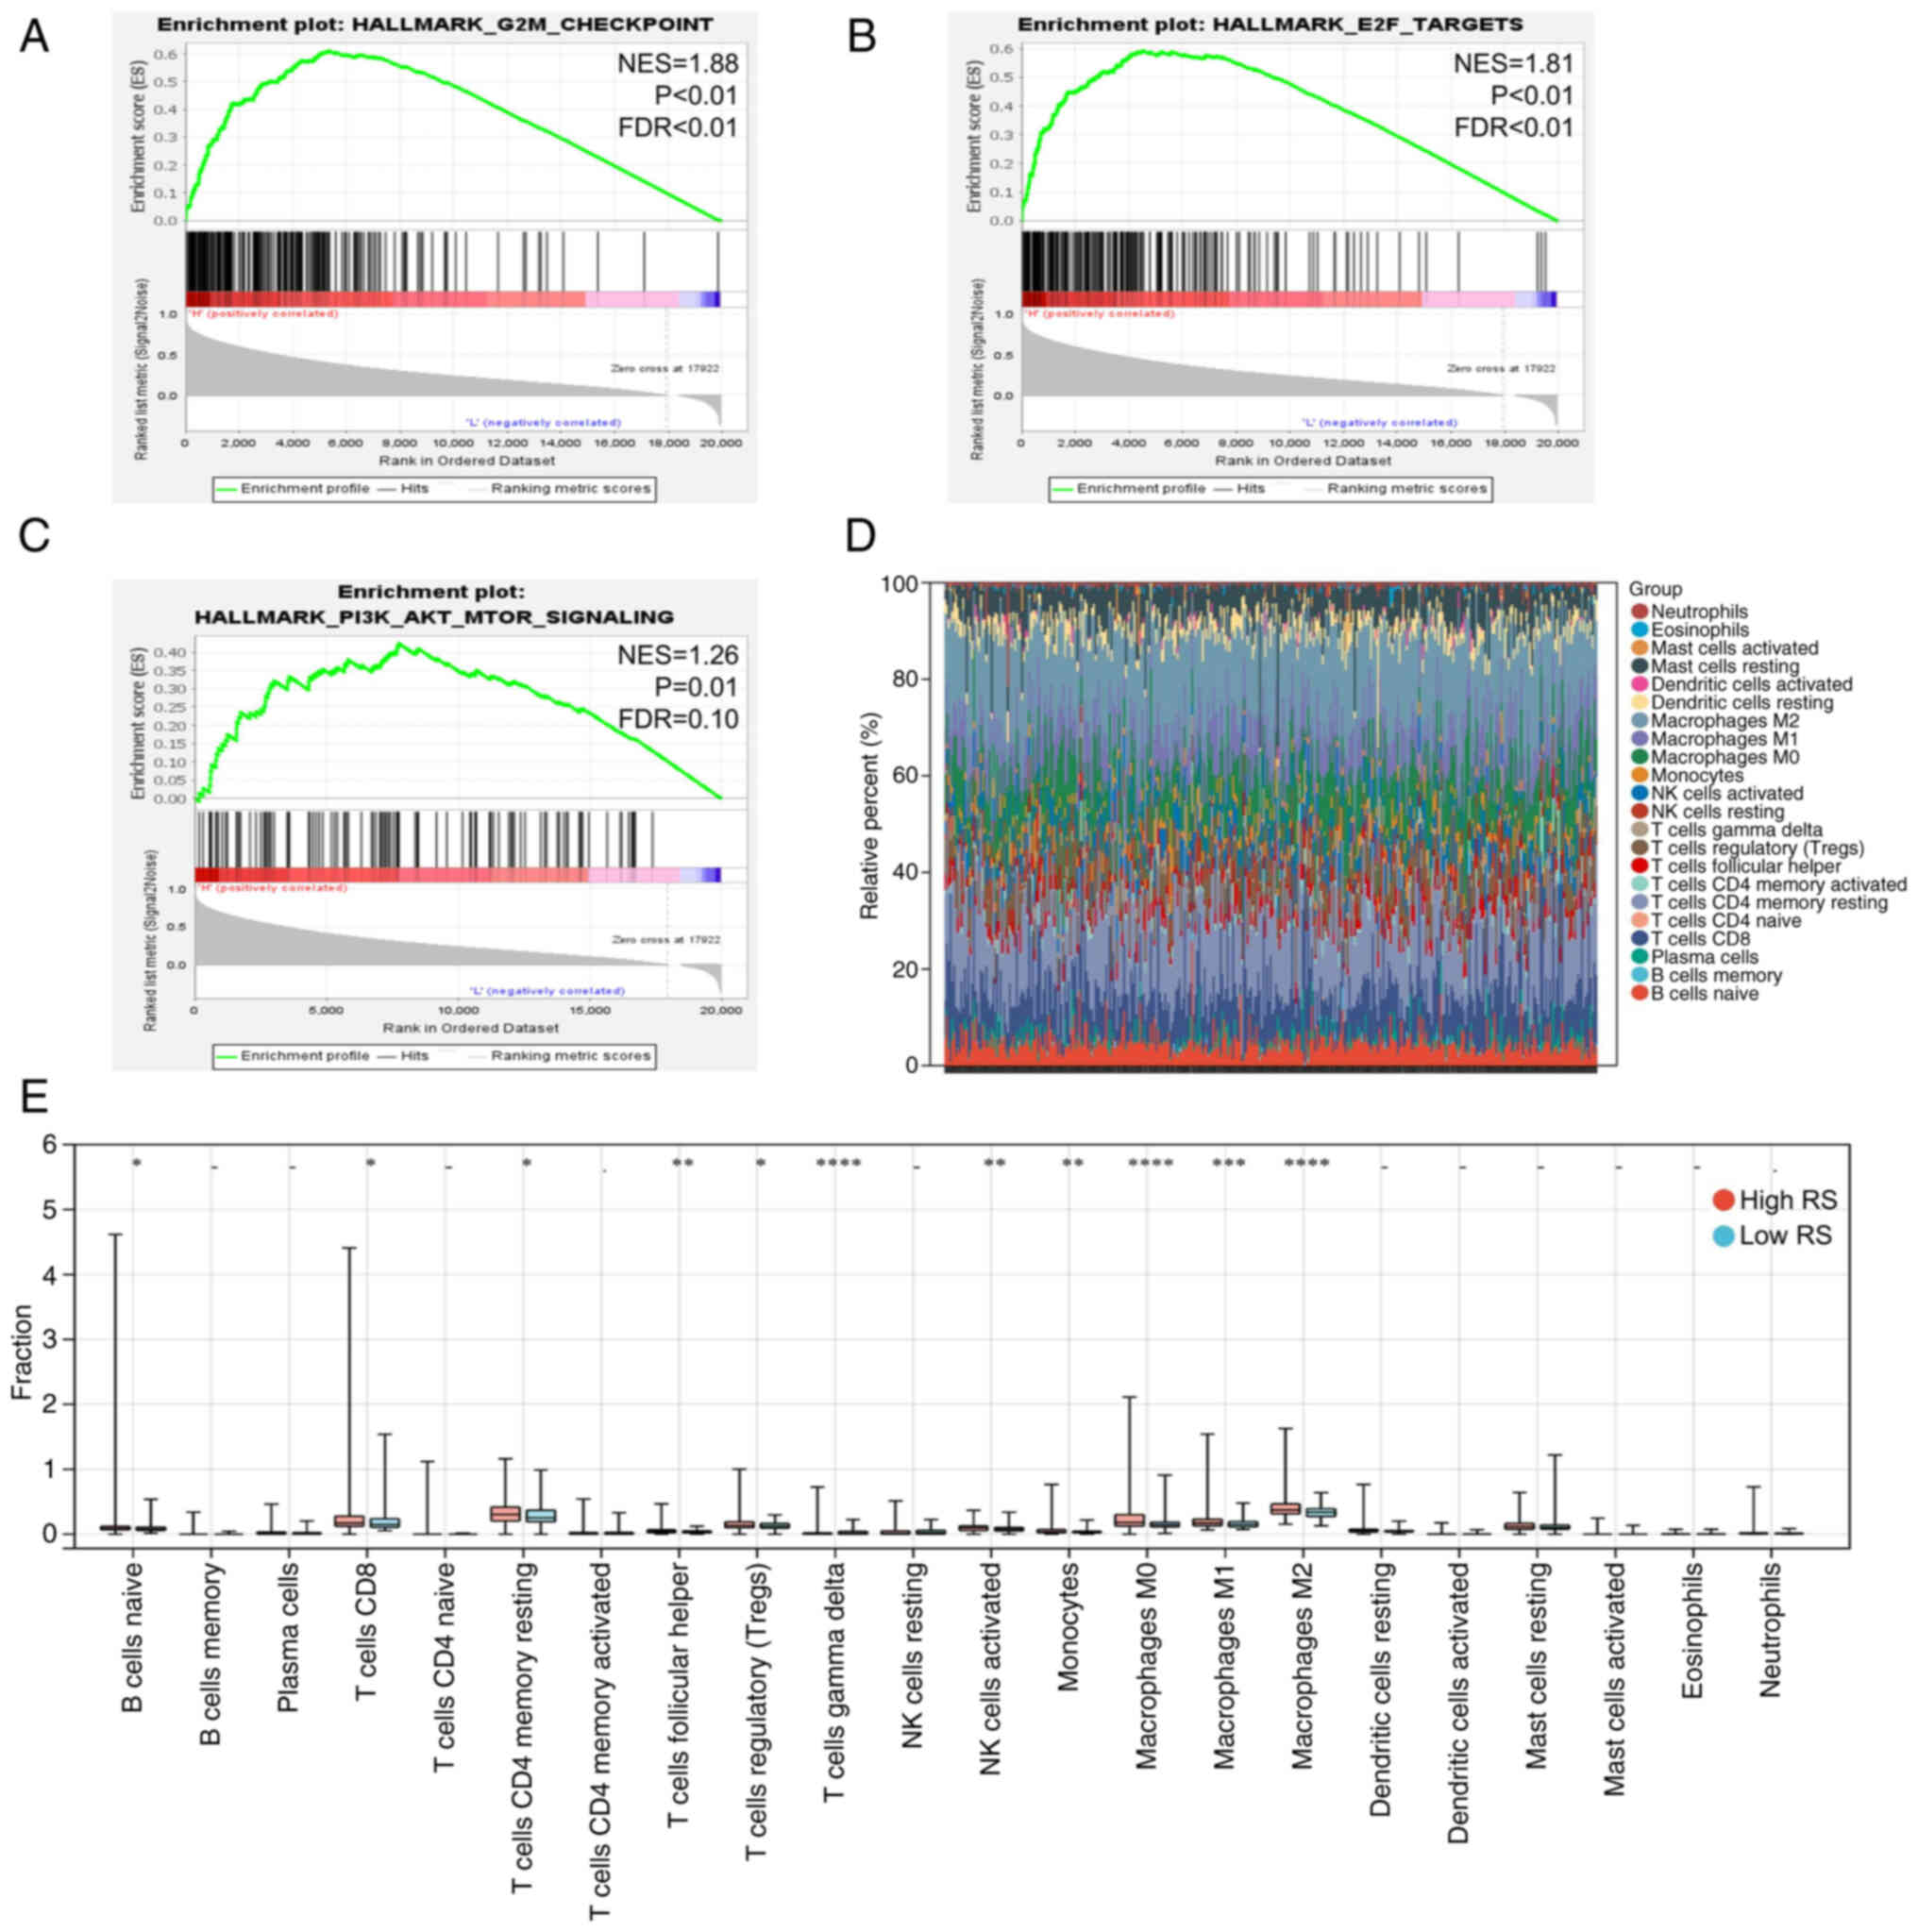
Differences in the carcinogenic
pathways and tumor microenvironment between high- and low-risk
groups
Activation of carcinogenic pathways is an integral
part of tumor progression (32). In
HCC, tumor development is often accompanied by activation of cell
cycle-associated pathways and phosphorylation of the AKT pathway
and the activity of these pathways suggests poor prognosis of
patients (34). In the present
study, GSEA was performed for patients in the high- and low-RS
groups, which demonstrated that the cell cycle-associated pathways
(G2/M checkpoint and E2F targets) and AKT pathway were
more active in the high-RS group (Fig.
6A-C), partly explaining why patients in the high-risk group
had worse outcomes. Similar results were obtained from the ICGC
dataset (Fig. S3A-C).
The tumor microenvironment, in which several immune
cells play a major role, is another important factor mediating
tumor prognosis (35). Thus, the
infiltration of 22 immune cell types was quantified using
transcriptome data from patients in the high- and low-risk groups.
In TCGA and ICGC datasets, M2 macrophages and CD4+ T
cells were the main immune cells enriched in the tumor
microenvironment (Figs. 6D and
S3D). In addition, there was more
infiltration of M2 macrophages and resting CD4+ memory T
cells in the high-risk group compared with the low-risk group in
TCGA dataset (Fig. 6E). Compared
with the high-risk groups, a higher infiltration of activated
natural killer cells was found in the low-risk groups in TCGA and
ICGC datasets (Figs. 6E and
S3E).
Identification and validation of the
5-gene signature in HCC
The expression of the five genes (DDX55, RAB10,
RAB7A, TAF1B and TAF3) used for constructing the model in HCC was
further investigated. TCGA and ICGA datasets both showed that these
five genes were highly expressed in HCC tissues compared with
normal tissues (Figs. 7A and
S4A). Moreover, the high
expression of these five genes in TCGA dataset was significantly
associated with poor prognosis of HCC, while only the expression of
the RAB10, RAB7A and TAF3 genes was associated with poor prognosis
of patients with HCC in the ICGC dataset (Figs. 7B-F and S4B-F). To validate these results, tumor
and matched non-tumor tissues were collected from ten patients with
HCC. The RT-qPCR analysis indicated that the mRNA expression of the
five genes in tumor tissues was higher compared with that in
non-tumor tissues (Fig. 7G).
Immunohistochemical results from the Human Protein Atlas (HPA)
database suggested that DDX55, RAB10 and RAB7A have higher
expression in tumor tissue compared with non-tumor tissue (Fig. 7H) (36). However, it was not possible to
obtain representative immunohistochemical staining results for
TAF1B and TAF3 from the HPA database. Western blot analysis
demonstrated that there was higher protein expression levels of all
five proteins in tumor tissues compared with non-tumor tissues
(Fig. 7I).
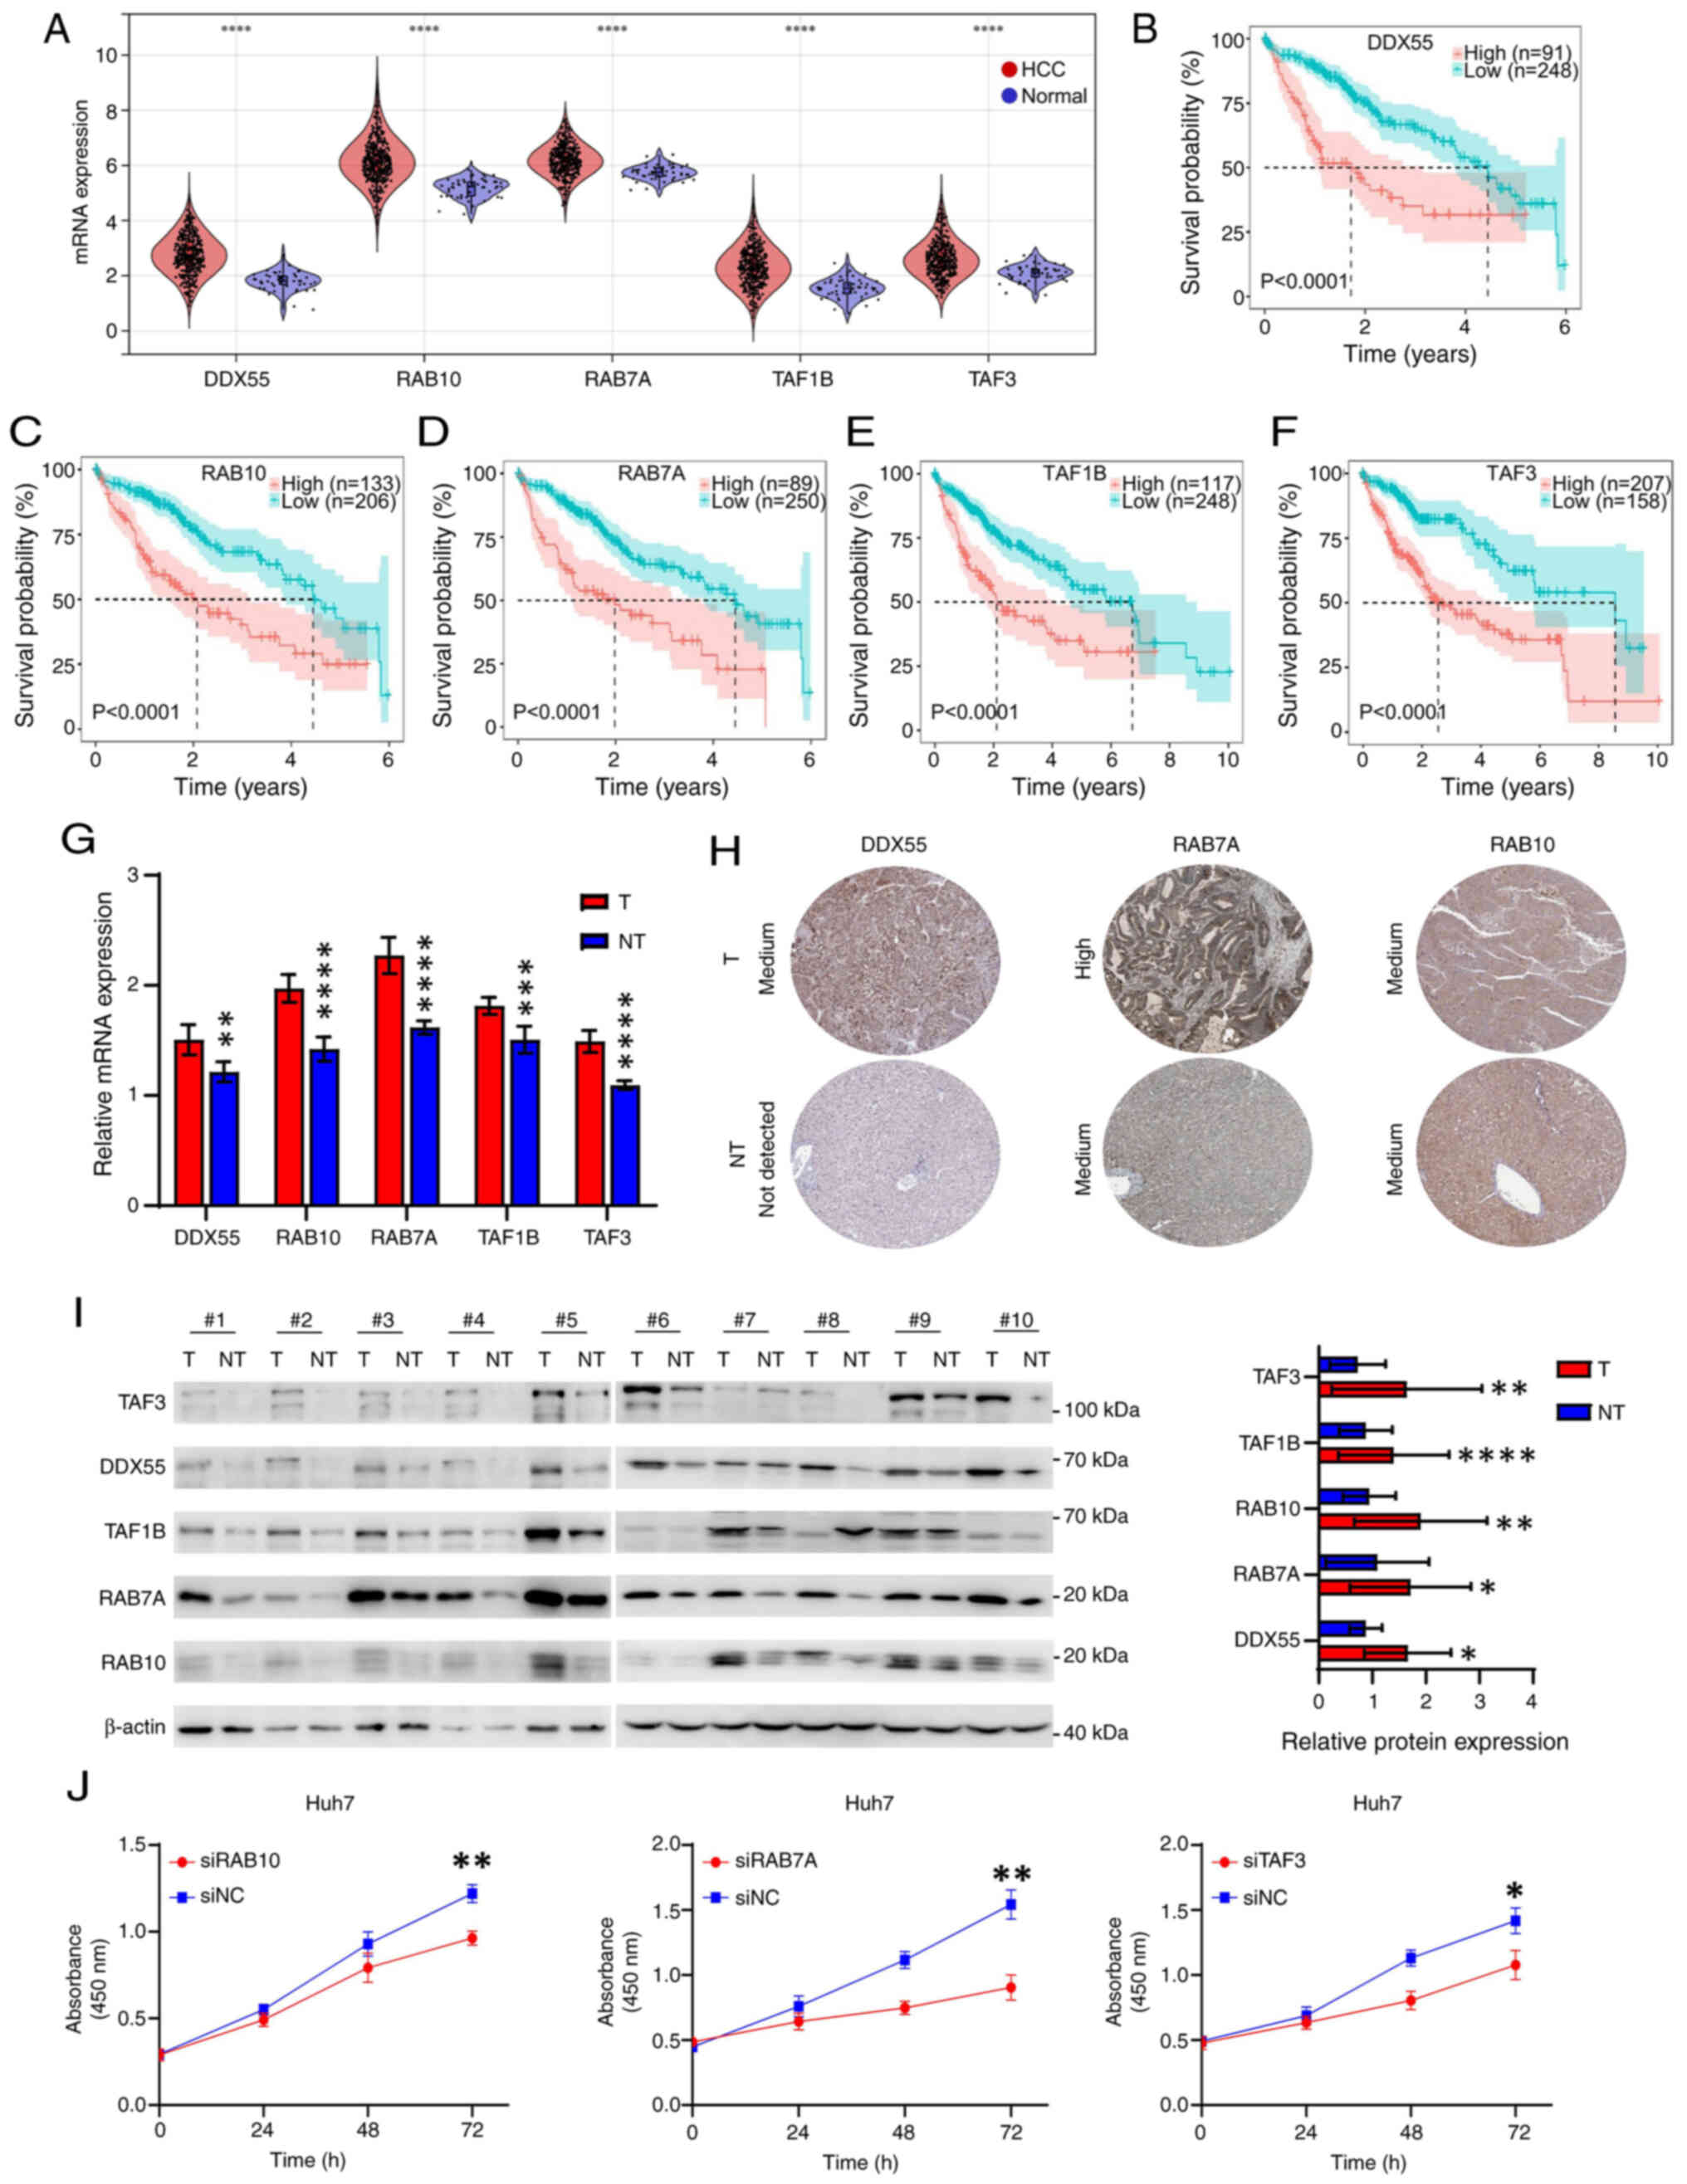 | Figure 7.Identification of five biomarkers in
HCC. (A) mRNA expression of DDX55, RAB10, RAB7A, TAF1B and TAF3 in
HCC and normal tissues from TCGA. Overall survival curves in
patients with HCC with high or low expression of (B) DDX55, (C)
RAB10, (D) RAB7A, (E) TAF1B and (F) TAF3 from TCGA dataset. The
best cut-off value for each gene was obtained using the X-tile
software. (G) mRNA expression of DDX55, RAB10, RAB7A, TAF1B and
TAF3 in HCC and paired paracancerous tissues from 10 patients with
HCC, assessed using reverse transcription-quantitative PCR. (H)
Immunohistochemical images of DDX55, RAB10 and RAB7A in HCC and
normal tissues obtained from the HPA. (I) Protein expression of
DDX55, RAB10, RAB7A, TAF1B and TAF3 in HCC and paired paracancerous
tissues from 10 patients with HCC, evaluated using western blot
analysis. The figure on the right is a relative semi-quantitative
histogram of protein expression. The gray values were obtained by
ImageJ and analyzed using GraphPad Prism. (J) Cell Counting Kit-8
curves after knockdown of RAB10, RAB7A and TAF3 in Huh7 cells by
siRNA. *P<0.05; **P<0.01; ***P<0.001; ****P<0.0001. T,
tumor; NT, not-tumor; HCC, hepatocellular carcinoma; TCGA, The
Cancer Genome Atlas; DDX55, DEAD-box helicase 55; RAB10, RAB10,
member RAS oncogene family; RAB7A, RAB7A, member RAS oncogene
family; TAF1B, TATA-box binding protein associated factor, RNA
polymerase I subunit B; TAF3, TATA-box binding protein associated
factor 3; HPA, The Human Protein Atlas; NC, negative control. |
To further explore the influence of the genes of
interest on HCC progression, three genes (RAB10, RAB7A and TAF3)
that were significantly associated with prognosis in both TCGA and
ICGC datasets were selected for functional experiments. The CCK-8
assay demonstrated that knockdown of RAB10, RAB7A and TAF3
inhibited the proliferation of Huh7 cells (Figs. 7J and S4G). Moreover, the AUC values (1-year)
among five genes, RS and TNM in TCGA and ICGC datasets were
compared which demonstrated the five genes and RS were not inferior
to TNM in predicting first-year survival status of patients with
HCC (Fig. S5A and B). In addition,
the protein expression of FOXO3 was knocked down using siRNA
(Fig. S5C). The protein expression
levels of the other five proteins (DDX55, RAB10, RAB7A, TAF3 and
TAF1B) were also downregulated after knocking down FOXO3 (Fig. S5D). Additionally, mRNA levels of
FOXO3 were positively correlated with mRNA levels of the 5 genes in
both TCGA and ICGA datasets (Fig.
S6).
Discussion
The FOXO protein has four subtypes, FOXO1, FOXO3,
FOXO4 and FOXO6 (8). The
distribution of the four subtypes is different: FOXO1 is highly
expressed in fat cells, FOXO4 is highly expressed in muscle cells
and FOXO6 is highly expressed in brain tissue. Only FOXO3 is highly
expressed in hepatocytes (9).
Previous studies have focused on FOXO3 as the downstream effector
of several tumor-associated pathways (such as AKT and AMP-activated
protein kinase) to mediate the development of tumors. However,
further exploration is needed for downstream targets of FOXO3.
Currently, the role of FOXO3 in HCC is controversial (16–18).
The present study revealed that FOXO3 was highly expressed in HCC
tissue and indicated a poor prognosis. Bioinformatics analysis
identified five FOXO3-associated genes (DDX55, RAB10, RAB7A, TAF1B
and TAF3). The training and validation sets confirmed the
robustness and clinical potential of the prognostic model. Subtypes
analysis indicated that patients with HCC in the high-risk group
had significantly more active carcinogenic pathways and tumor
microenvironment. Moreover, RAB10, RAB7A and TAF3 were identified
as potential genes involved in tumor development.
WGCNA combined with LASSO to construct prognostic
models and molecular typing have previously been used for
colorectal and liver cancer (37–42).
For example, a 4-signature model based on the scRNA-seq and bulk
RNA-seq data could evaluate the prognostic risk of patients with
colorectal cancer. Similarly, a prognostic model based on the SMG5
and MRPL9 genes predicted the tumor mutation burden of HCC
patients. The advantage of public databases is that they have
large-scale open information of clinical samples and gene
expression profiles and the utilization of these resources has
promoted the development of molecular diagnostic and prognostic
models in the field of cancer. An increasing number of prognostic
models and molecular typing methods have been developed in HCC and
some sequencing studies based on large-scale new clinical HCC
samples have supported the potential use of bioinformatics in tumor
prognosis assessment (4–6,40).
Compared with models of the same modeling method, the model in the
present study had fewer signatures, which was conducive to the
translation of the model to the clinic. Additionally, in the
external validation set (not including the internal validation set
from the same database), the present model had significantly
improved AUC values in the first year compared with other models.
The subsequent 3-year and 5-year AUC values also had a slight
advantage, suggesting that the present model has improved
robustness compared with other models. Notably, the Cox analysis
results showed some differences in clinical features (TNM, sex and
vascular invasion) between the two datasets. This is potentially
due to the high heterogeneity of HCC; specifically, clinical
features, heterogeneous gene expression and sample size may cause
these differences between the TCGA and ICGC cohorts. However, these
differences did not affect the conclusions of the present study
because intersections were taken in both datasets.
The present study identified and confirmed three
genes, RAB10, RAB7A and TAF3, with potential as biomarkers.
Knockdown of RAB10 inhibits the proliferation of HCC cells in
vivo and in vitro and is accompanied by downregulated
activity of multiple carcinogenic pathways (such as AKT, insulin
receptor and AXL receptor tyrosine kinase) (42). O-GlcNAcylation of RAB10 has also
been reported to promote HCC progression (43). Similarly, RAB7A is upregulated in
HCC and overexpression of RAB7A promotes tumor proliferation and
metastatic potential (44).
Mechanistically, RAB7A regulates the activity of the AKT pathway
and the expression of cycle-associated proteins [cyclin dependent
kinase (CDK) 4, CDK6 and cyclin A2]. Consistently, the present GSEA
suggested that the difference in prognosis among patients with HCC
is attributed to the activity of AKT and cell cycle-associated
pathways. Furthermore, as FOXO3 activates the AKT pathway, the
results suggested RAB7A may be an important effector by which FOXO3
regulated the AKT pathway. TAF3 serves an important role in the
differentiation of embryonic stem cells and in finely balanced
transcription programs (45). To
date, the role and molecular mechanism of TAF3 in HCC have not been
reported. RAB10 and RAB7A have been demonstrated to serve
pro-cancerous roles in HCC, and the present results classified
RAB10, RAB7A and TAF3 as FoxO3-related genes. Thus, we speculate
that TAF3 may also have a similar functional role and be involved
in HCC progression. In addition, DDX55 promotes HCC proliferation
and metastasis by interacting with bromodomain-containing protein 4
and TAF1B depletion induces HCC cell apoptosis via nucleolar stress
and activation of the p53/miR-101 circuit (46,47).
The present study revealed a correlation between FOXO3 and the 5
signature genes (DDX55, RAB10, RAB7A, TAF1B and TAF3), which set
the direction for subsequent FOXO3 target exploration. However, our
results only indicate that FOXO3 is associated with these genes and
interferes with their expression. Whether this regulatory
association of FOXO3 is direct or indirect remains to be verified
by further experiments.
Although the present study deepened the
understanding of FOXO3 in HCC, exploring novel potential related
molecules and a novel prognostic model, there remain limitations.
First, the present study lacked more clinical samples for
multi-omics, FOXO3 expression verification and prognosis assessment
in patients with HCC. The differences in RS, TNM stage, age, sex
and vascular invasion in the TCGA and ICGC Cox analyses might be
caused by the HCC heterogeneity and ethnicity. Second, the present
study still needs more direct and clinical evidence to validate the
model and the intermolecular links. Nevertheless, it provided
guidance for follow-up research, including relevant clinical work
and basic experiments, which are the focus of our future work.
For the first time, to the best of the authors’
knowledge, the present study constructed a novel prognostic model
based on FOXO3 and identified a novel 5-gene signature. The
potential of three genes as biomarkers in HCC was confirmed,
including the novel TAF3 biomarker. Future research will
investigate the roles and underlying molecular mechanisms of TAF3
in HCC. In future clinical practice, pathological and molecular
detection methods can be used to assess the expression of relevant
genes and score them into the model to evaluate the prognosis of
the patient. We hypothesize that this is the most important and
widespread use of prognostic models. In summary, the present study
constructed a novel FOXO3-associated prognostic model and validated
three major genes through biochemical experimental studies. The
present results complement the bioinformatics findings for the
molecular typing and prognosis of HCC, further improving the
understanding of the roles of FOXO3, RAB10, RAB7A and TAF3 in
HCC.
Supplementary Material
Supporting Data
Supporting Data
Acknowledgements
Not applicable.
Funding
The present study was supported by the Zhanjiang Science and
Technology Development Special Projects (grant nos. 2021A05101 and
2022A01147), the Second Affiliated Hospital of Guangdong Medical
University (grant no. 21H03) in 2021 and the Research Project of
Guangdong Traditional Chinese Medicine Bureau (grant no. 20221439)
in 2022.
Availability of data and materials
The data generated in the present study may be
requested from the corresponding author.
Authors' contributions
The present study was conceived and designed by SG,
QL and SD. Data collection and bioinformatics analysis were
performed by SG, QL and PH. SG, QL, PH and KL analyzed and
interpreted data. The manuscript was written and revised by SG and
SD. SD was responsible for supervision of the whole project. SG and
SD confirm the authenticity of all the raw dada. All authors read
and approved the final version of the manuscript.
Ethics approval and consent to
participate
In the present study, the confidentiality of patient
information was guaranteed using a de-identified and anonymous
method. Moreover, the utilization of public databases involving
human data was reviewed and approved by the Ethics Committee of The
Second Affiliated Hospital of Guangdong Medical University
(PJKT-2024-042). Written informed consent was obtained from all
participants.
Patient consent for publication
Not applicable.
Competing interests
The authors declare that they have no competing
interests.
Glossary
Abbreviations
Abbreviations:
|
HCC
|
hepatocellular carcinoma
|
|
FOXO3
|
Forkhead box O3
|
|
TCGA
|
The Cancer Genome Atlas
|
|
ICGC
|
International Cancer Genome
Consortium
|
|
DBD
|
DNA-binding domain
|
|
WGCNA
|
weighted correlation network
analysis
|
|
LASSO
|
least absolute shrinkage and selection
operator
|
|
MM
|
module membership
|
|
GS
|
gene significance
|
|
PPI
|
protein-protein interaction
|
|
RS
|
risk score
|
|
ROC
|
receiver operating characteristic
|
|
GSEA
|
gene set enrichment analysis
|
References
|
1
|
Sung H, Ferlay J, Siegel RL, Laversanne M,
Soerjomataram I, Jemal A and Bray F: Global cancer statistics 2020:
GLOBOCAN estimates of incidence and mortality worldwide for 36
cancers in 185 countries. CA Cancer J Clin. 71:209–249. 2021.
View Article : Google Scholar : PubMed/NCBI
|
|
2
|
Yang JD, Hainaut P, Gores GJ, Amadou A,
Plymoth A and Roberts LR: A global view of hepatocellular
carcinoma: Trends, risk, prevention and management. Nat Rev
Gastroenterol Hepatol. 16:589–604. 2019. View Article : Google Scholar : PubMed/NCBI
|
|
3
|
Llovet JM, Pinyol R, Kelley RK,
El-Khoueiry A, Reeves HL, Wang XW, Gores GJ and Villanueva A:
Molecular pathogenesis and systemic therapies for hepatocellular
carcinoma. Nat Cancer. 3:386–401. 2022. View Article : Google Scholar : PubMed/NCBI
|
|
4
|
Wang T, Dang N, Tang G, Li Z, Li X, Shi B,
Xu Z, Li L, Yang X, Xu C and Ye K: Integrating bulk and single-cell
RNA sequencing reveals cellular heterogeneity and immune
infiltration in hepatocellular carcinoma. Mol Oncol. 16:2195–2213.
2022. View Article : Google Scholar : PubMed/NCBI
|
|
5
|
Zhang Q, Lou Y, Yang J, Wang J, Feng J,
Zhao Y, Wang L, Huang X, Fu Q, Ye M, et al: Integrated multiomic
analysis reveals comprehensive tumour heterogeneity and novel
immunophenotypic classification in hepatocellular carcinomas. Gut.
68:2019–2031. 2019. View Article : Google Scholar : PubMed/NCBI
|
|
6
|
Ho DW, Tsui YM, Chan LK, Sze KM, Zhang X,
Cheu JW, Chiu YT, Lee JM, Chan AC, Cheung ET, et al: Single-cell
RNA sequencing shows the immunosuppressive landscape and tumor
heterogeneity of HBV-associated hepatocellular carcinoma. Nat
Commun. 12:36842021. View Article : Google Scholar : PubMed/NCBI
|
|
7
|
Kim E and Viatour P: Hepatocellular
carcinoma: Old friends and new tricks. Exp Mol Med. 52:1898–1907.
2020. View Article : Google Scholar : PubMed/NCBI
|
|
8
|
Orea-Soufi A, Paik J, Bragança J, Donlon
TA, Willcox BJ and Link W: FOXO transcription factors as
therapeutic targets in human diseases. Trends Pharmacol Sci.
43:1070–1084. 2022. View Article : Google Scholar : PubMed/NCBI
|
|
9
|
Calissi G, Lam EWF and Link W: Therapeutic
strategies targeting FOXO transcription factors. Nat Rev Drug
Discov. 20:21–38. 2021. View Article : Google Scholar : PubMed/NCBI
|
|
10
|
Galili N, Davis RJ, Fredericks WJ,
Mukhopadhyay S, Rauscher FJ, Emanuel BS, Rovera G and Barr FG:
Fusion of a fork head domain gene to PAX3 in the solid tumour
alveolar rhabdomyosarcoma. Nat Genet. 5:230–235. 1993. View Article : Google Scholar : PubMed/NCBI
|
|
11
|
Davis RJ, D'Cruz CM, Lovell MA, Biegel JA
and Barr FG: Fusion of PAX7 to FKHR by the variant t(1;13)(p36;q14)
translocation in alveolar rhabdomyosarcoma. Cancer Res.
54:2869–2872. 1994.PubMed/NCBI
|
|
12
|
Dansen TB and Burgering BMT: Unravelling
the tumor-suppressive functions of FOXO proteins. Trends Cell Biol.
18:421–429. 2008. View Article : Google Scholar : PubMed/NCBI
|
|
13
|
Link W and Fernandez-Marcos PJ: FOXO
transcription factors at the interface of metabolism and cancer.
Int J Cancer. 141:2379–2391. 2017. View Article : Google Scholar : PubMed/NCBI
|
|
14
|
Paik JH, Kollipara R, Chu G, Ji H, Xiao Y,
Ding Z, Miao L, Tothova Z, Horner JW, Carrasco DR, et al: FoxOs are
lineage-restricted redundant tumor suppressors and regulate
endothelial cell homeostasis. Cell. 128:309–323. 2007. View Article : Google Scholar : PubMed/NCBI
|
|
15
|
Hu T, Chung YM, Guan M, Ma M, Ma J, Berek
JS and Hu MCT: Reprogramming ovarian and breast cancer cells into
non-cancerous cells by low-dose metformin or SN-38 through FOXO3
activation. Sci Rep. 4:58102014. View Article : Google Scholar : PubMed/NCBI
|
|
16
|
Liang C, Chen W, Zhi X, Ma T, Xia X, Liu
H, Zhang Q, Hu Q, Zhang Y, Bai X and Liang T: Serotonin promotes
the proliferation of serum-deprived hepatocellular carcinoma cells
via upregulation of FOXO3a. Mol Cancer. 12:142013. View Article : Google Scholar : PubMed/NCBI
|
|
17
|
Yao J, Wang J, Xu Y, Guo Q, Sun Y, Liu J,
Li S, Guo Y and Wei L: CDK9 inhibition blocks the initiation of
PINK1-PRKN-mediated mitophagy by regulating the SIRT1-FOXO3-BNIP3
axis and enhances the therapeutic effects involving mitochondrial
dysfunction in hepatocellular carcinoma. Autophagy. 18:1879–1897.
2022. View Article : Google Scholar : PubMed/NCBI
|
|
18
|
Yang LJ, Tang Q, Wu J, Chen Y, Zheng F,
Dai Z and Hann SS: Inter-regulation of IGFBP1 and FOXO3a unveils
novel mechanism in ursolic acid-inhibited growth of hepatocellular
carcinoma cells. J Exp Clin Cancer Res. 35:592016. View Article : Google Scholar : PubMed/NCBI
|
|
19
|
Lin Z, Niu Y, Wan A, Chen D, Liang H, Chen
X, Sun L, Zhan S, Chen L, Cheng C, et al: RNA m6A methylation
regulates sorafenib resistance in liver cancer through
FOXO3-mediated autophagy. EMBO J. 39:e1031812020. View Article : Google Scholar : PubMed/NCBI
|
|
20
|
Colaprico A, Silva TC, Olsen C, Garofano
L, Cava C, Garolini D, Sabedot TS, Malta TM, Pagnotta SM,
Castiglioni I, et al: TCGAbiolinks: An R/bioconductor package for
integrative analysis of TCGA data. Nucleic Acids Res. 44:e712016.
View Article : Google Scholar : PubMed/NCBI
|
|
21
|
Langfelder P and Horvath S: WGCNA: An R
package for weighted correlation network analysis. BMC
Bioinformatics. 9:5592008. View Article : Google Scholar : PubMed/NCBI
|
|
22
|
Friedman J, Hastie T and Tibshirani R:
Regularization paths for generalized linear models via coordinate
descent. J Stat Softw. 33:1–22. 2010. View Article : Google Scholar : PubMed/NCBI
|
|
23
|
Shi Y, Wang Y, Dong H, Niu K, Zhang W,
Feng K, Yang R and Zhang Y: Crosstalk of ferroptosis regulators and
tumor immunity in pancreatic adenocarcinoma: Novel perspective to
mRNA vaccines and personalized immunotherapy. Apoptosis.
28:1423–1435. 2023. View Article : Google Scholar : PubMed/NCBI
|
|
24
|
Zhang G, Su L, Lv X and Yang Q: A novel
tumor doubling time-related immune gene signature for prognosis
prediction in hepatocellular carcinoma. Cancer Cell Int.
21:5222021. View Article : Google Scholar : PubMed/NCBI
|
|
25
|
Robin X, Turck N, Hainard A, Tiberti N,
Lisacek F, Sanchez JC and Muller M: pROC: An open-source package
for R and S+ to analyze and compare ROC curves. BMC Bioinformatics.
12:772011. View Article : Google Scholar : PubMed/NCBI
|
|
26
|
Ito K and Murphy D: Application of ggplot2
to pharmacometric graphics. CPT Pharmacometrics Syst Pharmacol.
2:e792013. View Article : Google Scholar : PubMed/NCBI
|
|
27
|
Abe S, Kawa K, Nozawa H, Hata K, Kiyomatsu
T, Tanaka T, Nishikawa T, Otani K, Sasaki K, Kaneko M, et al: Use
of a nomogram to predict the closure rate of diverting ileostomy
after low anterior resection: A retrospective cohort study. Int J
Surg. 47:83–88. 2017. View Article : Google Scholar : PubMed/NCBI
|
|
28
|
Livak K and Schimittgen T: Analysis of
relative gene expression data using real-time quantitive PCR and
the 2 (-delata delta C(T)) method. Methods. 25:402–408. 2001.
View Article : Google Scholar : PubMed/NCBI
|
|
29
|
Zhang Z, Zeng X, Wu Y, Liu Y, Zhang X and
Song Z: Cuproptosis-related risk score predicts prognosis and
characterizes the tumor microenvironment in hepatocellular
carcinoma. Front Immunol. 13:9256182022. View Article : Google Scholar : PubMed/NCBI
|
|
30
|
Tang Y, Xu L, Ren Y, Li Y, Yuan F, Cao M,
Zhang Y, Deng M and Yao Z: Identification and validation of a
prognostic model based on three MVI-related genes in hepatocellular
carcinoma. Int J Biol Sci. 18:261–275. 2022. View Article : Google Scholar : PubMed/NCBI
|
|
31
|
Tian Z, Song J, She J, He W, Guo S and
Dong B: Constructing a disulfidptosis-related prognostic signature
of hepatocellular carcinoma based on single-cell sequencing and
weighted co-expression network analysis. Apoptosis. 29:1632–1647.
2024. View Article : Google Scholar : PubMed/NCBI
|
|
32
|
Pu Q, Yu L, Liu X, Yan H, Xie Y, Cai X, Wu
Y, Du J and Yang Z: Prognostic value of CD8+T cells related genes
and exhaustion regulation of Notch signaling pathway in
hepatocellular carcinoma. Front Immunol. 15:13758642024. View Article : Google Scholar : PubMed/NCBI
|
|
33
|
Peng L, Xu S and Xu JL: Integration of
single-cell RNA sequencing and bulk RNA sequencing to identify an
immunogenic cell death-related 5-gene prognostic signature in
hepatocellular carcinoma. J hepatocell Carcinoma. 11:879–900. 2024.
View Article : Google Scholar : PubMed/NCBI
|
|
34
|
Moeini A, Cornellà H and Villanueva A:
Emerging signaling pathways in hepatocellular carcinoma. Liver
Cancer. 1:83–93. 2012. View Article : Google Scholar : PubMed/NCBI
|
|
35
|
Wang G, Wang Q, Liang N, Xue H, Yang T,
Chen X, Qiu Z, Zeng C, Sun T, Yuan W, et al: Oncogenic driver genes
and tumor microenvironment determine the type of liver cancer. Cell
Death Dis. 11:3132020. View Article : Google Scholar : PubMed/NCBI
|
|
36
|
Uhlen M, Fagerberg L, Hallstrom B,
Lindskog C, Oksvold P, Mardinoglu A, Sivertsson A, Kampf C,
Sjostedt E, Asplund A, et al: Proteomics. Tissue-based map of the
human proteome. Science. 23:3472015.
|
|
37
|
Cheng K, Cai N, Zhu J, Yang X, Liang H and
Zhang W: Tumor-associated macrophages in liver cancer: From
mechanisms to therapy. Cancer Commun (Lond). 42:1112–1140. 2022.
View Article : Google Scholar : PubMed/NCBI
|
|
38
|
Di Z, Zhou S, Xu G, Ren L, Li C, Ding Z,
Huang K, Liang L and Yuan Y: Single-cell and WGCNA uncover a
prognostic model and potential oncogenes in colorectal cancer. Biol
Proced Online. 24:132022. View Article : Google Scholar : PubMed/NCBI
|
|
39
|
Lu J, Chen Y, Zhang X, Guo J, Xu K and Li
L: A novel prognostic model based on single-cell RNA sequencing
data for hepatocellular carcinoma. Cancer Cell Int. 22:382022.
View Article : Google Scholar : PubMed/NCBI
|
|
40
|
Zhao Z, He S, Yu X, Lai X, Tang S, Mariya
MEA, Wang M, Yan H, Huang X, Zeng S and Zha D: Analysis and
experimental validation of rheumatoid arthritis innate immunity
gene CYFIP2 and pan-cancer. Front Immunol. 13:9548482022.
View Article : Google Scholar : PubMed/NCBI
|
|
41
|
Tang B, Zhu J, Zhao Z, Lu C, Liu S, Fang
S, Zheng L, Zhang N, Chen M, Xu M, et al: Diagnosis and prognosis
models for hepatocellular carcinoma patient's management based on
tumor mutation burden. J Adv Res. 33:153–165. 2021. View Article : Google Scholar : PubMed/NCBI
|
|
42
|
Wang W, Jia WD, Hu B and Pan YY: RAB10
overexpression promotes tumor growth and indicates poor prognosis
of hepatocellular carcinoma. Oncotarget. 8:26434–26447. 2017.
View Article : Google Scholar : PubMed/NCBI
|
|
43
|
Lv Z, Ma G, Zhong Z, Xie X, Li B and Long
D: O-GlcNAcylation of RAB10 promotes hepatocellular carcinoma
progression. Carcinogenesis. 44:785–794. 2023. View Article : Google Scholar : PubMed/NCBI
|
|
44
|
Liu Y, Ma J, Wang X, Liu P, Cai C, Han Y,
Zeng S, Feng Z and Shen H: Lipophagy-related gene RAB7A is involved
in immune regulation and malignant progression in hepatocellular
carcinoma. Comput Biol Med. 158:1068622023. View Article : Google Scholar : PubMed/NCBI
|
|
45
|
Liu Z, Scannell DR, Eisen MB and Tjian R:
Control of embryonic stem cell lineage commitment by core promoter
factor, TAF3. Cell. 146:720–731. 2011. View Article : Google Scholar : PubMed/NCBI
|
|
46
|
Yu B, Zhou S, Long D, Ning Y, Yao H, Zhou
E and Wang Y: DDX55 promotes hepatocellular carcinoma progression
by interacting with BRD4 and participating in exosome-mediated
cell-cell communication. Cancer Sci. 113:3002–3017. 2022.
View Article : Google Scholar : PubMed/NCBI
|
|
47
|
Chen HF, Gao DD, Jiang XQ, Sheng H, Wu Q,
Zheng Q, Zhai QC, Yuan L, Liu M, Xu LF, et al: TAF1B depletion
leads to apoptotic cell death by inducing nucleolar stress and
activating p53-miR-101 circuit in hepatocellular carcinoma. Front
Oncol. 13:12037752023. View Article : Google Scholar : PubMed/NCBI
|