Introduction
Hepatic carcinoma represents a prevalent form of
cancer, with both its occurrence and fatality rates experiencing a
steady climb globally (1).
Projections indicate a 55.0% surge in the annual incidence of new
liver cancer cases from 2020 to 2040, with an anticipated 1.4
million diagnoses in 2040. Additionally, it is estimated that by
2040, 1.3 million individuals will succumb to liver cancer, marking
a 56.4% increase from the figures in 2020 (2). Among the various types of liver
cancer, hepatocellular carcinoma (HCC) dominates, comprising
roughly 90% of all liver cancer cases (3). The causes of HCC are complex,
including hepatitis virus infection, non-alcoholic steatohepatitis
and cirrhosis (4). HCC is often
asymptomatic in its early stages, which leaves numerous patients
undetected and untreated. Once symptoms appear, such as hepatic
pain, jaundice and ascites, HCC is often advanced, difficult to
treat, and has a poor prognosis (5). There is an urgent need to find new
targeted drugs to treat and prevent HCC.
Natural medicine is a treasure house to create
targeted medications with minimal toxicity and superior efficacy.
Forsythia suspensa extract, known as phillyrin (PHN), is
derived from the desiccated berries of the Forsythia plant,
belonging to the Oleaceae family (6). Over the past few years, there has been
substantial advancement in the investigation of its therapeutic
properties, including its anti-inflammatory and antioxidant
capabilities, and cardiovascular protection properties (7–9). PHN
can protect against alcoholic steatohepatitis injury and activate
the liver kinase B1/AMP-activated protein kinase (AMPK) signaling
pathway in HepG2 cells to reduce lipid accumulation induced by high
glucose in human hepatocytes (10,11).
In addition, PHN also has certain anticancer effects. PHN can
inhibit the ferritin heavy chain 1/solute carrier family 7 member
11 axis to sensitize lung cancer cells to ferroptosis (12), and PHN combined with autophagy
blockers can alleviate laryngeal squamous cell carcinoma through
AMPK/mTOR/p70S6K signal transduction (13). In general, PHN has shown some
potential in the treatment of liver diseases and has anticancer
activity, but the role of PHN in HCC remains unclear.
The research field of ferroptosis, a mode of cell
death dependent on iron ions, has grown exponentially in the past
few years, and its mechanisms mainly include iron-dependent
reactive oxygen species (ROS) production and iron-dependent protein
degradation (14). The occurrence
of ferroptosis in HCC may be related to factors such as iron
homeostasis imbalance, oxidative stress and elevated intracellular
iron ion concentration (15). In
addition, changes in some molecular targets, such as ferric
regulatory proteins and antioxidant enzymes, may also participate
in the occurrence of ferroptosis (16). It has been reported that PHN can
activate the sensitivity of lung cancer cells to ferroptosis and
inhibit cell proliferation (12),
but no studies have pointed out the regulatory relationship between
PHN and ferroptosis of liver cancer cells. Over the past few years,
an increasing body of research has highlighted the pivotal role of
the JAK2/STAT3 signaling cascade in the development of HCC
(17). Within hepatoma cells, the
stimulation of the JAK2/STAT3 signaling axis fosters cellular
multiplication and curbs programmed cell death, thereby
facilitating the growth of malignant tumors (18). The erratic activation of the
JAK2/STAT3 pathway within HCC represents a crucial hurdle in the
therapeutic management of this disease (19). Extensive investigations have
demonstrated that Forsythia suspensa extract possesses
therapeutic properties against diverse maladies through its
regulation of the JAK2/STAT3 pathway (20–22).
Consequently, the present investigation was centered on elucidating
the precise function of PHN in HCC, as well as exploring the
initial mechanisms behind the iron-induced apoptosis in hepatocytes
and its connection to the JAK2/STAT3 signaling pathway.
Materials and methods
GSE136247 data set differential gene
volcano map and heat map
The Gene Expression Omnibus database (https://www.ncbi.nlm.nih.gov/gds) was used to
download GSE136247 dataset (23),
using R package ‘FactoMineR (https://cran.r-project.org/web/packages/FactoMineR/index.html)’,
‘factoextra (https://cran.r-project.org/web/packages/factoextra/index.html)’.
An advanced multivariate statistical method, known as Principal
Component Analysis (PCA), was utilized to analyze the data
compilations derived from the two disparate groups of sample
cohorts. Subsequently, the ‘limma (https://www.bioconductor.org/packages/release/bioc/html/limma.html)’
package was utilized to delve into the disparities in gene
expression between these two cohorts. A total of 527 differentially
expressed genes were obtained according to P<0.05 and
|logFC|>1. A graphical representation of the gene volcano plot
was crafted utilizing the R library ‘ggplot2,’ whereas the
graphical depiction of the Top 20 differentially expressed genes
volcano plot was created with the assistance of the R package
‘pheatmap’.
Gene ontology (GO) and kyoto
encyclopedia of genes and genomes (KEGG) path enrichment analysis
of GSE136247 dataset
For 527 genes from the GSE136247 dataset, GO and
KEGG functional enrichment was performed using the R package
‘clusterProfiler (https://www.bioconductor.org/packages/release/bioc/html/clusterProfiler.html)’,
and the top-ranking results were displayed.
Protein-protein interaction networks
(PPI) network diagram of the GSE136247 dataset
The STRING repository (accessed at http://cn.string-db.org/) was employed to build a
network of protein interactions utilizing the aforementioned 527
overlapping genes.
Expression and prognosis of (DNA
topoisomerase II alpha) TOP2A in the cancer genome atlas (TCGA)
liver cancer cohort
The GEPIA2 (http://gepia2.cancer-pku.cn/#analysis) database was
accessed, which provides cancer gene expression data based on the
TCGA database. The name of the TOP2A gene was input and HCC
[TCGA-liver hepatocellular carcinoma (LIHC)] was selected as the
research object. In the expression analysis section, GEPIA2 was
used to draw the expression comparison chart of TOP2A in liver
cancer tissues and normal liver tissues, and box plots were used to
demonstrate the expression differences between different groups. In
order to assess the impact of TOP2A expression on the survival
outcomes of liver cancer sufferers, the GEPIA2 database survival
analysis feature was utilized. Patients with liver cancer were
categorized into two groups based on the level of TOP2A expression:
One with elevated expression and the other with reduced expression.
Through the online website Kaplan-Meier Plotter (https://kmplot.com/analysis/), ‘Liver cancer’ was
selected, the gene name ‘TOP2A’ was input, the follow-up time
endpoint was set to sixty months in ‘Follow up threshold’, and the
survival curve was drawn. The log-rank method was employed to
compare the survival discrepancies between these two subsets,
aiming to establish a link between TOP2A expression levels and the
patients' prognostic outlook.
PHN is docked with TOP2A
molecules
Initially, the three-dimensional structure of TOP2A
(with PDB identifier: 1ZXM) was sourced from the Protein Data Bank
(PDB; http://www.rcsb.org/). The PHN file in
SDF format was retrieved from the PubChem database (accessible at
http://pubchem.ncbi.nlm.nih.gov).
Subsequently, Open Babel (http://openbabel.org/index.html) was utilized to
transform this file into the PDB format. Following this, the
protein underwent dehydration and hydrogenation processes, after
which its charge was computed. Using Autodock tools version 1.5.7
(https://autodocksuite.scripps.edu/adt/), the protein
was then formatted into pdbqt.
The 3D structural data of TOP2A, identified by PDB
code 1ZXM, was acquired from the PDB repository. The Small Molecule
Data File (SDF) for PHN was fetched from the PubChem database, and
then converted into PDB format via Open Babel. The protein
structure was subsequently stripped of water molecules and
hydrogenated, with its electrical charge assessed. The conversion
to pdbqt format was facilitated by Autodock tools version 1.5.7.
Ligand processing involved hydrogenation and the calculation of
torsional energies, culminating in its transformation into pdbqt
format as well. The boundaries for the docking simulation were set,
and the molecular docking simulation was carried out using Autodock
vina. Visual inspection and three-dimensional analysis were
conducted with pymol 2.1.0 (Schrödinger Corporation), yielding a
comprehensive 3D graphical representation.
Cell culture
Human HCC cell lines JHH7, HEP3B217, SNU878, JHH2
and normal liver cell line THLE-2 were purchased from the Qingqi
(Shanghai) Biotechnology Development Co., Ltd. The frozen cells
were thawed after retrieval from liquid nitrogen storage and
revitalized. These cells were subsequently cultivated in a DMEM
solution (cat. no. 11995; Beijing Solarbio Science & Technology
Co., Ltd.), which consisted of a blend of 10% newborn calf serum
(cat. no. S9020; Beijing Solarbio Science & Technology Co.,
Ltd.) and 1% penicillin-streptomycin mixture. PHN (cat. no.
F798884) was purchased from Shanghai Maclin Biochemical Technology
Co., LTD.
Cellular transfection
The T25 cell culture vial was removed from the cell
incubator and the vial contained the exponential growth stage of
the liver cancer cell line. The old medium was discarded, 2 ml
sterile PBS was added, the T25 cell culture bottle was gently
shaken, the excess PBS was discarded, and then 1 ml trypsin
digestion solution (cat. no. T1300; Beijing Solarbio Science &
Technology Co., Ltd.) was added and incubated at 37°C for 2 min.
Digestion was terminated by adding 2 ml DMEM medium. The cells were
counted by Thermo Fisher Scientific, Inc. (Countess 3) and
inoculated into six wells with 1×10⁵ cells per well and
placed in a cell incubator at 37°C (Countess 3; Thermo Fisher
Scientific, Inc.) overnight. The old medium was discarded, add the
premixed solution of Lip2000 (cat. no. 11668030; Thermo Fisher
Scientific, Inc.) and SiTOP2A interference sequence (1,500 ng per
well) or overexpression plasmid (2,500 ng per well) were added and
cells were cultured in serum-deprived DMEM solution for a period of
5 h. Subsequently, fresh DMEM was introduced, and the culture was
maintained for an additional 48 h to proceed with the subsequent
investigation. The specific sequences for the small interfering RNA
(siRNA) and plasmid are presented in Table SI.
Group information for cell
experiments
siRNA was used to knockdown TOP2A (si-TOP2A), and
plasmids were used for overexpression of TOP2A (OE-TOP2A). In JHH7
cells, they were divided into three groups: Si-negative control
(NC), PHN + Si-NC, and PHN + si-TOP2A. In the PHN + si-TOP2A group,
JHH7 was transfected with siRNA and incubated for 48 h. The Si-NC
and PHN + Si-NC groups were transfected with the control sequence
and incubated for 48 h. After that, PHN was added to the PHN +
Si-NC and PHN + si-TOP2A groups and incubated for another 48 h.
Cells were extracted for subsequent experiments. In JHH2 cells,
they were divided into three groups: Vector, Vector + PHN, and
OE-TOP2A + PHN. In the Vector + PHN and OE-TOP2A + PHN groups, PHN
was added to JHH2 cells and incubated for 48 h. After that, the
OE-TOP2A + PHN group was transfected with the overexpression TOP2A
plasmid and continued to be incubated for 48 h. The Vector and
Vector + PHN groups were transfected with the control vector and
continued to be incubated for 48 h. Cells were extracted for
subsequent experiments.
Cell counting kit-8 (CCK-8) assay
Cell transfection is performed in the same way as
aforementioned. The successfully transfected cells were removed
from the incubator, cell digestion and centrifugation were
consistent with previous methods, and cell precipitation was
collected. The cultures were seeded into 96-microwell trays at a
seeding density of 3,000 cells per well and subsequently exposed to
varying dosages of PHN for periods of 0, 24, 48 and 72 h. Following
this treatment, 10 µl of the CCK-8 solution (cat. no. C0038;
Beyotime Institute of Biotechnology) was introduced into each
individual well, after which the incubation at 37°C was prolonged
for an additional 4 h. Finally, the 96-well plates were removed
from the cell incubator and placed on the SpectraMax Mini
multi-function enzyme label to detect OD (450 nm) value (Molecular
Devices, LLC). The subsequent data were statistically analyzed by
Graph Prism 9.5.0 software (Dotmatics).
EDU staining
Exponential growth cells were received, cell
digestion was carried out, add 1×10⁵ cells per well into
six-well plates and incubated overnight in a cell incubator.
Transfection EDU solution (10 µmol/l; cat. no. C0071S; Beyotime
Institute of Biotechnology) was added to the transfected cells and
incubated in a cell incubator for 2 h. The old medium was removed,
and 1 ml of cell fixing solution (cat. no. P0099; Beyotime
Institute of Biotechnology) was added to each well for incubation
at room temperature (20°C) for 30 min, and then 1 ml of 0.3% Triton
X-100 (cat. no. P0096; Beyotime Institute of Biotechnology) was
added to each well and incubated at room temperature (20°C) for 10
min. The permeable solution was removed and 1 ml Hoechst 33342
solution (cat. no. C1022; Beyotime Institute of Biotechnology) was
added to each well and incubated for 10 min at room temperature
(20°C) without light. The Hoechst 33342 solution was removed,
cleaned with PBS for 3 times, observed with inverted fluorescence
microscope (model AMF7000; Thermo Fisher Scientific, Inc.). Images
were captured, and then statistical analysis was performed using
Image J 1.52a (National Institutes of Health).
Reverse transcription-quantitative
(RT-qPCR) assay
Transfection of HCC was performed by adding a
suitable volume of TRIzol reagent (cat. no. 15596026; Beijing
Solarbio Science & Technology Co., Ltd.) was utilized for the
isolation of total RNA, adhering to the provided protocol.
Subsequently, the RNA concentration was assessed using the NanoDrop
One spectrophotometer. Following this, complementary DNA was
synthesized through reverse transcription, following the
manufacturer's protocol (cat. no. D7168M; Beyotime Institute of
Biotechnology). Thereafter, the BeyoFast™ SYBR Green
RT-qPCR Mix (cat. no. D7262; Beyotime Institute of Biotechnology)
was incorporated into the reaction mixture. The template DNA was
fully denatured by pre-heating at 95°C for 3 min on the PCR
apparatus, and then entered the amplification cycle. In each cycle,
the template was denatured by holding at 95°C for 30 sec, and then
the temperature was lowered to 60°C for 30 sec, so that the primer
and the template were fully annealed. The mixture was held at 72°C
for 1 min (primer extended on the template, DNA synthesized, a
cycle complete, then repeat 40 cycles) and finally set 4°C. The
7900HT fluorescence quantitative PCR instrument (cat. no. 4351405;
Thermo Fisher Scientific, Inc.) was set up according to the
instructions. Relative gene expression data were analyzed by
real-time quantitative PCR and the 2−ΔΔCq method
(24). The subsequent data were
statistically analyzed by Graph Prism 9.5.0 software. Details of
the primer sequences are described in Table SI.
Fe2+ content determination
and malondialdehyde (MDA) detection
HCC cell transfection was conducted as
aforementioned; cells in each group were expanded to
>2×10⁶ to extract cell precipitation for use. The HCC
cell specimens underwent processing in compliance with the iron
concentration testing kit (cat. no. MAK025; MilliporeSigma). The
intracellular Fe2+ concentration was assayed, and the
optical density (OD) at 593 nm was obtained using the SpectraMax
Mini multi-purpose enzyme analyzer. Additionally, the cells
affected by HCC were subjected to the MDA measurement protocol as
per the kit instructions (cat. no. S0131S; Beyotime Institute of
Biotechnology). The OD readings at 532 nm were recorded with the
aid of the SpectraMax Mini multifunctional enzyme analyzer. The
subsequent data were statistically analyzed by Graph Prism 9.5.0
software.
Transmission electron microscopy
(TEM)
After treating each group of cells by the
aforementioned method, the cells were fixed with 2.5%
glutaraldehyde and 1% osmium tetroxide for 2 h respectively at 4°C
in sequence, and then dehydrated in a series of acetone gradients.
Subsequently, the morphological changes of mitochondria in the
tissues were observed by transmission electron microscopy
(JEM-1400FLASH; JEOL, Ltd.), and the images were captured.
ROS staining
The successfully transfected JHH7 and JHH2 cells
were inoculated in six-well plates at 1×10⁵ cells/well,
and incubated overnight. Then, the culture medium was removed and
the cells were gently washed twice with PBS. Next, 2 ml of ROS
fluorescent working solution (cat. no. S0033M; Beyotime Institute
of Biotechnology) were added, and the mixture was incubated for 30
min away from light. After the incubation, the cells were washed
again with PBS to remove the ROS staining solution. Subsequently,
DAPI staining solution (1 µg/ml) was used to stain the cell nuclei,
and cells were incubated away from light for 5 min. After the
staining was completed, the cells were washed with PBS. Finally,
images were observed and captured under a fluorescence microscope,
and the relative expression level of intracellular ROS was analyzed
using ImageJ 1.5.2a software (National Institutes of Health).
Western blotting (WB)
The treated cells were selected, and these cell
samples were co-incubated with RIPA lysis buffer (cat. no. R0010;
Beijing Solarbio Science & Technology Co., Ltd.) at 4°C for 30
min. Subsequently, protein extracts were isolated from HCC cells.
The protein levels were quantified using a BCA assay kit. Based on
the protein concentration readings, the volume of the sample was
adjusted correspondingly. An equal volume of the protein (30 µg)
mixture was pipetted into the wells of the gel matrix (containing
30% acrylamide), and the electrical potential was fixed at 120
volts for the purpose of conducting gel electrophoresis. Following
a 75 min run, the gel was transferred onto a PVDF membrane, and the
electrical setting was then increased to 200 volts. After a 30 min
transfer, the PVDF membrane was immersed in a solution of 5%
non-fat milk powder and allowed to sit for a duration of 2 h at
25°C. TBST (containing 0.1% Tween 20) was cleaned three times after
incubation, TBST was cleaned three times after the primary antibody
was incubated overnight at 4°C, and chemiluminescent solution was
added for 10 sec after the secondary antibody was incubated for 2 h
at 25°C. Images were stored in the chemiluminescence apparatus
(SH-Cute523; Hangzhou Shenhua Technology Co., Ltd.) for subsequent
statistical analysis. WB antibody information is included in
Table SII. Densitometric analysis
was carried out using ImageJ 1.5.2a software (National Institutes
of Health).
Statistical analysis
All statistical evaluations were conducted with the
SPSS version 22.0 program (IBM Corp.). Quantitative results are
presented as the average value ± standard deviation. For
comparisons between the two distinct groups, an independent samples
t-test was applied. To assess variations among several groups, a
one-factor ANOVA followed by Tukey's multiple comparison test was
utilized. Comparisons across various time intervals were executed
with the Bonferroni correction for post hoc analysis. P<0.05 was
considered to indicate a statistically significant difference.
Results
GSE136247 differential expression
analysis
PCA was first performed on GSE136247 data to obtain
a total of 527 differentially expressed genes, of which 93 were
upregulated and 434 downregulated (Fig.
1A). Subsequently, differential genes were selected to draw
volcano maps (Fig. 1B) and cluster
heat maps (Fig. 1C). It was found
that compared with normal liver tissues, AFP, PEG10, SULT1C2, GPC3
and acyl-CoA synthetase family member 4 (ACSL4) were most
significantly upregulated in liver cancer tissues, while MT1G,
MT1G, C9, CYP2C8 and CTP1A2 were most significantly downregulated.
These significant differential genes can be used as potential
therapeutic targets for liver cancer. KEGG functional enrichment
analysis showed that differential genes were mainly enriched in
complement and coagulation cascades, drug metabolism and metabolism
of xenobiotics by cytochrome P450 (Fig.
1D and E). Subsequently, differential gene PPI network
interaction was conducted (Fig.
1F).
Screening of potential therapeutic
targets for PHN
The differential genes of liver cancer tissue and
normal liver tissue obtained as aforementioned were intersected
with PHN drug targets to draw Wayne's diagram. It was found that
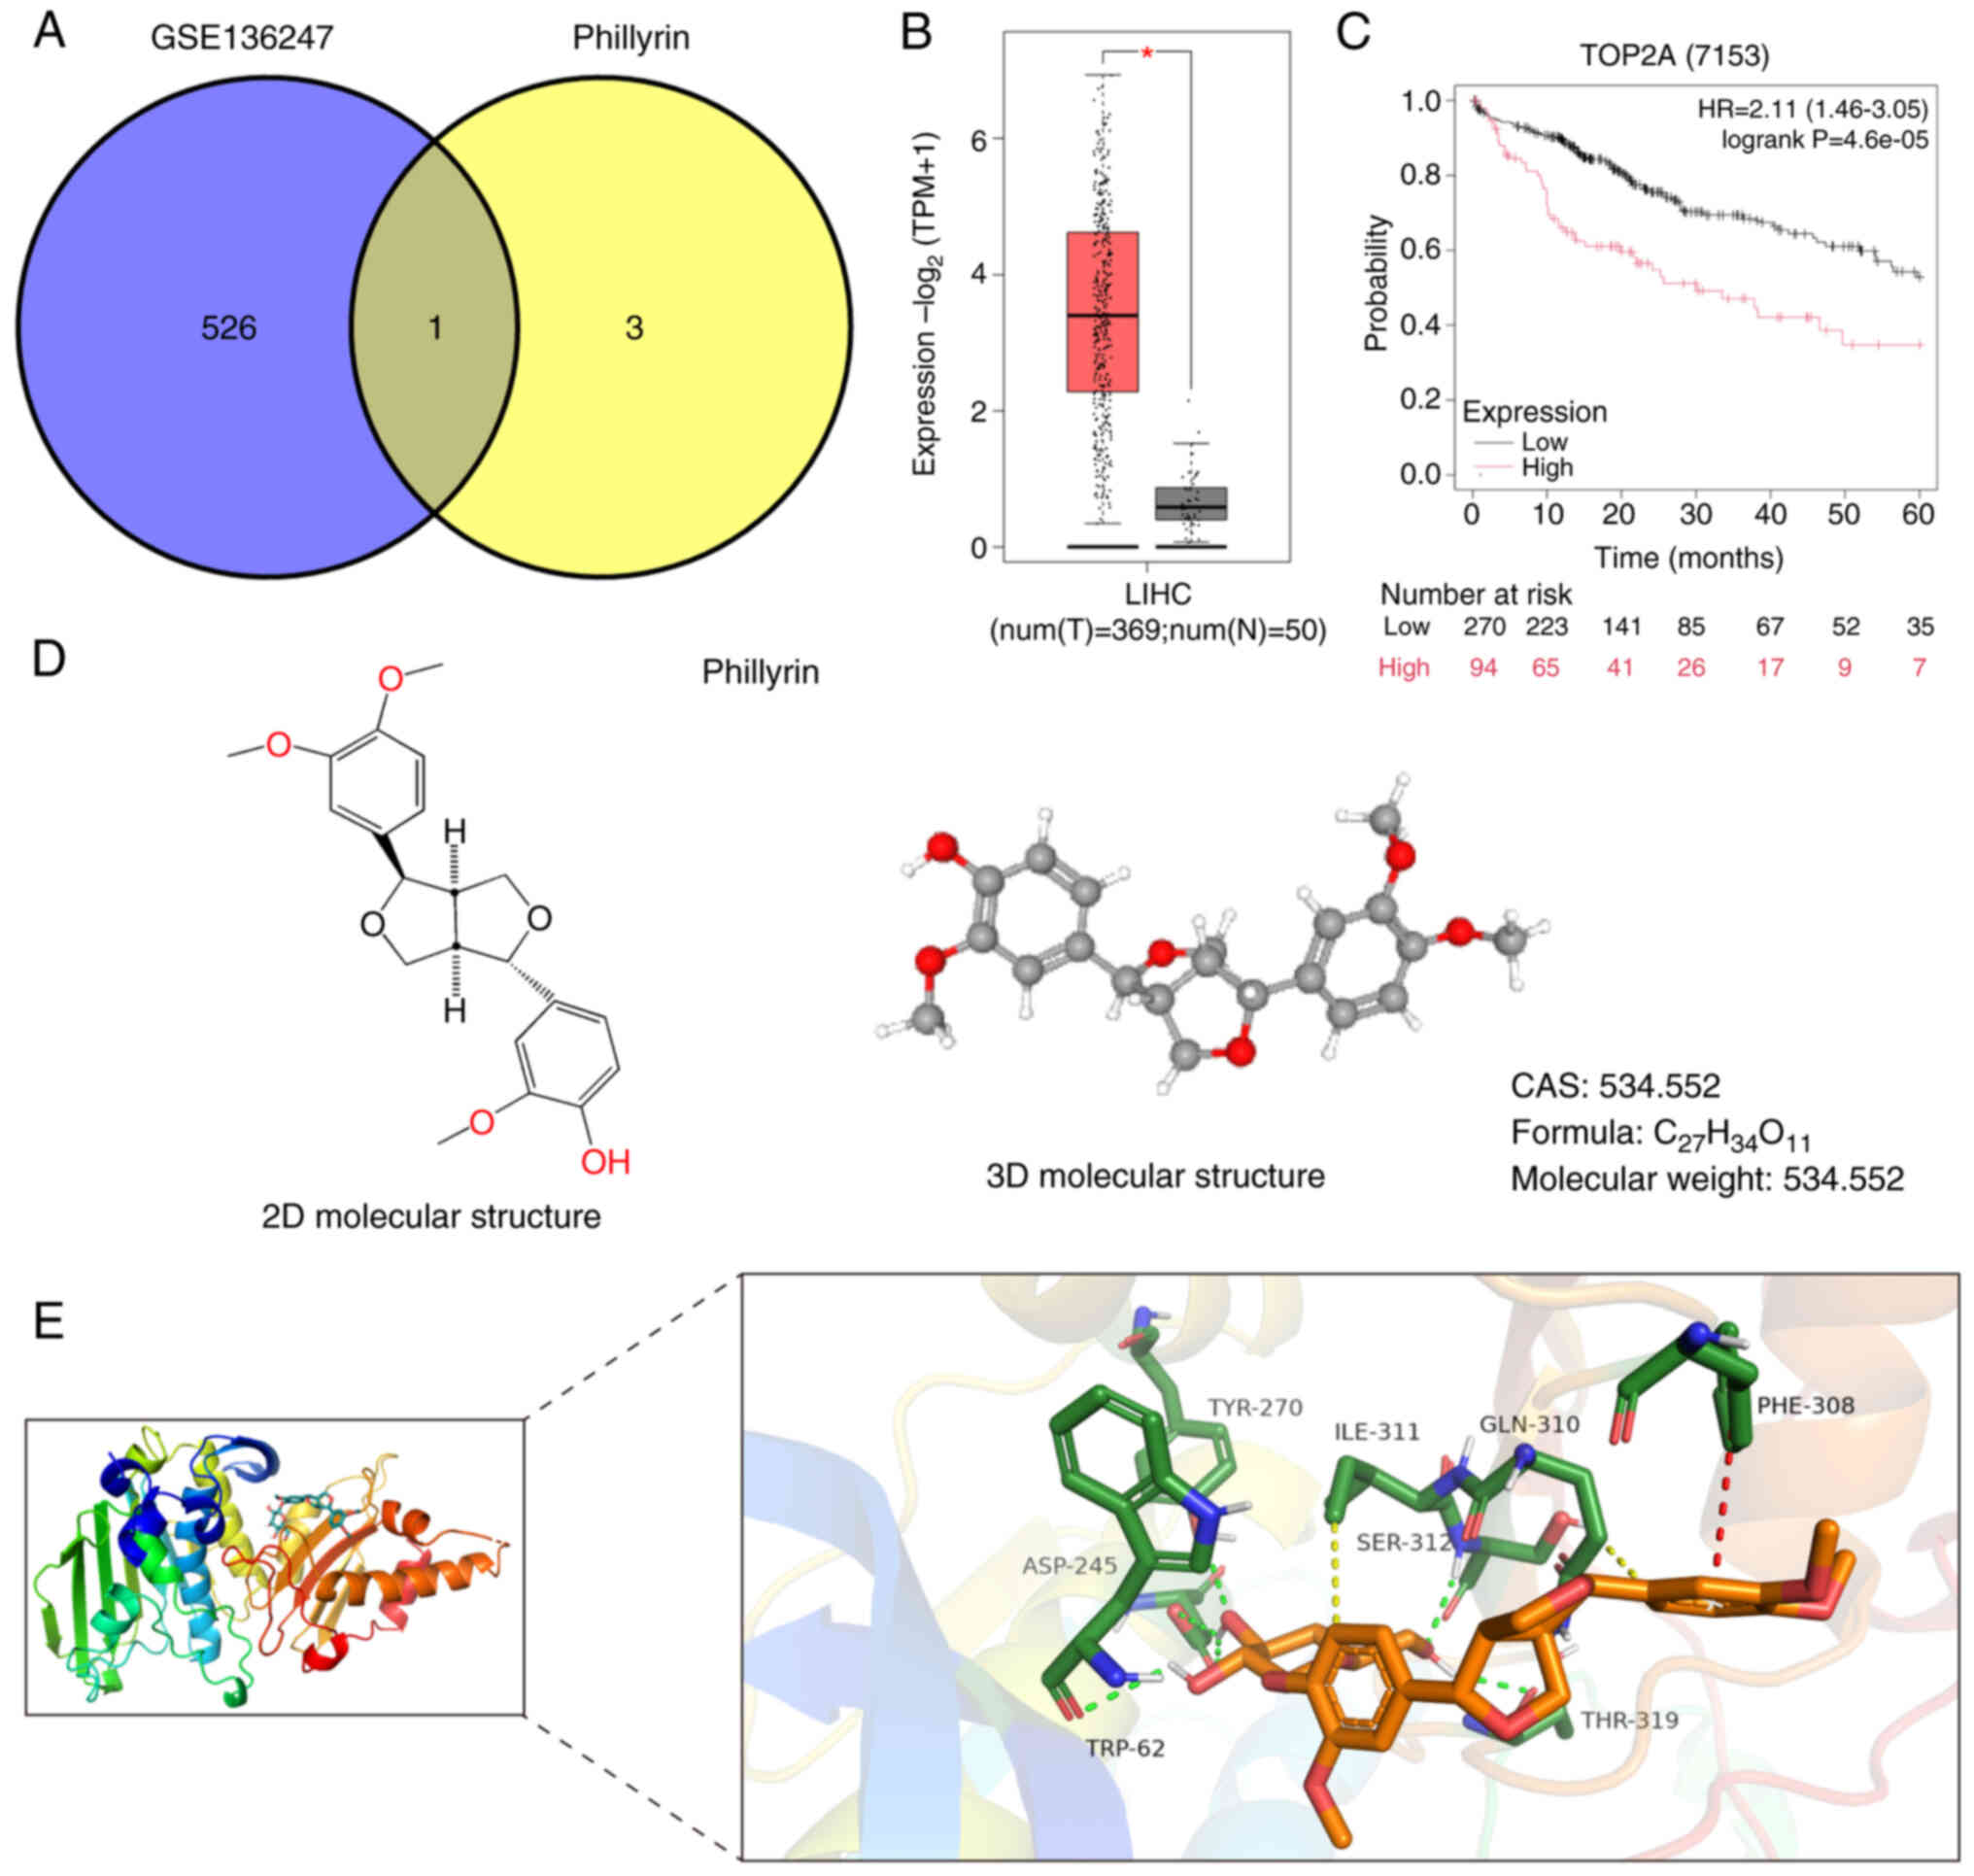
only one intersection gene was TOP2A (Fig. 2A). Later, the levels of TOP2A
expression in TCGA liver cancer dataset (TCGA-LIHC) were
investigated and a significant increase was observed in TOP2A
levels within liver cancer samples compared with the normal tissue
controls (Fig. 2B). This
observation aligns with the current analysis of TOP2A expression
patterns. Moreover, there was a significant association between
TOP2A expression and liver cancer outcomes, with patients
exhibiting high TOP2A expression demonstrating poorer prognostic
outcomes compared with those with low TOP2A expression levels
(Fig. 2C). The 2D and 3D molecular
structure formula of PHN is demonstrated in Fig. 2D. In order to further confirm the
existence of binding sites between PHN and TOP2A, molecular docking
was simulated in silico, and the docking results showed that
there were binding sites between PHN and TOP2A, along with a strong
binding effect (Fig. 2E).
Screening of liver cancer cell
lines
Through our online database (https://sites.broadinstitute.org/ccle/), the different
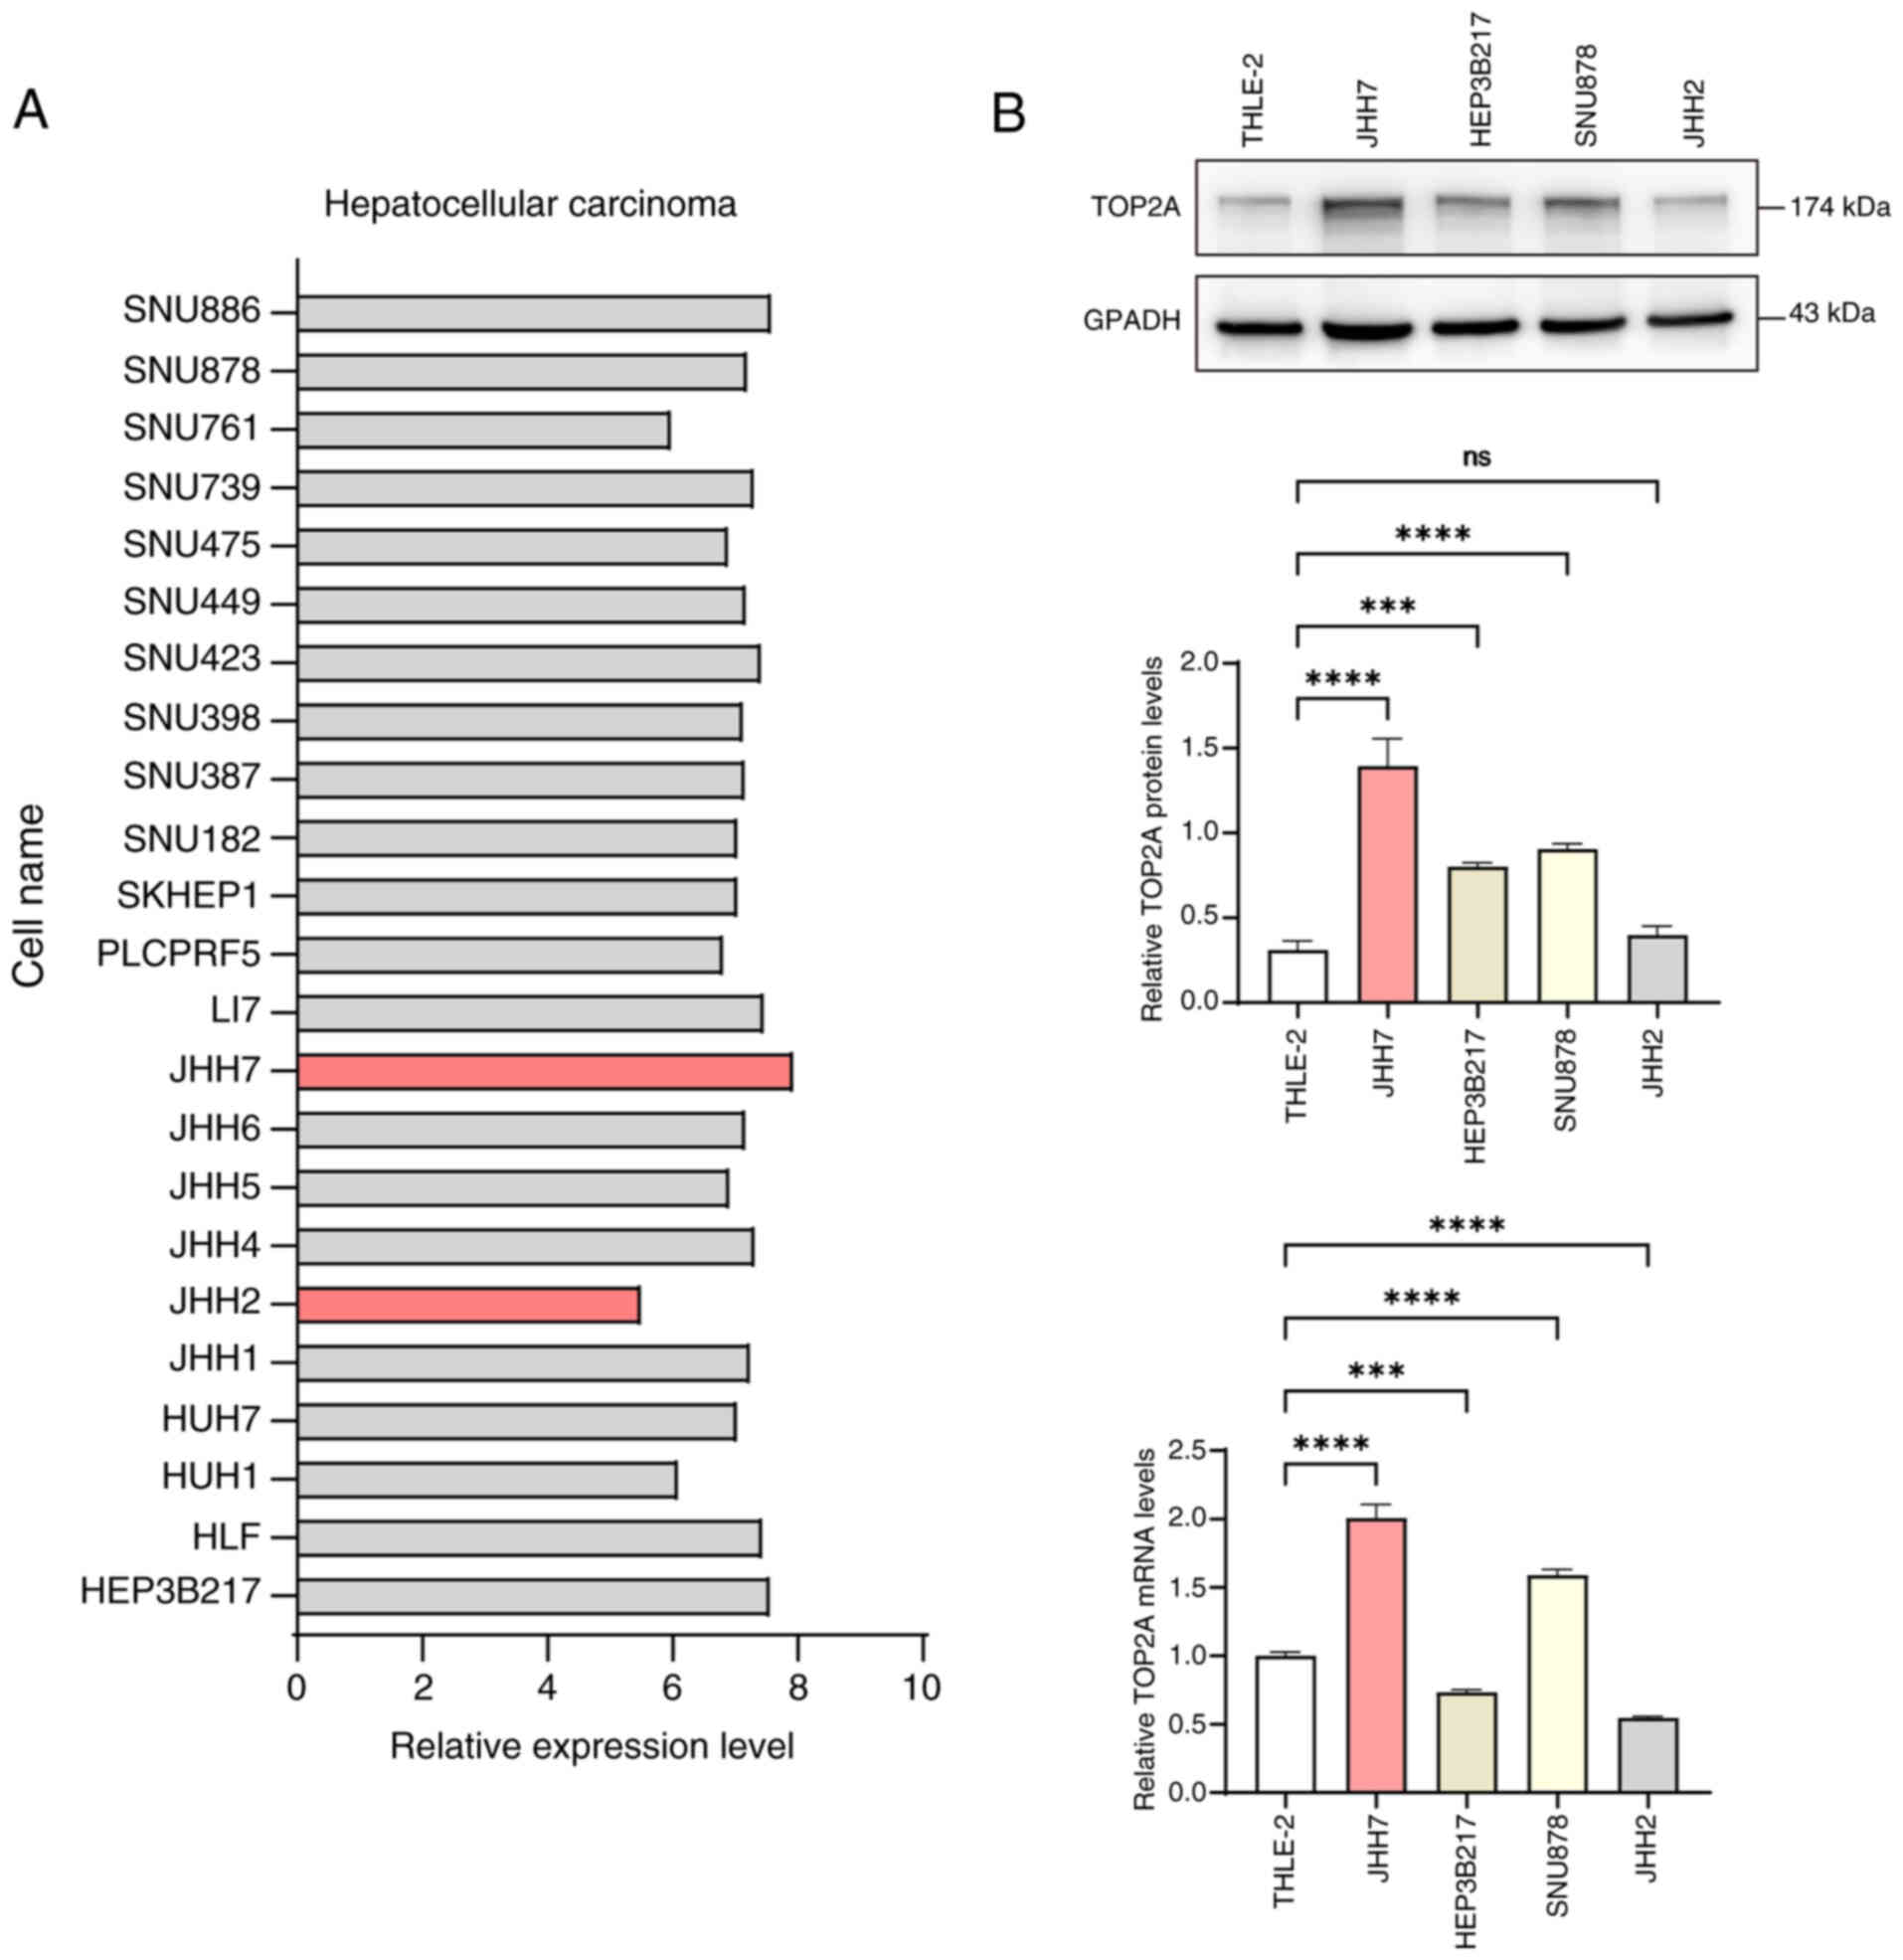
TOP2A expression was screened in HCC cell line (Fig. 3A). The pair of HCC cell lines
exhibiting the most prominent contrast in TOP2A expression levels
was chosen, along with healthy liver cells, to investigate TOP2A
expression via WB and RT-qPCR analysis. The findings indicated that
TOP2A was most prominently expressed in the JHH7 cellular line
while the expression was lowest in JHH2 cells (Fig. 3B). This further proves the accuracy
of the database prediction information. Therefore, JHH7 cells with
high TOP2A expression and JHH2 with low TOP2A expression were
selected for subsequent experiments.
PHN can inhibit the proliferation of
TOP2A and liver cancer cells
To verify the effects of PHN on the proliferation of
JHH7 and JHH2 HCC cells, the effects of different concentrations
(6.25, 12.5, 25, 50, 100 and 200 µmol/l) of PHN on HCC cell
proliferation were examined after 24 h of treatment by CCK-8 assay.
The results of CCK-8 revealed that PHN had no detailed inhibitory
effect on the viability of HCC at concentrations of 6.25 µmol and
12.5 µmol/l. PHN had a strong inhibitory effect on HCC from the
concentration interval of 25 to 200 µmol/l, accompanied by a
concentration dependence. The IC50 of PHN-treated JHH7
cells for 24 h was 106.3 µmol/l, and that of JHH2 cells was 123.4
µmol/l. A PHN concentration of 100 µmol/l (<IC50) was
selected for the subsequent experiment (Fig. 4A). To ascertain the impact of PHN on
the protein expression of TOP2A, the cell line JHH7 was chosen,
known for its high TOP2A expression, and it was subjected to
varying concentrations of PHN for a duration of 48 h. Subsequent
analysis revealed that the protein expression of TOP2A was
suppressed by PHN in a manner directly proportional to the
concentration administered (Fig.
4B).
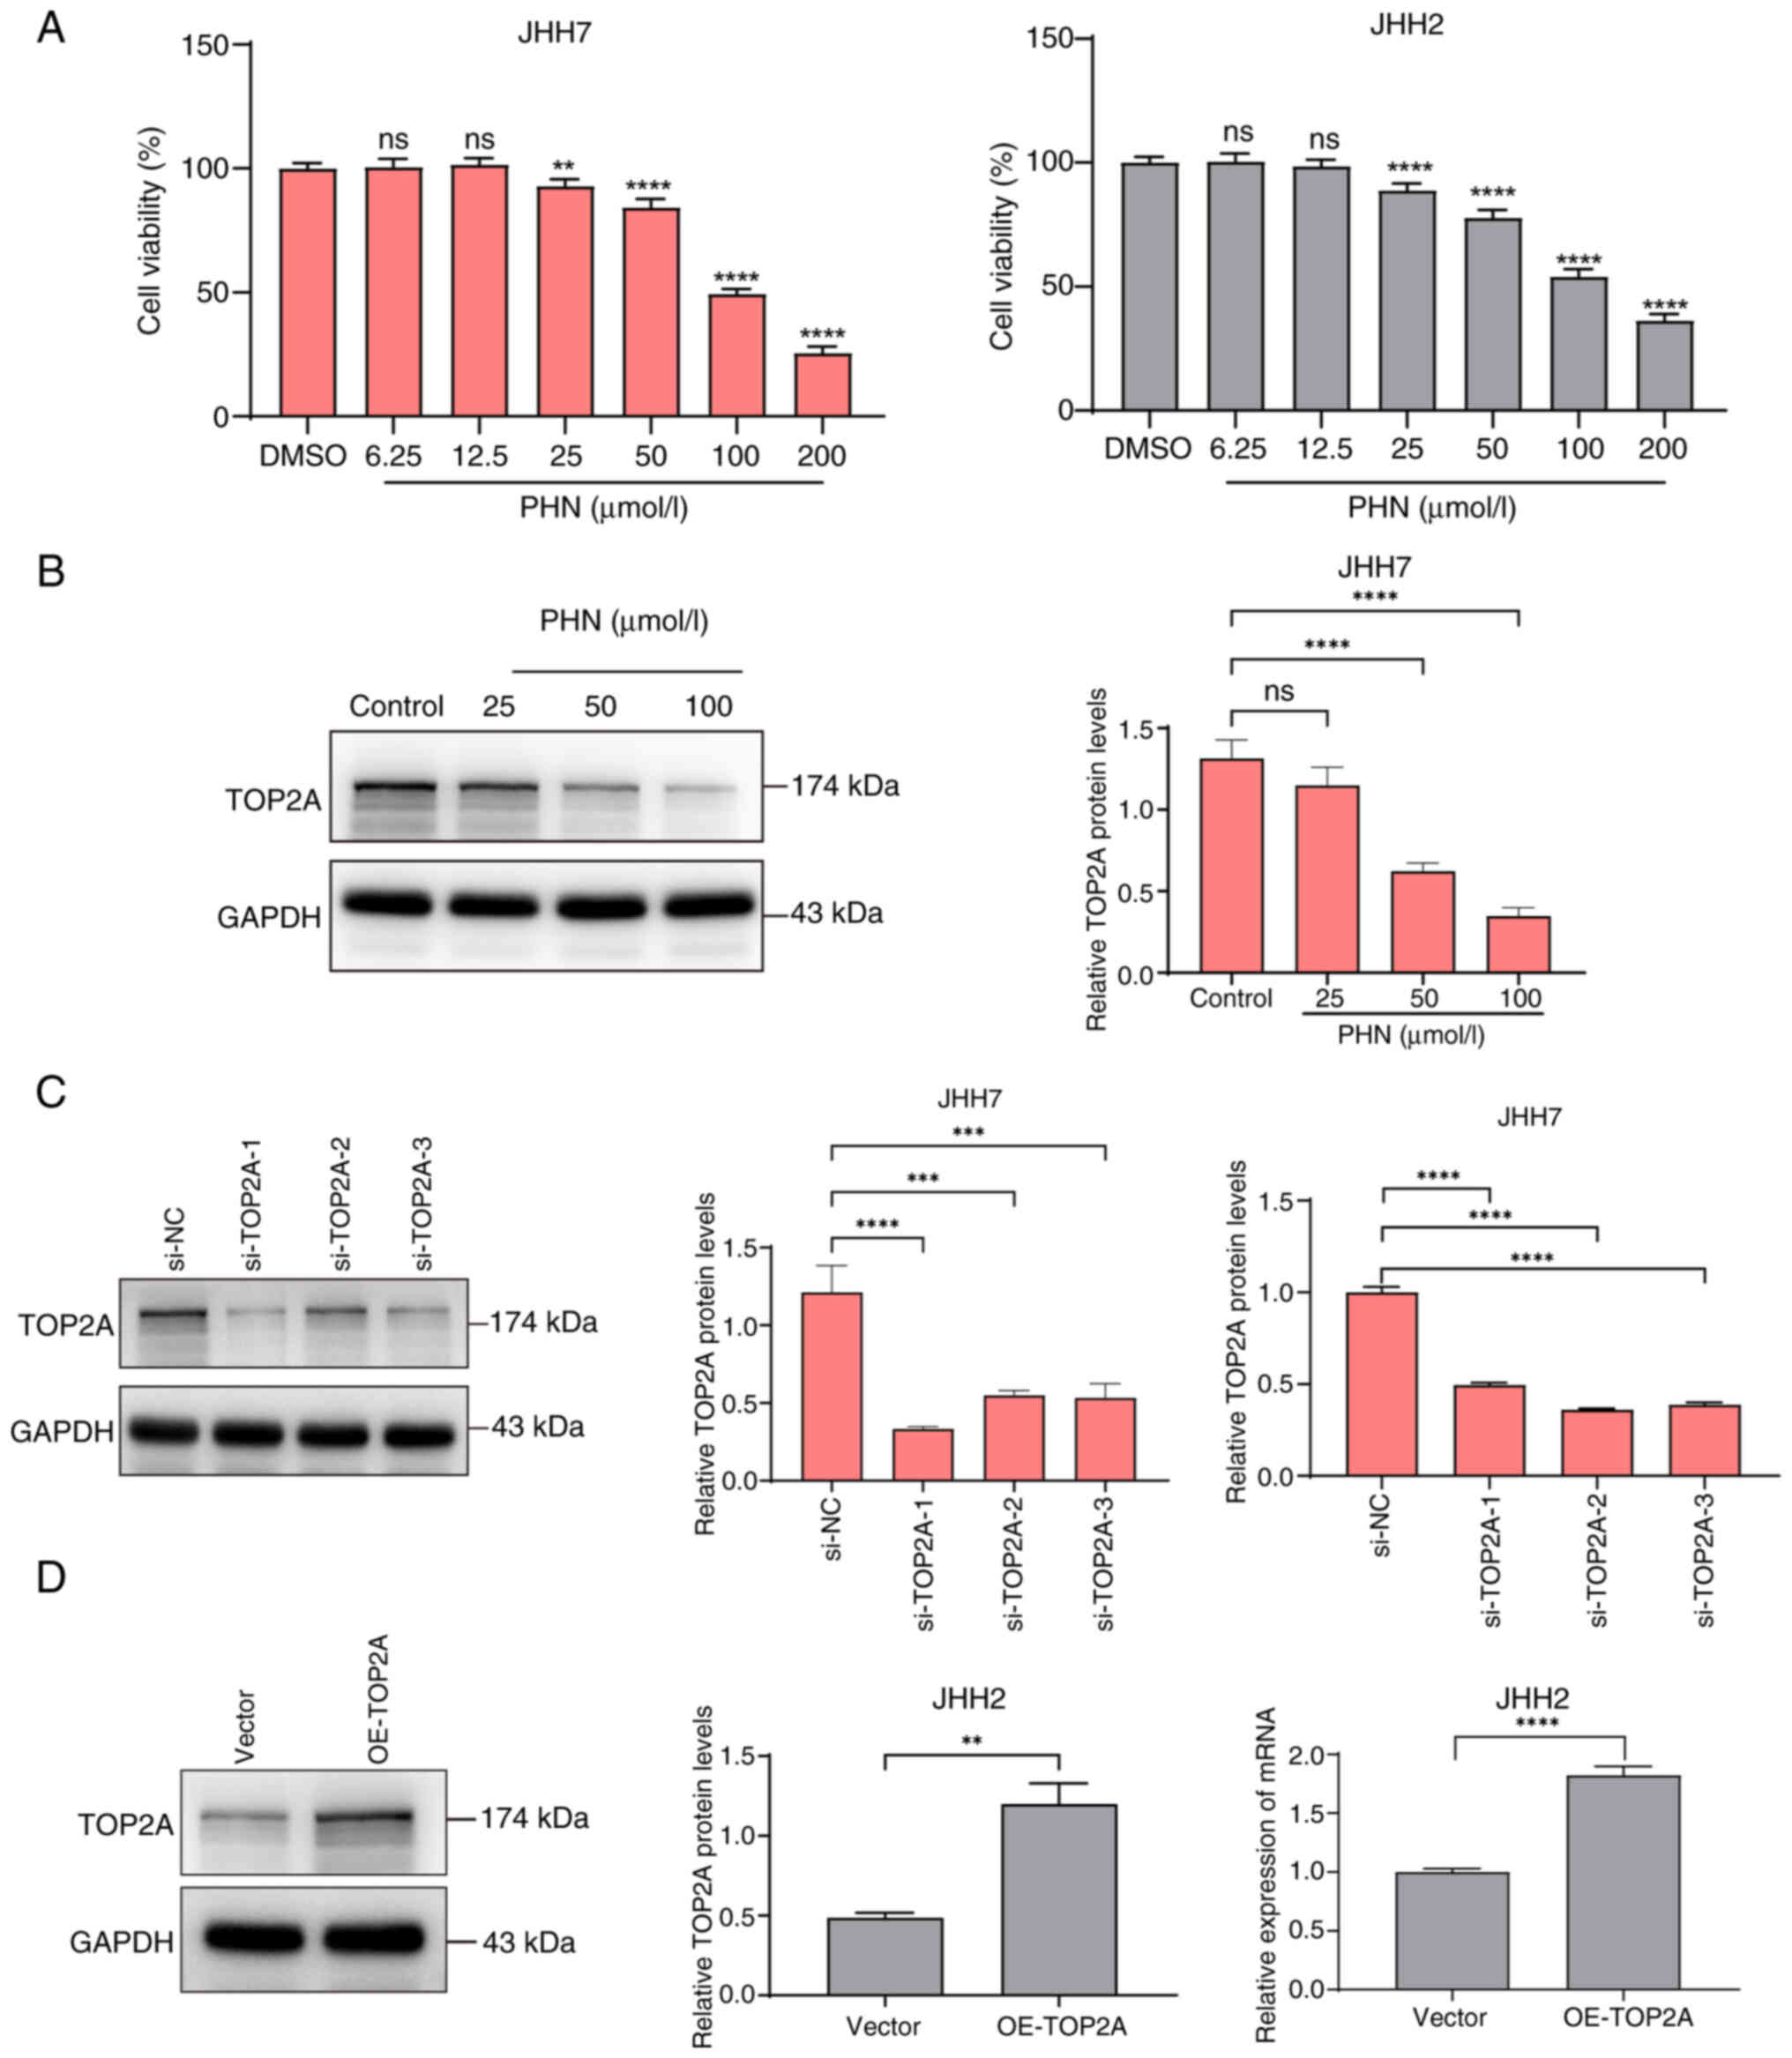 | Figure 4.PHN inhibition of hepatocellular
carcinoma cell activity and construct a cell model for upregulation
and downregulation of TOP2A. (A) The JHH7 and JHH2 cell lines
underwent exposure to varying dosages of PHN over a 24-h period,
utilizing the Cell Counting Kit-8 method to assess variations in
cellular survival rates. (B) Alterations in the TOP2A protein
levels within JHH7 cells that had been subjected to diverse PHN
concentrations for a duration of 48 h were monitored using WB. (C)
Following the introduction of siRNA sequences designed to interfere
into JHH7 cells for a 48-h incubation, the protein and mRNA
expression levels of TOP2A were evaluated through WB and RT-qPCR,
respectively. (D) Post 48-h transfection of JHH2 cells with siRNA
and a TOP2A-OE construct, the expression levels of TOP2A protein
and mRNA were detected by WB and RT-qPCR. **P<0.01,
***P<0.001 and ****P<0.0001. PHN, phillyrin; TOP2A, DNA
topoisomerase II alpha; WB, western blotting; siRNA, small
interfering RNA; RT-qPCR, reverse transcription-quantitative PCR;
OE, overexpression; ns, not significant. |
To further verify the specific role of TOP2A in
hepatoma cell lines, TOP2A expression was either knocked down or
upregulated. Subsequently, enhanced expression was observed in the
JHH7 and JHH2 clones, respectively. Immunoblotting and RT-qPCR
analyses revealed that each of the three si-TOP2A constructs
significantly suppressed the mRNA and protein synthesis of TOP2A
(Fig. 2C). Notably, si-TOP2A1
exhibited the most profound suppression of both mRNA and protein
synthesis for TOP2A. Conversely, an upsurge in the mRNA and protein
indicators of TOP2A was evident within the OE-TOP2A experimental
cohort (Fig. 4D). The experimental
results demonstrated that TOP2A-downregulated cell models in JHH7
cells and TOP2A-upregulated cell models in JHH2 cells were
successfully constructed.
CCK-8 and EDU experiments confirmed that PHN group
could significantly inhibit the proliferation of JHH7 liver cancer
cells compared with the control group, and PHN + si-TOP2A group
could inhibit the proliferation of JHH7 liver cancer cells, but
there was no statistical significance compared with PHN group. PHN
also inhibited the proliferation of JHH2 HCC cells. After PHN
treatment, the overexpression of TOP2A plasmid could partially
restore the vitality of JHH2 cells. The aforementioned results
confirmed that PHN inhibited the proliferation of JHH7 and JHH2 HCC
cells by targeting TOP2A (Fig. 5A and
B).
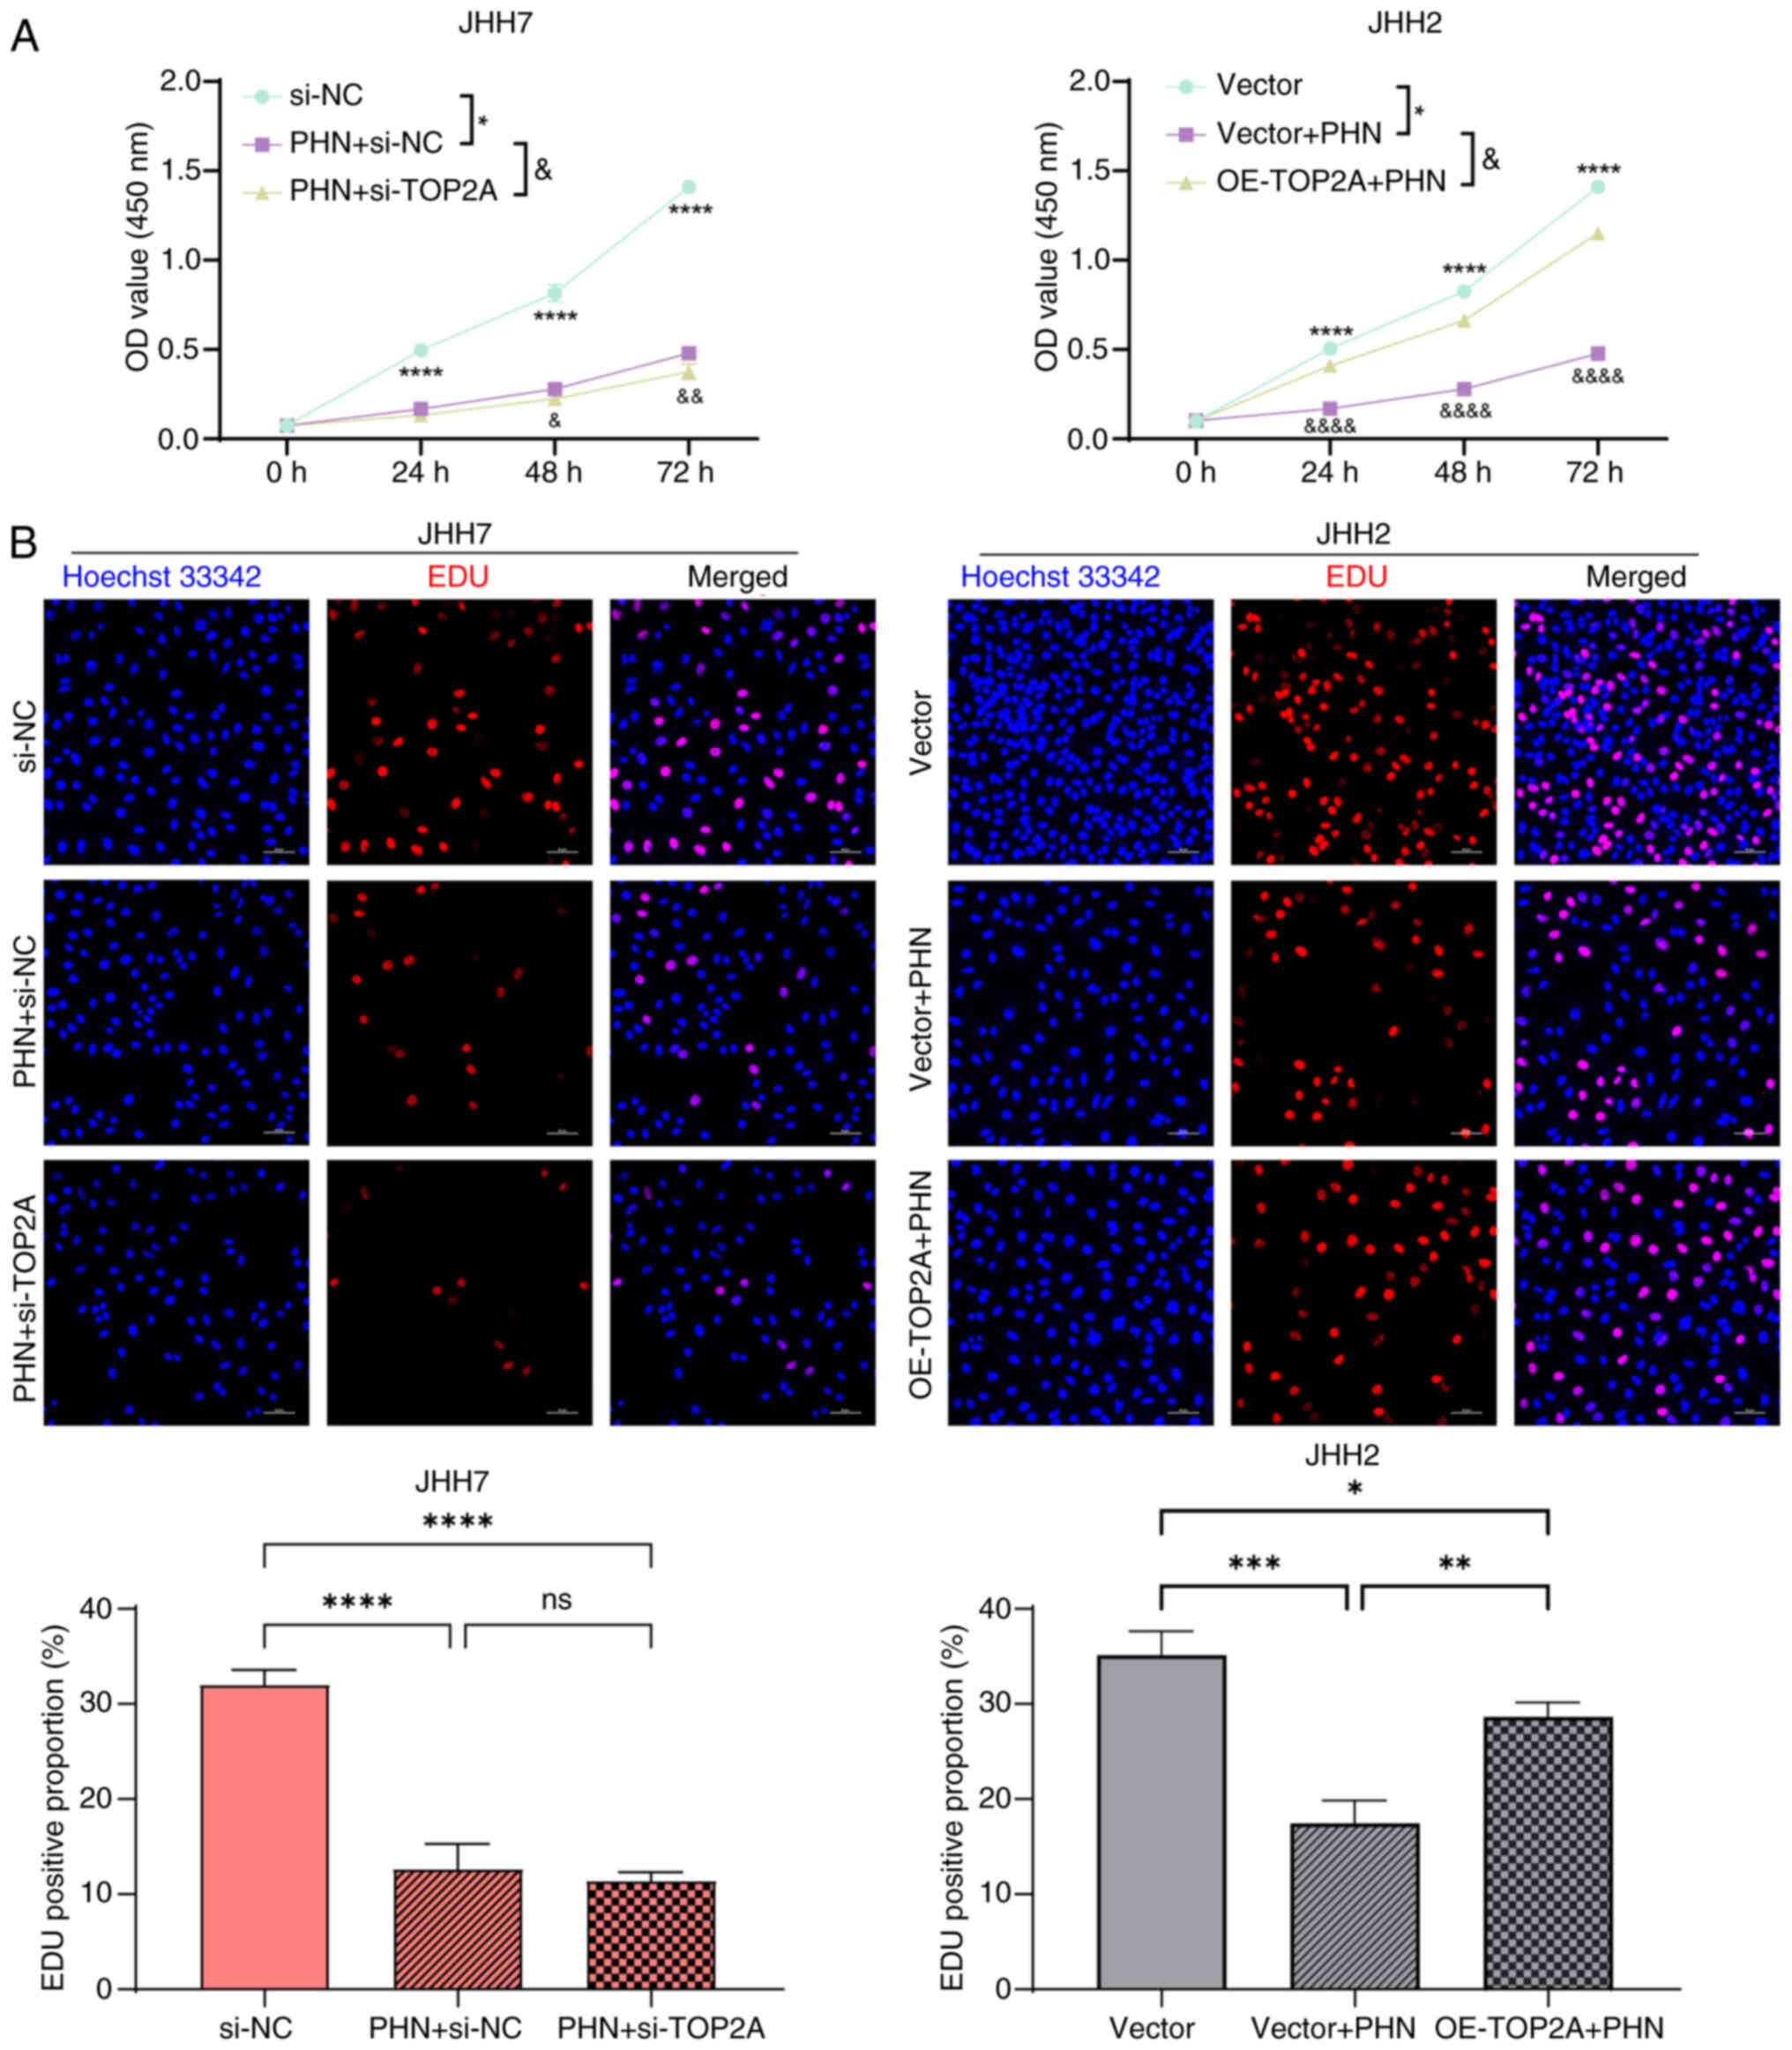 | Figure 5.PHN inhibits hepatocellular carcinoma
cell proliferation. (A) JHH7 cells pre-treated with PHN for 24 h
were selected, and the changes of JHH7 cell viability after
transfection with si-TOP2A interference sequence for 24, 48 and 72
h were detected by CCK-8 assay. JHH2 cells transfected with TOP2A
overexpression plasmid were selected, and the changes of JHH7 cell
viability after PHN treatment for 24, 48 and 72 h were detected by
CCK-8 assay. *P<0.05 and ****P<0.0001 between PHN + si-NC and
si-NC. &P<0.05, &&P<0.01
and &&&&P<0.0001 between PHN + si-NC
and PHN + si-TOP2A groups. (B) JHH7 cells pre-treated with PHN for
24 h were selected, and the changes of JHH7 cell viability after
transfection with si-TOP2A interference sequence for 48 h were
detected by EDU assay. JHH2 cells transfected with TOP2A
overexpression plasmid were selected, and the changes of JHH7 cell
viability after PHN treatment for 24 h were detected by EDU assay.
Scale bar, 50 µm. *P<0.05, **P<0.01, ***P<0.001 and
****P<0.0001. PHN, phillyrin; si-, small interfering; TOP2A, DNA
topoisomerase II alpha; CCK-8, Cell Counting Kit-8; NC, negative
control; ns, not significant. |
PHN can target and inhibit the
expression of TOP2A protein to induce ferroptosis of hepatoma
cells
To determine the ability of PHN to trigger
ferroptosis in hepatoma cells, the changes in mitochondrial
morphology and structure were observed by electron microscopy. The
electron microscopy structure showed that mitochondria in the
control group were oval or rod-shaped, with a double-membrane
structure. The outer membrane was smooth, and the inner membrane
folded inward to form cristae. However, after treatment with PHN,
the outer membrane of mitochondria ruptured, the cristae decreased,
and the mitochondrial morphology was disrupted. Nevertheless,
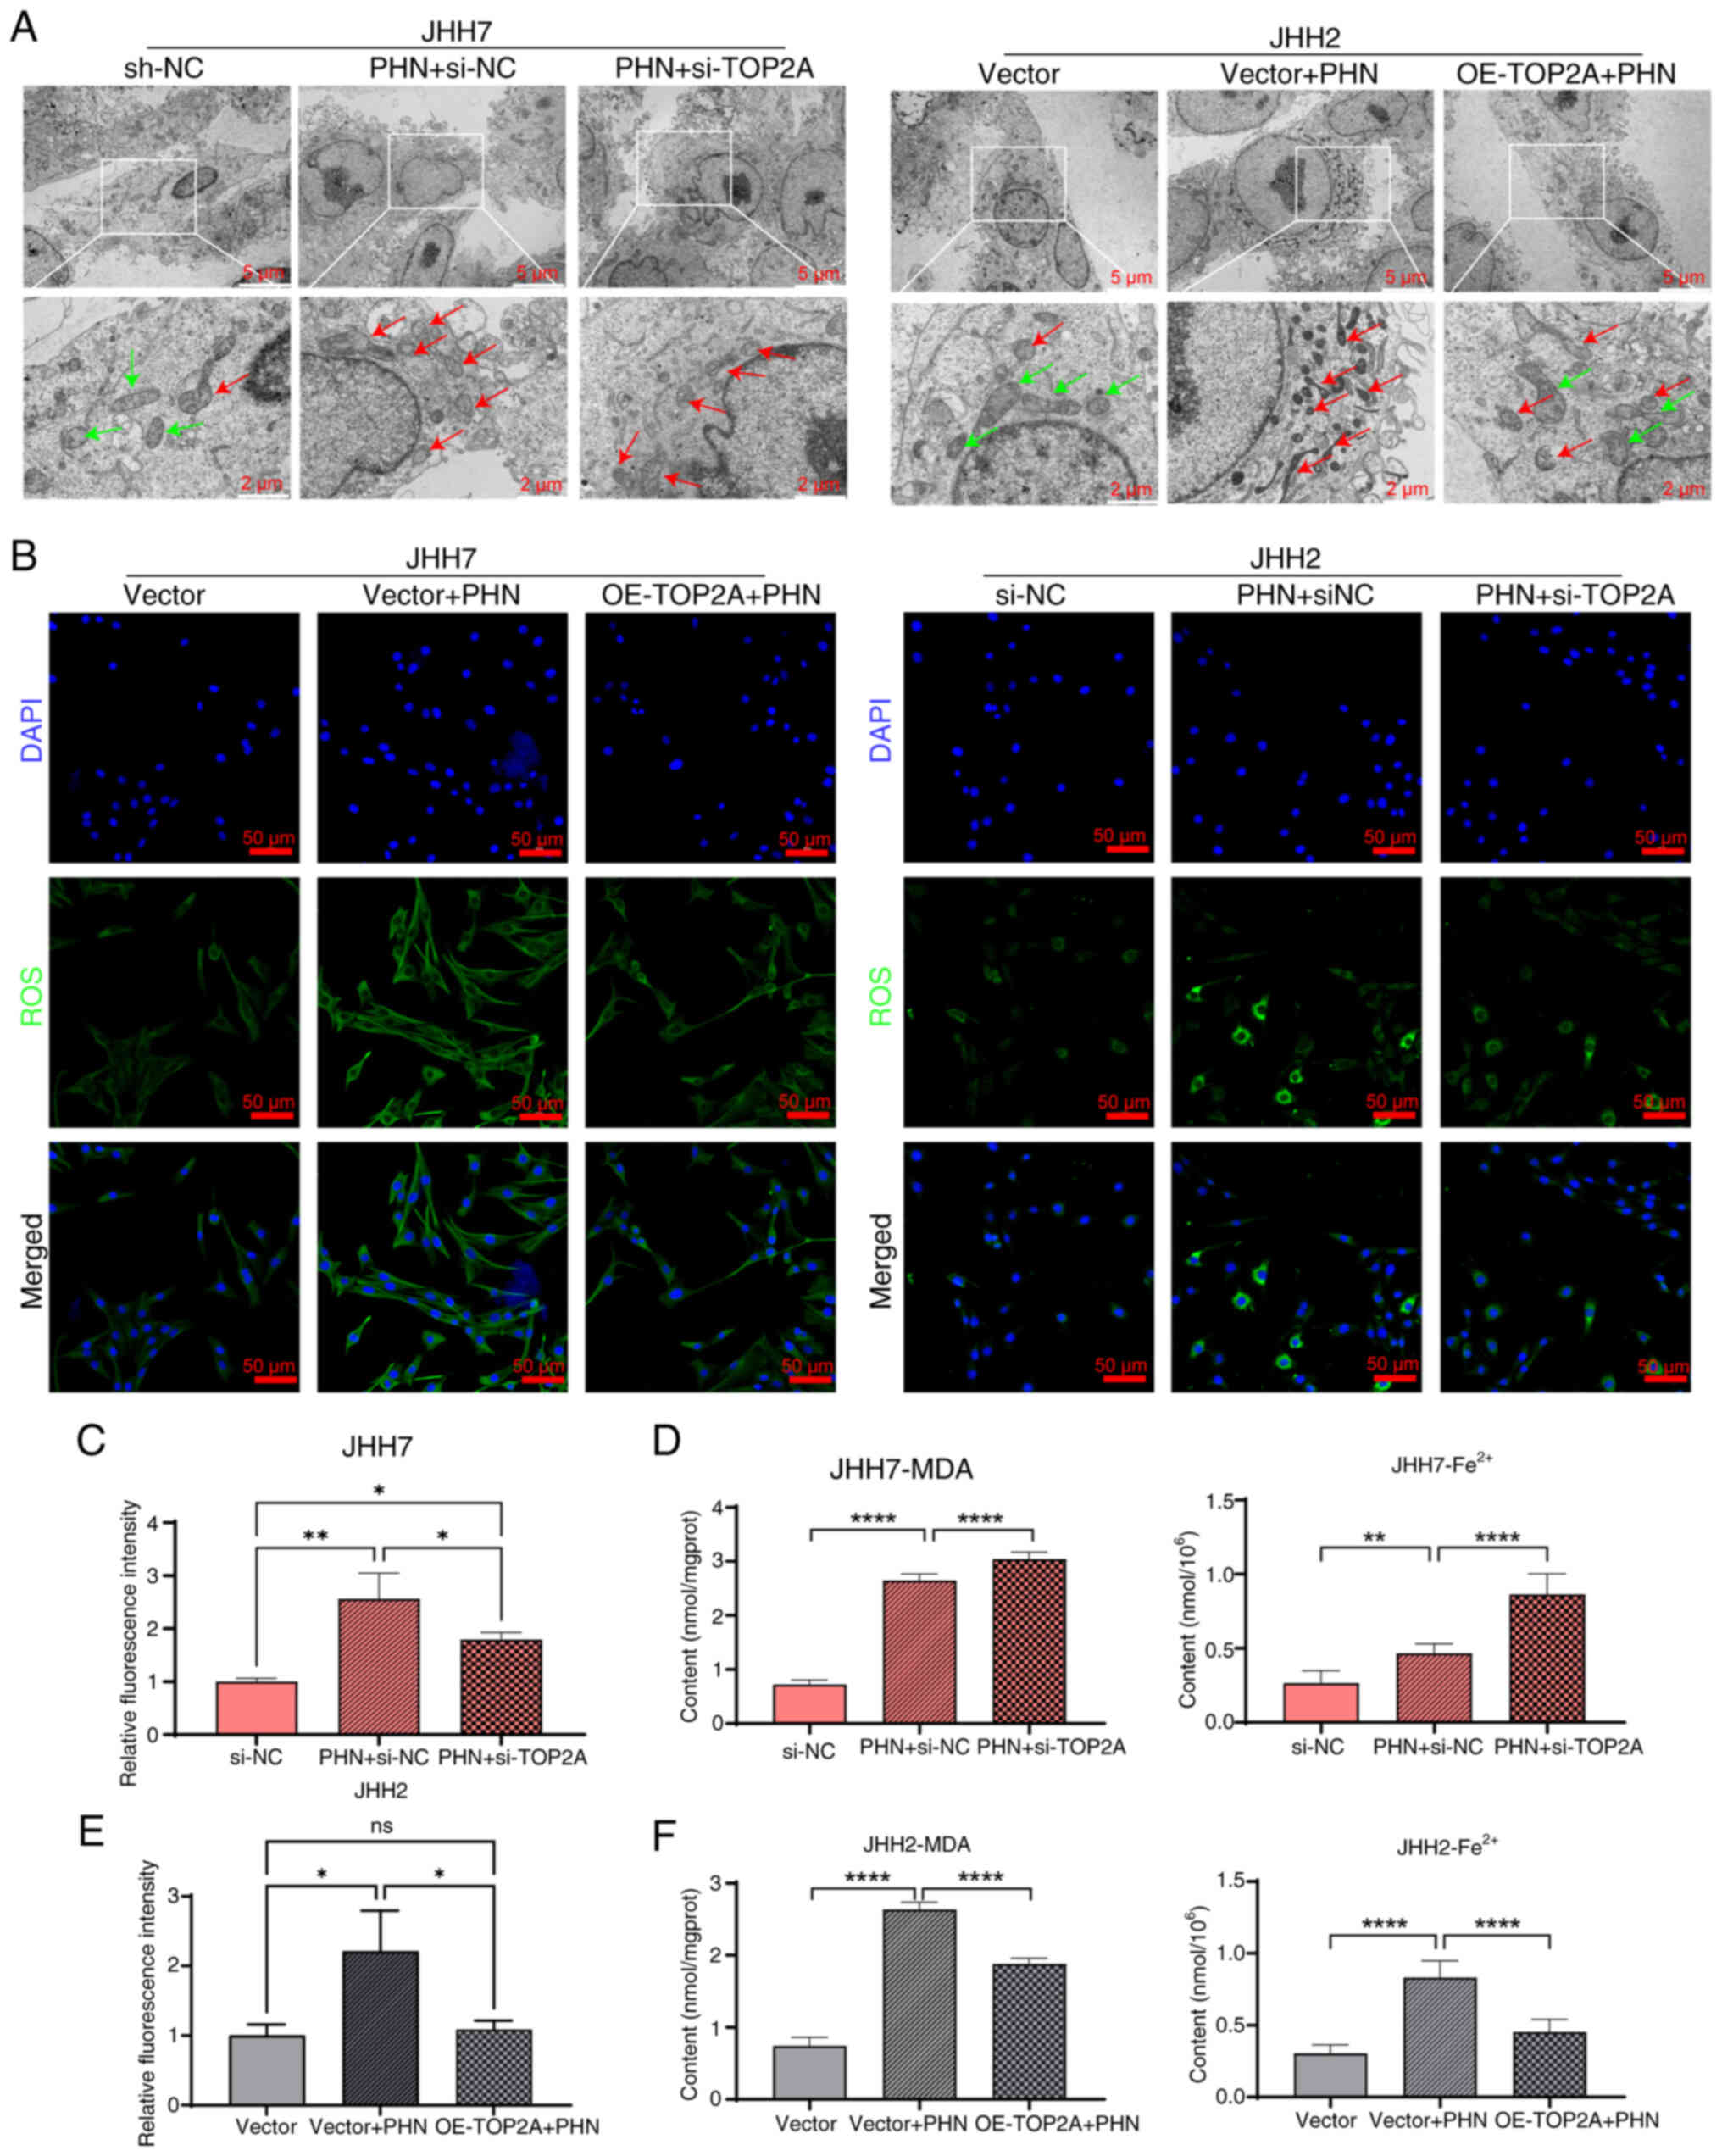
overexpression of TO2AP could reverse this phenomenon (Fig. 6A). Attention was also paid to the
changes in the intracellular ROS level. The results revealed that
PHN treatment could significantly enhance the fluorescence
intensity of intracellular ROS, while overexpression of TO2AP could
restore the intracellular ROS expression level. In addition, the
fluctuations in intracellular Fe2+ concentration and MDA
content were monitored. The results indicated that PHN
significantly increased the intracellular Fe2+
concentration and MDA level in hepatoma cells. Furthermore, when
PHN was introduced after initially inhibiting TOP2A, it further
increased the levels of Fe2+ and MDA. Conversely,
subsequent overexpression of TOP2A after PHN restored the
concentrations of Fe2+ and MDA in hepatoma cells to the
original levels (Fig. 6B-F). This
suggests that PHI can disrupt the mitochondrial structure of
hepatoma cells, trigger oxidative stress, increase the expression
levels of MDA and Fe2+ intracellularly, and promote
ferroptosis in hepatoma cells. The mechanism is likely to be
achieved by inhibiting the expression level of TOP2A protein.
PHN induces ferroptosis in liver
cancer cells by inhibiting the JAK2/STAT3 signaling pathway
To delve deeper into the underlying mechanism by
which PHN initiates ferroptosis, the activation of the JAK2/STAT3
signaling axis and the concentration of proteins linked to
ferroptotic processes were examined utilizing WB. The findings
indicated that PHN significantly inhibited the activation
(phosphorylation) of both JAK2 and STAT3, while it had no
substantial impact on the overall protein quantities of JAK2 and
STAT3. Additionally, PHN was found to decrease the synthesis of
glutathione peroxidase 4 (GPX4) and factor inhibiting
hypoxia-inducible factor 1 alpha (FIH1), whereas it concurrently
enhanced the synthesis of proteins pertinent to ferroptosis, such
as COX2, ACSL4 and NOX1. After TOP2A was downregulated, JHH7 cells
were treated with PHN, which enhanced the inhibition of the
JAK2/STAT3 signaling pathway. After PHN treatment, overexpression
of TOP2A could resist the regulatory effects of PHN on JHH2 cell
pathway proteins and ferroptosis-related proteins (Fig. 7A and B). These results suggest that
PHN can induce ferroptosis in HCC by inhibiting the JAK2/STAT3
signaling pathway and regulating the expression level of
ferroptosis-related proteins.
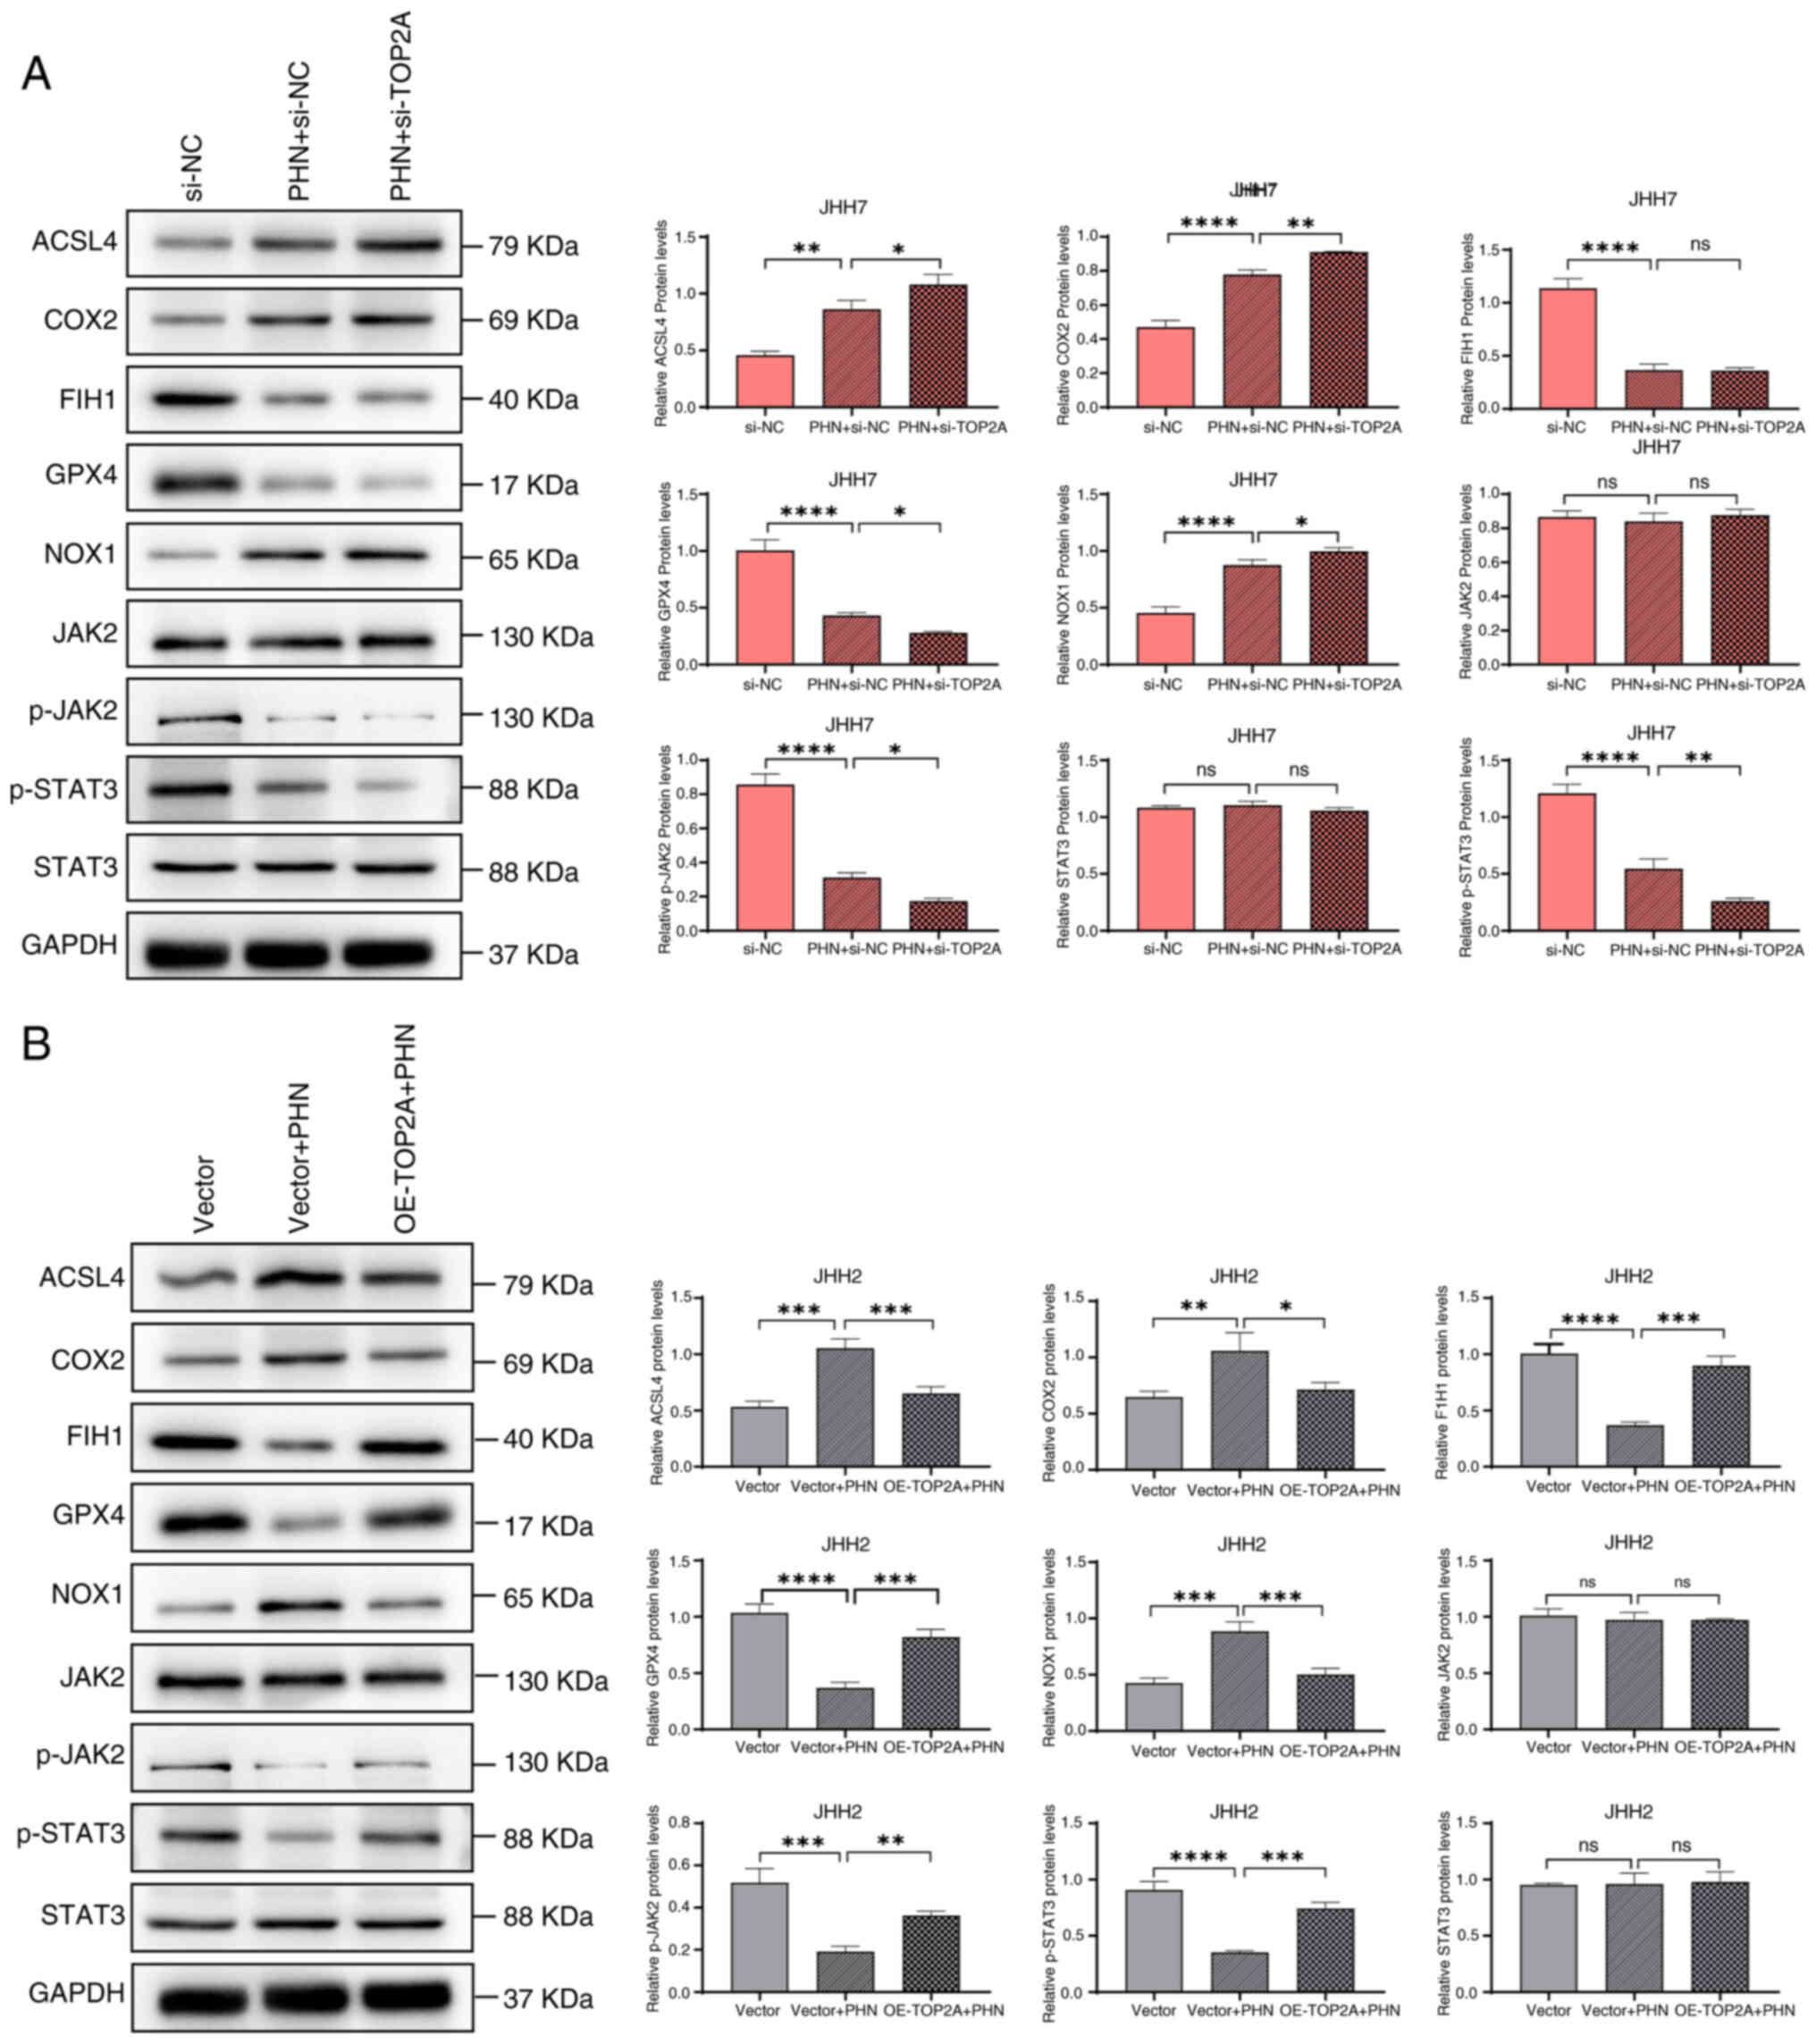 | Figure 7.PHN induces ferroptosis in
hepatocellular carcinoma cells through inhibition of the JAK2/STAT3
signaling pathway. (A) After treatment with interfering si-TOP2A
and PHN, the relative expression levels of ACSL4, COX2, FIH1, GPX4,
NOX1, JAK2, p-JAK2, STAT3 and p-STAT3 proteins were detected by WB.
(B) After treatment with overexpression plasmids and PHN, the
relative expression levels of ACSL4, COX2, FIH1, GPX4, NOX1, JAK2,
p-JAK2, STAT3 and p-STAT3 proteins were detected by WB. *P<0.05,
**P<0.01, ***P<0.001 and ****P<0.0001. PHN, phillyrin;
si-, small interfering; ACSL4, acyl-CoA synthetase family member 4;
FIH1, factor inhibiting hypoxia-inducible factor 1 alpha; GPX4,
glutathione peroxidase 4; p-, phosphorylated; WB, western blotting;
ns, not significant. |
Discussion
PHN has emerged as a promising therapeutic agent for
numerous conditions, owing to its inherent benefits such as minimal
toxicity and potent activity, and exhibits remarkable prospects in
the realm of cancer treatment (6).
Prior to this research, the application of PHN had not been
documented in the context of liver carcinoma cells. The
groundbreaking aspect of the current investigation lies in
uncovering the precise impact of PHN on liver cancer as well as its
underlying mode of action. Based on the analysis results of the
online database, TOP2A was identified as a potential target of PHN,
and the regulatory relationship between PHN and ATP1A3 was further
confirmed through molecular docking and WB experiments. The
regulatory relationship between PHN and TOP2A has not been reported
in the literature. The present results confirmed that PHN can
significantly inhibit the expression of TOP2A protein and mRNA. The
results of CCK-8 identified that PHN could inhibit the
proliferation of JHH2 and JHH7 cells. Interestingly, PHN (100
µmol/l) had a survival rate of 49.33% for JHH7 and 54.17% for JHH2.
The survival rate of JHH2 cells after PHN treatment is higher,
which it was hypothesized that it may be related to the expression
level of TOP2A in the cells themselves. In JHH7 cells, the
expression level of TOP2A mRNA and protein is higher than that of
JHH2 cells, and TOP2A has been proved to promote the process of
cancer (25,26). Therefore, PHN has a weaker effect on
JHH7 cells than JHH2 cells.
In the prognostic analysis of HCC, TOP2A is
considered to be highly correlated with drug resistance and
ferroptosis in HCC (27), and
similar reports have also been reported in other cancers. TOP2A is
a potential biomarker of skin squamous cell carcinoma, and is also
highly correlated with genes related to ferroptosis in skin
squamous cell carcinoma (28). It
is suggested that inhibiting the abnormal expression of TOP2A is a
new way to block the progression of cancer. The present results
suggested that PHN can downregulate TOP2A and inhibit the
progression of liver cancer cells. Ferroptosis is an emerging
cellular programmed death mode, which is closely related to HCC
(29). Ferroptosis inhibitors GPX4
and FIH1 play a key role in regulating ferroptosis. It has been
suggested that the depletion of GPX4 will lead to the accumulation
of Fe2+ and MDA and eventually induce ferroptosis in HCC
cells (30). Inhibition of FIH1
induces ROS accumulation and ultimately leads to ferroptosis in rat
myocardial tissue (31). This is
consistent with the results of the present study. PHN can induce
the increase of the expression levels of MDA, Fe2+ and
ROS in hepatoma cells, and destroy the mitochondrial structure to
induce ferroptosis. It was also found that PHN can inhibit the
expression of GPX4 and FIH1 proteins, and activate the expression
levels of ACSL4, COX2 and NOX1 proteins. ACSL4, COX2 and NOX1 are
all marker proteins that have been previously reported to induce
ferroptosis of cells (32–34). The current results successfully
confirmed that PHN induces ferroptosis in liver cancer cells by
targeting TOP2A to regulate ferroptosis-related proteins.
The deviant activation of the JAK2/STAT3 signaling
cascade has been identified as a detrimental element affecting
cancer outcomes (35,36). Recent findings indicate that the
engagement of the JAK2/STAT3 signaling route is capable of inducing
ferroptotic cell death in breast cancer and bolstering resistance
to therapeutic agents (37). In
addition, blocking the activation of the JAK2/STAT3 signaling
pathway can induce ferroptosis in cancer cells in osteosarcoma and
renal cancer (38,39). The present study emphasizes that PHN
can inhibit the expression level of phosphorylated (p-)JAK2 and
p-STAT3 by targeting TOP2A, curtail the function of the JAK2/STAT3
signaling cascade, subsequently stifling the advancement of HCC,
aligning with the outcomes of earlier research. Nevertheless, the
present findings fail to establish a direct targeting linkage
between PHN and the JAK2/STAT3 signaling cascade. The JAK2/STAT3
signaling pathway activator was not added to conduct a reverse
verification experiment to further prove our view, which is also
the focus of our follow-up work.
In summary, to the best of our knowledge, the
present study is the first to demonstrate that PHN can inhibit
TOP2A expression in liver cancer cells, block the JAK2/STAT3
signaling pathway and induce ferroptosis in liver cancer cells.
While the current findings are encouraging, some questions remain.
PHN has low bioavailability, poor water solubility, and requires
higher doses to achieve effective concentrations (40,41).
The metabolic processes of PHN in vivo are not well
understood, which may affect its effectiveness and safety (42). In addition, the in-depth mechanism
of how PHN inhibits the JAK2/STAT3 pathway and the comprehension of
the signaling route remains obscure and necessitates additional
validation through the conduct of numerous experimental studies.
Therefore, future work will focus on the metabolic pathways of PHN
in animals and provide abundant data supporting its therapeutic
application. The aim is to solve the problem of the low drug
utilization rate of PHN and provide a theoretical basis for the
development of its clinical application.
Supplementary Material
Supporting Data
Acknowledgements
Not applicable.
Funding
The present study was supported by the Scientific and
Technological Innovation Major Base of Guangxi (grant no.
2022-36-E05).
Availability of data and materials
The data generated in the present study may be
requested from the corresponding author.
Authors' contributions
YZ, FH, XL and YH gathered materials, collected data
and conducted analyses. YHu was responsible for drafting the
initial version of the manuscript. All authors played a pivotal
role in the conceptualization and planning of the study, while all
participants provided feedback on its earlier iterations. All
authors read and approved the final version of the manuscript. YZ
and FH confirm the authenticity of all the raw data.
Ethics approval and consent to
participate
Not applicable.
Patient consent for publication
Not applicable.
Competing interests
The authors declare that they have no competing
interests.
References
|
1
|
Anwanwan D, Singh SK, Singh S, Saikam V
and Singh R: Challenges in liver cancer and possible treatment
approaches. Biochim Biophys Acta Rev Cancer. 1873:1883142020.
View Article : Google Scholar : PubMed/NCBI
|
|
2
|
Rumgay H, Arnold M, Ferlay J, Lesi O,
Cabasag CJ, Vignat J, Laversanne M, McGlynn KA and Soerjomataram I:
Global burden of primary liver cancer in 2020 and predictions to
2040. J Hepatol. 77:1598–1606. 2022. View Article : Google Scholar : PubMed/NCBI
|
|
3
|
Llovet JM, Kelley RK, Villanueva A, Singal
AG, Pikarsky E, Roayaie S, Lencioni R, Koike K, Zucman-Rossi J and
Finn RS: Hepatocellular carcinoma. Nat Rev Dis Primers. 7:62021.
View Article : Google Scholar : PubMed/NCBI
|
|
4
|
Huang DQ, El-Serag HB and Loomba R: Global
epidemiology of NAFLD-related HCC: Trends, predictions, risk
factors and prevention. Nat Rev Gastroenterol Hepatol. 18:223–238.
2021. View Article : Google Scholar : PubMed/NCBI
|
|
5
|
Vogel A and Saborowski A: Medical therapy
of HCC. J Hepatol. 76:208–210. 2022. View Article : Google Scholar : PubMed/NCBI
|
|
6
|
Zhou C, Lu M, Cheng J, Rohani ER, Hamezah
HS, Han R and Tong X: Review on the pharmacological properties of
phillyrin. Molecules. 27:36702022. View Article : Google Scholar : PubMed/NCBI
|
|
7
|
Tang K, Zhong B, Luo Q, Liu Q, Chen X, Cao
D, Li X and Yang S: Phillyrin attenuates norepinephrine-induced
cardiac hypertrophy and inflammatory response by suppressing
p38/ERK1/2 MAPK and AKT/NF-kappaB pathways. Eur J Pharmacol.
927:1750222022. View Article : Google Scholar : PubMed/NCBI
|
|
8
|
Wang T, Wen X, Zhang Z, Xie M and Zhou J:
Phillyrin ameliorates diabetic nephropathy through the
PI3K/Akt/GSK-3β signalling pathway in streptozotocin-induced
diabetic mice. Hum Exp Toxicol. 40 (12 Suppl):S487–S496. 2021.
View Article : Google Scholar : PubMed/NCBI
|
|
9
|
Fang Z, Wei L, Lv Y, Wang T, Hamezah HS,
Han R and Tong X: Phillyrin restores metabolic disorders in mice
fed with high-fat diet through inhibition of interleukin-6-mediated
basal lipolysis. Front Nutr. 9:9562182022. View Article : Google Scholar : PubMed/NCBI
|
|
10
|
Do MT, Kim HG, Choi JH, Khanal T, Park BH,
Tran TP, Hwang YP, Na M and Jeong HG: Phillyrin attenuates high
glucose-induced lipid accumulation in human HepG2 hepatocytes
through the activation of LKB1/AMP-activated protein
kinase-dependent signaling. Food Chem. 136:415–425. 2013.
View Article : Google Scholar : PubMed/NCBI
|
|
11
|
Zhang Y, Ding Y, Zhao H, Wang Z, Zeng F,
Qian Z, Li J, Ma T and Huang C: Downregulating PDPK1 and taking
phillyrin as PDPK1-targeting drug protect hepatocytes from
alcoholic steatohepatitis by promoting autophagy. Cell Death Dis.
13:9912022. View Article : Google Scholar : PubMed/NCBI
|
|
12
|
Tang X, Teng J and Lu K: Phillyrin
sensitizes lung cancer cells to ferroptosis through inhibiting
FTH1/SLC7A11 axis. Int J Clin Pharmacol Ther. 62:8–19. 2024.
View Article : Google Scholar : PubMed/NCBI
|
|
13
|
Wang DH, He X and He Q: Combining use of
Phillyrin and autophagy blocker alleviates laryngeal squamous cell
carcinoma via AMPK/mTOR/p70S6K signaling. Biosci Rep.
39:BSR201904592019. View Article : Google Scholar : PubMed/NCBI
|
|
14
|
Jiang X, Stockwell BR and Conrad M:
Ferroptosis: Mechanisms, biology and role in disease. Nat Rev Mol
Cell Biol. 22:266–282. 2021. View Article : Google Scholar : PubMed/NCBI
|
|
15
|
Wu J, Wang Y, Jiang R, Xue R, Yin X, Wu M
and Meng Q: Ferroptosis in liver disease: New insights into disease
mechanisms. Cell Death Discov. 7:2762021. View Article : Google Scholar : PubMed/NCBI
|
|
16
|
Xia X, Fan X, Zhao M and Zhu P: The
relationship between ferroptosis and tumors: A novel landscape for
therapeutic approach. Curr Gene Ther. 19:117–124. 2019. View Article : Google Scholar : PubMed/NCBI
|
|
17
|
Li Y, Wei J, Sun Y, Zhou W, Ma X, Guo J,
Zhang H and Jin T: DLGAP5 regulates the proliferation, migration,
invasion, and cell cycle of breast cancer cells via the JAK2/STAT3
signaling axis. Int J Mol Sci. 24:158192023. View Article : Google Scholar : PubMed/NCBI
|
|
18
|
Li J and Zhu Y: Recent advances in liver
cancer stem cells: Non-coding RNAs, oncogenes and oncoproteins.
Front Cell Dev Biol. 8:5483352020. View Article : Google Scholar : PubMed/NCBI
|
|
19
|
Ding X, Lu D and Fan J: A natural product
phillygenin suppresses osteosarcoma growth and metastasis by
regulating the SHP-1/JAK2/STAT3 signaling. Biosci Biotechnol
Biochem. 85:307–314. 2021. View Article : Google Scholar : PubMed/NCBI
|
|
20
|
Kim TW, Shin JS, Chung KS, Lee YG, Baek NI
and Lee KT: Anti-inflammatory mechanisms of koreanaside A, a Lignan
isolated from the flower of Forsythia koreana, against LPS-induced
macrophage activation and DSS-induced colitis mice: The crucial
role of AP-1, NF-κB, and JAK/STAT signaling. Cells. 8:11632019.
View Article : Google Scholar : PubMed/NCBI
|
|
21
|
Pan X, Cao X, Li N, Xu Y, Wu Q, Bai J, Yin
Z, Luo L and Lan L: Forsythin inhibits lipopolysaccharide-induced
inflammation by suppressing JAK-STAT and p38 MAPK signalings and
ROS production. Inflamm Res. 63:597–608. 2014. View Article : Google Scholar : PubMed/NCBI
|
|
22
|
Su M, Zhou D, Huang J, Yang T, Zhou Q and
Tan Y: Forsythiaside A exhibits anti-migration and
anti-inflammation effects in rheumatoid arthritis in vitro model.
Int J Rheum Dis. 27:e149762024. View Article : Google Scholar : PubMed/NCBI
|
|
23
|
Cerapio JP, Marchio A, Cano L, López I,
Fournié JJ, Régnault B, Casavilca-Zambrano S, Ruiz E, Dejean A,
Bertani S and Pineau P: Global DNA hypermethylation pattern and
unique gene expression signature in liver cancer from patients with
Indigenous American ancestry. Oncotarget. 12:475–492. 2021.
View Article : Google Scholar : PubMed/NCBI
|
|
24
|
Livak KJ and Schmittgen TD: Analysis of
relative gene expression data using real-time quantitative PCR and
the 2(−Delta Delta C(T)) method. Methods. 25:402–408. 2001.
View Article : Google Scholar : PubMed/NCBI
|
|
25
|
Liu T, Zhang H, Yi S, Gu L and Zhou M:
Mutual regulation of MDM4 and TOP2A in cancer cell proliferation.
Mol Oncol. 13:1047–1058. 2019. View Article : Google Scholar : PubMed/NCBI
|
|
26
|
Zhang K, Zheng X, Sun Y, Feng X, Wu X, Liu
W, Gao C, Yan Y, Tian W and Wang Y: TOP2A modulates signaling via
the AKT/mTOR pathway to promote ovarian cancer cell proliferation.
Cancer Biol Ther. 25:23251262024. View Article : Google Scholar : PubMed/NCBI
|
|
27
|
Li C, Cui X, Li Y, Guo D and He S:
Identification of ferroptosis and drug resistance related hub genes
to predict the prognosis in Hepatocellular carcinoma. Sci Rep.
13:86812023. View Article : Google Scholar : PubMed/NCBI
|
|
28
|
Su W, Huang B, Zhang Q, Han W, An L, Guan
Y, Ji J and Yu D: Exploring potential biomarkers, ferroptosis
mechanisms, and therapeutic targets associated with cutaneous
squamous cell carcinoma via integrated transcriptomic analysis. J
Healthc Eng. 2022:35240222022. View Article : Google Scholar : PubMed/NCBI
|
|
29
|
Yang R, Gao W, Wang Z, Jian H, Peng L, Yu
X, Xue P, Peng W, Li K and Zeng P: Polyphyllin I induced
ferroptosis to suppress the progression of hepatocellular carcinoma
through activation of the mitochondrial dysfunction via
Nrf2/HO-1/GPX4 axis. Phytomedicine. 122:1551352024. View Article : Google Scholar : PubMed/NCBI
|
|
30
|
Wang Q, Bin C, Xue Q, Gao Q, Huang A, Wang
K and Tang N: GSTZ1 sensitizes hepatocellular carcinoma cells to
sorafenib-induced ferroptosis via inhibition of NRF2/GPX4 axis.
Cell Death Dis. 12:4262021. View Article : Google Scholar : PubMed/NCBI
|
|
31
|
Zhang W, Qiao W and Zuo L: A1
and A2b adenosine receptors regulate GPX4 against
ferroptosis of cardiomyocytes in myocardial infarction rat model
and in vitro. Tissue Cell. 77:1018282022. View Article : Google Scholar : PubMed/NCBI
|
|
32
|
Chen C, Wang D, Yu Y, Zhao T, Min N, Wu Y,
Kang L, Zhao Y, Du L, Zhang M, et al: Legumain promotes tubular
ferroptosis by facilitating chaperone-mediated autophagy of GPX4 in
AKI. Cell Death Dis. 12:652021. View Article : Google Scholar : PubMed/NCBI
|
|
33
|
Doll S, Proneth B, Tyurina YY, Panzilius
E, Kobayashi S, Ingold I, Irmler M, Beckers J, Aichler M, Walch A,
et al: ACSL4 dictates ferroptosis sensitivity by shaping cellular
lipid composition. Nat Chem Biol. 13:91–98. 2017. View Article : Google Scholar : PubMed/NCBI
|
|
34
|
Wu Y, Zhao Y, Yang HZ, Wang YJ and Chen Y:
HMGB1 regulates ferroptosis through Nrf2 pathway in mesangial cells
in response to high glucose. Biosci Rep. 41:BSR202029242021.
View Article : Google Scholar : PubMed/NCBI
|
|
35
|
Mengie Ayele T, Tilahun Muche Z, Behaile
Teklemariam A, Bogale Kassie A and Chekol Abebe E: Role of
JAK2/STAT3 signaling pathway in the tumorigenesis, chemotherapy
resistance, and treatment of solid tumors: A systemic review. J
Inflamm Res. 15:1349–1364. 2022. View Article : Google Scholar : PubMed/NCBI
|
|
36
|
Kohal R, Bisht P, Gupta GD and Verma SK:
Targeting JAK2/STAT3 for the treatment of cancer: A review on
recent advancements in molecular development using structural
analysis and SAR investigations. Bioorg Chem. 143:1070952024.
View Article : Google Scholar : PubMed/NCBI
|
|
37
|
Li H, Yang P, Wang J, Zhang J, Ma Q, Jiang
Y, Wu Y, Han T and Xiang D: HLF regulates ferroptosis, development
and chemoresistance of triple-negative breast cancer by activating
tumor cell-macrophage crosstalk. J Hematol Oncol. 15:22022.
View Article : Google Scholar : PubMed/NCBI
|
|
38
|
Li X and Liu J: FANCD2 inhibits
ferroptosis by regulating the JAK2/STAT3 pathway in osteosarcoma.
BMC Cancer. 23:1792023. View Article : Google Scholar : PubMed/NCBI
|
|
39
|
Li Y, Zhang Y, Qiu Q, Wang L, Mao H, Hu J,
Chen Z, Du Y and Liu X: Energy-stress-mediated AMPK activation
promotes GPX4-dependent ferroptosis through the JAK2/STAT3/P53 axis
in renal cancer. Oxid Med Cell Longev. 2022:23531152022. View Article : Google Scholar : PubMed/NCBI
|
|
40
|
Nishibe S, Mitsui-Saitoh K, Sakai J and
Fujikawa T: The biological effects of forsythia leaves containing
the cyclic AMP phosphodiesterase 4 inhibitor phillyrin. Molecules.
26:23622021. View Article : Google Scholar : PubMed/NCBI
|
|
41
|
Zhou C, Yan L, Xu J, Hamezah HS, Wang T,
Du F, Tong X and Han R: Phillyrin: An adipose triglyceride lipase
inhibitor supported by molecular docking, dynamics simulation, and
pharmacological validation. J Mol Model. 30:682024. View Article : Google Scholar : PubMed/NCBI
|
|
42
|
Wang H, Zhang X, Jia P, Zhang Y, Tang S,
Wang H, Li S, Yu X, Li Y and Zhang L: Metabolic profile of
phillyrin in rats obtained by UPLC-Q-TOF-MS. Biomed Chromatogr.
30:913–922. 2016. View Article : Google Scholar : PubMed/NCBI
|