1. Single-cell RNA-Seq
The transcriptome is the set of all RNA transcripts
of a cell/tissue of an organism, as well as their quantity
(1). The two main transcriptomic
technologies used to obtain gene expression data are microarrays
(2) and RNA sequencing (RNA-Seq)
(1). The latter can be divided
into bulk and single-cell RNA-Seq (scRNA-Seq). Bulk RNA-Seq, as the
first iteration of this technology, uses the total mRNA extracted
from a tissue, providing an average expression for each gene in the
variety of cells included in a sample. On the other hand, scRNA-Seq
is an emerging RNA-Seq technology which investigates the
transcriptome of single cells (3).
Despite the large amount of different sequencing platforms, the
main experimental workflow of scRNA-Seq includes the following
steps: i) Single-cell isolation from the tissue of interest; ii)
lysis of cells and RNA isolation; iii) reverse transcription of the
mRNA and amplification through PCR; and iv) library preparation and
sequencing (4). Independent of the
sequencing platform used, the final output is a FASTQ file, which
constitutes the scRNA-Seq raw data, containing the nucleotide
sequence, as well as a PHRED quality score for each base (5). FASTQ file generation is followed by
their computational pre-processing, resulting in the production of
a gene expression matrix, usually in the form of gene read count or
unique molecular identifier (UMI) (6) matrix in the case of droplet-based
platforms (e.g., 10x Genomics Chromium); the latter was introduced
to cater for PCR bias and ensure accurate gene expression
quantification. The pipeline for the mapping of reads to the
reference genome is in principle the same as in bulk RNA-Seq,
including the following basic steps: i) Quality control and adapter
sequence removal; ii) alignment of reads to the reference genome;
iii) feature count; and iv) normalisation (7,8).
However, in the case of single-cell data, further preprocessing
steps are included, to account for the intricacies of single-cell
sequencing, performed by specialised software. These steps include
the identification of low-quality cells, count transformation for
UMI datasets, the identification of highly variable features
(genes), dimensionality reduction, cell clustering, etc (9). Existing pipelines for the
pre-processing of scRNA-Seq data, such as Cell Ranger (10) for 10x Genomics-based data, have
already been established in the scientific community.
scRNA-Seq allows for the high-resolution study of
gene expressions in a cell-specific manner. However, scRNA-Seq gene
count data are characterised by high dimensionality, due to the
high number of cells that are isolated from an extracted tissue and
the high number of genes (both coding and non-coding) that are
studied (11). Furthermore, gene
expression levels derived from scRNA-Seq demonstrate high sparsity
due to the appearance of a large amount of zero counts of genes
(known as ‘dropout events’) that are truly expressed in other cells
of the same type. Dropout events may be attributed to the low
levels of mRNA which are extracted from each cell, the
stochasticity of gene expression and the cell-specific expression
of certain genes (12). In order
to deal with those two major drawbacks of single-cell data,
statistical and artificial intelligence methods of dimensionality
reduction and imputation, have been developed. Furthermore, certain
dimensionality reduction methods also cater for the imputation of
zero values (13). Nevertheless,
the sparsity inherent in scRNA-Seq data, can be overcome using just
dimensionality reduction, as the compression to a low-dimension
space results in the combination of expression data in the various
cells and naturally deals with data redundancy (14). The present review mainly focuses on
the available and most commonly used methods which are used to
perform dimensionality reduction on scRNA-Seq gene count data.
2. Dimensionality reduction
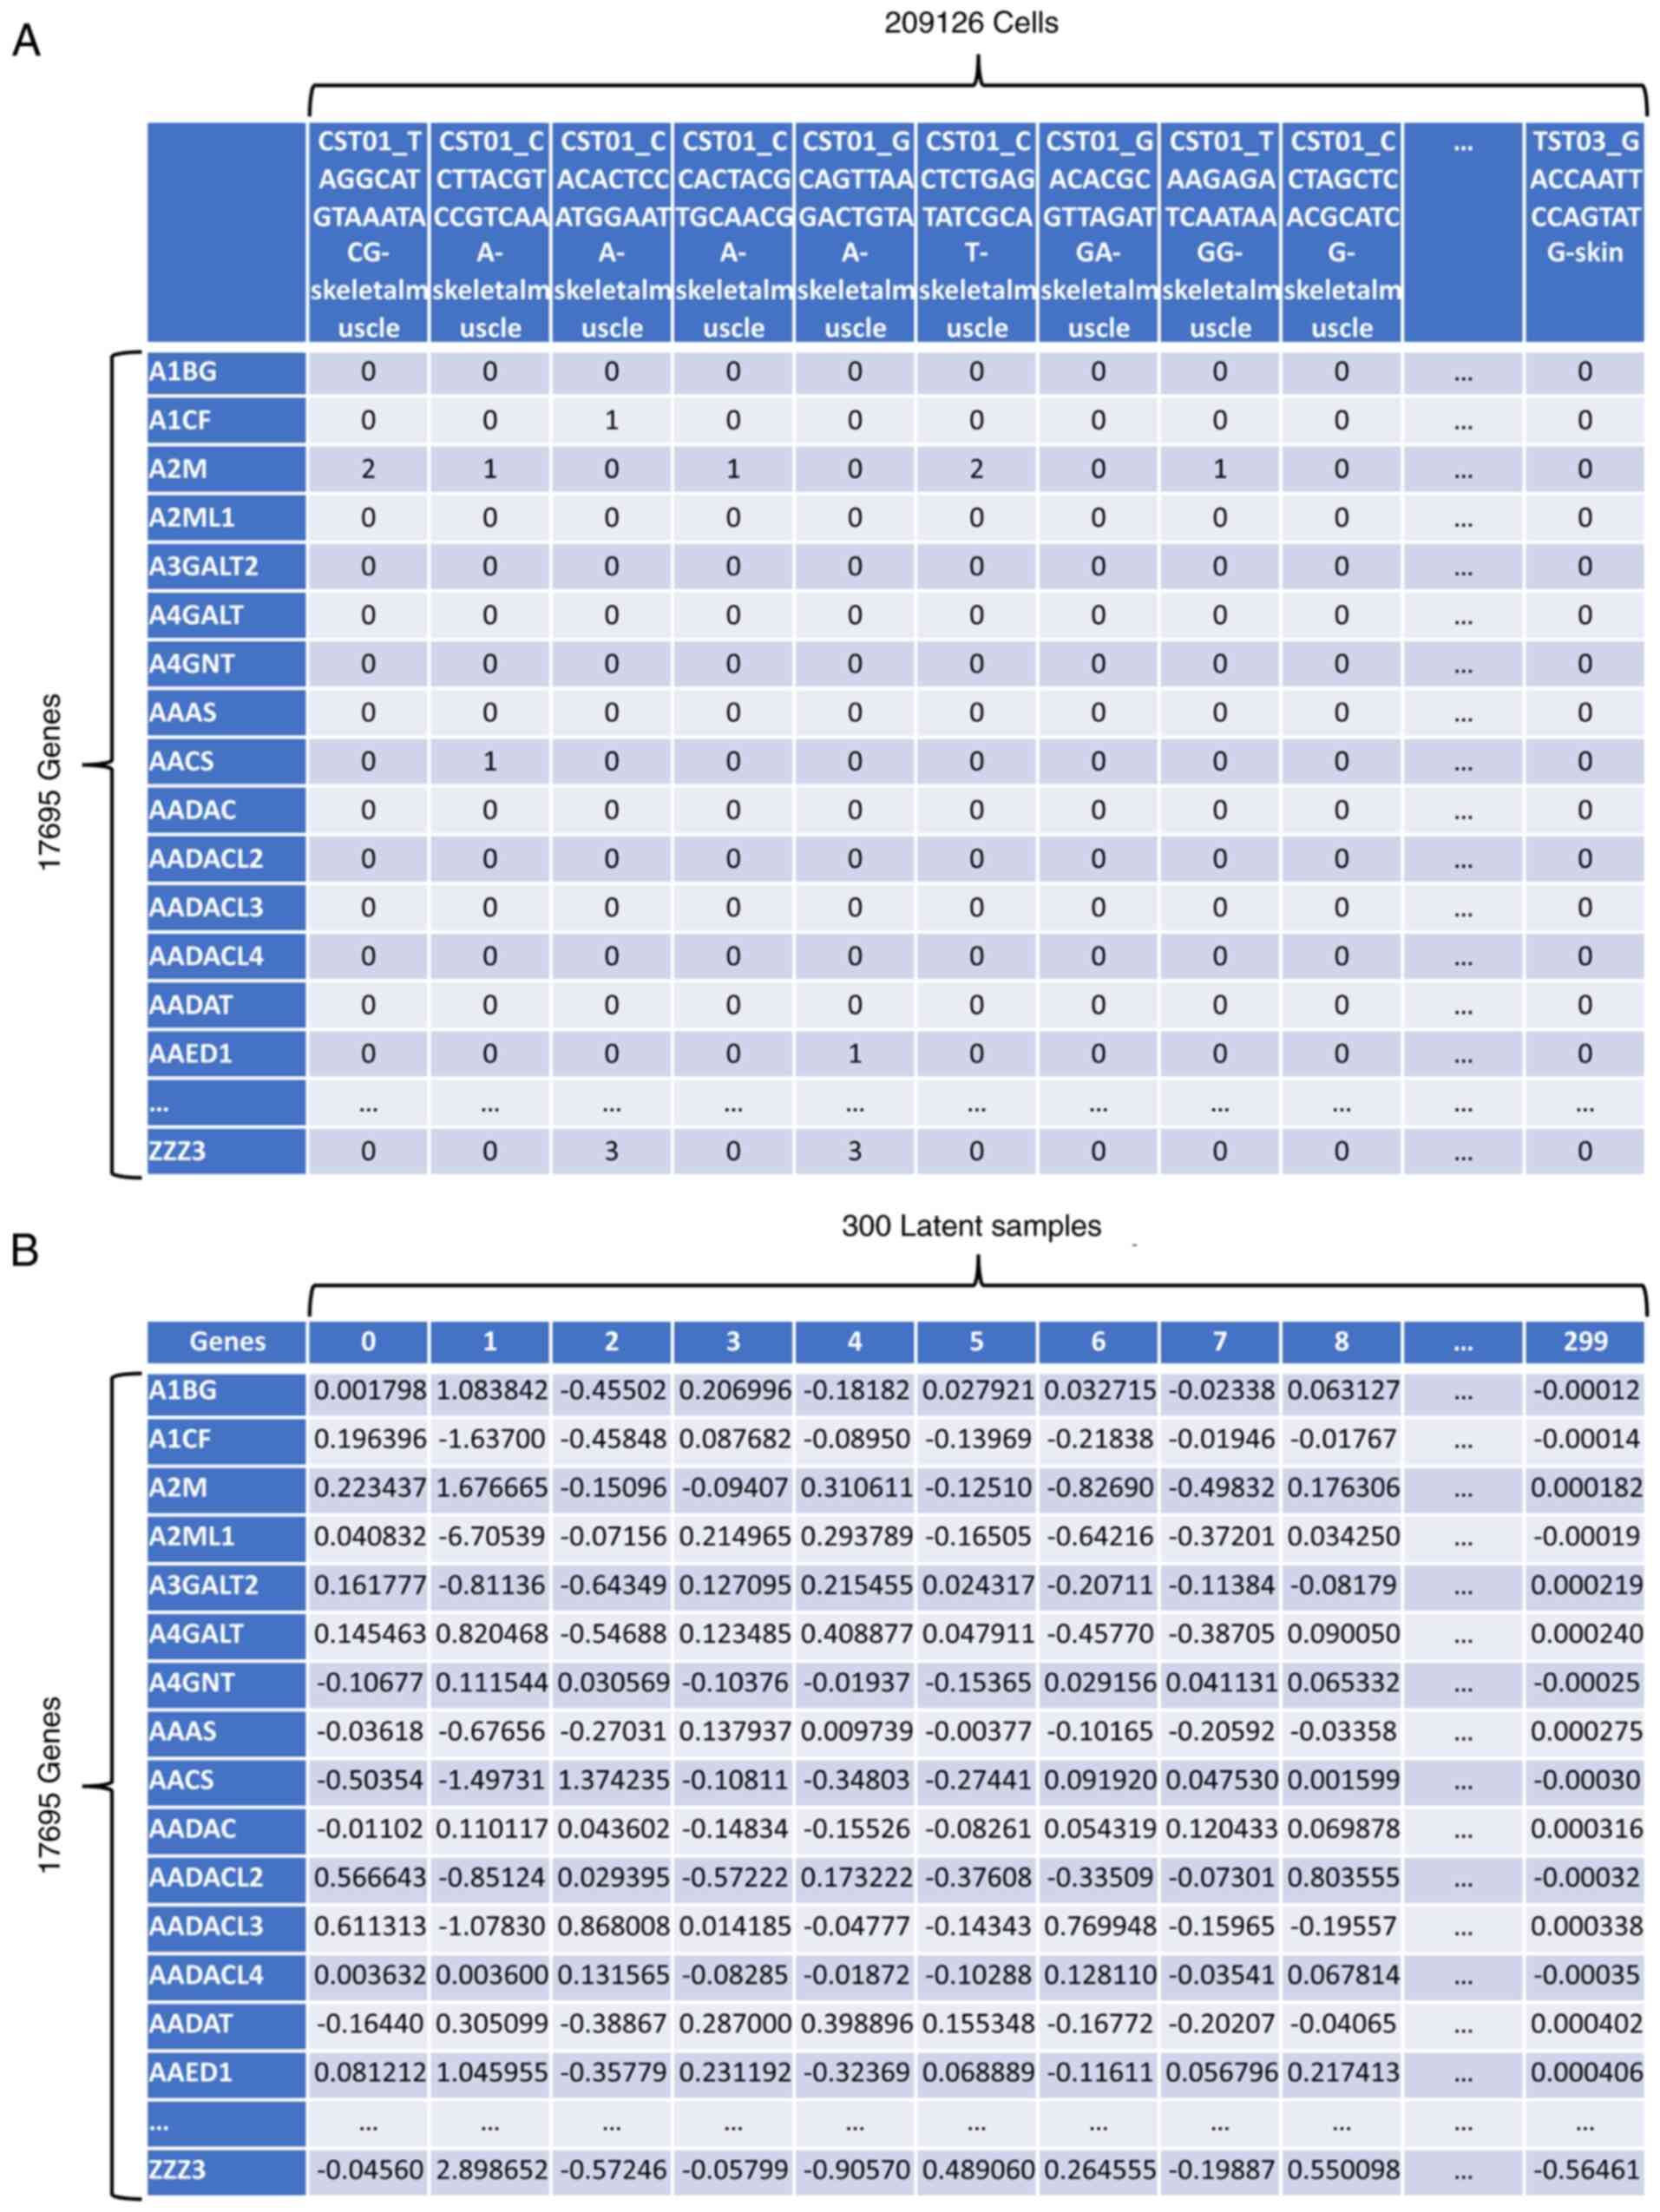
In the context of scRNA-Seq data, each cell may be
represented as a data point in a Euclidean space with as many
dimensions as the number of genes in the dataset and the
coordinates of the data point are the expressions of the genes in
the cell. Vice versa, each gene may also be depicted as a data
point in a high-dimensional space, whose dimensions are as many as
the cell number, and the point coordinates are the gene expression
levels in each cell. Consequently, scRNA-Seq count data, albeit
represented as a two-dimensional text file with columns (cells) and
rows (genes), are actually multidimensional.
Dimensionality reduction refers to the
transformation of high-dimensional data to lower-dimensions,
reducing their size while keeping most of the information present
in the original data (15). As the
amount of computational resources required to run any algorithm
(e.g., for machine learning) depends on the size of the input data,
reducing their dimensions results in lower memory requirements and
shorter execution times (16).
There are two approaches for dimensionality
reduction: Feature selection and feature extraction, where features
refer to the dataset dimensions (genes or samples). In feature
selection, a certain number of dimensions that provide the most
significant information are selected, while the remainder are
discarded. Feature extraction focuses on creating a new set of
dimensions by combining the original dimensions (15,17).
As high-dimensionality in scRNA-Seq is attributed to
both the samples and genes, dimensionality reduction can be
performed for any of the two, usually through feature extraction.
In this case, the reduction of the dimensionality of genes in
scRNA-Seq data creates a smaller set of latent genes, enabling the
efficient clustering of cells, and the subsequent identification of
cell types, a step which constitutes an essential part of most
scRNA-Seq analyses (18). On the
other hand, reducing the dimensionality of cells, through the
creation of latent samples that contain most of the biological
information of the original cells (Fig. 1), facilitates dataset integration
for differential gene expression analysis (19). Dimensionality reduction has been
established as an integral part in the scRNA-Seq data processing
pipeline for bringing the data to a more manageable form before
being used in further downstream analysis or data visualisation
(20) (Fig. 2).
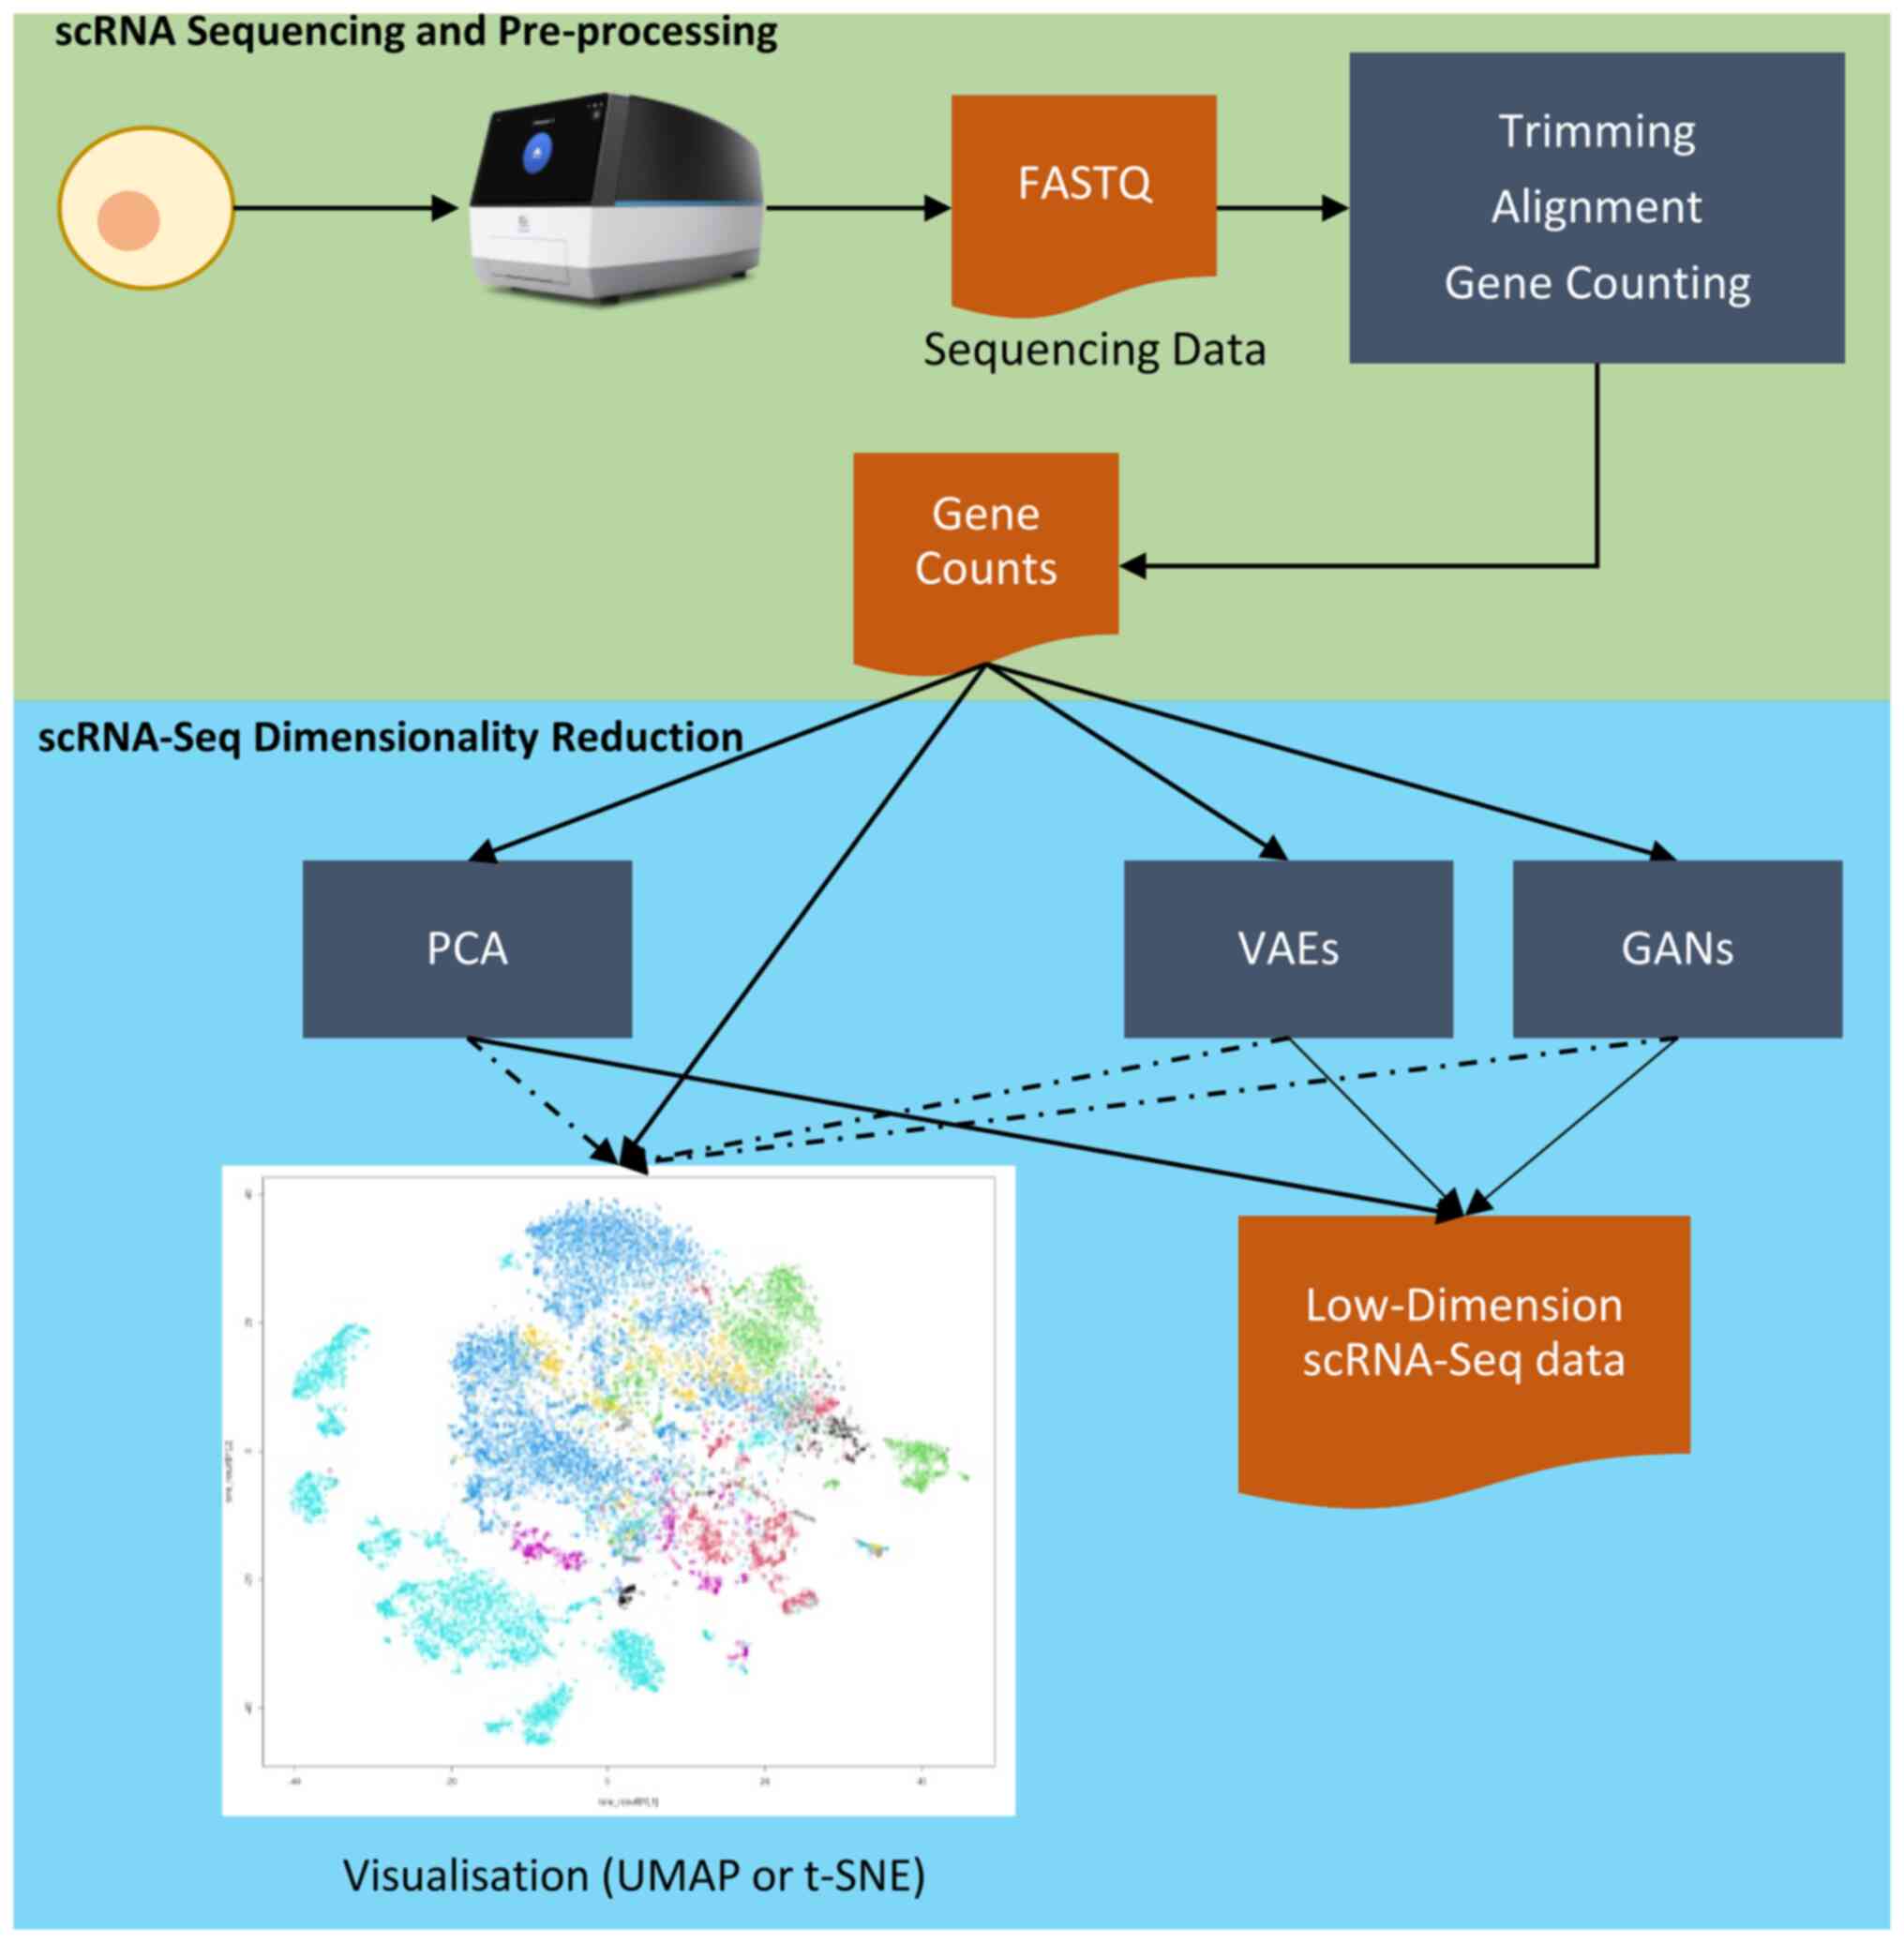 | Figure 2Flowchart of a simplified
pre-processing scRNA-Seq workflow and consequent dimensionality
reduction analyses. Starting from raw sequencing data,
pre-processing steps (quality control, alignment, and gene
counting) generate a high-dimensional gene expression matrix.
Dimensionality reduction methods, such as PCA, UMAP, t-SNE, and
advanced deep learning approaches (e.g., VAEs, GANs), address data
sparsity and complexity, facilitating visualisation and downstream
analyses. These techniques enable the extraction and preservation
of critical biological information, forming the basis for deeper
biological inferences. scRNA-Seq, single-cell RNA sequencing; PCA,
principal component analysis; UMAP, uniform manifold approximation
and projection; t-SNE, t-distributed stochastic neighbour
embedding; VAEs, variational auto encoders; GANs, generative
adversarial networks. |
3. Common dimensionality reduction
techniques in single-cell RNA-Seq
Principal component (PC) analysis
(PCA)
PCA is a statistical method used to reduce
high-dimensional data (such as scRNA-Seq data) into lower
dimensions, while retaining most of the original data information
(21). PCA is an orthogonal linear
transformation of the data points of the original dataset (22), creating new variables known as PCs
that are unrelated amongst themselves and each PC captures
decreasing proportions of the total variance of the original
dataset (23). There are several
approaches to detect the number of PCs that need to be kept in
order to retain most of the variability of the original dataset,
while excluding variability that is caused by noise. One of the
most commonly used methods is keeping the top PCs that explain an
arbitrarily selected percentage of variability, although that may
include a large number of PCs that explain variability that is
attributed to noise. On the other hand, the PCs and the variability
of the dataset they explain can be plotted and the top ones can be
selected using the ‘elbow’ method (24); however, in many cases, the ‘elbow’
may not be easily defined. In both cases, the remainder of the PCs
are discarded, thus efficiently reducing the dataset dimensions
(25).
When cells in scRNA-Seq data are treated as data
points, PCs are linear combinations of genes, known as latent genes
(26). As scRNA-Seq data provide
no prior information about the identity of each cell, PCA, as an
unsupervised method, may capture the linear associations present in
the scRNA-Seq gene expressions, producing a low-dimension dataset,
having an equal amount of cells as originally studied, and a
smaller number of latent genes than in the original dataset, while
retaining most of its variance (20). The produced low-dimensional gene
expression matrix is commonly used as input to visualisation
algorithms or for additional analyses.
Visualisation methods in lower
dimensions
To visualise high-dimensional data in a
comprehensible form, data first need to undergo dimensionality
reduction and then, to be mapped into two dimensions if a plot is
drawn (20). Alternatively, if
3D-visualisation software is used, data need to be mapped into
three dimensions. For scRNA-Seq data, there are two major methods
for dimensionality reduction into two or three dimensions, and
subsequent visualisation: t-distributed stochastic neighbour
embedding (t-SNE) and uniform manifold approximation and projection
(UMAP). t-SNE (14) was created as
an improvement to the SNE method (27), which uses a Gaussian distribution
to determine the similarity of the low-dimensional points and
determines the low-dimensional representation through a loss
function. t-SNE uses a Student-t distribution and an improved loss
function, ultimately offering better spread of the data points and
faster run time, respectively. UMAP (28) constructs a k-neighbour weighted
graph and subsequently computes a lower-dimension layout of it.
UMAP is more recent and was developed as an alternative to t-SNE,
having an even lower execution time, while claiming to preserve the
global structure of the data; i.e., the overall arrangement of the
clusters, better.
t-SNE and UMAP, as non-linear methods, are commonly
used in scRNA-Seq analysis pipelines to perform visualisation of
the cells, being able to capture the non-linear relationships of
the data. Cells (as data points) with similar expression patterns
are grouped closer to each other in the three-dimensional space.
Subsequently, by colour-coding each cell using given annotations,
e.g., cell-type, tissue, etc., it is possible to define novel cell
sub-populations with distinct expression patterns, through visual
exploration (29). In a similar
manner, genes may also be visualised. In this case, the users are
able to discover groups of co-expressed genes with similar
expression patterns (30),
although thorough gene annotations are necessary to define the
biologically-connected gene clusters.
Both t-SNE and UMAP are able to preserve the global,
as well as the local structure of data, using proper data
initialisation, PCA being one of the options for this step
(31), while also having similar
execution times with parameter tuning. Thus, it is recommended to
perform a different dimensionality reduction approach as a
pre-processing step prior to trying out both methods, when
visualising scRNA-Seq data, and determining which plot better
depicts the organisation of the cell clusters.
PCA, t-SNE and UMAP are already established
techniques and integral parts in the pre-processing and
visualisation of scRNA-Seq data (29) and are also included in major
processing pipelines and software, such as SEURAT (32) and Cell Ranger (10). Thus, these methods are used in the
majority of scientific studies that include scRNA-Seq data
analysis. Nevertheless, the increasing diversity and dimensionality
of scRNA-Seq data necessitated the usage of more advanced
techniques for their efficient analysis.
4. Deep learning-based dimensionality
reduction methods
Autoencoders
The advancement of neural networks using multiple
hidden layers, coupled with increased computing power, has led to
the evolution of machine learning to deep learning (33). The ability of deep learning-based
methods to be trained and learn the distribution of the input data
was proven valuable for the construction of tools that deal with
the high-dimensionality and sparsity of scRNA-Seq data. One such
tool is scvis (34), an
autoencoder-based method for the dimensionality reduction and
subsequent visualisation of scRNA-Seq data. Autoencoders are an
archetypal deep-learning technique consisting of two neural
networks with hidden layers: One encoder network and one decoder
network. Autoencoders are trained to learn compressed
representations of input data (35). At first glance, scvis is similar in
functionality to t-SNE and UMAP, as it is mainly used for the
visualisation of cells and detection of new cell subtypes. However,
scvis can detect both linear and non-linear associations in the
data and has been shown to possess improved performance, achieving
similar or better grouping of data points, while also scaling
better with larger datasets (34).
Nevertheless, data initialisation is equally necessary in the case
of scvis, to preserve both global and local alignment of the
original data.
Another autoencoder-based technique is deep count
autoencoder (DCA) (36). As
opposed to scvis, DCA is used for the denoising of scRNA-Seq data,
which refers to the efficient imputation of data, while also aiming
to improve the expression estimation of all gene counts (37). DCA exhibits better performance
compared to commonly used imputation techniques, such as SAVER
(38) and scImpute (39), showcasing the application of
autoencoders for performing simultaneous dimensionality reduction
and imputation. The rapid advancement of deep learning has enabled
further improvements in neural networks, in the form of variational
autoencoders (VAEs) and generative adversarial networks (GANs),
which have skyrocketed in popularity.
VAEs
VAEs (40)
represent a paradigm shift in the field of deep learning,
particularly in their application to complex, high-dimensional
datasets. At their core, VAEs are an advancement of traditional
autoencoders (35), although VAEs
diverge significantly by incorporating a probabilistic framework.
This framework involves the encoder network mapping input data not
to a deterministic point, but to a probability distribution within
a latent space. Consequently, the decoder network reconstructs the
input data by sampling from this latent distribution. This
probabilistic approach is underpinned by the principles of
variational inference, enabling the approximation of complex data
distributions. The incorporation of stochasticity in the encoding
process allows VAEs to generate new data samples by sampling from
the learned latent space distribution.
VAEs have been proven as an effective tool for
reducing scRNA-Seq data dimensionality, while retaining the
biological properties of the original dataset (41). VAEs not only compress gene
expression data into a more manageable latent space, considering
that such datasets can contain data of >100,000 cells, but they
also capture the biological variance across cells, while mitigating
the impact of the inherent noise and sparsity of scRNA-Seq data
(42). The sampling of the
probabilistic latent space in VAEs yields different datasets each
time, yet properly trained models tend to produce results that
exhibit minimal variance among them (40). Furthermore, utilising non-linear
transformations for producing a low-dimensional latent space
through the training on non-linear mappings of high-dimensional
data could improve data clustering (43). Thus, the low-dimensional gene
expression generated by trained VAEs, can facilitate downstream
analyses (44), such as cell
clustering, gene co-expression or regulatory network inference or
protein-protein association network construction. Such applications
of VAEs have been developed, including DiffVAE (45) for modelling cell differentiation,
BEENE (46) for improved batch
correction, β-TCVAE (47), which
was used for data integration in single-cell GTEx (48) and FAVA (49) for the inference of high-quality
protein-protein association networks. The newest version of STRING,
used FAVA for the computation of the co-expression scores, as the
results of this method outperformed their previous ones, since they
were able to capture both linear and non-linear associations of the
scRNA-Seq data (50).
GANs
GANs (51) are a
class of deep learning algorithms that have garnered significant
attention for their ability to generate high-quality, synthetic
data samples. A GAN consists of two neural networks, the generator
and the discriminator, engaged in a continuous adversarial process.
The generator attempts to produce data samples indistinguishable
from real data, while the discriminator strives to differentiate
between the generator's synthetic data and actual data. This
adversarial training encourages the generator to produce
increasingly realistic samples, adjusting its parameters to produce
data that better model the complex distribution of the input
data.
In the context of the analysis of scRNA-Seq data,
GANs are particularly valuable as they can learn to capture and
reproduce the intricate structures and patterns inherent in such
data. Instead of performing dimensionality reduction in a direct
way, i.e., by performing feature extraction on the genes or
samples, GANs generate new datasets of a desired number of
dimensions, thus indirectly reducing the dimensionality of the
original dataset. GANs can be employed to learn the complex
distribution of scRNA-Seq data, and once trained, GANs may generate
synthetic, yet biologically plausible, single-cell gene expression
profiles (52). These ‘fabricated’
datasets can be used to augment the original dataset as input to
other algorithms, in the cases where data scarcity prevents the
easy procurement of training datasets and be utilised in place of a
high-dimensional dataset, while providing a similar amount of
biological information or by imitating data derived from specific
biological conditions (53). GANs
outperform the usual methods for synthetic scRNA-Seq dataset
generation, when their output is used to construct gene regulatory
networks, as GANs can more efficiently generate realistic datasets
and thus allowing downstream network creation algorithms that
perform well on synthetic datasets to generalise well on real data
(54). Applications of GANs in
scRNA-Seq data include cscGAN (55) and LSH-GAN (56), used for dataset generation. Certain
methods, such as AGImpute (57),
combine both autoencoders and GANs in their approach, in this case,
to perform cell-type aware imputation of scRNA-Seq data.
5. Comparison between dimensionality
reduction methods
Even though a variety of options for dimensionality
reduction of scRNA-Seq data were described, each one has specific
use-cases, as well as certain advantages and disadvantages
(Table I).
 | Table IComparison of dimensionality
reduction techniques for scRNA-Seq data. |
Table I
Comparison of dimensionality
reduction techniques for scRNA-Seq data.
| Technique | Description | Rationale | Advantages | Disadvantages |
|---|
| PCA | Linear
transformation creating new variables (principal components) to
retain most variance in the data | Reduces the
dimensions of scRNA-Seq data while retaining meaningful
variance | • Retains most
variability • Simple and widely used • Fast execution | • Limited to linear
associations • Sensitive to noise in data |
| t-SNE | Non-linear method
using Student-t distribution to visualise data in 2D/3D by
capturing relationships among data points | Maps scRNA-Seq data
into a comprehensible visual format | • Captures
non-linear relationships • Effective for visualising clusters | • May be
computationally expensive with large datasets • Can fail to
preserve global structure without data initialisation |
| UMAP | Non-linear methods
that constructs a graph of data points and optimises a
low-dimensional representation | Alternative to
t-SNE, focusing on speed and better global structure
representation | • Faster than t-SNE
• Better global structure retention • Flexible parameter
tuning | • Requires careful
tuning • Interpretation may vary with parameters |
| scvis | Deep learning model
using autoencoders for data visualisation | Deep-learning
alternative to t-SNE and UMAP | • Handles both
linear and non-linear relationships • Scales well to large
datasets | • Requires
substantial computational resources • Performance depends on
architecture and training |
| DCA | Application of
autoencoders which focuses on denoising scRNA-Seq data | Reduces noise and
imputes scRNA-Seq data | • Improves data
quality by denoising • Better imputation performance than
traditional methods | • Relies heavily on
initial parameter selection • Computationally intensive for very
large datasets |
| VAEs | Probabilistic
version of autoencoders that maps data to distributions in a latent
space and reconstructs data by sampling from these
distributions | Generates a
low-dimensional dataset that retains the biological information of
input scRNA-Seq | • Captures both
linear and non-linear patterns • Effective for downstream
analyses | • Requires
expertise in probabilistic modelling • Models can be complex to
train effectively |
| GANs | Two neural networks
(generator and discriminator) adversarially trained to create
realistic synthetic data | Generates
biologically plausible data by learning input scRNA-Seq data
distributions | • Generates
realistic synthetic datasets • Useful for data augmentation •
Handles complex distributions effectively | • Training is
challenging and requires significant computational resources • High
risk of generating artefacts or overfitting discriminator |
Dimensionality reduction techniques such as PCA,
t-SNE and UMAP have been established in the scientific community,
being integral scRNA-Seq analysis steps, thanks to their fast
execution times owing to their comparatively low need for
computational resources, particularly in the case of PCA. However,
in recent years, their application has been limited to either being
used for data pre-processing (PCA) or visualisation of cells (t-SNA
and UMAP). Furthermore, t-SNE and UMAP have been shown to require a
lot of computational resources with larger input data, while also
requiring data initialisation and proper parameter tuning to
produce similar plots (31,58).
In comparison, deep learning-based dimensionality
reduction techniques have recently been in the centre of attention,
owing mostly to their ability to be trained on the input dataset,
made more accessible through the development of deep learning
packages such as Keras (59) and
TensorFlow (60). Deep-learning
techniques are valued for their ability to capture both linear and
non-linear relationships of the input data, compared to PCA, which
is a linear method, and t-SNE/UMAP which are non-linear methods.
However, deep-learning methods require much more computational
resources than their statistical or machine learning counterparts,
often relying on multiple graphical processing units for optimal
execution (61), which renders
them less friendly to the average user. Furthermore, advanced
knowledge of deep-learning is necessary for the construction of
optimised VAEs and GANs, including the integration of the best
training and validation sets. If these networks are not trained
properly, e.g., having a small validation dataset or unbalanced
input data, they may overfit and, thus, not produce impartial data
(62). Thus, ample research and
evaluation are still necessary by the scientific community to
integrate these techniques into popular data analysis
pipelines.
6. Conclusions and future perspectives
The advent of scRNA-Seq has enabled the study of
gene expression with unprecedented definition and cell-specificity.
However, the high-sparsity and high-dimensionality of scRNA-Seq
data requires the use of strategies in order to bring them to a
comprehensible state and extract meaningful biological information.
Dimensionality reduction techniques, such as PCA, t-SNE and UMAP
help in the visualisation of such data, being indispensable tools
in their visual examination. More advanced techniques such as VAEs
and GANs bring the data to lower dimensions, while retaining the
original biological information. This facilitates their usage for
downstream analyses, e.g. identification of co-expressed genes or
cell subtypes, as well as their role in creating synthetic
scRNA-Seq datasets, to be used for the training or evaluation of
more complex algorithms. The overall volume of scRNA-Seq datasets,
in conjunction with readily available software packages which
implement such methods, has allowed for the massive influx of
research articles based on scRNA-Seq analyses, in the recent years.
The future advancement of deep learning will further improve the
speed and fidelity of the analyses based on dimensionality
reduction.
Acknowledgements
The authors are indebted to Professor Nikolaos
Drakoulis (Department of Pharmacy, School of Health Sciences,
National and Kapodistrian University of Athens, Athens, Greece) for
inviting them to present this work at the 4th International
Congress on Pharmacogenomics and Personalized Diagnosis and
Therapy.
Funding
Funding: No funding was received.
Availability of data and materials
Not applicable.
Authors' contributions
VLZ performed literature review, wrote the original
draft of the manuscript, and wrote, reviewed and edited the
manuscript. IT, DAS and VAI wrote, reviewed and edited the
manuscript. IM conceptualized and supervised the study, was
involved in the writing of the original draft of the manuscript,
and also wrote, reviewed and edited the final manuscript. All
authors have read and approved the final version of the manuscript.
Data authentication is not applicable.
Ethics approval and consent to
participate
Not applicable.
Patient consent for publication
Not applicable.
Competing interests
DAS is the Managing Editor of the journal, but had
no personal involvement in the reviewing process, or any influence
in terms of adjudicating on the final decision, for this
article.
References
|
1
|
Wang Z, Gerstein M and Snyder M: RNA-Seq:
A revolutionary tool for transcriptomics. Nat Rev Genet. 10:57–63.
2009.PubMed/NCBI View
Article : Google Scholar
|
|
2
|
Schena M, Shalon D, Davis RW and Brown PO:
Quantitative monitoring of gene expression patterns with a
complementary DNA microarray. Science. 270:467–470. 1995.PubMed/NCBI View Article : Google Scholar
|
|
3
|
Tang F, Barbacioru C, Wang Y, Nordman E,
Lee C, Xu N, Wang X, Bodeau J, Tuch BB, Siddiqui A, et al: mRNA-Seq
whole-transcriptome analysis of a single cell. Nat Methods.
6:377–382. 2009.PubMed/NCBI View Article : Google Scholar
|
|
4
|
Haque A, Engel J, Teichmann SA and
Lonnberg T: A practical guide to single-cell RNA-sequencing for
biomedical research and clinical applications. Genome Med.
9(75)2017.PubMed/NCBI View Article : Google Scholar
|
|
5
|
Cock PJ, Fields CJ, Goto N, Heuer ML and
Rice PM: The Sanger FASTQ file format for sequences with quality
scores, and the Solexa/Illumina FASTQ variants. Nucleic Acids Res.
38:1767–1771. 2010.PubMed/NCBI View Article : Google Scholar
|
|
6
|
Kivioja T, Vaharautio A, Karlsson K, Bonke
M, Enge M, Linnarsson S and Taipale J: Counting absolute numbers of
molecules using unique molecular identifiers. Nat Methods. 9:72–74.
2011.PubMed/NCBI View Article : Google Scholar
|
|
7
|
Satija R, Farrell JA, Gennert D, Schier AF
and Regev A: Spatial reconstruction of single-cell gene expression
data. Nat Biotechnol. 33:495–502. 2015.PubMed/NCBI View
Article : Google Scholar
|
|
8
|
Zogopoulos VL, Saxami G, Malatras A,
Papadopoulos K, Tsotra I, Iconomidou VA and Michalopoulos I:
Approaches in gene coexpression analysis in eukaryotes. Biology
(Basel). 11(1019)2022.PubMed/NCBI View Article : Google Scholar
|
|
9
|
Ilicic T, Kim JK, Kolodziejczyk AA, Bagger
FO, McCarthy DJ, Marioni JC and Teichmann SA: Classification of low
quality cells from single-cell RNA-seq data. Genome Biol.
17(29)2016.PubMed/NCBI View Article : Google Scholar
|
|
10
|
Zheng GX, Terry JM, Belgrader P, Ryvkin P,
Bent ZW, Wilson R, Ziraldo SB, Wheeler TD, McDermott GP, Zhu J, et
al: Massively parallel digital transcriptional profiling of single
cells. Nat Commun. 8(14049)2017.PubMed/NCBI View Article : Google Scholar
|
|
11
|
Wu Y and Zhang K: Tools for the analysis
of high-dimensional single-cell RNA sequencing data. Nat Rev
Nephrol. 16:408–421. 2020.PubMed/NCBI View Article : Google Scholar
|
|
12
|
Qiu P: Embracing the dropouts in
single-cell RNA-seq analysis. Nat Commun. 11(1169)2020.PubMed/NCBI View Article : Google Scholar
|
|
13
|
Imoto Y, Nakamura T, Escolar EG, Yoshiwaki
M, Kojima Y, Yabuta Y, Katou Y, Yamamoto T, Hiraoka Y and Saitou M:
Resolution of the curse of dimensionality in single-cell RNA
sequencing data analysis. Life Sci Alliance.
5(e202201591)2022.PubMed/NCBI View Article : Google Scholar
|
|
14
|
Van der Maaten L and Hinton G: Visualizing
data using t-SNE. J Mach Learn Res. 9:2008.
|
|
15
|
Nanga S, Bawah AT, Acquaye BA, Billa MI,
Baeta FD, Odai NA, Obeng SK and Nsiah AD: Review of dimension
reduction methods. J Data Anal Inform Process. 09:189–231.
2021.
|
|
16
|
Sarker IH: Machine learning: Algorithms,
Real-world applications and research directions. SN Comput Sci.
2(160)2021.PubMed/NCBI View Article : Google Scholar
|
|
17
|
Alpaydin E: Introduction to Machine
Learning. MIT Press, Cambridge, Massachusetts, London, England,
2020.
|
|
18
|
Okada H, Chung UI and Hojo H: Practical
compass of Single-cell RNA-Seq Analysis. Curr Osteoporos Rep.
22:433–440. 2024.PubMed/NCBI View Article : Google Scholar
|
|
19
|
Arora JK, Opasawatchai A, Poonpanichakul
T, Jiravejchakul N, Sungnak W, Thailand D, Matangkasombut O,
Teichmann SA, Matangkasombut P and Charoensawan V: Single-cell
temporal analysis of natural dengue infection reveals skin-homing
lymphocyte expansion one day before defervescence. iScience.
25(104034)2022.PubMed/NCBI View Article : Google Scholar
|
|
20
|
Linderman GC: Dimensionality reduction of
Single-cell RNA-Seq data. Methods Mol Biol. 2284:331–342.
2021.PubMed/NCBI View Article : Google Scholar
|
|
21
|
Pearson K: LIII. On lines and planes of
closest fit to systems of points in space. Lond Edinb Dubl Phil
Mag. 2:559–572. 1901.
|
|
22
|
Jolliffe IT: Principal Component Analysis.
Springer, New York, NY, 2002.
|
|
23
|
Jolliffe IT and Cadima J: Principal
component analysis: A review and recent developments. Philos Trans
A Math Phys Eng Sci. 374(20150202)2016.PubMed/NCBI View Article : Google Scholar
|
|
24
|
Thorndike RL: Who belongs in the family?
Psychometrika. 18:267–276. 1953.
|
|
25
|
Tsuyuzaki K, Sato H, Sato K and Nikaido I:
Benchmarking principal component analysis for large-scale
single-cell RNA-sequencing. Genome Biol. 21(9)2020.PubMed/NCBI View Article : Google Scholar
|
|
26
|
Ma S and Dai Y: Principal component
analysis based methods in bioinformatics studies. Brief Bioinform.
12:714–722. 2011.PubMed/NCBI View Article : Google Scholar
|
|
27
|
Hinton GE and Roweis S: Stochastic
Neighbor Embedding. In: Advances in Neural Information Processing
Systems. Becker S, Thrun S and Obermayer K (eds.) MIT Press,
Cambridge, MA, pp857-864, 2003.
|
|
28
|
McInnes L, Healy J and Melville J: Umap:
Uniform manifold approximation and projection for dimension
reduction arXiv: 1802.03426, 2018.
|
|
29
|
Slovin S, Carissimo A, Panariello F,
Grimaldi A, Bouche V, Gambardella G and Cacchiarelli D: Single-cell
RNA sequencing analysis: A Step-by-Step overview. Methods Mol Biol.
2284:343–365. 2021.PubMed/NCBI View Article : Google Scholar
|
|
30
|
Lachmann A, Torre D, Keenan AB, Jagodnik
KM, Lee HJ, Wang L, Silverstein MC and Ma'ayan A: Massive mining of
publicly available RNA-seq data from human and mouse. Nat Commun.
9(1366)2018.PubMed/NCBI View Article : Google Scholar
|
|
31
|
Kobak D and Linderman GC: Initialization
is critical for preserving global data structure in both t-SNE and
UMAP. Nat Biotechnol. 39:156–157. 2021.PubMed/NCBI View Article : Google Scholar
|
|
32
|
Hao Y, Stuart T, Kowalski MH, Choudhary S,
Hoffman P, Hartman A, Srivastava A, Molla G, Madad S,
Fernandez-Granda C and Satija R: Dictionary learning for
integrative, multimodal and scalable single-cell analysis. Nat
Biotechnol. 42:293–304. 2024.PubMed/NCBI View Article : Google Scholar
|
|
33
|
Goodfellow I, Bengio Y and Courville A:
Deep Learning. An MIT Press book. https://www.deeplearningbook.org/.
|
|
34
|
Ding J, Condon A and Shah SP:
Interpretable dimensionality reduction of single cell transcriptome
data with deep generative models. Nat Commun.
9(2002)2018.PubMed/NCBI View Article : Google Scholar
|
|
35
|
Kramer MA: Nonlinear principal component
analysis using autoassociative neural networks. AIChE J.
37:233–243. 1991.
|
|
36
|
Eraslan G, Simon LM, Mircea M, Mueller NS
and Theis FJ: Single-cell RNA-seq denoising using a deep count
autoencoder. Nat Commun. 10(390)2019.PubMed/NCBI View Article : Google Scholar
|
|
37
|
Agarwal D, Wang J and Zhang NR: Data
denoising and Post-denoising corrections in single cell RNA
sequencing. Statistical Science. 35:112–128. 2020.
|
|
38
|
Huang M, Wang J, Torre E, Dueck H, Shaffer
S, Bonasio R, Murray JI, Raj A, Li M and Zhang NR: SAVER: Gene
expression recovery for single-cell RNA sequencing. Nat Methods.
15:539–542. 2018.PubMed/NCBI View Article : Google Scholar
|
|
39
|
Li WV and Li JJ: An accurate and robust
imputation method scImpute for single-cell RNA-seq data. Nat
Commun. 9(997)2018.PubMed/NCBI View Article : Google Scholar
|
|
40
|
Kingma DP and Welling M: Auto-encoding
variational bayes. arXiv, 2013.
|
|
41
|
Gronbech CH, Vording MF, Timshel PN,
Sonderby CK, Pers TH and Winther O: scVAE: Variational
auto-encoders for single-cell gene expression data. Bioinformatics.
36:4415–4422. 2020.PubMed/NCBI View Article : Google Scholar
|
|
42
|
Pan W, Long F and Pan J: ScInfoVAE:
Interpretable dimensional reduction of single cell transcription
data with variational autoencoders and extended mutual information
regularization. BioData Min. 16(17)2023.PubMed/NCBI View Article : Google Scholar
|
|
43
|
Hinton GE and Salakhutdinov RR: Reducing
the dimensionality of data with neural networks. Science.
313:504–507. 2006.PubMed/NCBI View Article : Google Scholar
|
|
44
|
Erfanian N, Heydari AA, Feriz AM, Ianez P,
Derakhshani A, Ghasemigol M, Farahpour M, Razavi SM, Nasseri S,
Safarpour H and Sahebkar A: Deep learning applications in
single-cell genomics and transcriptomics data analysis. Biomed
Pharmacother. 165(115077)2023.PubMed/NCBI View Article : Google Scholar
|
|
45
|
Bica I, Andres-Terre H, Cvejic A and Lio
P: Unsupervised generative and graph representation learning for
modelling cell differentiation. Sci Rep. 10(9790)2020.PubMed/NCBI View Article : Google Scholar
|
|
46
|
Rahman MA, Tutul AA, Sharmin M and Bayzid
MS: BEENE: Deep learning-based nonlinear embedding improves batch
effect estimation. Bioinformatics. 39(btad479)2023.PubMed/NCBI View Article : Google Scholar
|
|
47
|
Chen RTQ, Li X, Grosse R and Duvenaud D:
Isolating sources of disentanglement in VAEs. In: Proceedings of
the 32nd International Conference on Neural Information Processing
Systems Curran Associates Inc., Montréal Canada, pp2615-2625,
2018.
|
|
48
|
Eraslan G, Drokhlyansky E, Anand S, Fiskin
E, Subramanian A, Slyper M, Wang J, Van Wittenberghe N, Rouhana JM,
Waldman J, et al: Single-nucleus cross-tissue molecular reference
maps toward understanding disease gene function. Science.
376(eabl4290)2022.PubMed/NCBI View Article : Google Scholar
|
|
49
|
Koutrouli M, Nastou K, Piera Lindez P,
Bouwmeester R, Rasmussen S, Martens L and Jensen LJ: FAVA:
High-quality functional association networks inferred from
scRNA-seq and proteomics data. Bioinformatics.
40(btae010)2024.PubMed/NCBI View Article : Google Scholar
|
|
50
|
Szklarczyk D, Kirsch R, Koutrouli M,
Nastou K, Mehryary F, Hachilif R, Gable AL, Fang T, Doncheva NT,
Pyysalo S, et al: The STRING database in 2023: Protein-protein
association networks and functional enrichment analyses for any
sequenced genome of interest. Nucleic Acids Res. 51:D638–D646.
2023.PubMed/NCBI View Article : Google Scholar
|
|
51
|
Goodfellow IJ, Pouget-Abadie J, Mirza M,
Xu B, Warde-Farley D, Ozair S, Courville A and Bengio Y: Generative
adversarial nets. In: Proceedings of the 27th International
Conference on Neural Information Processing Systems-Volume 2 MIT
Press, Montreal, Canada, pp2672-2680, 2014.
|
|
52
|
Lan L, You L, Zhang Z, Fan Z, Zhao W, Zeng
N, Chen Y and Zhou X: Generative Adversarial Networks and Its
Applications in Biomedical Informatics. Front Public Health.
8(164)2020.PubMed/NCBI View Article : Google Scholar
|
|
53
|
Lacan A, Sebag M and Hanczar B: GAN-based
data augmentation for transcriptomics: Survey and comparative
assessment. Bioinformatics. 39:i111–i120. 2023.PubMed/NCBI View Article : Google Scholar
|
|
54
|
Vinas R, Andres-Terre H, Lio P and Bryson
K: Adversarial generation of gene expression data. Bioinformatics.
38:730–737. 2022.PubMed/NCBI View Article : Google Scholar
|
|
55
|
Marouf M, Machart P, Bansal V, Kilian C,
Magruder DS, Krebs CF and Bonn S: Realistic in silico generation
and augmentation of single-cell RNA-seq data using generative
adversarial networks. Nat Commun. 11(166)2020.PubMed/NCBI View Article : Google Scholar
|
|
56
|
Lall S, Ray S and Bandyopadhyay S: LSH-GAN
enables in-silico generation of cells for small sample high
dimensional scRNA-seq data. Commun Biol. 5(577)2022.PubMed/NCBI View Article : Google Scholar
|
|
57
|
Zhu X, Meng S, Li G, Wang J and Peng X:
AGImpute: Imputation of scRNA-seq data based on a hybrid GAN with
dropouts identification. Bioinformatics. 40(btae068)2024.PubMed/NCBI View Article : Google Scholar
|
|
58
|
Chari T and Pachter L: The specious art of
single-cell genomics. PLoS Comput Biol. 19(e1011288)2023.PubMed/NCBI View Article : Google Scholar
|
|
59
|
Chollet F: Keras. https://github.com/fchollet/keras; https://keras.io.
|
|
60
|
Abadi M, Agarwal A, Barham P, Brevdo E,
Chen Z, Citro C, Corrado GS, Davis A, Dean J, Devin M, et al:
TensorFlow: Large-scale machine learning on heterogeneous
distributed Systems. Distributed Parallel Cluster Computing: 16
Mar, 2016.
|
|
61
|
Mittal S and Vaishay S: A survey of
techniques for optimizing deep learning on GPUs. J Systems
Architecture. 99(101635)2019.
|
|
62
|
Kim J and Park H: Limited discriminator
GAN using explainable AI model for overfitting problem. ICT
Express. 9:241–246. 2023.
|