Introduction
Hyperglycemia and hyperlipidemia, characterized by
elevated blood glucose (GLU) and lipid levels, are two of the most
common public health issues worldwide in modern society (1). Hyperglycemia is the main symptom of type
I and type II diabetes, and the incidence of diabetes has been
rapidly increasing in recent years worldwide. It has been estimated
that there was 382 million people with type II diabetes mellitus in
2013, while the prevalence of diabetes is estimated to increase by
55% in 2035, reaching a total number of 592 million (1). Dyslipidemia, which is defined by elevated
total cholesterol (CHO), triglyceride (TG) and/or low-density
lipoprotein cholesterol (LDL-C) levels, and non-optimal levels of
high-density lipoprotein cholesterol (HDL-C), is particularly
prevalent worldwide (2–4).
Persistent hyperglycemia and hyperlipidemia damages
the eyes, kidneys, feet and heart and causes a series of
cardiovascular diseases, such as stroke, coronary heart disease and
peripheral arterial disease (5–8). According
to an estimated 4 million mortalities each year, dyslipidemia is
considered to be a major modifiable risk factor for cardiovascular
disease worldwide (9). Therefore,
hyperglycemia and hyperlipidemia have presented a serious social
problem.
The examination of blood GLU and lipid levels is
routinely performed for early diagnosis of hyperglycemia and
hyperlipidemia. When compared with healthy weight individuals,
overweight individuals exhibit a greater risk for hyperglycemia,
hyperlipidemia, and other diseases, such as high blood pressure,
diabetes mellitus and coronary heart disease (10–12). Thus,
monitoring blood GLU and lipid levels is popular and necessary,
particularly in overweight individuals.
Blood routine examination also termed complete blood
count (CBC) is an analysis of three major types of cells: Red blood
cells (RBCs), white blood cells (WBCs) and platelets. It is a
common blood test used in clinical and routine health examinations,
which is beneficial for early diagnoses of serial diseases, such as
anemia and infections. Furthermore, there are benefits of
identifying the association between these indices, not only
experienced by overweight people, but also in healthy individuals
(13). However, there are critical
knowledge gaps on the correlation of blood GLU and lipid levels
with CBC test results. In the current study, the association
between these indices in healthy and overweight individuals was
investigated.
Materials and methods
Subjects and ethics
Individuals with a history of disease, such as
hematopathy, angiocardiopathy, hepatopathy, nephrosis or pulmonary
disease were not recruited for the present study. A total of 877
subjects were recruited between September and December 2015,
comprising 456 healthy subjects (147 male and 308 female) and 421
overweight subjects (305 male and 116 female), with mean ages of
39.70±10.89 and 45.74±11.19 years, respectively. Their heights and
weights were measured using a stadiometer and electronic weighing
scale, respectively. Body mass index (BMI) was then calculated as
follows: BMI=weight/height2 to divide the subjects into
the healthy (BMI=18–25.0 kg/m2) and overweight
(BMI=25.0–30 kg/m2) groups according to the criterion
recommended by the World Health Organization (14). The data (anonymous) for this study was
provided by the First Affiliated Hospital of Wenzhou Medical
University (Wenzhou, China). The study was approved by the hospital
ethics committee and conducted in accordance with the Declaration
of Helsinki. All participants provided informed consent for the
analysis of their clinical data.
Blood examination
To determine the blood GLU and lipid levels, a total
of 3 ml fasting venous blood was collected from the subjects into
separation gel tubes and separated at 3,466 × g for 10 min.
The plasma was analyzed in a Hitachi 705/717 biochemical instrument
(Hitachi, Ltd., Tokyo, Japan) at 20°C. The fasting blood GLU, TG,
CHO, HDL and LDL levels were then determined (Table I). To establish the CBC indices, 2 ml
venous blood was collected into heparinized tubes and determined
using a BC-5500 Automatic Blood Cell Analyzer (Mindray Bio-Medical
Electronics Co., Ltd., Shenzhen, China). A total of 18 CBC indices
were included in the current study; their detailed descriptions are
presented in Table I.
 | Table I.Characteristics and variance analysis
of blood glucose, lipid and CBC indices in healthy (n=456) and
overweight (n=421) subjects. |
Table I.
Characteristics and variance analysis
of blood glucose, lipid and CBC indices in healthy (n=456) and
overweight (n=421) subjects.
|
|
|
| Healthy | Overweight |
|
|---|
|
|
|
|
|
|
|
|---|
| Blood index | Abbreviation | Unit | Mean | SD | Mean | SD | P-value |
|---|
| Triglyceride | TG | mmol/l | 0.97 | 0.41 | 1.99 | 1.60 | 0.000 |
| Low-density
Lipoprotein | LDL | mmol/l | 2.48 | 0.57 | 2.88 | 0.70 | 0.000 |
| High-density
lipoprotein | HDL | mmol/l | 1.51 | 0.30 | 1.27 | 0.29 | 0.000 |
| Total
cholesterol | CHO | mmol/l | 4.48 | 0.66 | 4.96 | 0.88 | 0.000 |
| Glucose | GLU | mmol/l | 5.34 | 0.41 | 5.90 | 1.14 | 0.000 |
| Percentage of
monocyte | PMC | % | 0.07 | 0.02 | 0.07 | 0.02 | 0.573 |
| Absolute value of
monocyte | AVM |
x109/l | 0.42 | 0.14 | 0.49 | 0.17 | 0.000 |
| Red blood cell | RBC |
x1012/l | 4.66 | 0.47 | 4.98 | 0.47 | 0.000 |
| Hematocrit | HCT | l/l | 0.43 | 0.04 | 0.45 | 0.04 | 0.000 |
| Percentage of
leukomonocyte | PLC | % | 0.37 | 0.08 | 0.37 | 0.08 | 0.766 |
| Absolute value of
leukomonocyte | AVLC |
x109/l | 2.13 | 0.60 | 2.41 | 0.66 | 0.000 |
| Mean corpuscular
volume | MCV | fl | 91.61 | 5.81 | 91.42 | 5.62 | 0.248 |
| Mean corpuscular
hemoglobin | MCH | pg | 29.79 | 2.32 | 30.20 | 2.30 | 0.001 |
| Mean corpuscular
hemoglobin concentration | MCHC | g/l | 324.89 | 10.04 | 330.06 | 11.19 | 0.000 |
| Mean platelet
volume | MPL | fl | 10.83 | 1.80 | 10.93 | 1.57 | 0.394 |
| Absolute value of
eosinophils | AVE |
x109/l | 0.13 | 0.10 | 0.17 | 0.12 | 0.000 |
| Percentage of
eosinophils | PE | % | 0.02 | 0.02 | 0.02 | 0.02 | 0.023 |
| Hemoglobin | HB | g/l | 138.34 | 14.70 | 149.95 | 15.47 | 0.000 |
| Blood platelet | PLT |
x109/l | 221.56 | 48.89 | 224.31 | 51.35 | 0.748 |
| Thrombocytocrit | THR | l/l | 0.24 | 0.06 | 0.24 | 0.06 | 0.261 |
| Percentage of
neutrophils | PN | % | 0.53 | 0.08 | 0.54 | 0.08 | 0.969 |
| Absolute value of
neutrophils | AVN |
x109/l | 3.16 | 1.03 | 3.62 | 1.23 | 0.000 |
| Red blood cell
volume distribution width | RBCVD | % | 12.81 | 0.94 | 12.79 | 0.92 | 0.642 |
Statistical analysis
Prior to correlation analysis, the distribution
characteristics of the blood indices data were analyzed using the
Shapiro-Wilk and homogeneity of variances tests. The differences
between healthy and overweight subjects were analyzed by
nonparametric test when the indices were abnormally distributed,
and the correlations between TG, CHO HDL, LDL and GLU, and CBC
indices were analyzed by bivariate correlation.
When a correlation between blood GLU and lipid
levels and CBC indices was identified, multiple linear regression
(MLR) analysis was then conducted using a stepwise method. All CBC
indices were subjected to MLR analyses to identify the relationship
between TG, CHO and GLU. One-way ANOVA was used to analyze the
difference and P<0.05 was considered to indicate a statistically
significant difference. The correlation of the regression residual
was determined by the Durbin-Watson value. All statistical analyses
were conducted using SPSS software (version 17.0; SPSS, Inc.,
Chicago, IL, USA).
Results
Characteristics of healthy and
overweight individuals
A total of 456 healthy subjects (147 male and 308
female) and 421 overweight subjects (305 male and 116 female) were
included in the current study (mean age, 39.70±10.89 and
45.74±11.19 years, respectively). The BMIs were 19.66±5.59 and
26.39±1.92 for the healthy and overweight groups, respectively. As
the results of the Shapiro-Wilk test showed that the indices were
abnormally distributed in the two different groups, the blood GLU,
blood lipid and CBC indices data from the two groups were analyzed
using a nonparametric test. The variance analysis indicated that
there were significant differences between the healthy and
overweight subjects; the TG, CHO, HDL, LDL, GLU and the majority of
the CBC indices were altered. The level of TG, CHO, LDL, and GLU
increased (P<0.01), while the HDL level decreased (P<0.01) in
the overweight subjects (Table I).
Correlation analysis of glucose and
lipid levels in healthy and overweight subjects
The results indicated that TG, LDL and HDL were
strongly correlated with the CBC indices of the healthy subjects
(Table II). There were 9 indices of
CBC correlated with TG, 6 indices of CBC correlated with LDL, and
11 indices of CBC correlated with HDL. Compared with TG (the most
important index for hyperlipidemia), GLU and CHO only demonstrated
three and two relevant CBC indices, respectively.
| Table II.Correlation of TG, LDL, HDL, CHO and
GLU with CBC indices in 456 healthy subjects. |
Table II.
Correlation of TG, LDL, HDL, CHO and
GLU with CBC indices in 456 healthy subjects.
| CBC index | TG coefficient | P-value | GLU
coefficient | P-value | LDL
coefficient | P-value | HDL
coefficient | P-value | CHO
coefficient | P-value |
|---|
| Percentage of
monocyte | 0.012 | 0.802 | −0.039 | 0.401 | 0.000 | 0.988 | −0.040 | 0.393 | 0.000 | 0.998 |
| Absolute value of
monocyte | 0.173a | 0.000 | 0.043 | 0.356 | 0.046 | 0.326 | −0.219a | 0.000 | −0.019 | 0.688 |
| Red blood cell | 0.255a | 0.000 | 0.104b | 0.027 | 0.165a | 0.000 | −0.274a | 0.000 | 0.049 | 0.299 |
| Hematocrit | 0.288a | 0.000 | 0.096b | 0.041 | 0.180a | 0.000 | −0.294a | 0.000 | 0.078 | 0.098 |
| Percentage of
leukomonocyte | −0.011 | 0.822 | −0.042 | 0.366 | 0.026 | 0.576 | −0.019 | 0.682 | 0.010 | 0.824 |
| Absolute value of
leukomonocyte | 0.127a | 0.007 | 0.050 | 0.285 | 0.069 | 0.143 | −0.172a | 0.000 | 0.002 | 0.970 |
| Mean corpuscular
volume | 0.005 | 0.915 | −0.010 | 0.823 | −0.031 | 0.511 | −0.004 | 0.934 | 0.006 | 0.904 |
| Mean corpuscular
hemoglobin | 0.067 | 0.156 | −0.015 | 0.757 | 0.038 | 0.421 | −0.119b | 0.011 | 0.017 | 0.721 |
| Mean corpuscular
hemoglobin concentration | 0.130a | 0.005 | −0.003 | 0.956 | 0.137a | 0.003 | −0.240a | 0.000 | 0.024 | 0.609 |
| Mean platelet
volume | 0.020 | 0.672 | 0.006 | 0.904 | −0.028 | 0.554 | 0.013 | 0.784 | 0.009 | 0.856 |
| Absolute value of
eosinophils | 0.092 | 0.050 | 0.079 | 0.093 | 0.112b | 0.016 | −0.156a | 0.001 | 0.059 | 0.212 |
| Percentage of
eosinophils | 0.069 | 0.144 | 0.092b | 0.049 | 0.078 | 0.097 | −0.127a | 0.007 | 0.041 | 0.387 |
| Hemoglobin | 0.279a | 0.000 | 0.085 | 0.070 | 0.191a | 0.000 | −0.311a | 0.000 | 0.074 | 0.114 |
| Blood platelet | 0.103b | 0.028 | −0.001 | 0.979 | 0.095b | 0.044 | −0.010 | 0.835 | 0.085 | 0.071 |
|
Thrombocytocrit | 0.129a | 0.006 | 0.018 | 0.694 | 0.090 | 0.055 | 0.003 | 0.953 | 0.096b | 0.040 |
| Percentage of
neutrophils | 0.005 | 0.917 | 0.023 | 0.626 | −0.029 | 0.533 | 0.038 | 0.416 | −0.015 | 0.742 |
| Absolute value of
neutrophils | 0.136a | 0.004 | 0.090 | 0.054 | 0.037 | 0.431 | −0.131a | 0.005 | −0.009 | 0.848 |
| Red blood cell
volume distribution width | 0.030 | 0.525 | 0.068 | 0.149 | 0.089 | 0.058 | 0.164a | 0.000 | 0.158a | 0.001 |
This correlation almost did not change in the
overweight subjects (Table III).
There were 8 indices of CBC correlated with TG, 5 indices of CBC
correlated with LDL, and 11 indices of CBC correlated with HDL. In
addition, the relevant CBC indices in the overweight subjects were
almost the same as in the healthy subjects. These findings
indicated that the correlation of TG, HDL, LDL, CHO and GLU with
the CBC indices did not change according to weight.
| Table III.Correlation of TG, LDL, HDL, CHO, GLU
with CBC indices in 421 overweight subjects. |
Table III.
Correlation of TG, LDL, HDL, CHO, GLU
with CBC indices in 421 overweight subjects.
| CBC index | TG coefficient | P-value | GLU
coefficient | P-value | LDL
coefficient | P-value | HDL
coefficient | P-value | CHO
coefficient | P-value |
|---|
| Percentage of
monocyte | 0.021 | 0.670 | −0.014 | 0.773 | −0.043 | 0.375 | −0.054 | 0.271 | −0.029 | 0.547 |
| Absolute value of
monocyte | 0.147a | 0.003 | 0.105b | 0.031 | −0.018 | 0.717 | −0.150a | 0.002 | −0.029 | 0.550 |
| Redblood cell | 0.225a | 0.000 | −0.058 | 0.233 | 0.055 | 0.261 | −0.244a | 0.000 | −0.007 | 0.883 |
| Hematocrit | 0.247a | 0.000 | 0.008 | 0.876 | 0.110b | 0.024 | −0.202a | 0.000 | 0.061 | 0.212 |
| Percentage of
leukomonocyte | 0.020 | 0.688 | −0.060 | 0.217 | 0.153a | 0.002 | 0.053 | 0.275 | 0.154a | 0.001 |
| Absolute value of
leukomonocyte | 0.190a | 0.000 | 0.042 | 0.392 | 0.103b | 0.035 | −0.118b | 0.015 | 0.082 | 0.094 |
| Mean corpuscular
volume | 0.003 | 0.956 | 0.119b | 0.014 | 0.071 | 0.144 | 0.089 | 0.068 | 0.092 | 0.060 |
| Mean corpuscular
hemoglobin | 0.125b | 0.010 | 0.083 | 0.089 | 0.052 | 0.291 | −0.047 | 0.335 | 0.066 | 0.175 |
| Mean corpuscular
hemoglobin concentration | 0.205a | 0.000 | −0.041 | 0.403 | 0.015 | 0.761 | −0.208a | 0.000 | 0.011 | 0.818 |
| Mean platelet
volume | −0.003 | 0.954 | 0.027 | 0.583 | −0.031 | 0.521 | 0.011 | 0.829 | 0.005 | 0.925 |
| Absolute value of
eosinophils | 0.042 | 0.395 | 0.024 | 0.618 | −0.022 | 0.657 | −.100b | 0.040 | −0.049 | 0.318 |
| Percentage of
eosinophils | 0.001 | 0.991 | −0.059 | 0.224 | −0.030 | 0.539 | −0.074 | 0.127 | −0.050 | 0.309 |
| Hemoglobin | 0.270a | 0.000 | −0.012 | 0.804 | 0.087 | 0.075 | −0.224a | 0.000 | 0.050 | 0.310 |
| Blood platelet | 0.036 | 0.461 | 0.067 | 0.167 | 0.049 | 0.315 | 0.025 | 0.606 | 0.044 | 0.370 |
|
Thrombocytocrit | 0.034 | 0.487 | 0.065 | 0.183 | 0.043 | 0.373 | 0.021 | 0.666 | 0.052 | 0.285 |
| Percentage of
neutrophils | −0.013 | 0.796 | 0.079 | 0.107 | −0.144a | 0.003 | −0.026 | 0.598 | −0.138a | 0.005 |
| Absolute value of
neutrophils | 0.123b | 0.011 | 0.114b | 0.019 | −0.076 | 0.122 | −0.138a | 0.005 | −0.093 | 0.057 |
| Redblood cell
volume distribution width | −0.027 | 0.577 | 0.002 | 0.972 | 0.053 | 0.278 | 0.136a | 0.005 | 0.128a | 0.009 |
MLR analysis
According to the results of correlation analysis,
there was strong correlation of TG, LDL, HDL, CHO and GLU with the
CBC indices, and scatter diagrams demonstrated their linear
correlation, which indicated that MLR could be used in the study.
As there were various indices associated with each other, in order
to evaluate independent CBC indices correlated with TG, LDL, HDL,
CHO and GLU, MLR analysis was conducted using a stepwise
method.
Regression models were generated for TG, LDL, HDL
and CHO (Table IV), but not GLU,
where no regression model was generated in the healthy subjects
according to the stepwise method. The regression models of TG, LDL,
HDL, and CHO all demonstrated statistical significance in the two
groups (P<0.001). The regression models of healthy subjects
exhibited greater multiple correlation coefficient (R), determinate
coefficient (R2) and F values when compared with the
overweight subjects with regard to TG, LDL, HDL and CHO. These
results indicated that the regression models of the healthy
subjects were better than those for the overweight subjects.
| Table IV.Model summary of TG, LDL, HDL and CHO
in healthy (n=456) and overweight (n=421) subjects. |
Table IV.
Model summary of TG, LDL, HDL and CHO
in healthy (n=456) and overweight (n=421) subjects.
|
|
|
|
|
|
| ANOVA |
|---|
|
|
|
|
|
|
|
|
|---|
| Model | Index | R | R2 | Durbin-Watson | Predictors
(constant) | F-value | P-value |
|---|
| Healthy | TG | 0.319 | 0.102 | 0.19 | HCT, PLT | 25.708 | 0.000 |
|
| LDL | 0.249 | 0.062 | 1.93 | HB, RBCVD, THR | 9.93 | 0.000 |
|
| HDL | 0.351 | 0.123 | 1.57 | HB, MPL, AVM | 21.18 | 0.000 |
|
| CHO | 0.232 | 0.054 | 1.9 | THR, RBCVD,
MCH | 8.55 | 0.000 |
| Overweight | TG | 0.189 | 0.036 | 1.93 | HB | 15.53 | 0.000 |
|
| LDL | 0.189 | 0.036 | 2.07 | PLC, HCT | 7.78 | 0.000 |
|
| HDL | 0.308 | 0.095 | 1.93 | RBC, RBCVD,
AVM | 14.62 | 0.000 |
|
| CHO | 0.150 | 0.022 | 2.03 | PLC | 9.59 | 0.002 |
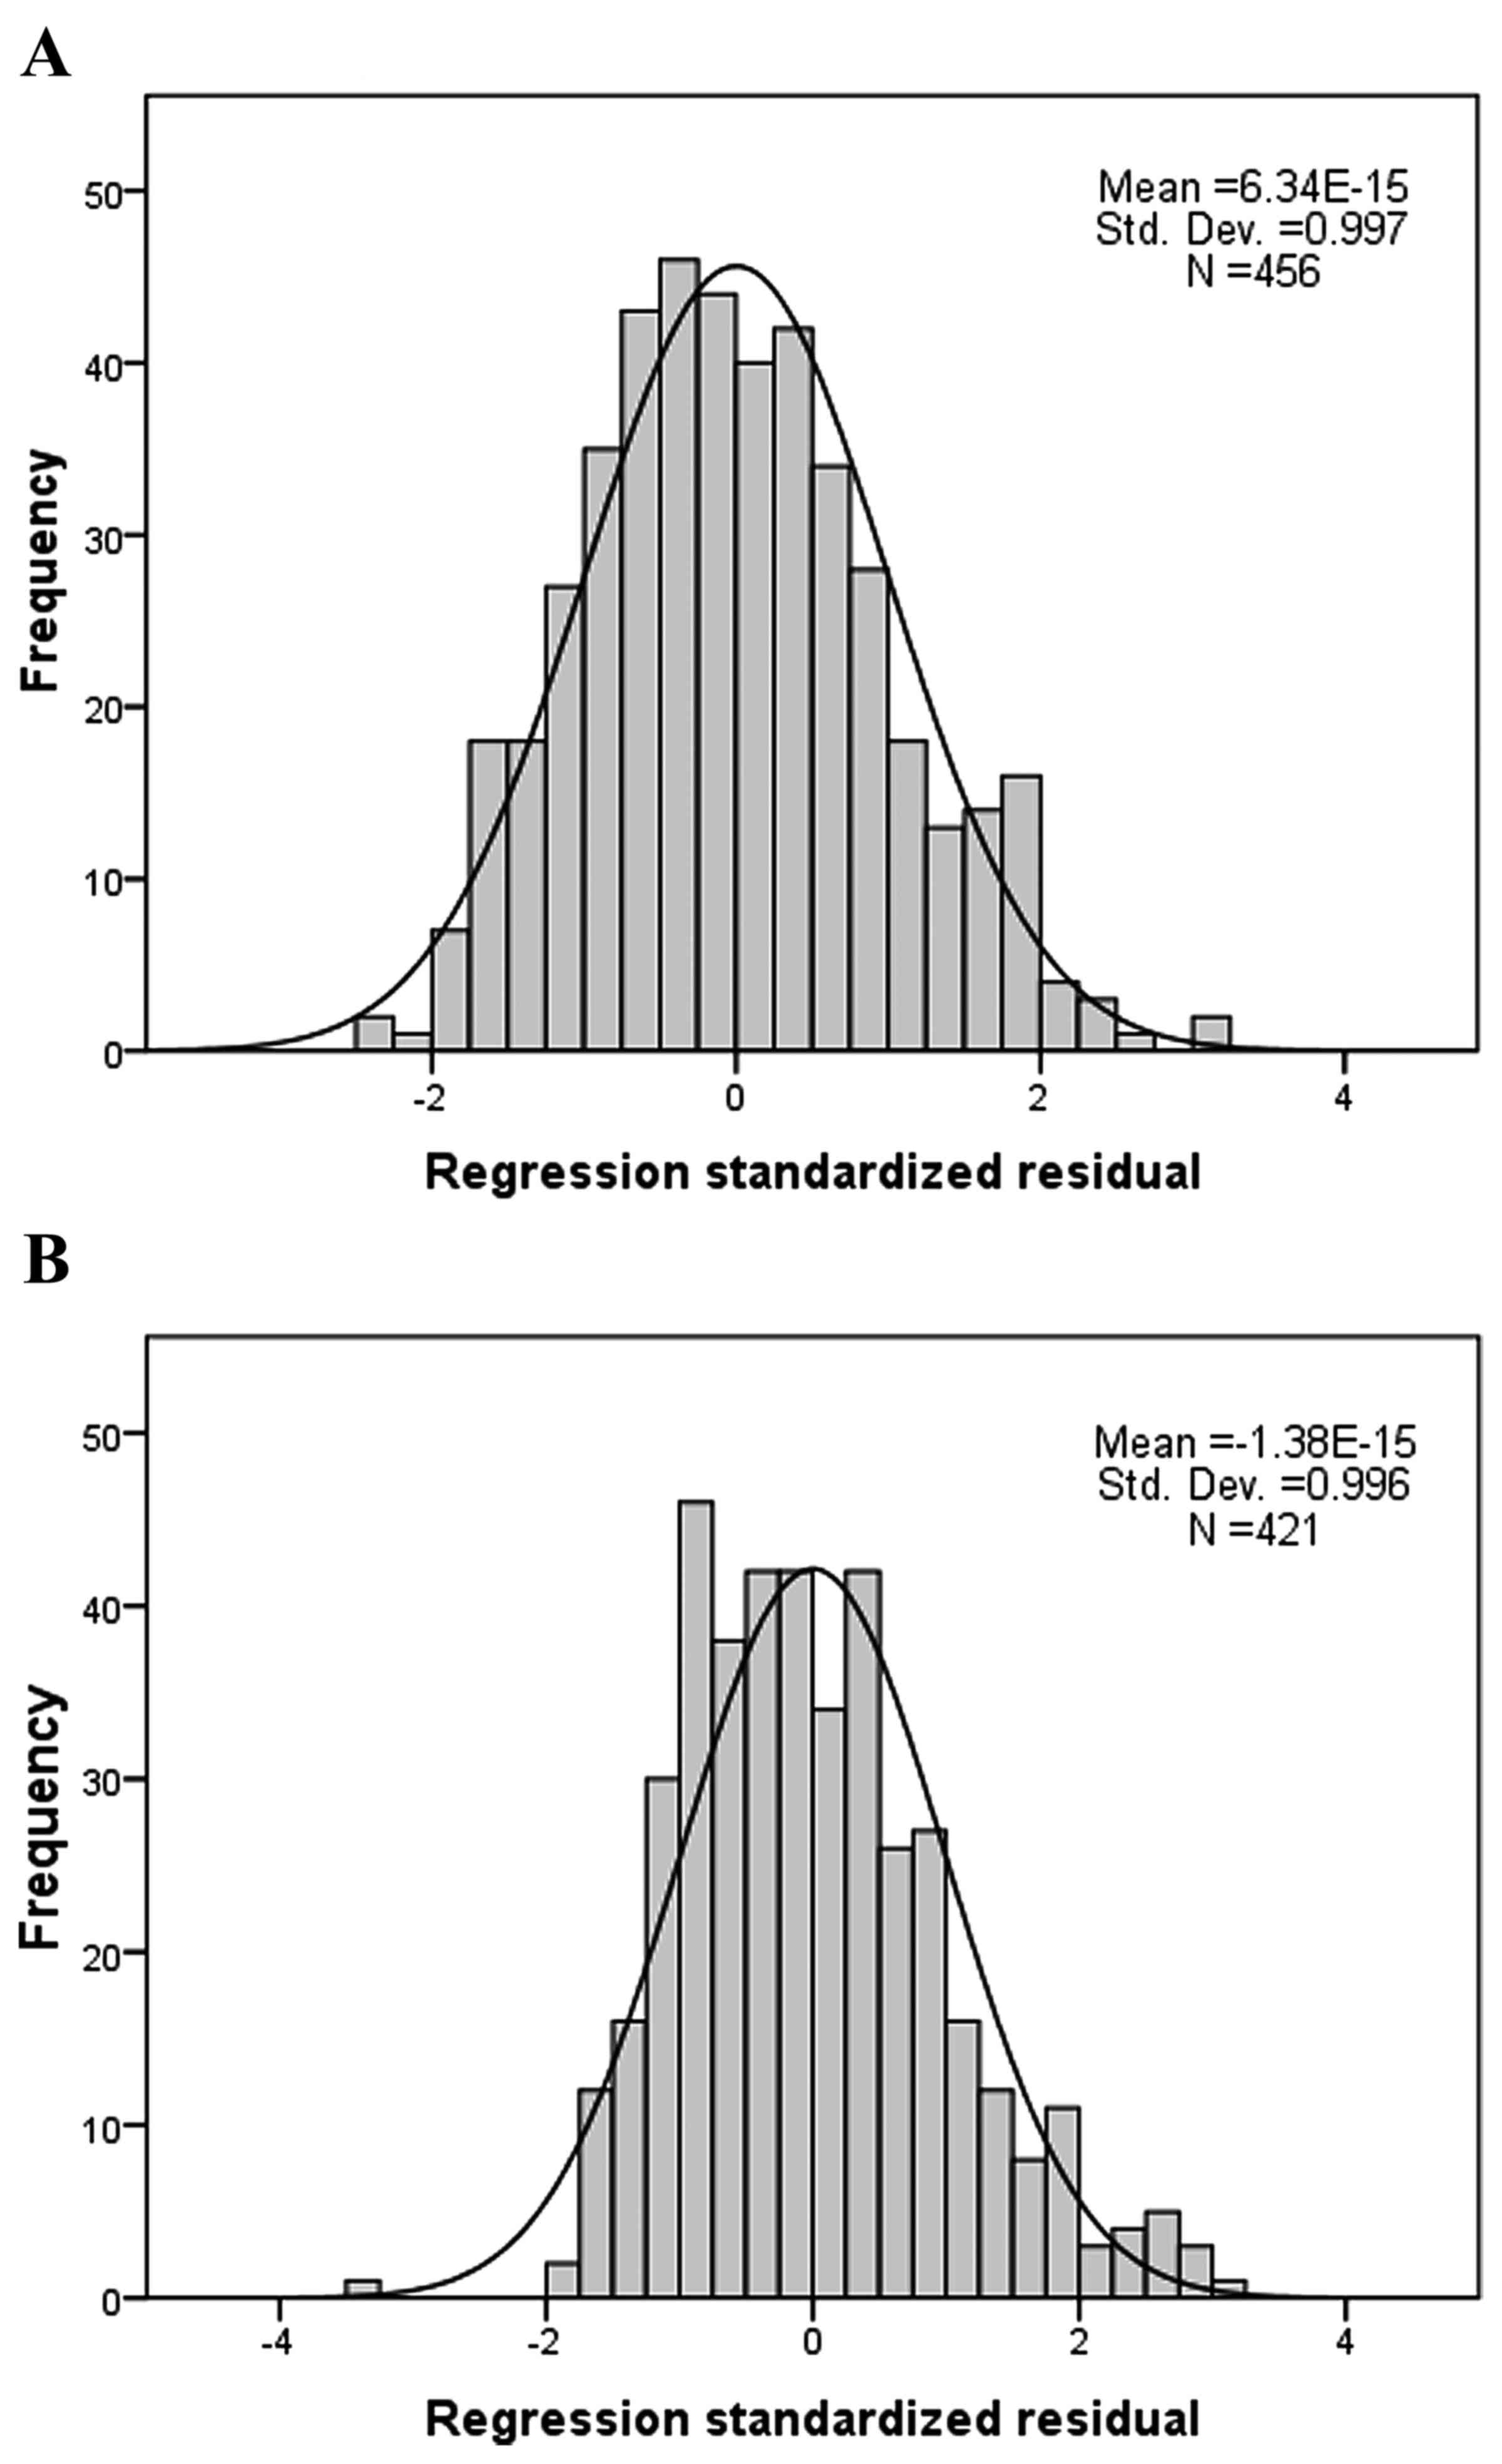
In these four types of regression model, the
multiple Rs of the HDL regression model were 0.351 and 0.308 in the
healthy and overweight subjects, respectively, which were greater
than those of the TG, LDL and CHO regression models. In addition,
the R2 and F values of HDL regression model were higher
than TG, LDL and CHO regression models, and the regression
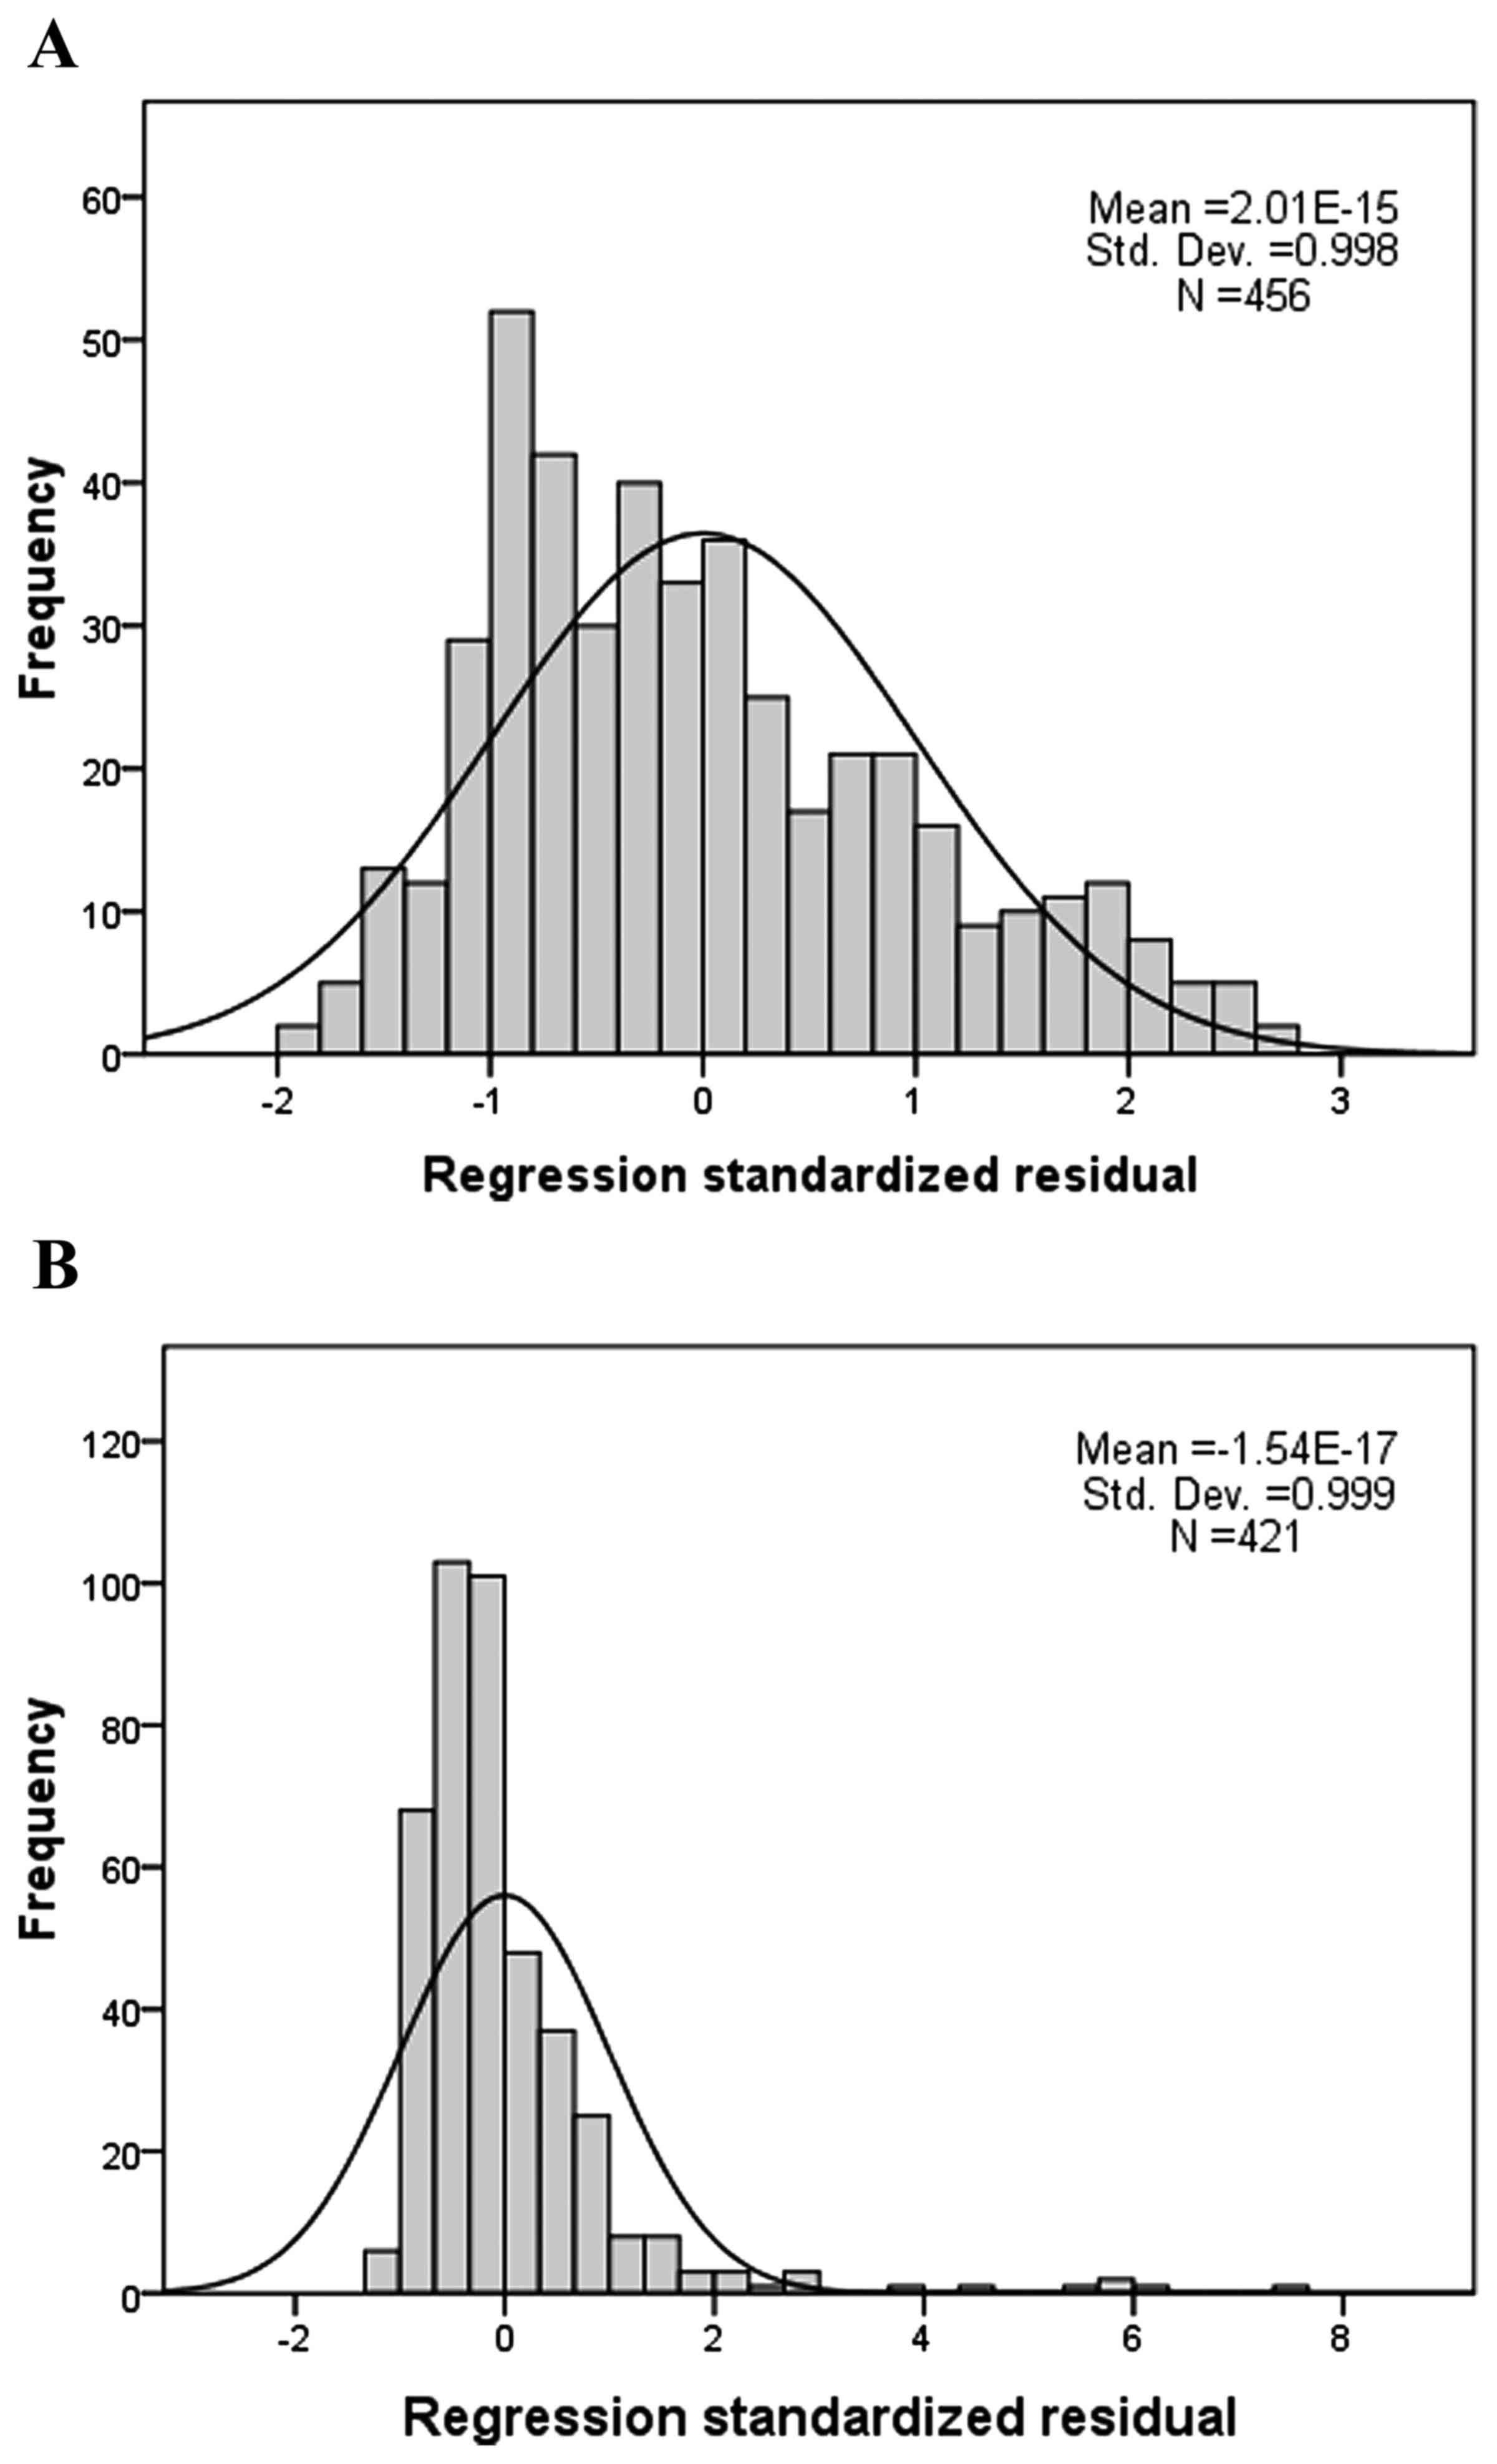
standardized residual demonstrated a normal distribution (Fig. 1). However, the R of TG was 0.319 in the
healthy subjects, and was decreased to 0.189 in the overweight
subjects, and the regression standardized residual was similar to a
skewed normal distribution (Fig. 2).
Therefore, HDL was identified as the most suitable index for linear
regression when CBC indices were selected as independent
variables.
Discussion
CBC is the most ubiquitous diagnostic parameter in
the clinical setting, and is routinely analyzed to evaluate the
health of patients (15). Generally,
the CBC test provides important information regarding three major
types of cells in the blood, RBCs, WBCs and platelets. Other
indices, such as absolute value of monocyte, hematocrit, absolute
value of leukomonocyte, mean corpuscular hemoglobin concentration,
hemoglobin, PLC and thrombocytocrit, are all obtained from these
three types of cell. These measurements are usually performed to
test for blood disease, infection and many other disorders, which
are associated with RBCs, WBCs and platelets. For example,
inflammation, leukemia, bone marrow failure and immunodeficiency
are diagnosed by irregular WBC counts and their differentials
(16).
In the current study, the association of CBC with
blood GLU and lipid levels in overweight and healthy subjects was
analyzed. In addition, the correlation of CBC indices with TG, LDL,
HDL, CHO and GLU was analyzed (Tables
II and III). However, a
limitation regarding the CBC indices is that there were may be
multiple co-linear associations between these CBC indices.
For further analysis, MLR was used to evaluate the
correlation of TG, LDL, HDL, CHO and GLU with CBC indices. MLR
models the association between two or more explanatory variables
and a response variable by fitting a linear equation (17). This differs from an artificial
intelligence algorithm, which commonly requires complicated
programming (18). MLR more easily
provides regression models, which are linearly associated with
their parameters.
The model summary (Table
IV) demonstrated that the strongest correlation with the CBC
indices was HDL, followed by TG, LDL, CHO and GLU, which was
consistent with the results of the correlation analysis. However,
almost the same associated CBC indices were identified between TG
and HDL (Tables II and III). The multiple R and R2 were
decreased markedly (Table IV). In
addition, the regression standardized residual was not normally
distributed in TG, which indicates that TG is influenced by
increasing weight, whereas HDL is not. Therefore, HDL is the most
stable and correlated index within the CBC indices. According to
the results of the present study, this prediction model may be
developed in further studies, such as back-propagation artificial
neural network (19) and extreme
learning machine (10) models, and
support vector machine (20) to
improved predictive capabilities.
In conclusion, significant differences in GLU, lipid
and CBC indices were observed between healthy and overweight
subjects. The correlation and MLR analyses indicated that there
were strong correlations between TG, LDL, HDL and CHO, but not GLU,
for which no linear regression model was generated. Among these
indices, HDL was identified as the index that was most strongly
correlated with the CBC indices. Thus, the CBC test is considered
to be helpful in the diagnosis of hyperlipidemia.
Acknowledgements
The present study was supported by the National
Science and Technology Major Project (grant no. 2012ZX10002004) and
the Chinese High Tech Research & Development (863) Program
(grant no. 2013AA020102).
References
|
1
|
Guariguata L, Whiting DR, Hambleton I,
Beagley J, Linnenkamp U and Shaw JE: Global estimates of diabetes
prevalence for 2013 and projections for 2035. Diabetes Res Clin
Pract. 103:137–149. 2014. View Article : Google Scholar : PubMed/NCBI
|
|
2
|
Khine AA and Marais DA: High prevalence of
primary dyslipidaemia in black South African patients at a tertiary
hospital in northern Gauteng, South Africa. S Afr Med J.
106:724–729. 2016. View Article : Google Scholar : PubMed/NCBI
|
|
3
|
Jameson K, Amber V, D'Oca K, Mills D,
Giles A and Ambegaonkar B: Impact of lipid-lowering therapy on the
prevalence of dyslipidaemia in patients at high-risk of
cardiovascular events in UK primary care - a retrospective database
study. Int J Clin Pract. 67:1228–1237. 2013. View Article : Google Scholar : PubMed/NCBI
|
|
4
|
Tran HA, Chua Y and Petrovsky N: Test and
teach. Number Fifty-three. Diagnosis: Diabetes-related
dyslipidaemia. Pathology. 36:576–579. 2004. View Article : Google Scholar : PubMed/NCBI
|
|
5
|
Agoşton-Coldea L, Zdrenghea D, Pop D,
Crăciun A, Rusu ML and Mocan T: Prevalence and particularities of
dyslipidaemia in subjects with coronary heart disease. Rom J Intern
Med. 45:341–347. 2007.PubMed/NCBI
|
|
6
|
Zhang L, Qiao Q, Laatikainen T, Söderberg
S, Jousilahti P, Onat A, Nilsson P and Tuomilehto J: DECODE Study
Group: The impact of dyslipidaemia on incidence of coronary heart
disease in Finns and Swedes with different categories of glucose
tolerance. Diabetes Res Clin Pract. 91:406–412. 2011. View Article : Google Scholar : PubMed/NCBI
|
|
7
|
Fiorentino TV, Prioletta A, Zuo P and
Folli F: Hyperglycemia-induced oxidative stress and its role in
diabetes mellitus related cardiovascular diseases. Curr Pharm Des.
19:5695–5703. 2013. View Article : Google Scholar : PubMed/NCBI
|
|
8
|
Teramoto T, Sasaki J, Ishibashi S, Birou
S, Daida H, Dohi S, Egusa G, Hiro T, Hirobe K, Iida M, et al: Other
types of primary hyperlipoproteinemia(hyperlipidemia). Executive
summary of the Japan Atherosclerosis Society (JAS) guidelines for
the diagnosis and prevention of atherosclerotic cardiovascular
diseases in Japan - 2012 version. J Atheroscler Thromb. 21:82–85.
2014. View Article : Google Scholar : PubMed/NCBI
|
|
9
|
Myers L and Mendis S: Cardiovascular
disease research output in WHO priority areas between 2002 and
2011. J Epidemiol Glob Health. 4:23–28. 2014. View Article : Google Scholar : PubMed/NCBI
|
|
10
|
Chen H, Yang B, Liu D, Liu W, Liu Y, Zhang
X and Hu L: Using blood indexes to predict overweight statuses: An
extreme learning machine-based approach. PLoS One. 10:e01430032015.
View Article : Google Scholar : PubMed/NCBI
|
|
11
|
Hartman ML, Goodson JM, Barake R, Alsmadi
O, Al-Mutawa S, Ariga J, Soparkar P, Behbehani J, Behbehani K and
Welty F: Salivary glucose concentration exhibits threshold kinetics
in normal-weight, overweight, and obese children. Diabetes Metab
Syndr Obes. 8:9–15. 2014.PubMed/NCBI
|
|
12
|
Mateo-Gallego R, Perez-Calahorra S, Cofán
M, Baila-Rueda L, Cenarro A, Ros E, Puzo J and Civeira F: Serum
lipid responses to weight loss differ between overweight adults
with familial hypercholesterolemia and those with familial combined
hyperlipidemia. J Nutr. 144:1219–1226. 2014. View Article : Google Scholar : PubMed/NCBI
|
|
13
|
Di Bonito P, Pacifico L, Chiesa C, Invitti
C, Del Giudice E Miraglia, Baroni MG, Moio N, Pellegrin MC, Tomat
M, Licenziati MR, et al: ‘CARdiometabolic risk factors in
overweight and obese children in ITALY’ (CARITALY) Study Group:
White blood cell count may identify abnormal cardiometabolic
phenotype and preclinical organ damage in overweight/obese
children. Nutr Metab Cardiovasc Dis. 26:502–509. 2016. View Article : Google Scholar : PubMed/NCBI
|
|
14
|
No authors listed: Guidelines (2013) for
managing overweight and obesity in adults. Preface to the Expert
Panel Report (comprehensive version which includes systematic
evidence review, evidence statements, and recommendations). Obesity
(Silver Spring). 22:(Suppl 2). S402014. View Article : Google Scholar : PubMed/NCBI
|
|
15
|
Li PF, Chen JS, Chang JB, Chang HW, Wu CZ,
Chuang TJ, Huang CL, Pei D, Hsieh CH and Chen YL: Association of
complete blood cell counts with metabolic syndrome in an elderly
population. BMC Geriatr. 16:102016. View Article : Google Scholar : PubMed/NCBI
|
|
16
|
Hassan U, Reddy B Jr, Damhorst G, Sonoiki
O, Ghonge T, Yang C and Bashir R: A microfluidic biochip for
complete blood cell counts at the point-of-care. Technology (Singap
World Sci). 3:201–213. 2015.PubMed/NCBI
|
|
17
|
Wang J, Wang F, Liu Y, Xu J, Lin H, Jia B,
Zuo W, Jiang Y, Hu L and Lin F: Multiple Linear Regression and
Artificial Neural Network to Predict Blood Glucose in Overweight
Patients: Multiple Linear Regression and Artificial Neural Network
to Predict Blood Glucose in Overweight Patients. Exp Clin
Endocrinol Diabetes. 124:34–38. 2016. View Article : Google Scholar : PubMed/NCBI
|
|
18
|
Hu L, Hong G, Ma J, Wang X, Lin G, Zhang X
and Lu Z: Clearance rate and BP-ANN model in paraquat poisoned
patients treated with hemoperfusion. Biomed Res Int.
2015:2982532015. View Article : Google Scholar : PubMed/NCBI
|
|
19
|
Ma J, Cai J, Lin G, Chen H, Wang X, Wang X
and Hu L: Development of LC-MS determination method and
back-propagation ANN pharmacokinetic model of corynoxeine in rat. J
Chromatogr B Analyt Technol Biomed Life Sci. 959:10–15. 2014.
View Article : Google Scholar : PubMed/NCBI
|
|
20
|
Wang X, Zhang M, Ma J, Zhang Y, Hong G,
Sun F, Lin G and Hu L: Metabolic changes in paraquat poisoned
patients and support vector machine model of discrimination. Biol
Pharm Bull. 38:470–475. 2015. View Article : Google Scholar : PubMed/NCBI
|