Introduction
Based on the National Cancer Registry Report 2007,
gastric cancer was the ninth most common type of cancer in Malaysia
and 3.5 cases per 100,000 population were reported (1). The highest percentage of cases were
diagnosed at advanced stages (stage III and IV) due to non-specific
symptoms and an inadequate screening program. Gastric
carcinogenesis is a continuous process from non-atrophic gastritis
leading to chronic atrophic gastritis (CAG), to intestinal
metaplasia (IM) and dysplasia, and finally to intestinal-type
gastric adenocarcinoma (2–4). A prospective 10-year follow-up study in
Japan demonstrated that patients with Helicobacter pylori
(H. pylori)-induced chronic active gastritis developed
atrophic gastritis, which was observed endoscopically and
histologically (5). CAG of the antrum
and corpus are independent risk factors for gastric cancer, and the
risk increases exponentially with the increase in grade and
severity of atrophy (6,7). The progression of severe fundal atrophic
gastritis to gastric cancer was documented to be ~3% from a total
of 654 patients in the Japan (8).
Annual surveillance of patients with IM or atrophic gastritis
detected a higher percentage of gastric cancer, at 11% (9). A large retrospective study investigating
the risk of gastric cancer in patients with pre-malignant gastric
lesions has reported that ~6% of severe dysplastic patients
developed gastric cancer within 5 years of diagnosis (10).
The utility of serum biomarkers in diagnosing these
pre-malignant lesions in the stomach is an attractive alternative
to oesophageal-gastro-duodenoscopy (OGD) with histopathological
examination of gastric biopsies, which is considered to be the gold
standard for diagnosing CAG and IM. This method is non-invasive,
involves the use of blood samples and provides consistent results
utilizing ELISA.
Serum levels of pepsinogen (PG)I, PGI:II, gastrin-17
(G-17) and the ratio of PGI:I to PGI:II (PGI:II) were investigated
as alternative methods to diagnose CAG and IM. PGI:I is produced by
chief and mucous neck cells in the gastric fundus mucosa, while
G-17 is produced by G cells in the antrum. PGI:II, however, is
secreted in the gastric cardia, fundus, antrum and proximal
duodenum. The PGI:II ratio is greatly reduced in the corpus CAG due
to replacement of chief cells by pyloric glands (6,11), while a
low G-17 level was observed in H. pylori-infected patients
with antral CAG (12,13). Previous studies, however, yielded
conflicting results for serum PG (14–17) and G-17
values as potential biomarkers for CAG (18).
Various studies in different populations
demonstrated different levels of serum PGI, PGII and the PGI:II
ratio (Table I) (19–24). Serum
PG concentrations measured in certain areas of Asia appear to be
higher than those in Western countries. For example, the median PGI
levels were >90 µg/l in Shandong, China (25), the mean PGI was >100 µg/l in Hunan,
China (17) and Yazd, Iran (24), whereas values were usually <70 µg/l
in European countries (4,26). However, a Japanese study by Inoue et
al (19) involving 200 patients
and a Korean study involving 2,558 patients by Lee et al
(27) reported a mean serum PGI:I
level of <70 µg/l (56.0 and 63.5 µg/l, respectively). Whether
these variations in serum PG levels are due to different
geographical locations (with ensuing different ethnicities),
prevalence of the H. pylori infection, prevalence of CAG and
gastric carcinoma or varying dietary patterns remains uncertain and
requires further investigation. Furthermore, the cut-off points of
serum PGI and PGI:II for the detection of CAG or IM may vary
between populations resulting in requirements for validation in the
local setting.
 | Table I.Mean levels of serum PGI, PGII and
the PGI:II ratio from various studies in Asia, America and
Europe. |
Table I.
Mean levels of serum PGI, PGII and
the PGI:II ratio from various studies in Asia, America and
Europe.
| Author/(Refs),
year | Study location | Study population
(n) | Mean PGI ± SD
(µg/l) | Mean PGII ± SD
(µg/l) | Mean PGI:II ratio ±
SD |
|---|
| Inoue et al
(19), 1998 | Nagoya, Japan | All subjects
(200) | 56.0±2.2 | 19.6±0.8 | 3.2±0.1 |
| Ley et al
(20), 2001 | Chiapas,
Mexico | All subjects
(148) | 95
(26–52)a |
| 15
(9–22)a |
| Broutet et
al (26), 2003 | 14 European
countries | All subjects
(381) | 77.4±41.2 | 13.2±9.0 | 6.7 ±2.6 |
| Väänänen et
al (21), 2003 | Finland | Non CAG | 160±139 |
|
|
| Sierra et al
(22), 2006 | San Jose, Costa
Rica | Non CAG (291) | 53.1 | 18.9 | 3.3 |
| Oishi et al
(23), 2006 | Hisayama,
Japan | Male, Negative
testb | 71.0 | 16.7 | 5.1 |
| Oishi et al
(23), 2006 | Hisayama,
Japan | Female, Negative
testb | 64.0 | 16.3 | 5.1 |
| Mohamadkhani et
al (24), 2013 | Ardabil, Northern
Iran | All subjects
(149) | 102.5±42.6 | 8.1±4.7 | 15.1±7.6 |
| Mohamadkhani et
al (24), 2013 | Yazd, Sounthern
Iran | All subjects
(148) | 111.7±39 | 7.6±4.4 | 19.1±14.8 |
| Lee et al
(27), 2014 | Seoul, Korea | All subjects
(2,558) | 63.5±50.7 | 22.5±24.3 | 3.6±2.7 |
| Zhang et al
(17), 2014 | Hunan, China | Healthy control
(282) | 118.4±47.8 | 12.4±5.9 | 11.7±6.2 |
| Zhang et al
(17), 2014 | Hunan, China | CAG (20) | 93.6±49.3 | 10.9±4.6 | 11.1±5.8 |
To date, little is known about the use of serum PG
and gastrin levels in diagnosing CAG and IM in multi-racial nations
in the Asia Pacific region. The present study aimed to determine
the accuracy of serum PGI, PGII, G-17 and the PGI:II ratio as
biomarkers of CAG and IM in Malaysia, as a country with different
ethnicities. Measuring these serum biomarkers may facilitate with
the early diagnosis of gastric cancer at the curable stage,
particularly in patients with multiple risk factors, including the
H. pylori infection (28,29), high
intake of salted, pickled or smoked food (28,30), family
history of gastric cancer (31), blood
type A (32) and smoking (33). Thus, the aim of the present study was
to determine the sensitivity and specificity of serum PGI, PGII,
PGI:II ratio and serum G-17 levels in diagnosing pre-malignant
lesions in the stomach, as well as to determine the correlation of
these serum biomarkers with CAG and IM in patients with dyspeptic
symptoms.
Materials and methods
A cross sectional observational study, involving 72
patients who underwent OGD for dyspepsia, was performed at the
Pusat Perubatan Universiti Kebangsaan Malaysia (Kuala Lumpur,
Malaysia) from June 2015 to March 2016. The sample size calculation
was based upon the equation from power analysis in the diagnostic
test. Based upon the study by Dinis-Ribeiro et al (14), the sensitivity and specificity of the
serum PGI:II ratio ≤3 in diagnosing extensive IM were 66 and 78%,
respectively. Thus, the calculated sample size required to assess
the specificity of the serum PGI:II ratio was determined to be 88.
The current study population was 82% of the calculated sample size.
The present study was approved by the Research and Ethics Committee
of the Faculty of Medicine, UKM (approval no. FF-2015-237).
Patients enrolled in the current study provided written informed
consent.
Patients were recruited according to certain
inclusion and exclusion criteria. Exclusion criteria included
patients aged <18 years, and those receiving proton pump
inhibitor, histamine-2 receptor antagonist, bismuth or
non-steroidal anti-inflammatory drugs two weeks prior to blood
sampling for serum PGI, serum PGII and serum G-17. Patients who had
received triple therapy for the H. pylori infection, partial
or total gastrectomy, chemotherapy or radiotherapy involving the
gastric field and upper gastrointestinal bleeding during OGD were
also excluded. In addition, patients with gastric polyps and known
case of gastric lymphoma or gastric carcinoid tumour were excluded.
Their medical histories were recorded in a standardized data sheet
through review of patients' clinical history and notes.
Endoscopic examination
OGD was performed using fibre optic white light
endoscopy (Olympus GIF-Q260J or Fujifilm EG-530WR) and the gastric
mucosa was visualized directly by experienced endoscopists.
Patients with CAG were graded according to the location of the
border between the fundic and pyloric gland regions, as proposed by
Kimura and Takemoto (34) and Miike
et al (35). If the border is
on the lesser curvature of the stomach, it is defined as closed
type (C-type)/mild extension of atrophy. Further divisions of
C-type are as below: C1, at the angular part of the lesser
curvature; C2, in the lower part of the lesser curvature and C3, in
the middle part of the lesser curvature. If the atrophic border is
located more caudally and not on the lesser curvature, it is
defined as an open type (O-type)/severely extended atrophy.
Subdivisions of O-type are: O1, all parts of the lesser curvature
are pyloric; O2, the stage between O1 and O3; O3, all mucosa of the
stomach are non-acid-secreting.
Histopathology examination of gastric
mucosa biopsy
Random gastric mucosa biopsies were obtained from
the antrum and corpus during OGD. At least two biopsies were
obtained from each site in addition to biopsies from endoscopic
visible mucosal lesions. The biopsy specimens were processed into
paraffin blocks, and then histological sections (<4 mm) were
obtained and stained with hematoxylin and eosin (20 min) and
periodic acid Schiff reagent (10 min) at room temperature
(25–27°C). Mononuclear cell infiltration, neutrophil infiltration,
H. pylori, gastric glandular atrophy, and IM were identified
and graded according to the principles of the updated Sydney system
and the analogue visual scale (36).
Determination of serum PGI, PGII, G-17
and H. pylori antibody (HpAb) level
Fasting blood samples (8 ml) were obtained from
subjects by venipuncture for the determination of serum PGI, serum
PGII, serum G-17 and HpAb. The blood was placed into a plain tube
and allowed to clot (for at least 30 min) at room temperature
(25–27°C). After clotting, the serum was separated by
centrifugation (4,000 × g) for 10 min at room temperature (25–27°C)
and serum samples were stored at −70°C before use.
PGI, PGII, G-17 and HpAb levels in the serum samples
were determined using a GastroPanel ELISA kit (cat. no. 601300;
Biohit HealthCare, Helsinki, Finland) according to manufacturer's
instructions. The absorbance of each serum biomarker was determined
at a wavelength of 450 nm using a microplate reader
(SpectraMax® Plus384; Molecular Devices, LLC, Sunnyvale,
CA, USA). Assay results were then analysed using GastroSoft 1.51b
for Excel (Biohit HealthCare) to obtain the serum sample
concentrations.
Follow-up of patients
Subjects who were diagnosed with CAG and IM were
given follow-up appointments at the outpatient gastroenterology
clinic. Subjects who were diagnosed with gastric adenocarcinoma
were sent for staging of the disease and referred to an upper
gastrointestinal surgeon for further management. Those who
exhibited the H. pylori infection received eradication
therapy of amoxicillin, clarithromycin and proton pump inhibitors,
and were followed up with a urea breath test to ensure successful
eradication of the bacteria.
Statistical analysis
Normality tests were performed for all continuous
study variables. Due to the small sample size, the data were not
normally distributed and were expressed as the median interquartile
range (IQR). The optimal serum PGI, PGII, G-17 and PGI:II ratio
cut-off point was calculated using the area under the receiver
operating characteristic (ROC) curve (AUC). Analysis was performed
using SPSS version 23 (IBM Corp., Armonk, NY, USA) and P<0.05
was considered to indicate a statistically significant
difference.
Results
Socio-demographic data of study
subjects
A total of 72 subjects, including 35 controls
without CAG, 34 subjects with CAG and three subjects with gastric
adenocarcinoma (based upon endoscopic findings) were recruited. The
ages (mean ± standard deviation) of subjects with CAG and gastric
tumours were 57.1±16.6 and 64.3±8.5 years, respectively. No
statistical differences were identified in age between the disease
and control groups (Table II).
| Table II.Socio-demographic data of subjects
according to histological findings. |
Table II.
Socio-demographic data of subjects
according to histological findings.
|
| Endoscopic |
|---|
|
|
|
|---|
| Variable | Non CAG (n=35) | CAG (n=34) | Gastric tumour
(n=3) | Total (n=72) |
|---|
| Age, years (mean ±
SD) | 54.6±16.3 | 57.1±16.6 | 64.3±8.5 | 56.2±16.2 |
| Sex, n |
|
Male | 17 | 14 | 2 | 33 |
|
Female | 18 | 20 | 1 | 39 |
| Ethnicity, n |
|
Malay | 16 | 13 | 1 | 30 |
|
Chinese | 17 | 18 | 1 | 36 |
|
Indian | 2 | 3 | 1 | 6 |
| Level of
education |
|
Primary | 9 | 11 | 1 | 21 |
|
Secondary | 12 | 14 | 2 | 28 |
|
Tertiary | 14 | 9 | 0 | 23 |
| BMI,
kg/m2 (mean ± SD) | 23.5±4.2 | 24.4±4.6 | 21.0±6.0 | 23.7±4.5 |
| Medical
history |
|
Diabetic | 10 | 11 | 1 | 22 |
| Not
diabetic | 25 | 23 | 2 | 50 |
|
Hypertension | 17 | 13 | 1 | 31 |
|
Normotension | 18 | 21 | 2 | 41 |
|
IHD | 3 | 6 | 0 | 9 |
| No
IHD | 32 | 28 | 3 | 63 |
|
Stroke | 3 | 1 | 0 | 4 |
| No
stroke | 32 | 33 | 3 | 68 |
|
ESRF | 4 | 0 | 1 | 5 |
| Non
ESRF | 31 | 34 | 2 | 67 |
Serum biomarker levels among subjects
with different sexes, ethnicities and risk factors of gastric
cancer
The median levels of PGI, PGII, PGI:II ratio and
G-17 for all subjects were 129.9 µg/l (IQR, 95.0–201.6), 10.3 µg/l
(IQR, 6.0–13.0), 14.7 (IQR, 9.9–17.4) and 4.4 pmol/l (IQR,
1.6–15.0), respectively. The median values of serum PGI and PGII
were significantly lower in females as compared to males (101.7 vs.
175.4 µg/l, P<0.01 and 8.0 vs. 12.1 µg/l, P<0.05,
respectively).
Median PGI levels for smokers were significantly
higher when compared with non-smokers (196.6 vs. 117.4 µg/l;
P<0.05). The median value for the G-17 level in subjects with
the H. pylori infection was significantly higher (5.7
pmol/l) than in those without the H. pylori infection (3.1
pmol/l; P<0.05). The H. pylori infection was associated
with an increased risk of developing CAG and IM with an odds ratio
of 5.0. Subjects with the H. pylori infection and CAG or IM
had a significantly lower serum PGI:II ratio (9.9; P<0.05) when
compared with those without the H. pylori infection and
CAG/IM (15.4). Only one subject (1.4%) consumed >1.5 servings of
smoked food per day.
Comparison of serum biomarker levels
among subjects with different histological findings
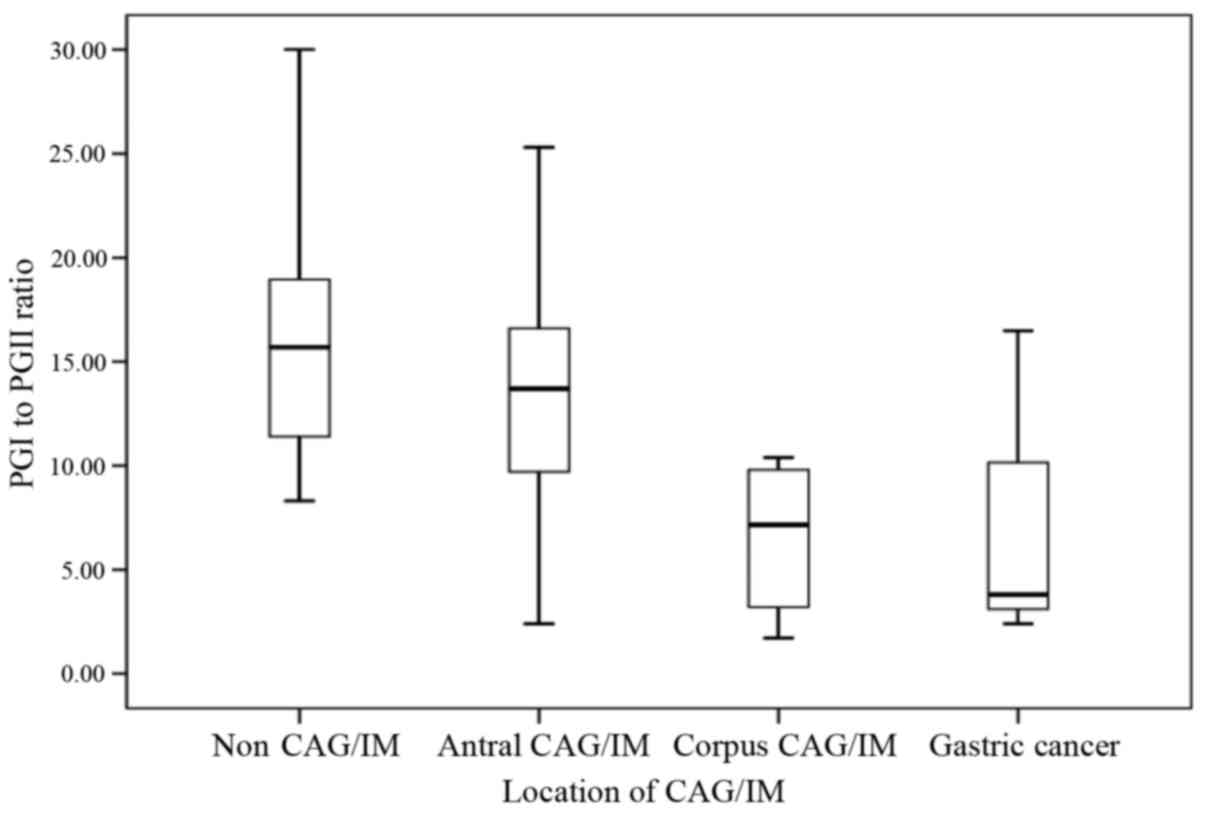
Median PGI levels for subjects without CAG, with CAG
and with IM were 138.9, 108.7 and 116.6 µg/l, respectively. The
PGI:II ratio was significantly lower in subjects with CAG
(PGI:II=10.1) and IM (PGI:II=12.0) when compared with that of the
control group (PGI:II=15.7; P<0.05; Table III). Based on the location of CAG or
IM, subjects with CAG or IM involving the corpus (with or without
antrum involvement) exhibited a significantly lower median serum
PGI:II ratio of 7.2, compared with subjects without CAG (15.7;
P<0.05) and subjects with CAG or IM confined to the antrum
(13.7; P<0.05) (Fig. 1).
| Table III.Comparison of PGI, PGII, G-17 levels
and the PGI:II ratio between subjects with histological non CAG,
CAG, IM and gastric adenocarcinoma. |
Table III.
Comparison of PGI, PGII, G-17 levels
and the PGI:II ratio between subjects with histological non CAG,
CAG, IM and gastric adenocarcinoma.
|
| Histological
finding |
|---|
|
|
|
|---|
| Serum
biomarker | Non CAG (n=48) | CAG (n=12) | IM (n=9) | Gastric
adenocarcinoma (n=3) |
P-valuea |
|---|
| PG I, µg/l | 138.9
(98.0–218.0) | 108.7
(47.5–167.2) | 116.6
(76.9–167.2) | 191.3 | 0.261 |
|
P-valueb |
| 0.100 | 0.175 | 0.925 |
|
| PG II, µg/l | 10.2
(6.0–12.7) | 7.7 (5.8–12.4) | 10.9
(8.3–13.1) | 17.6 | 0.096 |
|
P-valueb |
| 0.657 | 0.470 | 0.012c |
|
| PGI:II ratio | 15.7
(11.4–19.2) | 10.1
(6.5–16.2) | 12.0
(8.6–15.4) | 3.8 | 0.016c |
|
P-valueb |
| 0.027c | 0.031c | 0.075 |
|
| G-17, pmol/l | 3.75
(1.4–11.9) | 6.75
(2.8–57.4) | 5.1 (2.3–15.1) | 0.9 | 0.311 |
|
P-valueb |
| 0.074 | 0.031 | 0.555 |
|
In subjects with CAG, the median serum G-17 level
was 6.75 pmol/l, with a wide quartile range of 2.8–57.4 pmol/l.
This finding resulted from different serum G-17 levels in subjects
with CAG in the antrum and CAG in the corpus. The median level of
serum G-17 was significantly higher in subjects with CAG or IM
involving the corpus (57.0 pmol/l) when compared with subjects
without CAG (3.8 pmol/l; P<0.05) or subjects with CAG or IM
involving the antrum only (5.0 pmol/l; P<0.05).
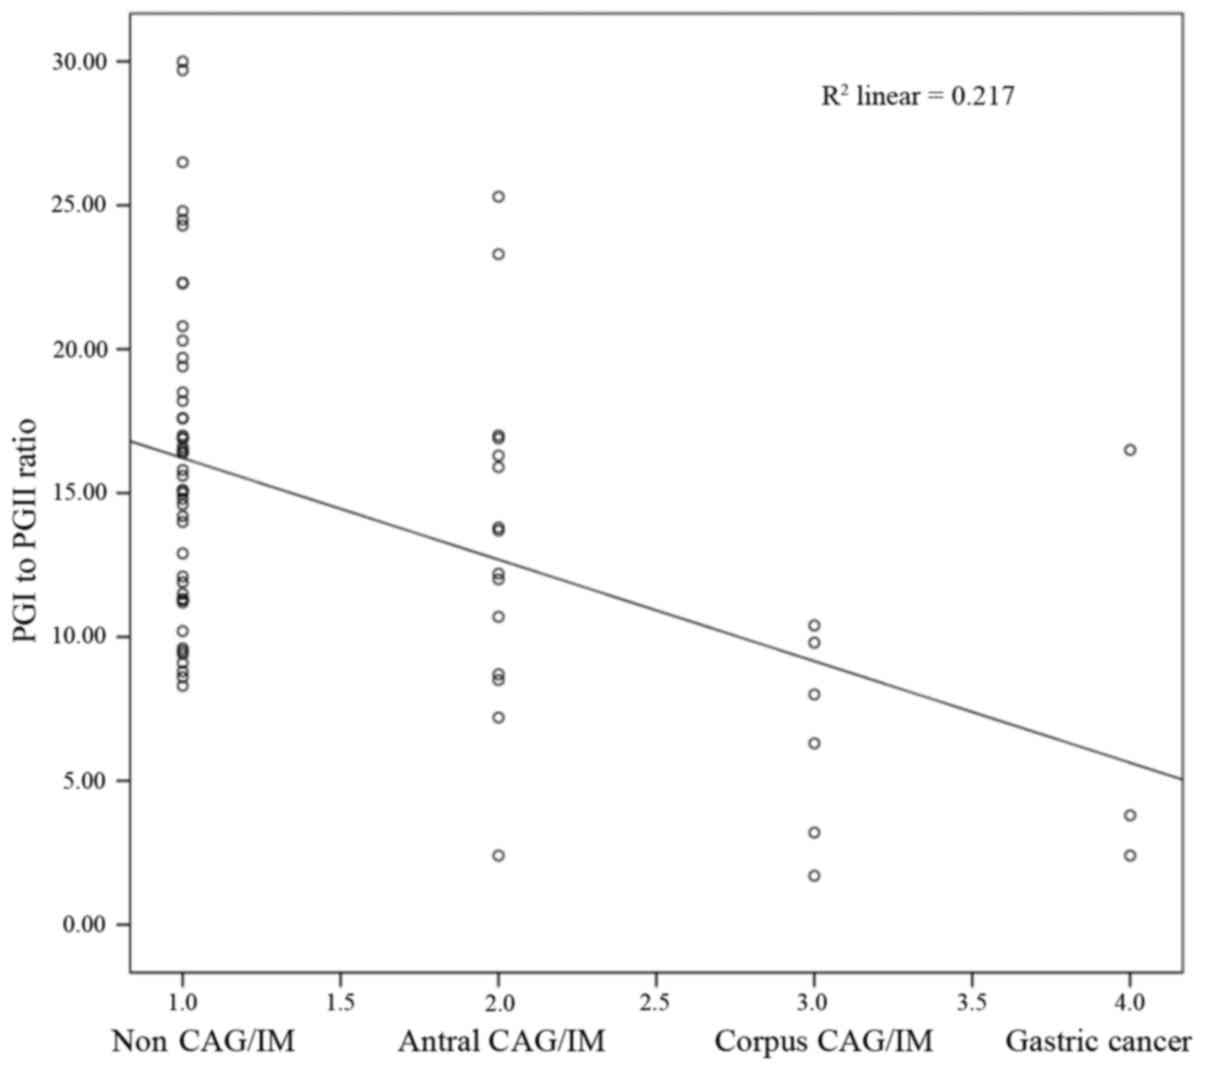
Correlation between serum biomarkers
and histological findings
There was a significant negative correlation
identified between histological CAG or IM and the serum PGI:II
ratio (Spearman rank correlation coefficient, r=−0.417; P<0.001;
Fig. 2). However, no statistically
significant difference was identified for serum PGI (r =−0.198;
P=0.095), PGI:II (r=0.146; P=0.222) or serum G-17 (r=0.165;
P=0.166).
Sensitivity and specificity of white
light endoscopy in diagnosing CAG
The results from OGD demonstrated 85.7% sensitivity,
66.7% specificity, 52.9% positive predictive value and 91.4%
negative predictive value in diagnosing pre-malignant gastric
lesions compared with the histology results as a gold standard
(Table IV).
| Table IV.Cross-tabulation of endoscopy
findings and histology results. |
Table IV.
Cross-tabulation of endoscopy
findings and histology results.
|
| Endoscopy |
|
|---|
|
|
|
|
|---|
| Histology | Non CAG | C1 | C2 | C3 | O1 | O2 | O3 | Tumour | Total |
|---|
| Non CAG | 32 | 2 | 2 | 6 | 1 | 3 | 2 | 0 | 48 |
| CAG, antrum | 0 | 0 | 2 | 1 | 2 | 1 | 1 | 0 | 7 |
| CAG, corpus | 0 | 0 | 0 | 0 | 0 | 0 | 1 | 0 | 1 |
| CAG, antrum and
corpus | 0 | 0 | 2 | 1 | 1 | 0 | 0 | 0 | 4 |
| IM, antrum | 3 | 0 | 1 | 2 | 1 | 1 | 0 | 0 | 8 |
| IM, corpus | 0 | 0 | 0 | 0 | 1 | 0 | 0 | 0 | 1 |
| IM, antrum and
corpus | 0 | 0 | 0 | 0 | 0 | 0 | 0 | 0 | 0 |
| Gastric
adenocarcinoma | 0 | 0 | 0 | 0 | 0 | 0 | 0 | 3 | 3 |
| Total | 35 | 2 | 7 | 10 | 6 | 5 | 4 | 3 | 72 |
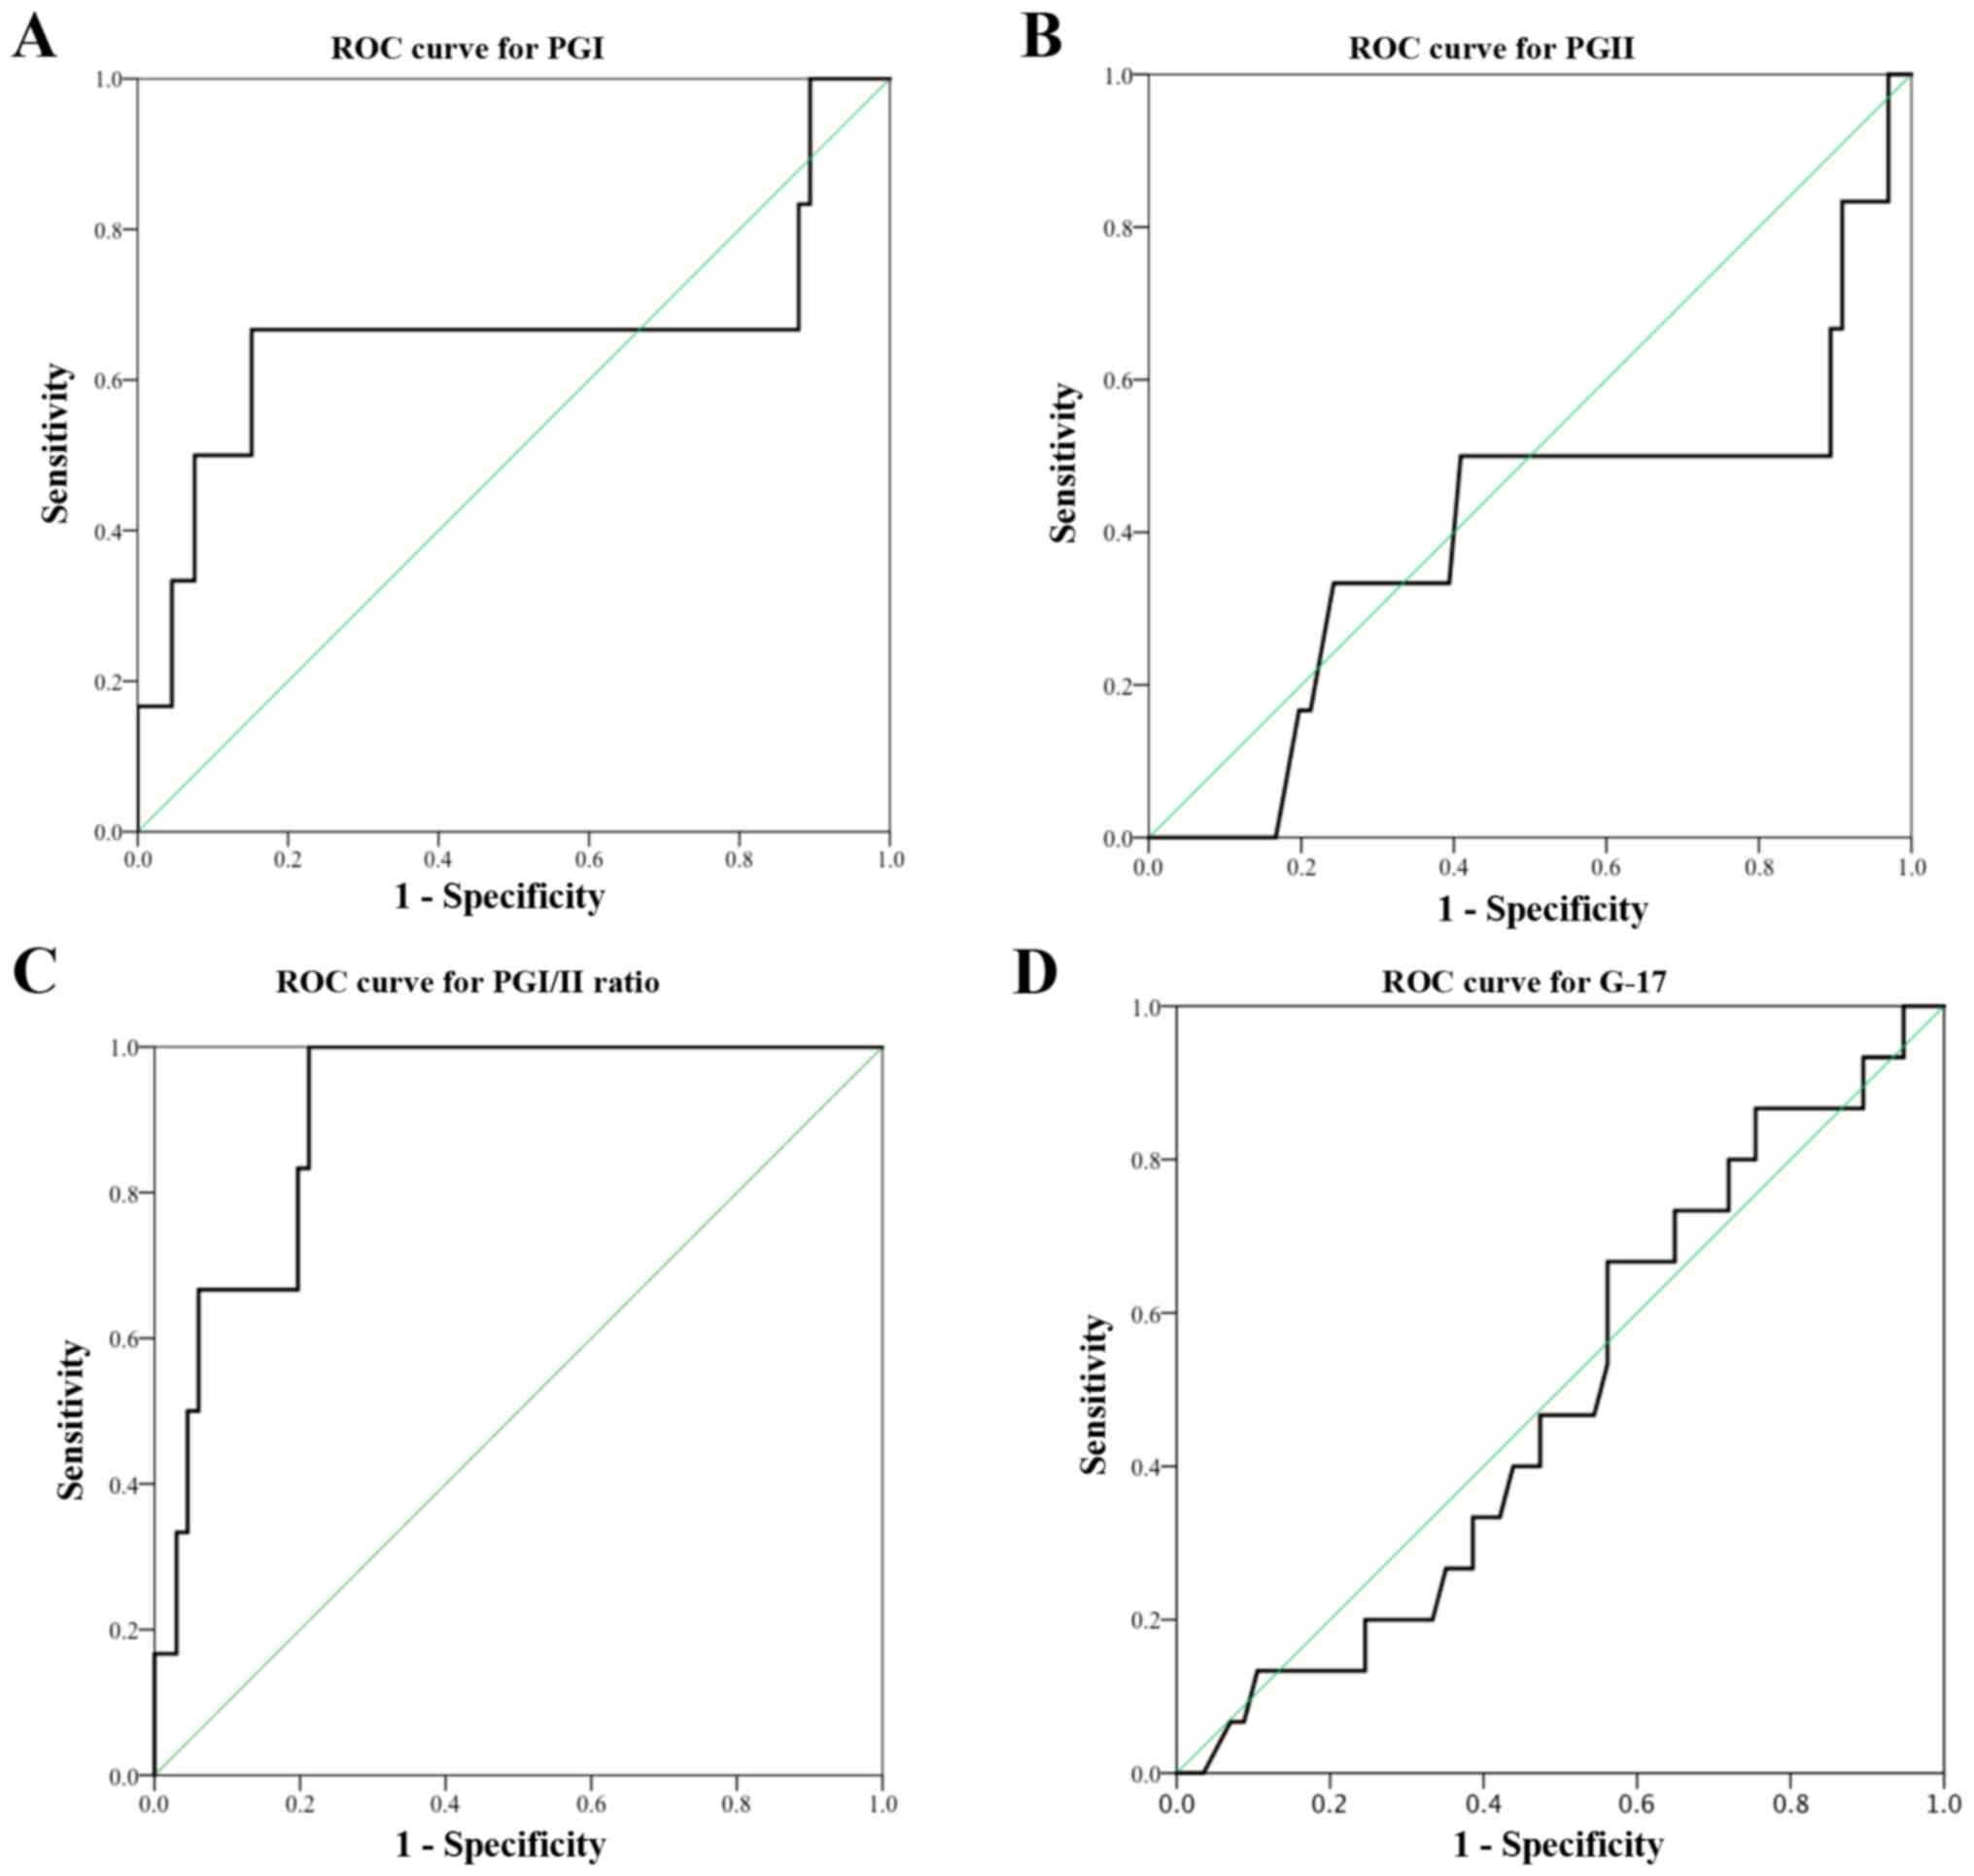
Sensitivity and specificity of serum
biomarkers in diagnosing CAG and IM
The serum PGI:II ratio was found to be accurate in
diagnosing corpus CAG or IM with the AUC of 0.902. AUC for serum
PGI was 0.659. Based on the ROC curve in the present study, a
cut-off value of serum PGI ≤87.2 µg/l produced a sensitivity of
66.7% and specificity of 85.3%. A cut-off PGI:II ratio value of
≤10.0 detected corpus CAG or IM with a high sensitivity of 83.3%
and specificity of 77.9%. The manufacturer recommended PGI cut-off
value of ≤70 µg/l resulted in a low sensitivity of 50.0% but a high
specificity of 91.2% in diagnosing corpus CAG or IM. Similarly, a
cut-off PGI:II ratio of ≤3.0 had a low sensitivity of 16.7% in
diagnosing corpus CAG or IM, even though the specificity was high
(97.1%).
Poor test performances were observed in serum PGII
level (cut-off value <8.8 µg/l, sensitivity 50.0% and
specificity 60.3%) and serum G-17 level (cut-off <5.6 pmol/l,
sensitivity 68.8% and specificity 44.8%). Each of the tests had AUC
of <0.5 (Fig. 3).
Discussion
Gastric cancer is often diagnosed at an advanced
stage due to non-specific symptoms during the early stages. The aim
of the current study was to determine the sensitivity and
specificity of serum PG and its ratio together with G-17 levels
when diagnosing pre-malignant lesions in the stomach. It was
successfully demonstrated that only the serum PGI:II ratio is
potentially usable as a biomarker of corpus CAG and IM with high
sensitivity of 83.3%, specificity of 77.9%, and AUC of 0.902 at a
high cut-off value of ≤10.0.
The current study identified higher median PGI
(129.9 µg/l; IQR, 95.0–201.6 µg/l) and PGII (10.3 µg/l; IQR,
6.0–13.0 µg/l) levels, and PGI:II ratio (14.7; IQR, 9.9–17.4) in
the study population, when compared with other studies (19,22–23,26,27). A possible explanation is the different
ethnicities involved, as the majority of subjects were Chinese and
Malay. High serum PGI levels and PGI:II ratios were also reported
in China (17) and Iran (24). The mean PGI level and PGI:II ratio were
118.4 µg/l and 11.7 respectively in Hunan, China (17). In Yazd, Southern Iran, the mean PGI
level was 111.7 µg/l and the PGI:II ratio was 19.1 (24).
A more consistent and reliable biomarker for CAG and
IM that could be used clinically is the serum PGI:I/II ratio. In
addition, the importance of determining the location of CAG or IM
was demonstrated, as there is a significant difference in serum
PGI:II ratio between subjects with corpus CAG/IM and those with
antral CAG/IM. When the histological subtypes were considered,
regardless of the location of the lesions, no significant
difference in serum PGI:II ratio was identified between patients
with CAG and those with IM.
In previous studies that reported a correlation
between serum PG level and pre-malignant lesions in the stomach,
widely accepted cut-off values for the serum PGI concentration and
PGI:II ratio were ≤70 µg/l and ≤3 respectively (14,37–39). At these cut-off values, Kitahara et
al (37) reported a sensitivity of
84.6% and specificity of 73.5% in gastric cancer screening. In a
study by Borch et al (40),
serum PGI level of ≤71.6 µg/l had a sensitivity of 100% and
specificity of 86%, while the serum PGI:II ratio of ≤5.5 had a
sensitivity of 99% and specificity of 94% in diagnosing fundal CAG.
A previous study reported that an accuracy of 83%, sensitivity of
83% and specificity of 95% using different serum PGI and G-17
cut-off values to diagnose CAG depending on the HpAb level
(21). Another study demonstrated that
the PGI:II ratio was a reliable marker of IM with a sensitivity of
66% and specificity of 78% at a cut-off value of 3.0 (14). Meanwhile, Broutet el at
(26) reported that only the PGI:II
ratio was accurate in diagnosing CAG at a cut-off value of 5.6.
Despite the above-mentioned good correlation, the
present study identified a poor correlation of serum PG and G-17 in
diagnosing CAG, which has also been reported in previous studies
(17,23). In a prospective multicentre study in
Spain, the AUC for serum PGI and PGI:II ratio were 0.6 and 0.66,
respectively. In 2014, McNicholl et al (18) concluded that these serum biomarkers
were not accurate enough to diagnose CAG. Zhang et al
(17) reported that a low serum PGI
level and PGI:II ratio may predict gastric cancer; however, no
significant difference was observed in the serum PGI level and
PGI:II ratio among subjects with or without CAG. Furthermore, the
mean value of the PGI:II ratio for patients with CAG was higher,
11.07±5.78 when compared with 10.63±5.74 for patients with
non-atrophic gastritis (17). The
serum PGI and PGII alone or their combinations with a low PGI:II
ratio were reported as not sensitive enough to diagnose CAG
(24).
In the present study, using a cut-off value of serum
PGI ≤70 or PGI:II ratio ≤3.0, the sensitivity of the test became
very low in detecting corpus CAG, even though the specificity was
91.2 and 97.1%, respectively. Due to a small sample size, the
median PGI:II ratio for subjects with corpus CAG or IM was 7.2
(IQR, 2.8–10.0). In order to improve the sensitivity and
specificity of the serum PGI:II ratio in diagnosing corpus CAG and
IM, the current study proposes to increase the cut-off value for
the ratio. Based upon the ROC curve, the optimum cut-off value for
the PGI:II ratio as a biomarker for corpus CAG and IM in the
current population was ≤10.0 or serum PGI of ≤87.2 µg/l, which was
higher than the values reported in previous studies. Therefore, a
larger cohort study is required to determine the real sensitivity,
specificity and cut-off value of serum PG for the diagnosis of
corpus CAG or IM before it may be applied in clinical practice.
In the present study, subjects with the H.
pylori infection were observed and identified to be associated
with a high serum G-17 level. Furthermore, a higher level of G-17
was noted among Indian subjects as compared with Malay and Chinese
subjects, while there was no difference in G-17 level among
different age groups. This is in contrast to a large study in China
(41), where subjects >60 years of
age were observed to have higher serum G-17 levels compared with
the younger age group. A previous study also demonstrated that a
high serum G-17 level was detected in H. pylori-positive
subjects (41). In addition, patients
with increased gastric acidity, such as gastro-oesophageal reflux
disease and Barrett's oesophagus were reported to exhibit a low
fasting level of serum G-17 (42).
The serum concentration of G-17 level varies in
association to the location of atrophic mucosa. A low level of
serum G-17 is a sign of multifocal or antrum-limited gastritis in
patients infected with H. pylori (13). The present results did not demonstrate
low serum G-17 levels in subjects with antral CAG or IM
irrespective of whether they were HpAb-positive or -negative.
Conversely, subjects with corpus CAG or IM exhibited high serum
G-17 levels. This is consistent with findings in other studies that
high G-17 may be used as a biomarker in diagnosing corpus CAG
(43,44). It has been hypothesized that atrophic
gastric mucosa of the corpus results in hypochlorhydria and this
stimulates gastrin production from the antrum.
To the best of our knowledge, this is the first
study in Malaysia assessing serum PG, G-17 and HpAb levels in
patients with CAG and IM. By assessing the clinical risk factors
that are associated with CAG and IM, patients that are high-risk
for gastric cancer may be identified by screening using serum
biomarkers. The H. pylori infection was associated with an
increased risk of developing premalignant gastric lesions. Subjects
presenting with the H. pylori infection and CAG or IM
exhibited a significantly lower serum PGI:II ratio compared with
those without the H. pylori infection and CAG or IM.
Therefore, it is proposed that the serum PGI:II ratio is a
potential screening tool for gastric cancer, particularly in
patients presenting with the H. pylori infection.
Long-term follow-up for subjects with CAG and IM
enabled the determination of the incidence of gastric
adenocarcinoma in the patient cohort. A population study is
required to determine the prevalence of CAG, IM and gastric cancer
in Malaysia. In a geographical area with a low prevalence of CAG,
IM and gastric cancer, a surveillance programme using serum
biomarkers or OGD with gastric biopsy may not be cost-effective.
Although the serum PGI:II ratio demonstrated significant negative
correlation with corpus CAG and IM, the best cut off value in these
pre-malignant gastric lesions needs to be determined in a larger
number of participants. The suitability of this serum biomarker may
be improved by adding more biomarkers. More studies involving
microRNA, the DNA methylation status of gastric cancer-associated
genes or tissue-based proteomics using high-throughput technology
are required. Furthermore, the utility of the serum PGI:II ratio
should only be targeted to individuals with a high risk of gastric
cancer or pre-malignant lesions, such as those with the H.
pylori infection, in order to optimize the cost
effectiveness.
In conclusion, the use of serum biomarkers in
diagnosing pre-malignant lesions in the stomach presents an
attractive alternative to OGD with histopathology examination of
the gastric biopsy. It is non-invasive, involves simple blood
taking and provides consistent results using ELISA, as compared
with OGD. The current study identified that serum PGI, PGII and
G-17 levels alone were not sensitive enough to diagnose CAG or IM.
At a high cut-off value, the serum PGI:II ratio displayed high
sensitivity and specificity, and a significant negative correlation
in diagnosing corpus CAG or IM in the current population. The
current findings are preliminary, thus further investigation with a
larger cohort is required to determine the optimum cut-off value,
in order to adopt this biomarker as an outpatient, non-invasive
filter for detecting pre-malignant lesions in the stomach prior to
endoscopy. Additional experiments, such as an immunohistochemistry
study are required to support the current biomarker before it is
used in clinical practice.
Acknowledgements
The authors would like to thank the Malaysian
Society of Gastroenterology and Hepatology (MSGH) for its support
and funding through the MSGH Research Project 2014 Grant Source of
financial support (grant no. JJ-2015-004).
Glossary
Abbreviations
Abbreviations:
|
CAG
|
chronic atrophic gastritis
|
|
IM
|
intestinal metaplasia
|
|
OGD
|
oesophageal-gastro-duodenoscopy
|
|
G-17
|
gastrin-17
|
|
PGI
|
pepsinogen I
|
|
PGII
|
pepsinogen II
|
|
HpAb
|
Helicobacter pylori
antibody
|
|
ROC
|
receiver operating characteristic
|
|
IQR
|
interquartile range
|
References
|
1
|
Zainal AO and Saleha Nor IT: National
Cancer Registry Report. Malaysia Cancer Statistics - Data and
FigureMinistry of Health Malaysia. Malaysia: 2007
|
|
2
|
Correa P: Human gastric carcinogenesis: A
multistep and multifactorial process - First American Cancer
Society Award Lecture on Cancer Epidemiology and Prevention. Cancer
Res. 52:6735–6740. 1992.PubMed/NCBI
|
|
3
|
Asaka M, Sugiyama T, Nobuta A, Kato M,
Takeda H and Graham DY: Atrophic gastritis and intestinal
metaplasia in Japan: Results of a large multicenter study.
Helicobacter. 6:294–299. 2001. View Article : Google Scholar : PubMed/NCBI
|
|
4
|
Weck MN and Brenner H: Prevalence of
chronic atrophic gastritis in different parts of the world. Cancer
Epidemiol Biomarkers Prev. 15:1083–1094. 2006. View Article : Google Scholar : PubMed/NCBI
|
|
5
|
Sakaki N, Kozawa H, Egawa N, Tu Y and
Sanaka M: Ten-year prospective follow-up study on the relationship
between Helicobacter pylori infection and progression of
atrophic gastritis, particularly assessed by endoscopic findings.
Aliment Pharmacol Ther. 16 Suppl 2:198–203. 2002. View Article : Google Scholar : PubMed/NCBI
|
|
6
|
Sipponen P: Update on the pathologic
approach to the diagnosis of gastritis, gastric atrophy, and
Helicobacter pylori and its sequelae. J Clin Gastroenterol.
32:196–202. 2001. View Article : Google Scholar : PubMed/NCBI
|
|
7
|
Park YH and Kim N: Review of atrophic
gastritis and intestinal metaplasia as a premalignant lesion of
gastric cancer. J Cancer Prev. 20:25–40. 2015. View Article : Google Scholar : PubMed/NCBI
|
|
8
|
Tatsuta M, Iishi H, Nakaizumi A, Okuda S,
Taniguchi H, Hiyama T, Tsukuma H and Oshima A: Fundal atrophic
gastritis as a risk factor for gastric cancer. Int J Cancer.
53:70–74. 1993. View Article : Google Scholar : PubMed/NCBI
|
|
9
|
Whiting JL, Sigurdsson A, Rowlands DC,
Hallissey MT and Fielding JW: The long term results of endoscopic
surveillance of premalignant gastric lesions. Gut. 50:378–381.
2002. View Article : Google Scholar : PubMed/NCBI
|
|
10
|
de Vries AC, van Grieken NC, Looman CW,
Casparie MK, de Vries E, Meijer GA and Kuipers EJ: Gastric cancer
risk in patients with premalignant gastric lesions: A nationwide
cohort study in the Netherlands. Gastroenterology. 134:945–952.
2008. View Article : Google Scholar : PubMed/NCBI
|
|
11
|
Hansen S, Vollset SE, Derakhshan MH, Fyfe
V, Melby KK, Aase S, Jellum E and McColl KE: Two distinct
aetiologies of cardia cancer; evidence from premorbid serological
markers of gastric atrophy and Helicobacter pylori status.
Gut. 56:918–925. 2007. View Article : Google Scholar : PubMed/NCBI
|
|
12
|
Hallissey MT, Dunn JA and Fielding JW:
Evaluation of pepsinogen A and gastrin-17 as markers of gastric
cancer and high-risk pathologic conditions. Scand J Gastroenterol.
29:1129–1134. 1994. View Article : Google Scholar : PubMed/NCBI
|
|
13
|
Sipponen P, Ranta P, Helske T, Kääriäinen
I, Mäki T, Linnala A, Suovaniemi O, Alanko A and Härkönen M: Serum
levels of amidated gastrin-17 and pepsinogen I in atrophic
gastritis: An observational case-control study. Scand J
Gastroenterol. 37:785–791. 2002. View Article : Google Scholar : PubMed/NCBI
|
|
14
|
Dinis-Ribeiro M, da Costa-Pereira A, Lopes
C, Barbosa J, Guilherme M, Moreira-Dias L, Lomba-Viana H, Silva R,
Abreu N and Lomba-Viana R: Validity of serum pepsinogen I/II ratio
for the diagnosis of gastric epithelial dysplasia and intestinal
metaplasia during the follow-up of patients at risk for
intestinal-type gastric adenocarcinoma. Neoplasia. 6:449–456. 2004.
View Article : Google Scholar : PubMed/NCBI
|
|
15
|
Storskrubb T, Aro P, Ronkainen J, Sipponen
P, Nyhlin H, Talley NJ, Engstrand L, Stolte M, Vieth M, Walker M
and Agréus L: Serum biomarkers provide an accurate method for
diagnosis of atrophic gastritis in a general population: The
Kalixanda study. Scand J Gastroenterol. 43:1448–1455. 2008.
View Article : Google Scholar : PubMed/NCBI
|
|
16
|
Lomba-Viana R, Dinis-Ribeiro M, Fonseca F,
Vieira AS, Bento MJ and Lomba-Viana H: Serum pepsinogen test for
early detection of gastric cancer in a European country. Eur J
Gastroenterol Hepatol. 24:37–41. 2012. View Article : Google Scholar : PubMed/NCBI
|
|
17
|
Zhang XM, Li JX, Zhang GY, Li XH and Gu H:
The value of serum pepsinogen levels for the diagnosis of gastric
diseases in Chinese Han people in midsouth China. BMC
Gastroenterol. 14:32014. View Article : Google Scholar : PubMed/NCBI
|
|
18
|
McNicholl AG, Forné M, Barrio J, De la
Coba C, González B, Rivera R, Esteve M, Fernandez-Bañares F,
Madrigal B, Gras-Miralles B, et al: Helicobacter pylori
Study Group of Asociación Española de Gastroenterología (AEG):
Accuracy of GastroPanel for the diagnosis of atrophic gastritis.
Eur J Gastroenterol Hepatol. 26:941–948. 2014. View Article : Google Scholar : PubMed/NCBI
|
|
19
|
Inoue M, Kobayashi S, Matsuura A, Hamajima
N, Tajima K and Tominaga S: Agreement of endoscopic findings and
serum pepsinogen levels as an indicator of atrophic gastritis.
Cancer Epidemiol Biomarkers Prev. 7:261–263. 1998.PubMed/NCBI
|
|
20
|
Ley C, Mohar A, Guarner J,
Herrera-Goepfert R, Figueroa LS, Halperin D and Parsonnet J:
Screening markers for chronic atrophic gastritis in Chiapas,
Mexico. Cancer Epidemiol Biomarkers Prev. 10:107–112.
2001.PubMed/NCBI
|
|
21
|
Väänänen H, Vauhkonen M, Helske T,
Kääriäinen I, Rasmussen M, Tunturi-Hihnala H, Koskenpato J, Sotka
M, Turunen M, Sandström R, et al: Non-endoscopic diagnosis of
atrophic gastritis with a blood test. Correlation between gastric
histology and serum levels of gastrin-17 and pepsinogen I: A
multicentre study. Eur J Gastroenterol Hepatol. 15:885–891. 2003.
View Article : Google Scholar : PubMed/NCBI
|
|
22
|
Sierra R, Une C, Ramírez V, González MI,
Ramírez JA, de Mascarel A, Barahona R, Salas-Aguilar R, Páez R,
Avendaño G, et al: Association of serum pepsinogen with atrophic
body gastritis in Costa Rica. Clin Exp Med. 6:72–78. 2006.
View Article : Google Scholar : PubMed/NCBI
|
|
23
|
Oishi Y, Kiyohara Y, Kubo M, Tanaka K,
Tanizaki Y, Ninomiya T, Doi Y, Shikata K, Yonemoto K, Shirota T, et
al: The serum pepsinogen test as a predictor of gastric cancer: The
Hisayama study. Am J Epidemiol. 163:629–637. 2006. View Article : Google Scholar : PubMed/NCBI
|
|
24
|
Mohamadkhani A, Moghaddam Darvish S,
Salmanroghani H, Allafsghari A, Yazdanbod A, Mirzaei M,
Haj-sheykholeslami A, Bashiri J, Sadjadi A and Massarrat S: Are the
serum biomarkers pepsinogen I and II good predictors for the
detection of subjects with atrophic gastritis in areas that have
different gastric cancer incidence? Arch Iran Med. 16:208–212.
2013.PubMed/NCBI
|
|
25
|
You WC, Blot WJ, Li JY, Chang YS, Jin ML,
Kneller R, Zhang L, Han ZX, Zeng XR, Liu WD, et al: Precancerous
gastric lesions in a population at high risk of stomach cancer.
Cancer Res. 53:1317–1321. 1993.PubMed/NCBI
|
|
26
|
Broutet N, Plebani M, Sakarovitch C,
Sipponen P and Mégraud F: Eurohepygast Study Group: Pepsinogen A,
pepsinogen C, and gastrin as markers of atrophic chronic gastritis
in European dyspeptics. Br J Cancer. 88:1239–1247. 2003. View Article : Google Scholar : PubMed/NCBI
|
|
27
|
Lee JY, Kim N, Lee HS, Oh JC, Kwon YH,
Choi YJ, Yoon KC, Hwang JJ, Lee HJ, Lee A, et al: Correlations
among endoscopic, histologic and serologic diagnoses for the
assessment of atrophic gastritis. J Cancer Prev. 19:47–55. 2014.
View Article : Google Scholar : PubMed/NCBI
|
|
28
|
Compare D, Rocco A and Nardone G: Risk
factors in gastric cancer. Eur Rev Med Pharmacol Sci. 14:302–308.
2010.PubMed/NCBI
|
|
29
|
Ding SZ, Goldberg JB and Hatakeyama M:
Helicobacter pylori infection, oncogenic pathways and
epigenetic mechanisms in gastric carcinogenesis. Future Oncol.
6:851–862. 2010. View Article : Google Scholar : PubMed/NCBI
|
|
30
|
Chang YW, Hwangbo Y, Lee JW, Jo SJ, Cho
JH, Shim J, Jang JY, Kim HJ and Kim BH: Clinical parameters
including serum pepsinogen level and management strategy in
patients with premalignant gastric dysplasia. Eur J Gastroenterol
Hepatol. 23:405–410. 2011. View Article : Google Scholar : PubMed/NCBI
|
|
31
|
Shin CM, Kim N, Yang HJ, Cho SI, Lee HS,
Kim JS, Jung HC and Song IS: Stomach cancer risk in gastric cancer
relatives: Interaction between Helicobacter pylori infection
and family history of gastric cancer for the risk of stomach
cancer. J Clin Gastroenterol. 44:e34–e39. 2010. View Article : Google Scholar : PubMed/NCBI
|
|
32
|
El Hajj II, Hashash JG, Baz EM, Abdul-Baki
H and Sharara AI: ABO blood group and gastric cancer: Rekindling an
old fire? South Med J. 100:726–727. 2007. View Article : Google Scholar : PubMed/NCBI
|
|
33
|
Mao Y, Hu J, Semenciw R and White K:
Canadian Cancer Registries Epidemiology Research Group: Active and
passive smoking and the risk of stomach cancer, by subsite, in
Canada. Eur J Cancer Prev. 11:27–38. 2002. View Article : Google Scholar : PubMed/NCBI
|
|
34
|
Kimura KTT and Takemoto T: An endoscopic
recognization of the atrophic border and its significance in
chronic gastritis. Endoscopy. 1:87–97. 1969. View Article : Google Scholar
|
|
35
|
Miike T, Yamamoto S, Miyata Y, Hirata T,
Noda Y, Noda T, Suzuki S, Takeda S, Natsuda S, Sakaguchi M, et al:
Surrounding gastric mucosa findings facilitate diagnosis of gastric
neoplasm as gastric adenoma or early gastric cancer. Gastroenterol
Res Pract. 2016:65276532016. View Article : Google Scholar : PubMed/NCBI
|
|
36
|
Dixon MF, Genta RM, Yardley JH and Correa
P: Classification and grading of gastritis. The updated Sydney
System. International Workshop on the Histopathology of Gastritis,
Houston 1994. Am J Surg Pathol. 20:1161–1181. 1996. View Article : Google Scholar : PubMed/NCBI
|
|
37
|
Kitahara F, Kobayashi K, Sato T, Kojima Y,
Araki T and Fujino MA: Accuracy of screening for gastric cancer
using serum pepsinogen concentrations. Gut. 44:693–697. 1999.
View Article : Google Scholar : PubMed/NCBI
|
|
38
|
Miki K: Gastric cancer screening using the
serum pepsinogen test method. Gastric Cancer. 9:245–53. 2006.
View Article : Google Scholar : PubMed/NCBI
|
|
39
|
Miki K, Fujishiro M, Kodashima S and
Yahagi N: Long-term results of gastric cancer screening using the
serum pepsinogen test method among an asymptomatic middle-aged
Japanese population. Dig Endosc. 21:78–81. 2009. View Article : Google Scholar : PubMed/NCBI
|
|
40
|
Borch K, Axelsson CK, Halgreen H, Nielsen
Damkjaer MD, Ledin T and Szesci PB: The ratio of pepsinogen A to
pepsinogen C: A sensitive test for atrophic gastritis. Scand J
Gastroenterol. 24:870–876. 1989. View Article : Google Scholar : PubMed/NCBI
|
|
41
|
Zhang Z, Sun L, Gong YH, Wang XG, Zhang M
and Yuan Y: Factors affecting the serum gastrin 17 level: An
evidence-based analysis of 3906 serum samples among Chinese. J Dig
Dis. 8:72–76. 2007. View Article : Google Scholar : PubMed/NCBI
|
|
42
|
Sipponen P, Vauhkonen M, Helske T,
Kaariainen I and Harkonen M: Low circulating levels of gastrin-17
in patients with Barrett's esophagus. World J Gastroenterol.
11:5988–5992. 2005. View Article : Google Scholar : PubMed/NCBI
|
|
43
|
Yuan Y: A survey and evaluation of
population-based screening for gastric cancer. Cancer Biol Med.
10:72–80. 2013.PubMed/NCBI
|
|
44
|
Wang X, Ling L, Li S, Qin G, Cui W, Li X
and Ni H: The diagnostic value of gastrin-17 detection in atrophic
gastritis: A meta-analysis. Medicine (Baltimore). 95:e35992016.
View Article : Google Scholar : PubMed/NCBI
|