Introduction
Gingival fibromatosis (GF) is a rare condition of
gingival overgrowth, characterized by a slowly progressive, benign,
localized or generalized fibrous enlargement of maxillary and
mandibular keratinized gingiva (1–3). GF may
co-exist with various genetic syndromes, such as Rutherfurd
syndrome, Cowden syndrome, Zimmerman-Laband syndrome,
Murray-Puretic syndrome and hyaline fibromatosis syndrome, or
occurs as an apparent isolated trait as non-syndromic hereditary GF
(HGF) (1,4–6). HGF, also
known as hereditary gingival hyperplasia or idiopathic gingival
fibromatosis, is the most common genetic form of GF that is
typically transmitted as an autosomal-dominant trait (7,8). HGF
affects males and females equally at an estimated incidence of 1
per 175,000 of the population (1,9). As HGF is
rare and benign, and due to an increase in the number of
non-surgical treatments, it is difficult to collect large samples
of HGF. To date, four loci, namely 2p22.1, 5q13-q22, 2p23.3-p22.3
and 11p15, have been associated with HGF, and a heterozygous
frameshift mutation in Son of sevenless-1 (SOS1) has been reported
as the cause of autosomal-dominant HGF in a family showing linkage
to 2p21 (10). HGF exhibits an
autosomal dominant inheritance pattern, although its penetrance and
expressivity are variable (8).
Indeed, 20% of cases have no family history of the condition
(11). Diagnosis of HGF mainly
depends on medical history, clinical examination, blood tests and
histopathological evaluation of affected gingival tissue (1). However, owing to high genetic
heterogeneity, genetic testing to confirm the diagnosis is not
justified (12). It is therefore
important to identify key signature genes and to understand the
molecular mechanisms underlying HGF.
In the present study, microarray data from Gene
Expression Omnibus (GEO, https://www.ncbi.nlm.nih.gov/geo/) (13) were used to identify differentially
expressed genes (DEGs) in HGF. Subsequently, the identified DEGs
were analyzed for enriched gene ontology (GO) terms and used for
protein-protein interaction (PPI) network construction. Overall,
this aimed to predict HGF-related genes and understand the
molecular mechanisms of HGF.
Materials and methods
Gene expression microarray
datasets
The gene expression microarray data of the GSE4250
dataset (14) were downloaded from
the GEO database. There were 2 normal gingiva samples (normal
gingiva replicate1 and normal gingiva replicate2) and 2 HGF patient
gingiva simples (HGF patient gingiva replicate1 and HGF patient
gingiva replicate2) in GSE4250. The platform of GSE4250 is GPL570:
[HG-U133_Plus_2] Affymetrix Human Genome U133 Plus 2.0 Array.
Preprocessing of raw datasets
The raw gene expression data was preprocessed with R
v3.4.0 (https://www.r-project.org/) (15). All gene expression values were
obtained from the data of GSE4250 using the affy package (16). As some probes correspond to the same
gene symbol, the average of the expression values of these probes
was defined as the expression value of the gene. A total of 20,486
gene symbols were identified following preprocessing.
Screening of DEGs
DEGs of GSE4250 were identified using the limma
package (17) in R. The screening
conditions for DEGs were an adjusted P<0.05 and |log fold change
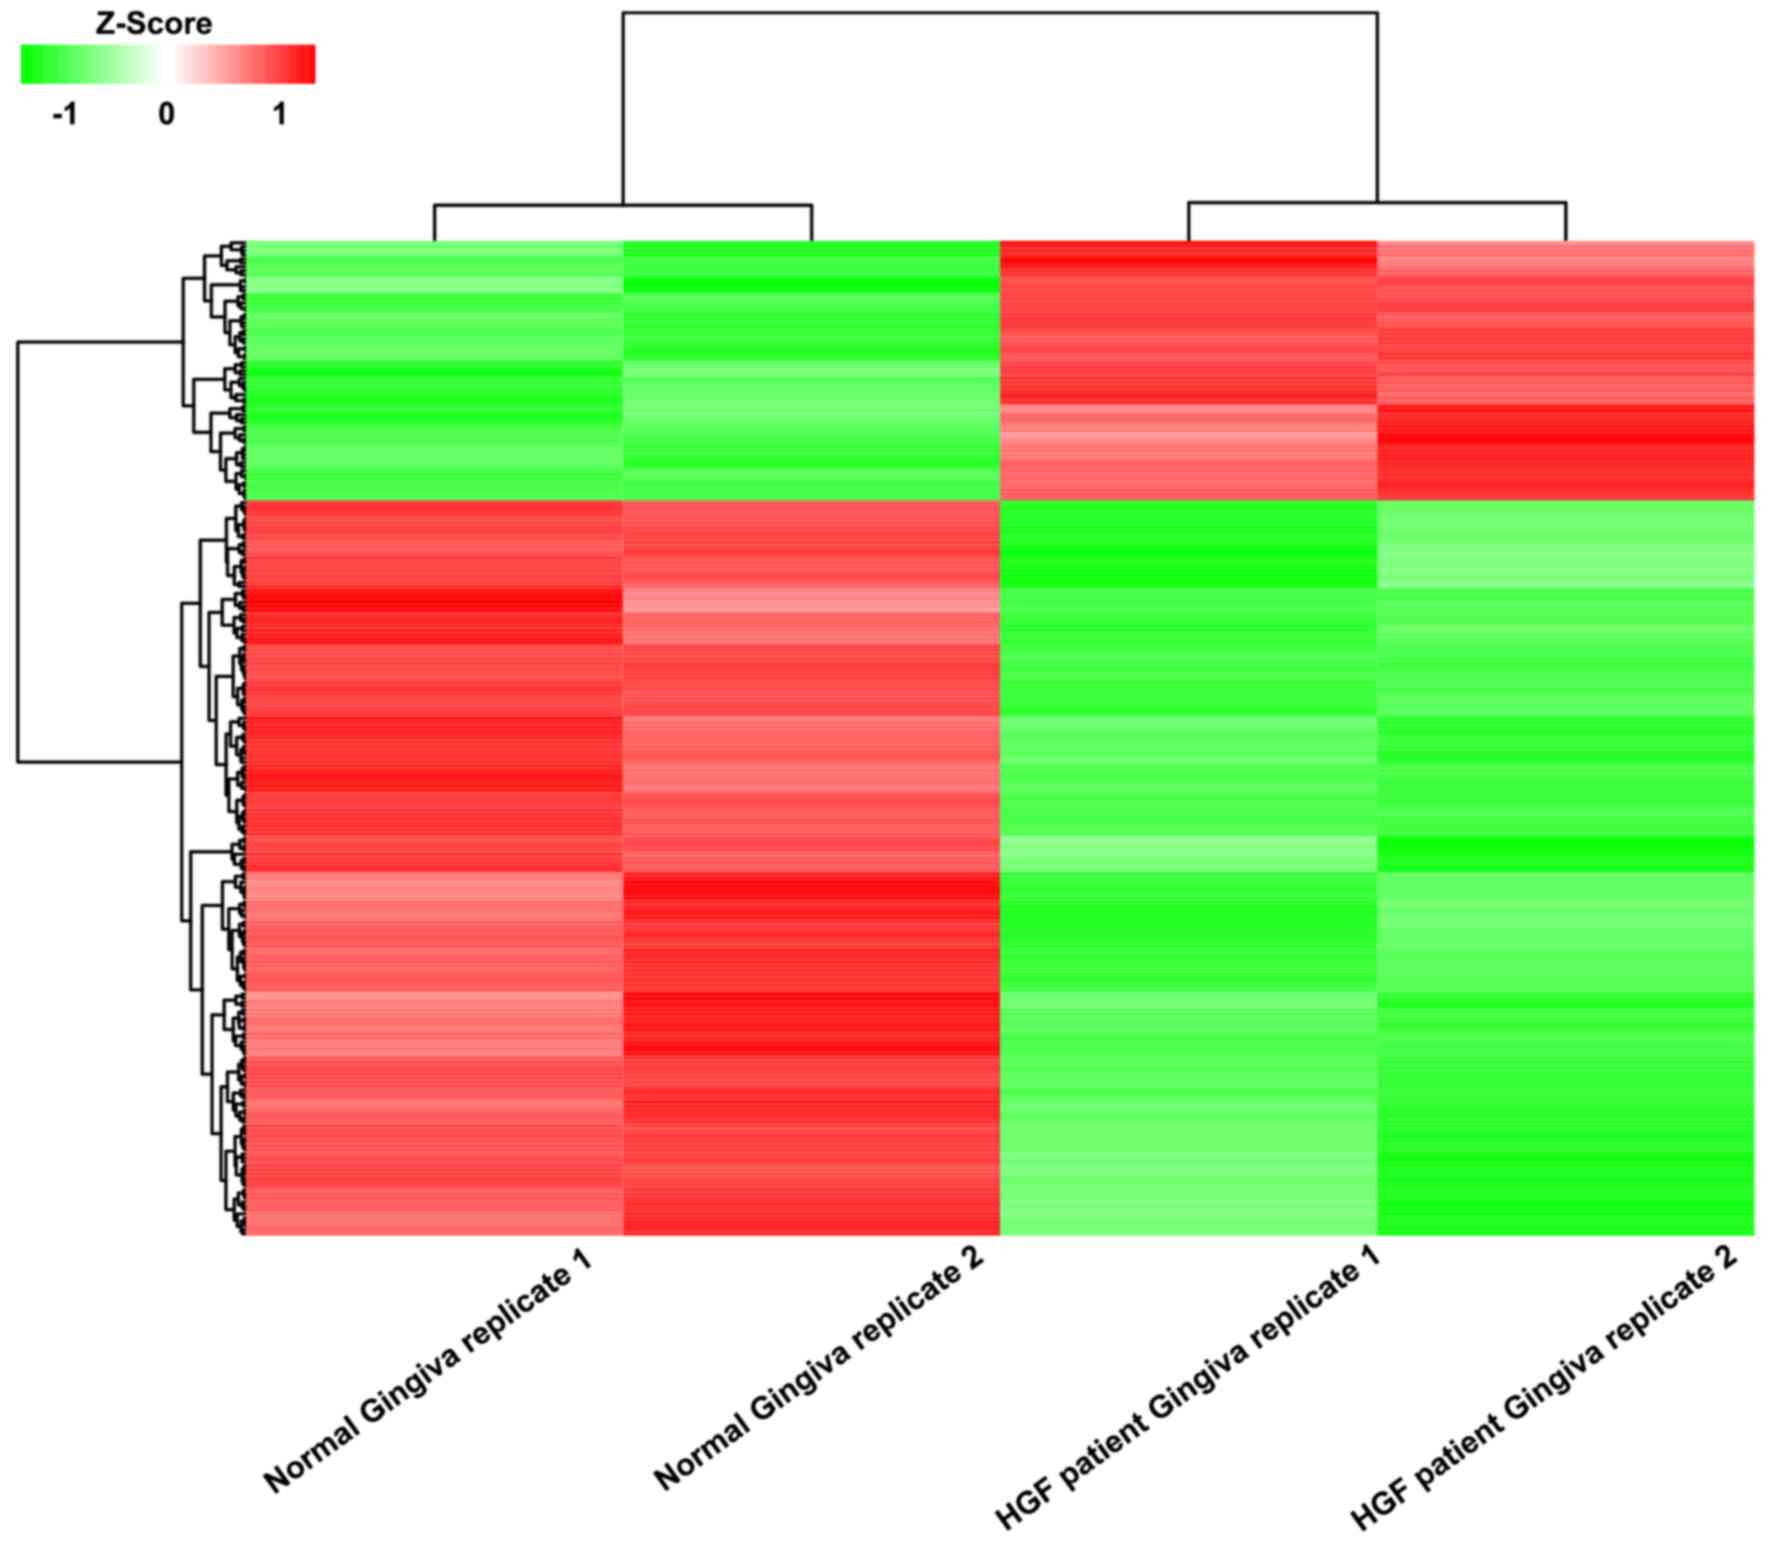
(FC)|>1. The pheatmap package in R was used to generate a
heatmap for the visualization of these DEGs.
Analysis of enriched GO terms and
Kyoto Encyclopedia of Genes and Genomes (KEGG) pathways
Following DEG screening, the Database for
Annotation, Visualization and Integrated Discovery (DAVID) v6.8
(https://david.ncifcrf.gov/) (18) was used to determine the enriched GO
terms and Kyoto Encyclopedia of Genes and Genomes (KEGG) pathways
of the DEGs. The enriched GO terms and KEGG pathways with P<0.05
were selected.
Construction of PPI network
The STRING database (http://string-db.org/) (19) was used for PPI network construction.
The minimum required interaction score was set to 0.4 as default.
Subsequently, Cytoscape software v3.5.0 (http://www.cytoscape.org/index.html) (20) was used for visualization of the PPI
network, in which nodes represented genes and edges represented
interactions between genes. The degree of a node was defined as the
number of direct interactions between the corresponding gene and
others in the network. Core genes were selected for based on a node
degree ≥5.
Results
DEGs
A total of 249 DEGs were identified from the gene
expression microarray data of GSE4250 by comparing the HGF patient
gingiva simples to the normal gingiva samples. There were 65
upregulated genes and 184 downregulated genes among these DEGs
(Fig. 1). The top 10 up- and
downregulated genes of the DEGs according to logFC are listed in
Table I.
 | Table I.Top 10 up- and downregulated
differentially expressed genes in GSE4250. |
Table I.
Top 10 up- and downregulated
differentially expressed genes in GSE4250.
|
| Gene symbol | LogFC | P-value |
|---|
| Upregulated | KRT2 | 3.943554 | 7.57E-04 |
|
| DSC1 | 3.942499 | 5.26E-07 |
|
| CLDN20 | 3.715159 | 6.95E-07 |
|
| ABCA12 | 3.460847 | 1.78E-05 |
|
| LCE2B | 3.324958 | 6.41E-07 |
|
| HTR3A | 3.267399 | 1.83E-06 |
|
| TGM7 | 2.900429 | 7.42E-04 |
|
| AADACL2 | 2.487881 | 3.00E-04 |
|
| BAMBI | 2.450982 | 1.18E-05 |
|
| ISL1 | 2.382094 | 8.71E-05 |
| Downregulated | MYBPC1 | −4.429606 | 4.09E-02 |
|
| PLA2G2A | −4.354675 | 2.16E-02 |
|
| IGFL1 | −4.214503 | 4.66E-02 |
|
| CLCA4 | −4.092624 | 1.27E-02 |
|
| SERPINB4 | −3.554999 | 3.53E-02 |
|
| ANXA3 | −3.422065 | 4.39E-02 |
|
| GYS2 | −3.417237 | 3.18E-02 |
|
| CXCL6 | −3.390147 | 4.62E-02 |
|
| ECM1 | −2.728271 | 3.91E-02 |
|
| ADIRF | −2.386218 | 3.53E-02 |
Enriched GO terms of the DEGs
A total of 28 enriched GO terms were determined for
the DEGs using the DAVID functional annotation tool. Table II lists the top 10 enriched GO terms
of the DEGs according to the counts of genes; these terms were
‘plasma membrane’, ‘extracellular exosome’, ‘extracellular region’,
‘extracellular space’, ‘structural molecule activity’, ‘apical
plasma membrane’, ‘endosome’, ‘structural constituent of
cytoskeleton’, ‘keratinocyte differentiation’ and ‘peptide
cross-linking’.
| Table II.Top 10 enriched GO terms of
differentially expressed genes in GSE4250. |
Table II.
Top 10 enriched GO terms of
differentially expressed genes in GSE4250.
| Category | Term | Description | Count | P-value |
|---|
| CC | GO:0005886 | Plasma membrane | 58 | 2.48E-02 |
| CC | GO:0070062 | Extracellular
exosome | 56 | 5.82E-06 |
| CC | GO:0005576 | Extracellular
region | 32 | 1.24E-03 |
| CC | GO:0005615 | Extracellular
space | 25 | 1.14E-02 |
| MF | GO:0005198 | Structural molecule
activity | 13 | 1.56E-05 |
| CC | GO:0016324 | Apical plasma
membrane | 10 | 4.64E-03 |
| CC | GO:0005768 | Endosome | 8 | 1.15E-02 |
| MF | GO:0005200 | Structural
constituent of cytoskeleton | 7 | 1.23E-03 |
| BP | GO:0030216 | Keratinocyte
differentiation | 7 | 1.90E-04 |
| BP | GO:0018149 | Peptide
cross-linking | 7 | 1.75E-05 |
KEGG pathway analysis was also attempted for the
DEGs, but no significant pathways were identified.
PPI network of the DEGs
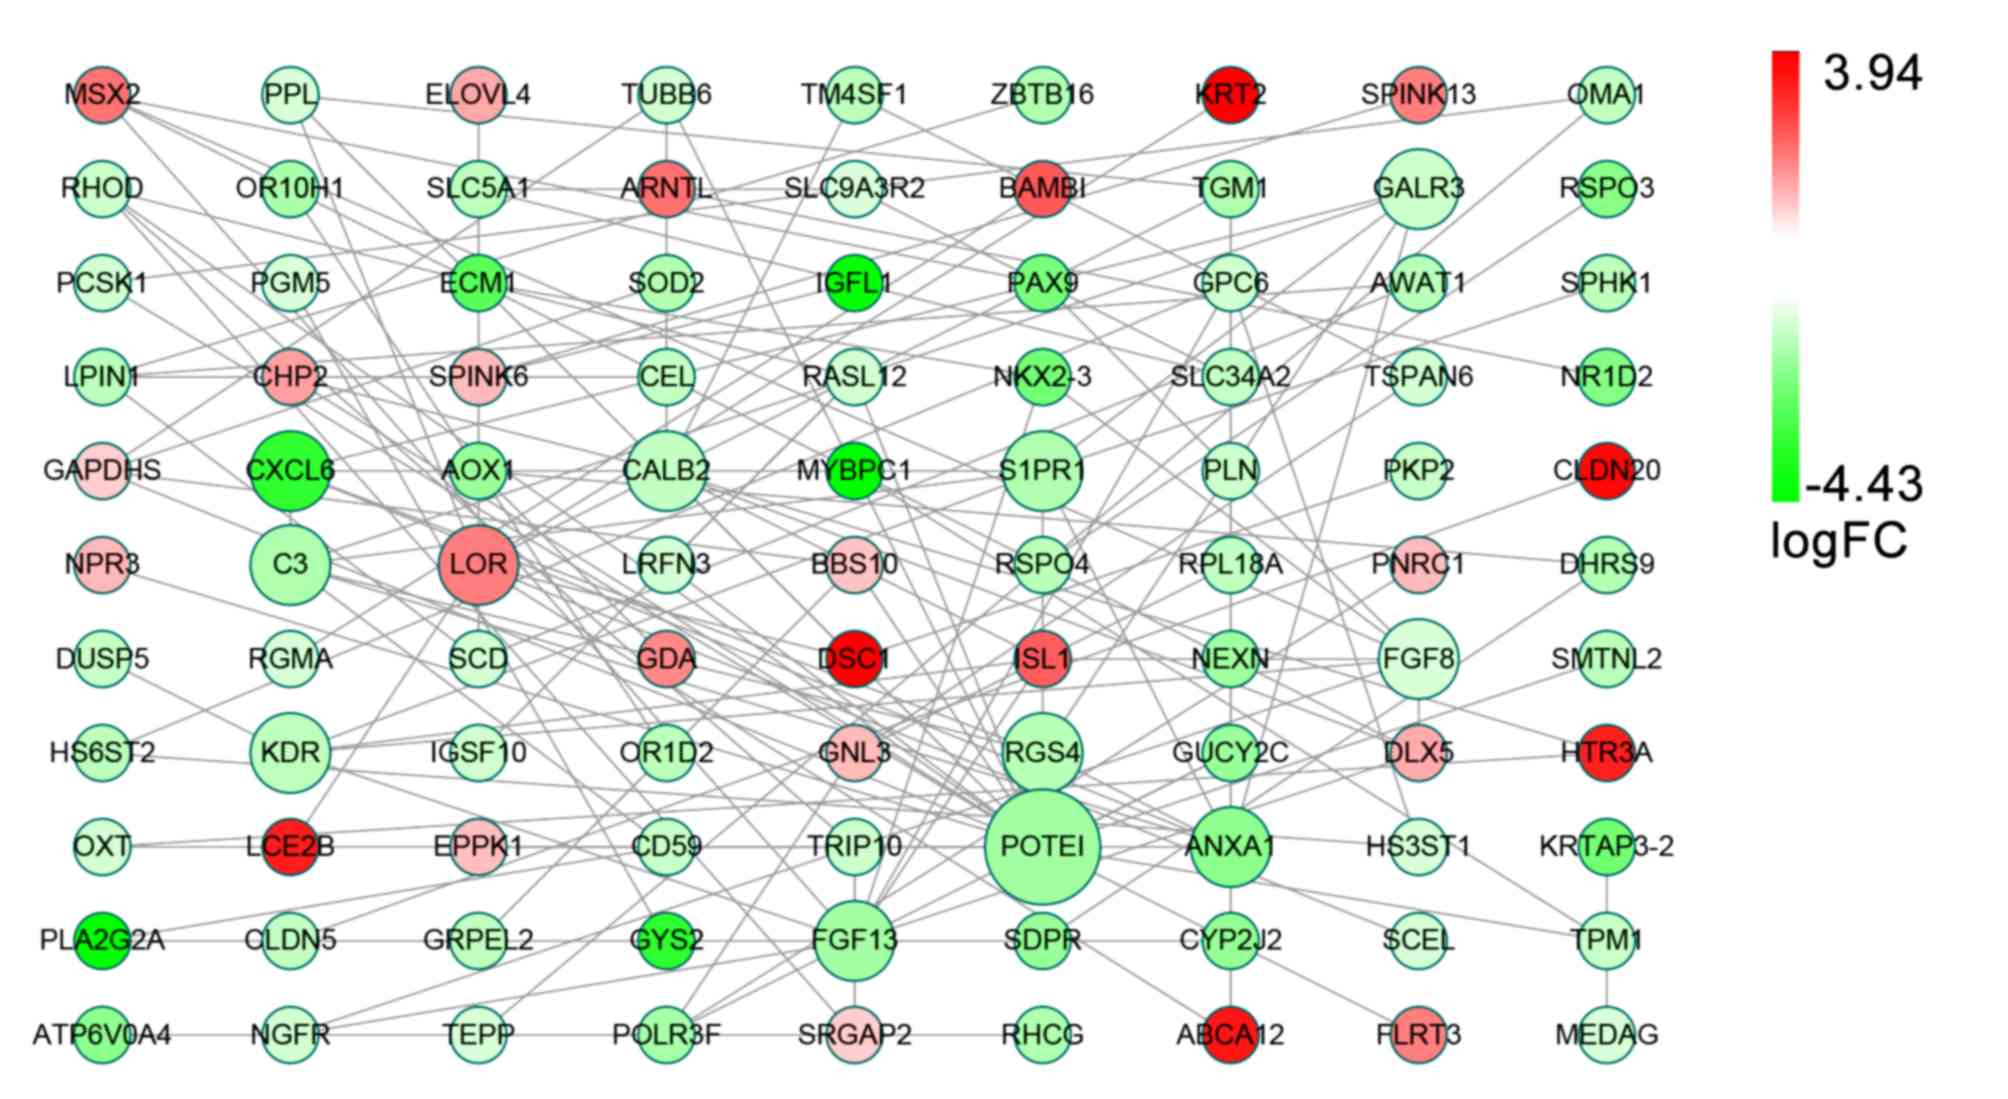
There were 99 nodes and 118 edges in the PPI network
of the DEGs generated using STRING (Fig.
2). Among these nodes, 12 core genes were identified, of which
the highest degree node was the gene for POTE ankyrin domain family
member I (POTEI). The other core genes were calbindin 2 (CALB2),
fibroblast growth factor 13 and 8 (FGF13/8), loricrin (LOR),
sphingosine-1-phosphate receptor 1 (S1PR1), Annexin A1 (ANXA1),
complement C3 (C3), C-X-C motif chemokine ligand 6 (CXCL6), galanin
receptor 3 (GALR3), kinase insert domain receptor (KDR) and
regulator of G protein signaling 4 (RGS4; Table III).
| Table III.Differentially expressed genes in the
protein-protein interaction network and their corresponding
degree. |
Table III.
Differentially expressed genes in the
protein-protein interaction network and their corresponding
degree.
| Gene | Degree | Gene | Degree | Gene | Degree |
|---|
| POTEI | 15 | CHP2 | 2 | FLRT3 | 1 |
| CALB2 | 7 | DHRS9 | 2 | GDA | 1 |
| FGF13 | 7 | GUCY2C | 2 | GRPEL2 | 1 |
| FGF8 | 7 | HS3ST1 | 2 | GYS2 | 1 |
| LOR | 7 | HS6ST2 | 2 | IGFL1 | 1 |
| S1PR1 | 7 | HTR3A | 2 | IGSF10 | 1 |
| ANXA1 | 6 | LRFN3 | 2 | KRT2 | 1 |
| C3 | 6 | NGFR | 2 | KRTAP3-2 | 1 |
| CXCL6 | 5 | OMA1 | 2 | LCE2B | 1 |
| GALR3 | 5 | OXT | 2 | MEDAG | 1 |
| KDR | 5 | PAX9 | 2 | MYBPC1 | 1 |
| RGS4 | 5 | PCSK1 | 2 | NEXN | 1 |
| DLX5 | 4 | PLA2G2A | 2 | NPR3 | 1 |
| GAPDHS | 4 | SLC34A2 | 2 | NR1D2 | 1 |
| ISL1 | 4 | SLC5A1 | 2 | OR10H1 | 1 |
| LPIN1 | 4 | SLC9A3R2 | 2 | OR1D2 | 1 |
| MSX2 | 4 | SPINK6 | 2 | PGM5 | 1 |
| RASL12 | 4 | SRGAP2 | 2 | PKP2 | 1 |
| RHOD | 4 | TM4SF1 | 2 | PLN | 1 |
| BBS10 | 3 | TPM1 | 2 | PNRC1 | 1 |
| DSC1 | 3 | TRIP10 | 2 | RGMA | 1 |
| GNL3 | 3 | TSPAN6 | 2 | RHCG | 1 |
| GPC6 | 3 | ARNTL | 1 | RPL18A | 1 |
| NKX2-3 | 3 | ATP6V0A4 | 1 | RSPO3 | 1 |
| POLR3F | 3 | BAMBI | 1 | RSPO4 | 1 |
| PPL | 3 | CEL | 1 | SCEL | 1 |
| SCD | 3 | CLDN20 | 1 | SDPR | 1 |
| TGM1 | 3 | CLDN5 | 1 | SMTNL2 | 1 |
| TUBB6 | 3 | CYP2J2 | 1 | SOD2 | 1 |
| ABCA12 | 2 | DUSP5 | 1 | SPHK1 | 1 |
| AOX1 | 2 | ECM1 | 1 | SPINK13 | 1 |
| AWAT1 | 2 | ELOVL4 | 1 | TEPP | 1 |
| CD59 | 2 | EPPK1 | 1 | ZBTB16 | 1 |
Discussion
In the current periodontal diseases and conditions
classification, which was developed by Armitage in 1999 (21), HGF is defined a benign,
non-hemorrhagic and fibrous gingival overgrowth that may cover all
or part of the teeth. HGF is also one of the subtypes of gingival
lesions of genetic origin among gingival diseases (6,22,23). HGF gingiva is typically pink in color
and has a fibrous appearance and marked stippling without signs of
inflammation, and covers the teeth partially or totally with a
variable degree of severity, without affecting the bone (6,23–26). It generally interferes with speech,
lip closure and chewing, and may also become a psychological burden
by affecting the self-esteem of patients (6). HGF presents an autosomal dominant
inheritance pattern, although its penetrance and expressivity are
variable. However, owing to high genetic heterogeneity, genetic
testing to confirm the diagnosis is not justified. Thus, it is
important to identify the key signature genes and to understand the
molecular mechanisms of HGF. As an important discipline of
biological science, bioinformatics analysis employs scientific
resources for research purposes (27), and is considered an efficient method
for predicting disease-related genes.
In the present study, 249 DEGs were identified,
consisting of 65 upregulated and 184 downregulated genes, in the
GSE4250 dataset. Notably, among the top 10 upregulated genes of the
DEGs, the gene encoding bone morphogenetic protein and activin
membrane bound inhibitor has previously been associated with
fibromatosis (28). The DEGs were
subsequently assessed by GO enrichment and PPI network analyses.
The top 10 enriched GO terms of the DEGs were ‘plasma membrane’,
‘extracellular exosome’, ‘extracellular region’, ‘extracellular
space’, ‘structural molecule activity’, ‘apical plasma membrane’,
‘endosome’, ‘structural constituent of cytoskeleton’, ‘keratinocyte
differentiation’ and ‘peptide cross-linking’. These results
indicated that HGF-related enriched GO terms are principally
associated with cell growth and tissue hyperplasia. Histologically,
HGF is characterized by the growth and hyperplasia of gingival
epithelial cells (22). Straka et
al (29) observed in HGF that
some collagen fibrils exhibited loops in the gingival lamina
propria and identified the presence of empty perinuclear space in
the cytoplasm of epithelial cells. These findings may relate to the
enriched GO terms. The GO enrichment may indicate targets for
research and guide studies on HGF-related genes based on the
enriched GO terms. KEGG pathways were also evaluated based on the
DEGs, but no significant pathways were identified. The method of
DEG screening or the algorithms of the tools used may have lead to
this result. From the PPI network of the DEGs, 12 core genes were
identified that may serve critical roles in HGF. Among these core
genes, POTEI had the highest node degree. However, to the best of
our knowledge, there are no reports on the potential role of POTEI
in HGF, though this may be due to the general lack of studies on
HGF-related genes. Furthermore, while it has not been reported that
CALB2, is directly associated with HGF, Barak et al
(30) documented that calretinin
encoded by the CALB2 gene may be an important immunohistochemical
marker in other benign and malignant fibromatosis. The FGF family
also serve an important role in fibroblast growth (31). Meanwhile, Lee et al (32) reported that LOR was important in
keratinocyte differentiation in a study on the cell envelope of
normal human oral keratinocytes. C3 has also been associated with
fibrous papule development (33).
Although reports on the functions of these core genes are limited,
they may serve important roles in HGF.
In the present study, genes reported previously,
including SOS1 (10),
calcium/calmodulin-dependent protein kinase IV and adenosine
triphosphate-binding cassette subfamily A member 5 (1), were not identified. This may have been
due to the tools employed and the restricted screening parameters,
as well as the limited scope of research on HGF. A crucial
limitation of the present study was the small number of samples
with and without HGF. Therefore, larger datasets and further
experiments, for instance using reverse transcription-quantitative
polymerase chain reaction, are required to validate the present
results. Bioinformatics analysis is an efficient method for
predicting potential diagnostic and therapeutic targets. However,
the increased number of data mining and analytical tools and
algorithms poses a challenge (34),
as results for the same data using different bioinformatics tools
may vary. Furthermore, the predictions require verification through
experimental and clinical methods.
In summary, the prediction of potential diagnostic
and therapeutic targets in diseases using bioinformatics methods is
an efficient strategy in clinical research, though also poses a
number of challenges. In the present study, a public dataset of GEO
was used to analyze the potential diagnostic and therapeutic
targets of HGF. The current predictions of potential diagnostic and
therapeutic targets now require verification through experimental
methods in cell and animal models prior to clinical trials.
References
|
1
|
Gawron K, Łazarz-Bartyzel K, Potempa J and
Chomyszyn-Gajewska M: Gingival fibromatosis: Clinical, molecular
and therapeutic issues. Orphanet J Rare Dis. 11:92016. View Article : Google Scholar
|
|
2
|
Jayachandran M, Kapoor S and Mahesh R:
Idiopathic gingival fibromatosis rehabilitation: A case report with
two-year followup. Case Rep Dent. 2013:5131532013.
|
|
3
|
Mohan RP, Verma S, Agarwal N and Singh U:
Non-syndromic hereditary gingival fibromatosis. BMJ Case Rep.
2013:pii: bcr2012008542. 2013. View Article : Google Scholar
|
|
4
|
Tripathi AK, Dete G, Saimbi CS and Kumar
V: Management of hereditary gingival fibromatosis: A 2 years
follow-up case report. J Indian Soc Periodontol. 19:342–344. 2015.
View Article : Google Scholar
|
|
5
|
Zhou M, Xu L and Meng HX: Diagnosis and
treatment of a hereditary gingival fibromatosis case. Chin J Dent
Res. 14:155–158. 2011.
|
|
6
|
Häkkinen L and Csiszar A: Hereditary
gingival fibromatosis: Characteristics and novel putative
pathogenic mechanisms. J Dent Res. 86:25–34. 2007. View Article : Google Scholar
|
|
7
|
Takagi M, Yamamoto H, Mega H, Hsieh KJ,
Shioda S and Enomoto S: Heterogeneity in the gingival fibromatoses.
Cancer. 68:2202–2212. 1991. View Article : Google Scholar
|
|
8
|
Majumder P, Nair V, Mukherjee M, Ghosh S
and Dey SK: The autosomal recessive inheritance of hereditary
gingival fibromatosis. Case Rep Dent. 2013:4328642013.
|
|
9
|
Odessey EA, Cohn AB, Casper F and
Schechter LS: Hereditary gingival fibromatosis: Aggressive 2-stage
surgical resection in lieu of traditional therapy. Ann Plast Surg.
57:557–560. 2006. View Article : Google Scholar
|
|
10
|
Hart TC, Zhang Y, Gorry MC, Hart PS,
Cooper M, Marazita ML, Marks JM, Cortelli JR and Pallos D: A
mutation in the SOS1 gene causes hereditary gingival fibromatosis
type 1. Am J Hum Genet. 70:943–954. 2002. View Article : Google Scholar
|
|
11
|
Harrison M, Odell EW, Agrawal M,
Saravanamuttu R and Longhurst P: Gingival fibromatosis with
prune-belly syndrome. Oral Surg Oral Med Oral Pathol Oral Radiol
Endod. 86:304–307. 1998. View Article : Google Scholar
|
|
12
|
Ye X, Shi L, Yin W, Meng L, Wang QK and
Bian Z: Further evidence of genetic heterogeneity segregating with
hereditary gingival fibromatosis. J Clin Periodontol. 36:627–633.
2009. View Article : Google Scholar
|
|
13
|
Clough E and Barrett T: The Gene
Expression Omnibus Database. Methods Mol Biol. 1418:93–110. 2016.
View Article : Google Scholar
|
|
14
|
Zhu Y, Zhang W, Huo Z, Zhang Y, Xia Y, Li
B, Kong X and Hu L: A novel locus for maternally inherited human
gingival fibromatosis at chromosome 11p15. Hum Genet. 121:113–123.
2007. View Article : Google Scholar
|
|
15
|
Team RDC: R: A Language and Environment
for Statistical. Computing. 14:12–21. 2011.
|
|
16
|
Gautier L, Cope L, Bolstad BM and Irizarry
RA: affy-analysis of Affymetrix GeneChip data at the probe level.
Bioinformatics. 20:307–315. 2004. View Article : Google Scholar
|
|
17
|
Ritchie ME, Phipson B, Wu D, Hu Y, Law CW,
Shi W and Smyth GK: limma powers differential expression analyses
for RNA-sequencing and microarray studies. Nucleic Acids Res.
43:e472015. View Article : Google Scholar
|
|
18
|
Huang W, Sherman BT and Lempicki RA:
Systematic and integrative analysis of large gene lists using DAVID
bioinformatics resources. Nat Protoc. 4:44–57. 2009. View Article : Google Scholar
|
|
19
|
Szklarczyk D, Franceschini A, Wyder S,
Forslund K, Heller D, Huerta-Cepas J, Simonovic M, Roth A, Santos
A, Tsafou KP, et al: STRING v10: Protein-protein interaction
networks, integrated over the tree of life. Nucleic Acids Res.
43:(D1). D447–D452. 2015. View Article : Google Scholar
|
|
20
|
Su G, Morris JH, Demchak B and Bader GD:
Biological network exploration with Cytoscape 3. Curr Protoc
Bioinformatics. 47:1–24. 2014.
|
|
21
|
Armitage GC: Development of a
classification system for periodontal diseases and conditions. Ann
Periodontol. 4:1–6. 1999. View Article : Google Scholar
|
|
22
|
Coletta RD and Graner E: Hereditary
gingival fibromatosis: A systematic review. J Periodontol.
77:753–764. 2006. View Article : Google Scholar
|
|
23
|
Tipton DA, Howell KJ and Dabbous MK:
Increased proliferation, collagen, and fibronectin production by
hereditary gingival fibromatosis fibroblasts. J Periodontol.
68:524–530. 1997. View Article : Google Scholar
|
|
24
|
Ramer M, Marrone J, Stahl B and Burakoff
R: Hereditary gingival fibromatosis: identification, treatment,
control. Journal of the American Dental Association. 127:493–495.
1996. View Article : Google Scholar : PubMed/NCBI
|
|
25
|
Laband PF, Habib G and Humphreys GS:
Hereditary gingival fibromatosis. report of an affected family with
associated splenomegaly and skeletal and soft-tissue abnormalities.
Oral Surg Oral Med Oral Pathol. 17:339–351. 1964. View Article : Google Scholar : PubMed/NCBI
|
|
26
|
Araujo CS, Graner E, Almeida OP, Sauk JJ
and Coletta RD: Histomorphometric characteristics and expression of
epidermal growth factor and its receptor by epithelial cells of
normal gingiva and hereditary gingival fibromatosis. J Periodontal
Res. 38:237–241. 2003. View Article : Google Scholar : PubMed/NCBI
|
|
27
|
Karikari TK: Bioinformatics in Africa: The
Rise of Ghana? PLOS Comput Biol. 11:e10043082015. View Article : Google Scholar : PubMed/NCBI
|
|
28
|
Kitazawa S, Kitazawa R, Obayashi C and
Yamamoto T: Desmoid tumor with ossification in chest wall: possible
involvement of BAMBI promoter hypermethylation in metaplastic bone
formation. J Bone Miner Res. 20:1472–1477. 2005. View Article : Google Scholar : PubMed/NCBI
|
|
29
|
Straka M, Danisovic L, Bzduch V, Polak S
and Varga I: The significance of electron microscopic examination
of gingiva in cases of Hunter syndrome and hereditary gingival
fibromatosis. Neuro Endocrinol Lett. 37:353–360. 2016.PubMed/NCBI
|
|
30
|
Barak S, Wang Z and Miettinen M:
Immunoreactivity for calretinin and keratins in desmoid
fibromatosis and other myofibroblastic tumors: A diagnostic
pitfall. Am J Surg Pathol. 36:1404–1409. 2012. View Article : Google Scholar : PubMed/NCBI
|
|
31
|
Ornitz DM and Itoh N: The Fibroblast
Growth Factor signaling pathway. Wiley Interdiscip Rev Dev Biol.
4:215–266. 2015. View
Article : Google Scholar : PubMed/NCBI
|
|
32
|
Lee CH, Marekov LN, Kim S, Brahim JS, Park
MH and Steinert PM: Small proline-rich protein 1 is the major
component of the cell envelope of normal human oral keratinocytes.
FEBS Lett. 477:268–272. 2000. View Article : Google Scholar : PubMed/NCBI
|
|
33
|
Torre K, Larsen A, Kristjansson A and
Murphy M: Basal cell carcinoma, arising within a granular cell-type
fibrous papule. J Cutan Pathol. 43:1245–1247. 2016. View Article : Google Scholar : PubMed/NCBI
|
|
34
|
Charoentong P, Angelova M, Efremova M,
Gallasch R, Hackl H, Galon J and Trajanoski Z: Bioinformatics for
cancer immunology and immunotherapy. Cancer Immunol Immunother.
61:1885–1903. 2012. View Article : Google Scholar : PubMed/NCBI
|