Introduction
The incidence of colon cancer has significantly
increased in China over the past decade, it is now the fourth most
common cancer in China (1,2). Clinical evidence supports the belief
that the majority of colon cancer arises from precursor lesions and
benign adenomatous polyps, that is, the classical adenoma-carcinoma
sequence (ACS (3). ACS is a series
of events whereby colorectal adenomas develop, initially showing
low grade dysplasia, from which some will progress to develop areas
of high grade dysplasia and eventually invasive carcinoma. In tumor
development, angiogenesis is an important stage, by which solid
tumor cells gain access to nutrients and oxygen via an increase in
vital blood supply (4). The degree
of angiogenesis in malignant tissues is a prognostic factor for
colon cancer. Angiogenesis inhibitors offer a novel approach for
colon cancer therapy (5).
A previous study demonstrated that carcinoma
angiogenesis in cancer occurs at the stage of precancerous lesions
(3). Measurement of microvessel
density (MVD) is the typical index used to evaluate angiogenesis;
insulin-like growth factor 1 (IGF-1), signal transcription factors
and signal transducer and activator of transcription 3 (STAT3) can
promote angiogenesis (6–8). The present uses endoscopy to improve
the observation of angiogenesis, while microvascular morphology on
the mucosal surface is observed using narrow band imaging (NBI).
The study aimed to observe the expression of MVD, IGF-1 and STAT3
in the process of colonic polyp carcinogenesis and in preneoplastic
lesion tissues, and to investigate the correlation of microvascular
morphology using NBI. In addition, the current study explored the
feasibility of identifying angiogenesis using endoscopic real-time
observation.
Materials and methods
Patient characteristics
All patients presented at the endoscopy room of the
Department of Digestion at Beijing Shijitan Hospital, Capital
Medical University (CMU; Beijing, China) between August 2011 and
December 2011. The patients had an average age of 61.5 years
(range, 30–89 years), including 36 males and 28 females. All
patients were diagnosed with colonic polyps lesions by common
endoscopy and NBI, and these were confirmed as colonic early
colorectal carcinoma and colonic adenoma by histopathology. The
patients with negative colonoscopy results were included and
confirmed by polyp biopsy, high frequency electrocutting or
surgery. The patients with ulcerative colitis, familial adenomatous
polypesis, serrated adenoma and developing colon carcinoma were
excluded from the study. Informed consent was obtained from all
patients and controls. Written approval for the study was obtained
from the Beijing Shijitan Hospital, CMU.
Equipment
The included patients were examined using an NBI
endoscope (CF-H260; Olympus Corporation, Tokyo, Japan). The
processor type was CV-260SL (Olympus Corporation) with 1280×1024
resolution display, double-band filter of NBI (415 nm and 540 nm),
structure (A1-A5) and contour emphasis (B1-B5).
Methods
The preparation of NBI endoscope examination was the
same to common colonoscopy. The endoscopy reached the ileocecal
junction, the terminal intestine and finally the caecum by
identification of the appendix, the plica of Y-type cecum and the
structures of the ileocecal valve. The endoscope was then drawn out
and the colon was observed. Microvascular morphology on the polyp
surface was identified according to an NBI model. The lesions were
removed by biopsy, endoscopic mucosal resection, endoscopic
submucosal dissection or surgery. A sample of biopsy specimen from
the boundary between the rectum and the sigmoid colon was obtained
from patients with normal colonic mucosa, as the normal mucosa. The
specimens were fixed by formaldehyde and embedded by paraffin, then
cut into serial sections (4 µm). Hematoxylin and eosin staining and
histopathological examination were then performed. CD34, IGF-1 and
STAT3 (primary antibodies were obtained from Abcam, Cambridge, UK)
were detected by immunohistochemical staining according to the
specification (9). The histological
diagnoses were performed accorded to the criteria of the World
Health Organization (10), and was
performed separately by two pathologists who were blinded to the
endoscopy results.
Immunohistochemical analysis
Weidner (11)
criteria for analysis were used. IGF-1 and STAT3 protein staining
were analyzed semi-quantitatively. Stained cells were counted under
a light microscope (magnification, ×400) and the percentage of
stained cells was counted in 5 visual fields. The average was then
calculated and divided according to the scoring levels: Without
positively-stained cells, 0; <25% positively-stained cells, 1;
26–50% positively-stained cells, 2; >50% positively-stained
cells, 3.
Briefly, IGF-1 and CD34 were used to marker MVD, and
a ChemMate EnVision + horseradish peroxidase (HRP)/DAB kit
(GK500705; Dako Corp., Troy, MI, USA) was used for
immunohistochemical staining. Paraffin-embedded tissue samples were
sliced into 4-µm sections and heated in the thermostatic oven at
75°C for 60 min. Dimethyl benzene was added to the samples to
remove paraffin after cooling for 5 min and the samples were
subsequently treated with an alcohol series (100, 90 and 80%
ethanol) for 5 min. Antigen retrieval was performed in a microwave
using sodium citrate solution with EDTA solution for 10 min. Slices
were washed with PBS three times after cooling for 30 min/2 min,
and were incubated with 3% H2O2 for 10 min at
room temperature to completely eliminate endogenous peroxidase.
Following washing three times with PBS, the samples were incubated
with anti-IGF-1 (ab9572) and anti-CD34 (ab81289) primary antibodies
(both 1:100; Abcam) for 60 min in a wet box at 37°C, and were
washed three times with PBS prior to secondary antibody incubation
with ChemMate EnVision + HRP for 30 min at 37°C. Following washing
with PBS thrice, DAB working solution was added to the samples in a
wet box. Sterile water was used to wash the samples in order to
terminate the reaction prior to counter staining for one minute
with hematoxylin. Finally, the slides were dehydrated with an
ethanol series for one minute (75, 80 and 100%) and observed under
a microscope. Images were captured and analyzed. In the negative
control group, PBS was used instead of the primary antibody.
Evaluation of microvesicular
morphology by NBI
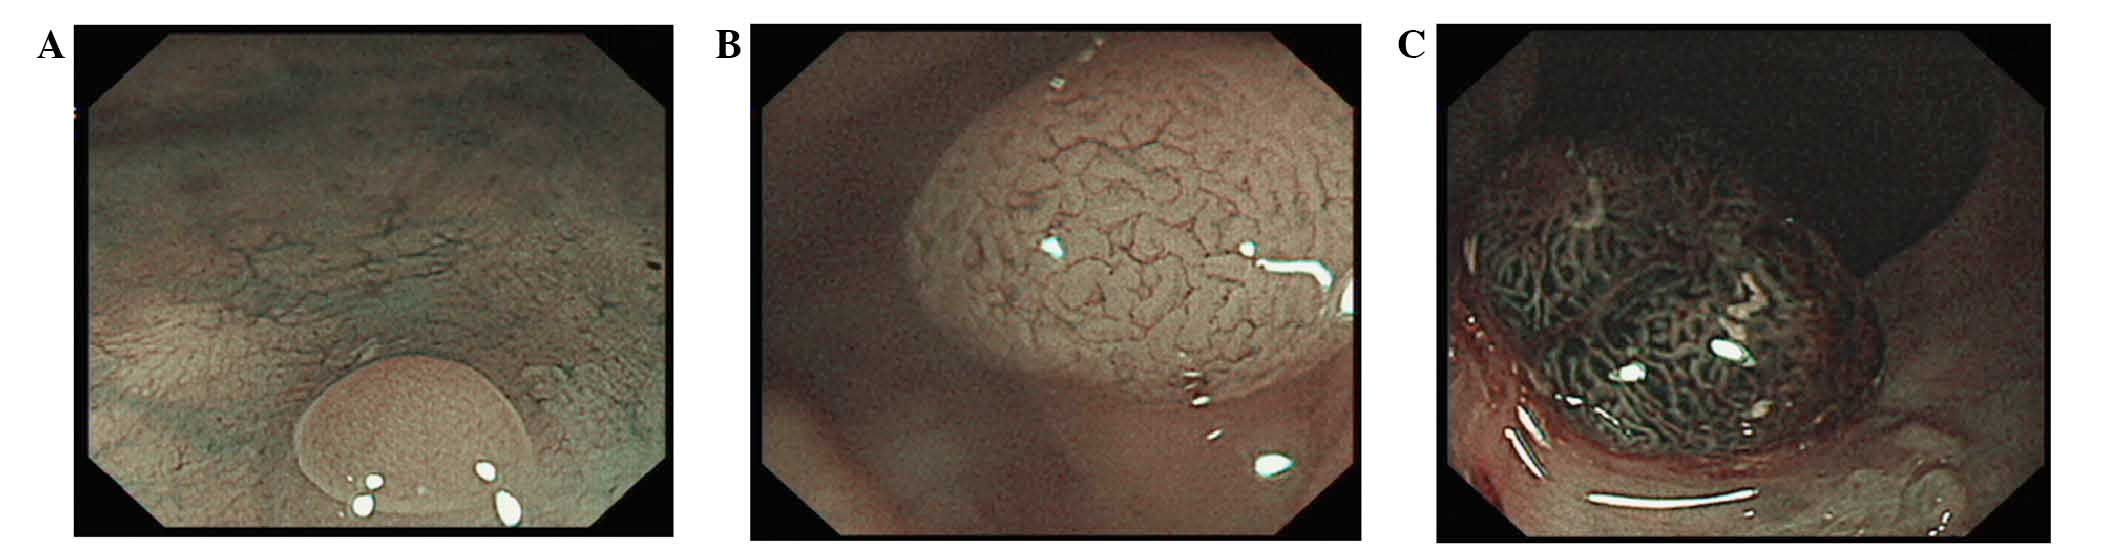
The microvascular morphology included three types:
Type I, no visible microvasculature pattern; type II,
microvasculaturearranged along the crypts with an even diameter;
and type III, microvasculature irregularly arranged with and uneven
diameter (Fig. 1A-C). The
microvasculature type of each polyp was recorded under endoscopy
and compared with the results of immunohistochemistry, and any
correlation between the two was identified.
Statistical analysis
All the data were analyzed by SAS analysis software
(version 9.10; SAS Institute, Inc., Cary, NC, USA). All the
measurement data were represented as the mean ± standard deviation.
P<0.05 was considered to indicate a statistically significant
difference. The differences of the expression levels of MVD, IGF-1
and STAT3 among groups were analyzed by one-way analysis of
variance, and multiple comparisons were analyzed by
Student-Newman-Keuls. The correlation between endoscopic
classification and pathological examination was analyzed by
non-parametric Spearman's Rank correlation analysis.
Results
Patient colon characteristics
In the present study, there were 38 patients with a
total of 44 colon lesions and 20 normal colons. A total of 15
colonic early colorectal carcinoma and 29 colonic adenoma were
identified in the 44 colon lesions, including 19 low-grade
intraepithelial neoplasia, 10 high-grade intraepithelial neoplasia,
14 tubular adenoma and 15 villous adenomas. The histological type
and endoscopic type of colorectal lesions are presented in Table I.
 | Table I.Histological type and endoscopic type
of colorectal lesions. |
Table I.
Histological type and endoscopic type
of colorectal lesions.
| Lesions | Colon lesions
(n=44) |
|---|
| Average, cm | 1.44 |
| Early
colorectal carcinoma | 1.87 |
| Colonic
adenoma | 1.06 |
| Lesion site
number |
|
| Right
colon | 18 |
| Left
colon | 26 |
| Morphology
number |
|
| Eminency
type | 23 |
|
Superficial type | 19 |
| Depressed
type | 2 |
Correlation between NBI and
histopathological types
According to the NBI types, there were 25 of type I,
including 20 of normal positions and 5 of adenomas; 28 of type II
including 23 of adenomas and 5 of early colorectal carcinoma; and
11 of type III including 10 of early colorectal carcinoma and 1 of
adenoma. The results indicated that the type II were particularly
identified in adenomas with 82.1% (23/28), while early colorectal
carcinoma primarily belonged to type III, with 66.7% (10/15)
(Table II).
| Table II.Correlation of NBI type and
histological findings. |
Table II.
Correlation of NBI type and
histological findings.
| NBI types | Number | Normal | Adenoma | Early colorectal
carcinoma |
|---|
| Type I | 25 | 20 | 5 | 0 |
| Type II | 28 | 0 | 23 | 5 |
| Type III | 11 | 0 | 1 | 10 |
| Total | 64 | 20 | 29 | 15 |
Expression of MVD, IGF-1 and STAT3 in
early colorectal carcinoma, adenomas and normal mucosa
CD34 was located on membrane and in cytoplasm of
vascular endothelial cell. The expression of MVD in normal mucosa,
adenomas and early colorectal carcinoma were 8.77±2.67, 21.37±4.42
and 21.33±5.23, respectively. There were significant differences
between the expression of MVD in normal mucosa and adenomas and
early colorectal carcinoma (P<0.0001). There was no significant
difference in the expression of MVD between adenomas and early
colorectal carcinoma (P>0.05), indicating that MVD increased
markedly in adenomas. The expression of IGF-1 in normal mucosa,
adenomas and early colorectal carcinoma were 0.50±0.76, 0.59±0.68
and 1.27±0.80, respectively. There were significant differences in
the expression of IGF-1 between the early colorectal carcinoma and
normal mucosa and adenoma (P=0.0062), indicating that IGF-1
increased significantly in lesions. The expression levels of STAT3
in normal mucosa, adenomas and early colorectal carcinoma were
0.40±0.60, 0.66±0.90 and 1.07±0.96, respectively. The expression
levels increased gradually among the three, but without significant
differences (P=0.0713). The expression of MVD, IGF-1 and STAT3 in
early colorectal carcinoma, adenomas and normal mucosa are
presented in Fig. 2 and Table III.
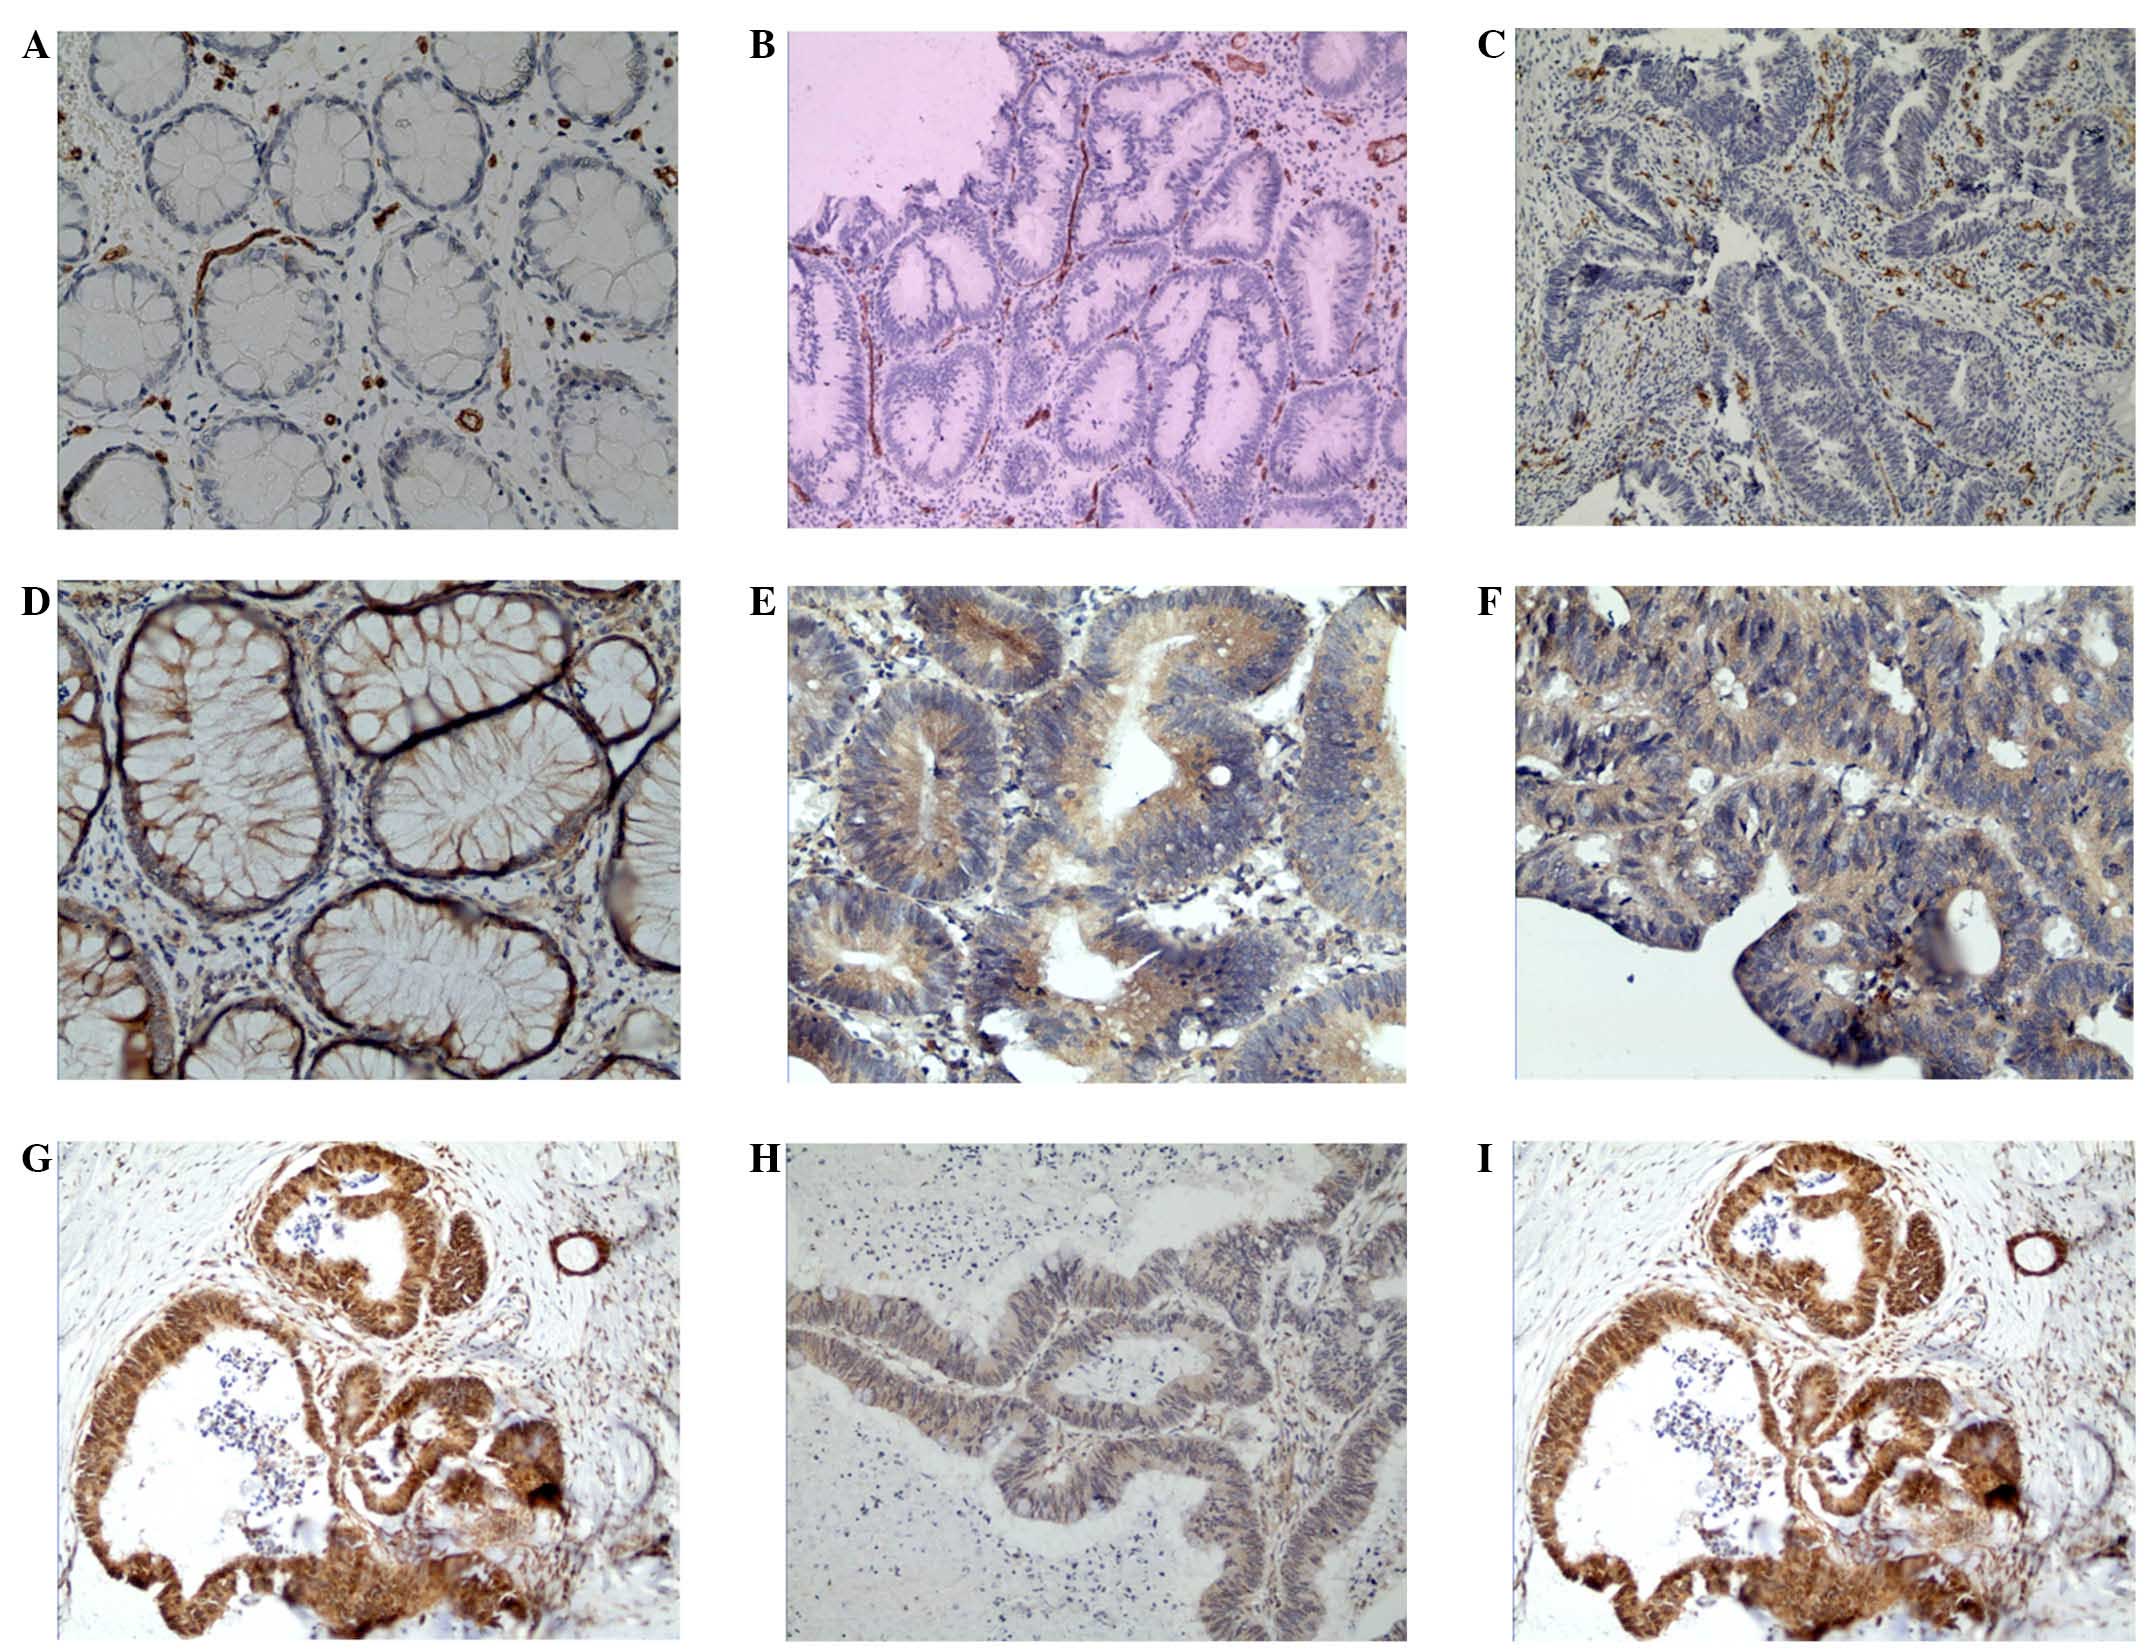 | Figure 2.Expression of CD34, IGF-1 and STAT3 in
colorectal cancer, adenoma and normal mucosa. The expression of (A)
CD34 in normal mucosa (magnification, ×400), (B) CD34 in adenoma
(magnification, ×200), (C) CD34 in colorectal cancer
(magnification, ×200), (D) IGF-1 in normal mucosa (x400), (E) IGF-1
in adenoma (x400), (F) IGF-1 in colorectal cancer (x400), (G) STAT3
in normal mucosa (x200), (H) STAT3 in adenoma (x200) and (I) STAT3
in colorectal cancer (x200). CD, cluster of differentiation; IGF-1,
insulin-like growth factor-1; STAT3, signal transducer and
activator of transcription 3. |
| Table III.Expression of MVD, IGF-1 and STAT3 in
early colorectal carcinoma, adenoma and normal mucosa. |
Table III.
Expression of MVD, IGF-1 and STAT3 in
early colorectal carcinoma, adenoma and normal mucosa.
| Histology | Cases | MVD | P-value | IGF-1 | P-value | STAT3 | P-value |
|---|
| Normal mucosa | 20 | 8.77±2.67 |
| 0.50±0.76 |
| 0.40±0.60 |
|
| Colonic adenoma | 29 | 21.37±4.42 | <0.0001 | 0.59±0.68 | 0.0062 | 0.66±0.90 | 0.0713 |
| Early colorectal
carcinoma | 15 | 21.33±5.23 |
| 1.27±0.80 |
| 1.07±0.96 |
|
Correlation between microvascular
characteristics and MVD, and the expression of IGF-1 and STAT3
In NBI types, there were 25 cases of type I
expressing MVD (10.85±5.20), 28 cases of type II expressing MVD
(21.46±4.21) and 11 cases of type III expressing (22.09±5.84).
There were significant differences among the three (P<0.0001).
The IGF-1 expression in type I (0.44±0.71), type II (0.68±0.67) and
type III (1.45±0.82) were significantly different from each other
(P=0.0010). The STAT3 expression in type I (0.32±0.57), type II
(0.75±0.93) and type III (1.27±0.90) were significantly different
from each other (P=0.0055; Table
IV).
| Table IV.Correlation of NBI type and expression
of MVD, IGF-1 and STAT3. |
Table IV.
Correlation of NBI type and expression
of MVD, IGF-1 and STAT3.
| NBI | Cases | MVD | P-value | IGF-1 | P-value | STAT3 | P-value |
|---|
| Type I | 25 | 10.85±5.20 |
| 0.44±0.71 |
| 0.32±0.57 |
|
| Type II | 28 | 21.46±4.21 | <0.0001 | 0.68±0.67 | 0.0010 | 0.75±0.93 | 0.0055 |
| Type III | 11 | 22.09±5.84 |
| 1.45±0.82 |
| 1.27±0.90 |
|
By analyzing the correlation between NBI types and
MVD expression, the results of the present study demonstrated that
Spearman's correlation coefficient was 0.67, indicating a
correlation between the two. Under endoscopy, as the vessel number
increased the color became deeper, and the expression of MVD
increased gradually. The correlation coefficients between type I,
type II and type III and the expression of IGF-1 and STAT3 were
0.41 and 0.40, respectively, indicating that the vascular
morphology was poorly correlated with the expression of IGF-1 and
STAT3. The vascular morphology under endoscopy did not reflect the
expression of IGF-1 and STAT3.
Discussion
Angiogenesis is important in the diagnosis and
treatment of tumors. A number of studies have indicated that
angiogenesis increases at the stage of precancerous lesions. NBI
endoscopy, as a novel technology, enables the observation of
angiogenesis in vivo (3,12). In
the present study, the microvascular morphology changes of colonic
polyps was observed to be positively correlated with angiogenesis
indexes in histological examination under NBI endoscopy. As the
number of microvessels increased and the color deepened, the
angiogenesis factor expression increased in the tissues, which
indicated the feasibility of observing angiogenesis under
endoscopy.
There was a correlation between the endoscopic
classification and histological results, which is consistent with a
previous study (13). Type I (no
visible microvascular pattern) indicated normal colonic mucosa and
hyperplastic polyps, while type II (microvasculature arranged along
the crypts with an even diameter) demonstrated that there was no
correlation between microvascular morphology and colonic adenoma
(14,15). Type III (irregularly arranged
microvasculature with an uneven diameter) indicated early
colorectal carcinoma. The results mentioned above are all
consistent with previous studies (16–18).
In the present study, the expression of MVD was
examined by labeling vascular endothelial with CD34 by
immunohistochemistry. The results indicated that MVD in colonic
adenoma and early colorectal carcinoma was higher than in normal
colonic mucosa, and that MVD increased markedly in adenoma.
Previous research has demonstrated that the increase of MVD depends
on the expression level of angiogenesis factors (19). IGF-1 is a type of somatomedin, which
can promote tumor angiogenesis (20), while STAT3 is an important meeting
point in numerous signal transduction pathways of angiogenesis
(8,21). The current study indicated that there
was a similar tendency between MVD and the expression of IGF-1 and
STAT3, and IGF-1 and STAT3 increased gradually in normal mucosa,
adenomas and early colorectal carcinoma. IGF-1 was without
significant increase in adenomas, but increased markedly in early
colorectal carcinoma, which indicates that the tendency of
increasing IGF-1 in normal mucosa, adenomas and early colorectal
carcinoma is different from MVD. MVD increasing may be caused by
the other pro-angiogenic factors.
In the current study on the correlation between
microvascular morphology and angiogenesis indexes under endoscopy,
there were significant differences in the expression of MVD, IGF-1
and STAT3 in NBI types, including type I, type II and type III. The
correlation coefficient between NBI types and MVD was 0.67, which
indicated a correlation between the two. As the number of
microvessels increased and the color deepened, the MVD increased.
The correlation coefficients between type I, type II and type III,
and the expression of IGF-1 and STAT3, were 0.41 and 0.40,
respectively, which indicated that the vascular morphology was
poorly correlated to the expression of IGF-1 and STAT3. Vascular
morphology under endoscopy did not reflect the expression of IGF-1
and STAT3. Together, the results of the present study demonstrate
that the vascular morphology observed under endoscopy may reflect
MVD, but with poor correlation to the expression of IGF-1, STAT3
and other pro-angiogenic factors.
In the present study, consecutive patients were not
chosen as study subjects, because in conventional endoscopic
examination there were a large number of hyperplastic polyps and
low-grade tubular polyps. In order to observe the relationship
between microvessel and histological change in carcinogenesis,
adenomas were chosen as targets, particularly high-grade polys. The
microvascular morphological changes were poorly correlated to the
pro-angiogenic factors, which indicated that other factors should
be investigated in a bigger sample size in future
investigations.
In conclusion, NBI endoscopic real-time observation
is a promising examining method for the evaluation of tissue
angiogenesis, which indicates the feasibility of observing
angiogenesis by endoscopy.
Acknowledgements
The present study was funded by Funding For Training
Talents in Beijing City (grant no. 2011D003034000009) and Beijing
City Health System ‘215’ High Levels of Health Technical Personnel
Training Aid (grant no. 2014-3-047).
References
|
1
|
Chen Q, Liu ZC and Cheng LP: Analysis of
incidence and mortality of colorectal cancer in china, 2003–2007.
Chin Cancer. 21:179–182. 2012.
|
|
2
|
Park HM, Woo H, Jung SJ, Jung KW, Shin HR
and Shin A: Colorectal cancer incidence in 5 Asian countries by
subsite: An analysis of cancer incidence in five continents
(1998–2007). Cancer Epidemiology. 45:65–70. 2016. View Article : Google Scholar : PubMed/NCBI
|
|
3
|
Staton CA, Chetwood AS, Cameron IC, Cross
SS, Brown NJ and Reed MW: The angiogenic switch occurs at the
adenoma stage of the adenoma carcinoma sequence in colorectal
cancer. Gut. 56:1426–1432. 2007. View Article : Google Scholar : PubMed/NCBI
|
|
4
|
Sharma S, Sharma MC and Sarkar C:
Morphology of angiogenesis in human cancer: a conceptual overview,
histoprognostic perspective and significance of neoangiogenesis.
Histopathol. 46:481–489. 2005. View Article : Google Scholar
|
|
5
|
Gacche RN and Meshram RJ: Angiogenic
factors as potential drug target: Efficacy and limitations of
anti-angiogenic therapy. Biochimica et Biophysica Acta.
1846:161–179. 2014.PubMed/NCBI
|
|
6
|
Ren J, Jin W, Gao YE, Zhang Y, Zhang X,
Zhao D, Ma H, Li Z, Wang J, Xiao L, et al: Relations between GPR4
expression, microvascular density (MVD) and clinical pathological
characteristics of patients with epithelial ovarian carcinoma
(EOC). Curr Pharm Des. 20:1904–1916. 2014. View Article : Google Scholar : PubMed/NCBI
|
|
7
|
Jacobo SM and Kazlauskas A: Insulin-like
growth factor 1 (IGF-1) stabilizes nascent blood vessels. J Biol
Chem. 290:6349–6360. 2015. View Article : Google Scholar : PubMed/NCBI
|
|
8
|
Zhu Y, Xu Y, Chen D, Zhang C, Rui W, Zhao
J, Zhu Q, Wu Y, Shen Z, Wang W, et al: Expression of STAT3 and IGF2
in adrenocortical carcinoma and its relationship with angiogenesis.
Clin Transl Oncol. 16:644–649. 2014. View Article : Google Scholar : PubMed/NCBI
|
|
9
|
Qian WF, Guan WX and Gao Y: The expression
of STAT3 in colorectal carcinoma and its effects on angiogenesis.
Zhong Guo Lin Chuang Jie Po Xue Za Zhi. 27:310–316. 2009.(In
Chinese).
|
|
10
|
Sengiz S, Pabuççuoğlu U and Sarioğlu S:
Immunohistological comparison of the World Health Organization
(WHO) and Ljubljana classifications on the grading of preneoplastic
lesions of the larynx. Pathol Res Pract. 200:181–188. 2004.
View Article : Google Scholar : PubMed/NCBI
|
|
11
|
Weidner N: Tumor angiogenesis: Review of
current applications in tumor prognostication. Semin Diagn Pathol.
10:302–313. 1993.PubMed/NCBI
|
|
12
|
Möbius C, Stein HJ, Becker I, Feith M,
Theisen J, Gais P, Jütting U and Siewert JR: The ‘angiogenic
switch’ in the progression from Barrett's metaplasia to esophageal
adenocarcinoma. Eur J Surg Oncol. 29:890–894. 2003. View Article : Google Scholar : PubMed/NCBI
|
|
13
|
Liu H, Wu J, Lin XC, Gao BX, Jiang GJ, Wei
N and Wang CH: Narrow band imaging without magnification for
differential diagnosis of colorectal adenoma and hyperplastic
polyps. Zhong Hua Xiao Hua Za Zhi. 31:798–802. 2011.(In
Chinese).
|
|
14
|
Rastogi A: Optical diagnosis of small
colorectal polyp histology with high-definition colonoscopy using
narrow band imaging. Clin Endosc. 46:120–129. 2013. View Article : Google Scholar : PubMed/NCBI
|
|
15
|
Goto N, Kusaka T, Tomita Y, Tanaka H,
Itokawa Y, Koshikawa Y, Yamaguchi D, Nakai Y, Fujii S and Kokuryu
H: Magnifying narrow-band imaging with acetic acid to diagnose
early colorectal cancer. World J Gastroenterol. 20:16306–16310.
2014. View Article : Google Scholar : PubMed/NCBI
|
|
16
|
Hayashi N, Tanaka S, Hewett DG, Kaltenbach
TR, Sano Y, Ponchon T, Saunders BP, Rex DK and Soetikno RM:
Endoscopic prediction of deep submucosal invasive carcinoma:
Validation of the narrow-band imaging international colorectal
endoscopic (NICE) classification. Gastrointest Endosc. 78:625–632.
2013. View Article : Google Scholar : PubMed/NCBI
|
|
17
|
Rastogi A: Optical diagnosis of small
colorectal polyp histology with high-definition colonoscopy
usingnarrow band imaging. Clin Endosc. 46:120–129. 2013. View Article : Google Scholar : PubMed/NCBI
|
|
18
|
Hayashi N, Tanaka S, Kanao H, Oka S,
Yoshida S and Chayama K: Relationship between narrow-band imaging
magnifying observation and pit pattern diagnosis in colorectal
tumors. Digestion. 87:53–58. 2013. View Article : Google Scholar : PubMed/NCBI
|
|
19
|
Liu H, Xu KX, Cao LJ, Wang H and Kang T:
Expression and biological significance of Leptin, Leptin receptor,
VEGF and CD34 in colorectal carcinoma. Zhong Guo Zhong Liu Lin
Chuang 2009,. 36:934–936. 2009.(In Chinese).
|
|
20
|
Han Z, Tian X, Tan J, Long YH and Wang H:
Correlation between serum IGF-1 and VEGF expression in gastric
cancer. Wuhan Da Xue Xue Bao. 35:525–527. 2014.
|
|
21
|
Chen Z and Han ZC: STAT3: A critical
transcription activator in angiogenesis. Med Res Rev. 28:185–200.
2008. View Article : Google Scholar : PubMed/NCBI
|