Introduction
Non-alcoholic fatty liver disease (NAFLD) is a kind
of clinical syndrome characterized by fatty degeneration in liver
histology. NAFLD is closely related to the metabolic diseases, such
as type 2 diabetes mellitus, insulin resistance and obesity, of
which insulin resistance is the common pathophysiological basis
(1). Previous findings showed that
NAFLD may increase the risks of type 2 diabetes mellitus and its
complications in patients (2).
Additional findings revealed that the prevalence and mortality
rates of NAFLD in patients with type 2 diabetes mellitus were also
significantly higher (3). According
to the National Health and Nutrition Examination Survey in the
United States, the independent risk factors of NAFLD include
insulin resistance and type 2 diabetes mellitus, which collectively
contribute towards an increase in the mortality risks of NAFLD
(4). Chemerin is a kind of
newly-discovered adipocytokine, which is closely associated with
the occurrence of metabolic diseases, such as type 2 diabetes
mellitus, obesity and metabolic syndrome (5,6). The
present study aimed to investigate the correlation of blood
glucose, serum chemerin and insulin resistance with concurrent
NAFLD in patients with type 2 diabetes mellitus by comparing
changes in blood glucose, serum chemerin and insulin resistance,
between patients with type 2 diabetes mellitus and patients with
type 2 diabetes mellitus complicated by NAFLD. Furthermore, the
present study also focused on the changes in blood glucose, serum
chemerin and insulin resistance, among patients with NAFLD in
different degrees in order to provide a basis for the comprehensive
treatment and prevention of associated pathological states at
moderate NAFLD stage.
The prime advantage of the present study was the
novel reference standards in terms of blood glucose, serum chemerin
and insulin resistance for the timely assessment of NAFLD at
variable stages (mild, moderate and severe). NAFLD at mild or
moderate stages is more of lifestyle prone pathological state. At
the mild stage of NAFLD, it is likely that the disease may be
reversed through a proper diet plan and physical activities. In
this manner, the prevention of NAFLD at mild/moderate levels may
indirectly help to prevent more deadly pathological states such as
metabolic syndrome, diabetes and cardiac disorders. Thus, the study
opens new gates of rapid assessment of NAFLD at the mild/moderate
stage to ensure patients are adequately informed regarding sever
consequences of the disease in future.
Materials and methods
General materials
In total, 300 patients with type 2 diabetes mellitus
treated and admitted into the Endocrinology Department of the The
Affiliated Hospital of Jining Medical University (Shandong, China)
from June 2015 to June 2017 were included in the present study. The
diagnostic criteria of type 2 diabetes mellitus were based on the
WHO diagnostic criteria of diabetes mellitus in 1998 (7), i.e., fasting blood glucose ≥7.0 mmol/l,
or typical symptoms of diabetes mellitus with random blood glucose
≥11.1 mmol/l, or 2 h blood glucose in glucose tolerance test ≥11.1
mmol/l. All the patients enrolled were aged 30–70 years. Exclusion
criteria for the study were: i) patients with type 1 diabetes
mellitus, gestational diabetes, diabetic ketoacidosis,
hyperglycemic hyperosmolar status, severe peripheral neuropathy,
severe peripheral vascular disease, acute infection or other severe
diabetic complications; ii) patients with viral hepatitis,
alcoholic hepatitis, drug-induced hepatitis or autoimmune
hepatitis; iii) patients with hepatic or renal dysfunction, cancer
or mental disease. The study was approved by the Ethics Committee
of The Affiliated Hospital of Jining Medical University (Shandong,
China) and written informed consents were signed by the patients
and/or guardians.
Grouping
According to whether they were complicated by NAFLD,
the 300 patients were divided into the simple type 2 diabetes
mellitus (group A, n=80) and concurrent NAFLD (group B, n=220)
groups. Diagnostic criteria of NAFLD were (8): i) patients with a history of heavy
drinking, or weekly alcohol intake <140 g in males and <70 g
in females; ii) patients with viral, drug-induced or autoimmune
hepatitis, cirrhosis, hepatolenticular degeneration, total
parenteral nutrition or other disease that induces fatty liver
disease; iii) pathological changes in liver biopsy meet the
pathological criteria of fatty liver disease. According to the
color Doppler imaging of fatty liver, the NAFLD patients were
subdivided into the mild fatty liver (group B1), moderate fatty
liver (group B2) and severe fatty liver (group B3) groups. The
specific ultrasound findings were: i) the near-field echo in
hepatic region was enhanced in a diffused mode compared with kidney
and spleen, while the far-field echo was attenuated; ii) the edge
angle of liver was blunt with mild to moderate enlargement; iii)
intrahepatic duct had an unclear structure; iv) intrahepatic blood
flow signal was reduced, but the intrahepatic blood vessel
direction remained normal; and v) the echoes in the hepatic
diaphragm and right lobe membrane were uneven. Patients with the
manifestation i) and any one of manifestations ii-iv) were
diagnosed as mild fatty liver; those with the manifestation i) and
any two of manifestations ii-iv) were diagnosed as moderate fatty
liver; those with the manifestations i) and v) and any two of the
manifestations ii-iv) were diagnosed as severe fatty liver.
Finally, there were 84 cases in group B1, 75 cases in group B2 and
61 cases in group B3.
Collection of clinical data
The age, sex, past medical history, medication
history, height, body weight and blood pressure of patients were
collected. In addition, the body mass index was calculated [BMI =
body weight (kg)/height (m2)].
Collection of blood samples
Three samples of fasting venous blood were collected
from the patients in the early morning at 2 days (3 ml/copy). Two
of the three samples received a biochemical analysis and fasting
insulin (FINS) detection in the Laboratory Department of our
hospital. Serum was separated from an additional 1 sample and
stored in a refrigerator at −80°C for the detection of chemerin.
Venous blood (3 ml) was collected at 2 h after meals for the
detection of 2 h post-prandial plasma glucose (2hPG).
Detection of indexes
The biochemical indexes, FINS and 2hPG were detected
using the Roche Cobas-8000 automatic biochemical analyzer (Roche
Diagnostics, Basel, Switzerland). The serum chemerin level was
measured using the ELISA kit (R&D Systems, Minneapolis, MN,
USA). After the loading and treatment according to the instructions
of kit, the optical density (OD) value at 450 nm was measured using
the continuous wavelength multi-functional microplate reader
(Tecan, Grödig, Austria), the standard curve was drawn, and the
chemerin content in each sample was calculated. The insulin
resistance of patients was evaluated via the homeostasis model
assessment of insulin resistance (HOMA-IR): HOMA-IR = fasting
plasma glucose (FPG) (mmol/l) × FINS (mIU/l)/22.5. Pancreatic
β-cell function was evaluated via HOMA-β: HOMA-β = FINS (mIU/l) ×
20/[FPG (mmol/l)-3.5].
Statistical analysis
Statistical analysis was performed using SPSS 19.0
software (IBM Corp., New York, NY, USA). Measurement data were
presented as mean ± SD. An independent-samples t-test was used for
the comparison between two groups, and Kruskal-Wallis test for the
comparisons among the groups. The Chi-square test was used for the
comparisons of enumeration data. The correlation analysis of risk
factors of concurrent NAFLD was performed via logistic regression
analysis. P<0.05 was considered to indicate a statistically
significant difference.
Results
Comparisons of clinical data and blood
biochemical indexes between groups A and B
BMI, FPG, 2hPG, triglyceride (TG), total cholesterol
(TC), low-density lipoprotein cholesterol (LDL-c), and alanine
aminotransferase (ALT) in group B were significantly higher than
those in group A, and the differences were statistically
significant (P<0.05 or P<0.01). There were no significant
differences in sex ratio, age, systolic pressure, diastolic
pressure, high-density lipoprotein cholesterol (HDL-c) and
aspartate aminotransferase (AST) between the two groups (P>0.05)
(Table I).
 | Table I.Comparisons of clinical data and blood
biochemical indexes between groups A and B. |
Table I.
Comparisons of clinical data and blood
biochemical indexes between groups A and B.
| Item | Group A | Group B |
|---|
| Sex
(male/female) | 49/31 | 136/84 |
| Age |
42.56±5.03 |
43.21±6.47 |
| BMI |
24.49±2.89 |
26.77±2.65a |
| Systolic
pressure |
123.20±17.23 |
127.04±20.66 |
| Diastolic
pressure |
78.13±9.41 |
79.65±10.82 |
| FPG |
8.55±3.28 |
12.93±3.50b |
| 2hPG |
12.81±4.16 |
16.68±4.24a |
| TG |
2.56±1.05 |
3.44±0.94a |
| TC |
4.72±1.20 |
5.81±1.43a |
| LDL-c |
2.48±0.83 |
3.53±0.77b |
| HDL-c |
1.20±0.32 |
1.06±0.28 |
| ALT |
26.55±8.08 |
33.42±7.69a |
| AST |
22.31±9.74 |
27.50±8.63 |
Comparisons of pancreatic β-cell
function and insulin resistance between groups A and B
FINS, HOMA-IR and HOMA-β in group B were
significantly higher than those in group A, and the differences
were statistically significant (P<0.05 or P<0.01) (Table II).
| Table II.Comparisons of pancreatic β-cell
function and insulin resistance between groups A and B. |
Table II.
Comparisons of pancreatic β-cell
function and insulin resistance between groups A and B.
| Item | Group A | Group B |
|---|
| FINS |
12.57±5.34 |
15.21±5.81a |
| HOMA-IR |
4.80±1.86 |
8.72±3.03b |
| HOMA-β |
48.72±9.29 |
32.38±8.62b |
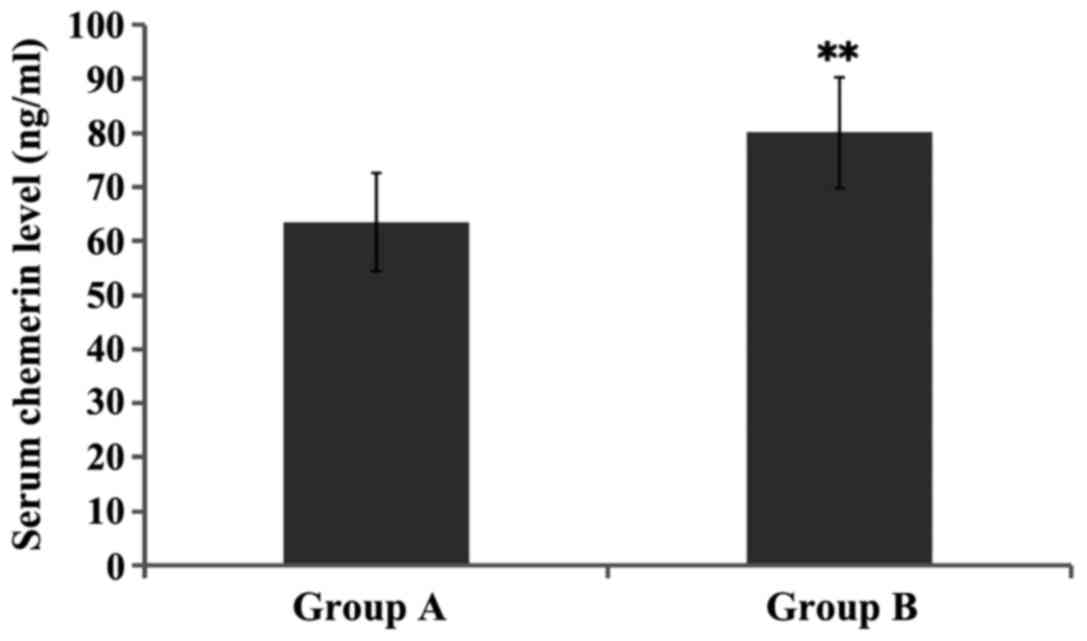
Comparison of serum chemerin level
between groups A and B
The serum chemerin level in group B was
significantly increased compared with that in group A, and the
difference was statistically significant (P<0.01) (Fig. 1).
Comparisons of clinical data and blood
biochemical indexes in patients with fatty liver in different
degrees
Patients in group B were divided and compared
according to the different degrees of fatty liver. The results
showed that the BMI, FPG, 2hPG, TG, TC and LDL-2 in groups B2 and
B3 were significantly increased compared with those in group B1,
and ALT in group B3 was significantly increased, with the
differences being statistically significant (P<0.05 or
P<0.01). The BMI, FPG, TC, LDL-c and ALT in group B3 were
obviously higher than those in group B2, and the differences were
statistically significant (P<0.05 or P<0.01) (Table III).
| Table III.Comparisons of clinical data and blood
biochemical indexes among patients with fatty liver in different
degrees. |
Table III.
Comparisons of clinical data and blood
biochemical indexes among patients with fatty liver in different
degrees.
| Item | Group B1 | Group B2 | Group B3 |
|---|
| Sex
(male/female) | 52/32 | 46/29 | 38/23 |
| Age |
42.83±6.58 |
43.36±6.13 |
43.45±6.69 |
| BMI |
24.81±2.77 |
26.63±2.41a |
28.89±2.76b,c |
| Systolic
pressure |
125.62±21.63 |
126.45±19.32 |
129.03±21.00 |
| Diastolic
pressure |
77.66±11.48 |
81.07±10.99 |
80.24±9.98 |
| FPG |
10.07±3.09 |
13.10±3.77a |
15.62±3.65b,c |
| 2hPG |
13.50±4.02 |
17.56±4.33a |
18.97±4.35a |
| TG |
3.15±1.00 |
3.50±0.85a |
3.63±0.98a |
| TC |
4.94±1.26 |
5.62±1.50a |
6.88±1.52b,c |
| LDL-c |
2.71±0.85 |
3.47±0.74b |
4.42±0.73b,d |
| HDL-c |
1.14±0.27 |
1.04±0.25 |
1.01±0.31 |
| ALT |
29.08±7.44 |
32.71±7.70 |
38.46±7.94a,b |
| AST |
25.90±8.59 |
27.19±8.42 |
29.42±8.87 |
Comparisons of pancreatic β-cell
function and insulin resistance among patients with fatty liver in
different degrees
Patients in group B were divided and compared
according to the different degrees of fatty liver. The results
showed that the FINS and HOMA-IR in groups B2 and B3 were
significantly increased, but HOMA-β was significantly decreased
compared with those in group B1, and the differences were
statistically significant (P<0.05 or P<0.01). HOMA-IR in
group B3 was obviously higher than that in group B2, and the
difference was statistically significant (P<0.01) (Table IV).
| Table IV.Comparisons of pancreatic β-cell
function and insulin resistance among patients with fatty liver in
different degrees. |
Table IV.
Comparisons of pancreatic β-cell
function and insulin resistance among patients with fatty liver in
different degrees.
| Item | Group B1 | Group B2 | Group B3 |
|---|
| FINS |
12.83±5.17 |
15.06±5.52a |
17.75±6.73a |
| HOMA-IR |
5.75±2.84 |
8.77±3.11a |
12.30±3.15b,c |
| HOMA-β |
39.04±9.30 |
31.38±8.41a |
29.28±8.18a |
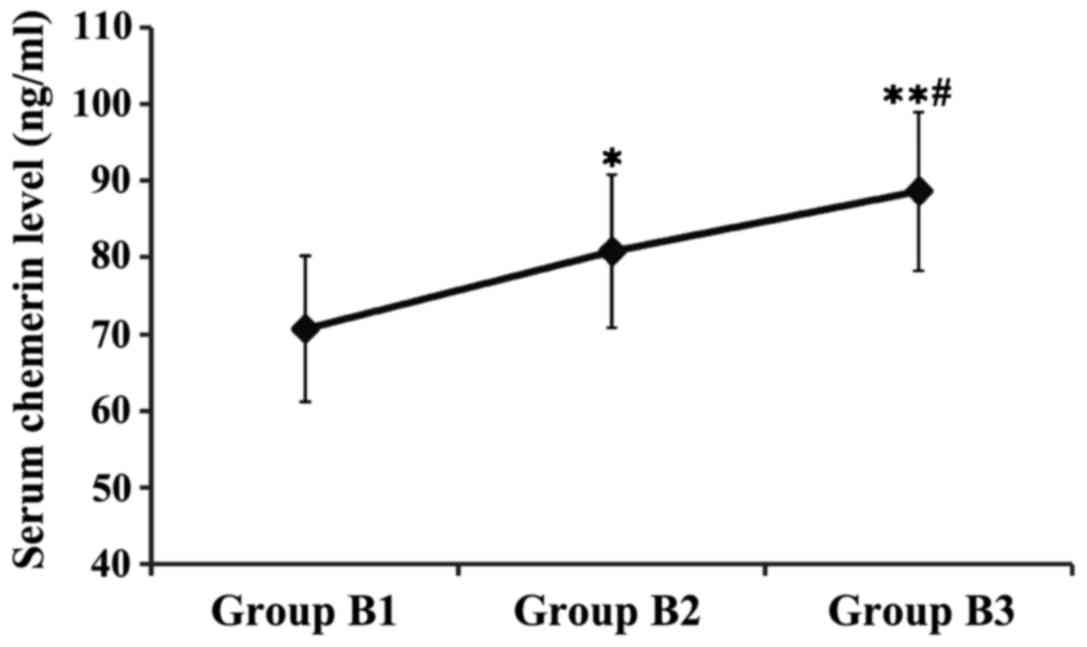
Comparison of serum chemerin level
among patients with fatty liver in different degrees
Patients in group B were divided and compared
according to the different degrees of fatty liver. The results
showed that the serum chemerin levels in groups B2 and B3 were
significantly higher than that in group B1, and the serum chemerin
level in group B3 was obviously higher than that in group B2, and
the differences were statistically significant (P<0.05 or
P<0.01) (Fig. 2).
Logistic regression analysis of risk
factors of concurrent NAFLD
The risk factors were analyzed via binary logistic
regression with the fatty liver as a dependent variable and with
the sex, age, BMI, systolic pressure, diastolic pressure, FPG,
2hPG, TG, TC, LDL-c, HDL-c, ALT, AST, FINS, HOMA-IR, HOMA-β and
chemerin as the independent variables. The results revealed that
BMI, FPG, TC, LDL-c, FINS, HOMA-IR and chemerin were independent
risk factors of type 2 diabetes mellitus complicated by NAFLD
(Table V).
| Table V.Logistic regression analysis of risk
factors of concurrent NAFLD. |
Table V.
Logistic regression analysis of risk
factors of concurrent NAFLD.
| Independent
variable | B-value | Wald | P-value | OR | 95% confidence
interval (CI) |
|---|
| BMI | 0.83 | 4.12 | 0.035 | 1.15 | 0.78–1.66 |
| FPG | 1.12 | 7.66 | 0.004 | 2.87 | 1.23–5.64 |
| TC | 0.72 | 3.44 | 0.042 | 0.95 | 0.67–1.50 |
| LDL-c | 0.86 | 4.30 | 0.029 | 1.24 | 0.85–1.82 |
| FINS | 1.05 | 6.53 | 0.010 | 2.12 | 1.11–4.97 |
| HOMA-IR | 1.25 | 8.81 | 0.001 | 3.06 | 1.34–6.11 |
| Chemerin | 0.78 | 3.81 | 0.038 | 1.02 | 0.71–1.59 |
Discussion
Non-alcoholic fatty liver disease (NAFLD) mainly
occurs in the liver lobules, manifested as the fatty degeneration
of liver cells and fatty accumulation of liver (8). The current incidence rate of NAFLD is
up to 5–40% in Asian countries, while it is up to 24–42% in Western
countries, becoming a factor seriously harming the public health
worldwide (9). NAFLD is a
pathological process of excessive fatty accumulation caused by a
variety of factors. At present, the pathogenesis of NAFLD remains
unclear, and most scholars believe that its pathogenesis is related
to the ‘two-hit theory’ (10). It is
often believed that the action of heredity, drug, diabetes
mellitus, obesity, lipid metabolism disorders and other factors
leads to the excessive secretion of insulin, causing insulin
resistance and resulting in increased fat in liver and
mitochondrial dysfunction in liver cells, ultimately causing the
first hit. Subsequently, the fatty degeneration of liver cell is
induced, which decreases the cell viability and increases the
intracellular oxidative metabolites, leading to the liver cell
oxidative stress, ultimately causing the second hit. Finally, a
series of inflammatory responses, necrosis and fibrosis occur in
liver cells (11,12).
Previous findings have shown that up to 50% of
patients with type 2 diabetes mellitus are complicated by NAFLD,
whereas the incidence rate of NAFLD is as high as 100% in patients
with diabetes mellitus complicated by obesity (13). From the perspective of NAFLD, at
least one third of NAFLD patients are complicated by diabetes
mellitus and NAFLD can induce or aggravate insulin resistance in
patients (14). It was found in a
follow-up observation for patients with type 2 diabetes mellitus
that NAFLD can increase the risk of cardiovascular diseases 2-fold,
and it is speculated that NAFLD is also an independent risk factor
of cardiovascular disease in patients with type 2 diabetes mellitus
(15). Another study also found that
NAFLD can increase the risk of complications, such as diabetic
nephropathy and diabetic retinopathy, and it can be used as an
independent risk factor (16). In
this study, it was also found that 73% of patients with type 2
diabetes mellitus are complicated by NAFLD; thus, NAFLD is closely
associated with the type 2 diabetes mellitus.
The close association between NAFLD and type 2
diabetes mellitus lies in that they have a common pathogenesis,
insulin resistance (17). NAFLD can
reduce the inhibitory effect of insulin in the body on endogenous
glucose production, and reduce the body's insulin sensitivity,
making it difficult to control blood glucose in patients with type
2 diabetes mellitus (18). In a
study involving 2,839 patients with type 2 diabetes mellitus, the
level of glycosylated hemoglobin in patients complicated by NAFLD
was significantly increased compared with that in patients with
simple diabetes mellitus, and the proportion of patients using
insulin was also significantly increased (19). Kelley et al (20) identified that the HOMA-IR level in
patients with type 2 diabetes mellitus complicated by NAFLD is
significantly higher than that in patients with simple type 2
diabetes mellitus, and it can be seen that more serious insulin
resistance exists in type 2 diabetes mellitus complicated by NAFLD.
In this study, BMI, FPG, 2hPG, TG, TC, LDL-c, FINS and HOMA-IR in
patients with type 2 diabetes mellitus complicated by NAFLD were
significantly increased compared with those in patients with simple
type 2 diabetes mellitus, whereas the pancreatic β-cell function
was significantly decreased. The higher the levels of BMI, FPG,
2hPG, TG, TC, LDL-c, FINS and HOMA-IR were and the lower the
pancreatic β-cell function was, the more severe was the NAFLD.
Logistics regression analysis further confirmed that BMI, FPG, TC,
LDL-c, FINS and HOMA-IR were independent risk factors of type 2
diabetes mellitus complicated by NAFLD.
Chemerin is a newly-discovered adipocytokine with a
relative molecular mass of 16,000, and consisting of 163 amino acid
residues, which is expressed in white adipose tissues, liver, lung
and kidney (21). Chemerin can
affect the insulin receptor signaling pathway, lead to insulin
resistance or aggravate the body's original insulin resistance
(5). Lehrke et al (22) revealed that the level of chemerin is
increased in adipocytes, which can activate serine/threonine
kinases, thereby reducing the tyrosine phosphorylation, inhibiting
the translocation of glucose 4, and causing insulin resistance in
adipocytes. Zhuang et al (23) found that the serum chemerin level in
NAFLD patients was significantly higher than that in healthy
individuals, but was significantly decreased following treatment
with metformin, suggesting that the occurrence of NAFLD is closely
associated with the serum chemerin level, as well as insulin
resistance. Another study on a Caucasian population found that the
serum metabolin level was significantly increased in populations
with risk factors of metabolic syndrome (24). In this study, it was found that the
level of serum chemerin in patients with type 2 diabetes mellitus
complicated by NAFLD was significantly increased compared with that
in patients with simple type 2 diabetes mellitus, and the higher
the serum chemerin level, the more severe the NAFLD was. Logistics
regression analysis also further confirmed that chemerin was an
independent risk factor of type 2 diabetes mellitus complicated by
NAFLD.
The present study concludes that chemerin is a novel
molecule that is useful in the timely assessment of NAFLD as it was
clearly observed that, the higher the serum chemerin level was, the
more sever NAFLD was. Timely assessment of NAFLD at a mild or
moderate stage was reversed by appropriate changes in the lifestyle
of the patients such as physical activities and proper diet. The
reversal of NAFLD in this manner could in turn indirectly prevent
the occurrence of deadly pathological states including type 2
diabetes. To the best of our knowledge, this is the first study to
offer a novel form of assessment of NAFLD at the mild stage. Future
studies with higher sample size are required for more concrete
conclusions.
Competing interests
The authors declare that they have no competing
interests.
References
|
1
|
Fruci B, Giuliano S, Mazza A, Malaguarnera
R and Belfiore A: Nonalcoholic fatty liver: A possible new target
for type 2 diabetes prevention and treatment. Int J Mol Sci.
14:22933–22966. 2013. View Article : Google Scholar : PubMed/NCBI
|
|
2
|
Mavrogiannaki AN and Migdalis IN:
Nonalcoholic fatty liver disease, diabetes mellitus and
cardiovascular disease: Newer data. Int J Endocrino.
2013:4506392013. View Article : Google Scholar
|
|
3
|
Targher G, Bertolini L, Poli F, Rodella S,
Scala L, Tessari R, Zenari L and Falezza G: Nonalcoholic fatty
liver disease and risk of future cardiovascular events among type 2
diabetic patients. Diabetes. 54:3541–3546. 2005. View Article : Google Scholar : PubMed/NCBI
|
|
4
|
Stepanova M, Rafiq N and Younossi ZM:
Components of metabolic syndrome are independent predictors of
mortality in patients with chronic liver disease: A
population-based study. Gut. 59:1410–1415. 2010. View Article : Google Scholar : PubMed/NCBI
|
|
5
|
Bozaoglu K, Bolton K, McMillan J, Zimmet
P, Jowett J, Collier G, Walder K and Segal D: Chemerin is a novel
adipokine associated with obesity and metabolic syndrome.
Endocrinology. 148:4687–4694. 2007. View Article : Google Scholar : PubMed/NCBI
|
|
6
|
Chu SH, Lee MK, Ahn KY, Im JA, Park MS,
Lee DC, Jeon JY and Lee JW: Chemerin and adiponectin contribute
reciprocally to metabolic syndrome. PLoS One. 7:e347102012.
View Article : Google Scholar : PubMed/NCBI
|
|
7
|
Alberti KG and Zimmet PZ: Definition,
diagnosis and classification of diabetes mellitus and its
complications. Part. 1:diagnosis and classification of diabetes
mellitus provisional report of a WHO consultation. Diabet Med 15:
539–553. 1998.
|
|
8
|
Macavei B, Baban A and Dumitrascu DL:
Psychological factors associated with NAFLD/NASH: A systematic
review. Eur Rev Med Pharmacol Sci. 20:5081–5097. 2016.PubMed/NCBI
|
|
9
|
Amarapurkar DN, Hashimoto E, Lesmana LA,
Sollano JD, Chen PJ and Goh KL; Asia-Pacific Working Party on
NAFLD, : How common is non-alcoholic fatty liver disease in the
Asia-Pacific region and are there local differences? J
Gastroenterol Hepatol. 22:788–793. 2007. View Article : Google Scholar : PubMed/NCBI
|
|
10
|
Day CP and James OF: Steatohepatitis: A
tale of two ‘hits’? Gastroenterology. 114:842–845. 1998. View Article : Google Scholar : PubMed/NCBI
|
|
11
|
Kim CH and Younossi ZM: Nonalcoholic fatty
liver disease: A manifestation of the metabolic syndrome. Cleve
Clin J Med. 75:721–728. 2008. View Article : Google Scholar : PubMed/NCBI
|
|
12
|
Moreno Sánchez D: Pathogenesis of primary
nonalcoholic fatty liver disease. Med Clin (Barc). 124:668–677.
2005.(In Spanish). PubMed/NCBI
|
|
13
|
Chitturi S, Wong VW and Farrell G:
Nonalcoholic fatty liver in Asia: Firmly entrenched and rapidly
gaining ground. J Gastroenterol Hepatol. 26 Suppl 1:163–172. 2011.
View Article : Google Scholar : PubMed/NCBI
|
|
14
|
Pacifico L, Nobili V, Anania C, Verdecchia
P and Chiesa C: Pediatric nonalcoholic fatty liver disease,
metabolic syndrome and cardiovascular risk. World J Gastroenterol.
17:3082–3091. 2011.PubMed/NCBI
|
|
15
|
Targher G, Valbusa F, Bonapace S,
Bertolini L, Zenari L, Rodella S, Zoppini G, Mantovani W, Barbieri
E and Byrne CD: Non-alcoholic fatty liver disease is associated
with an increased incidence of atrial fibrillation in patients with
type 2 diabetes. PLoS One. 8:e571832013. View Article : Google Scholar : PubMed/NCBI
|
|
16
|
Targher G, Bertolini L, Rodella S, Zoppini
G, Lippi G, Day C and Muggeo M: Non-alcoholic fatty liver disease
is independently associated with an increased prevalence of chronic
kidney disease and proliferative/laser-treated retinopathy in type
2 diabetic patients. Diabetologia. 51:444–450. 2008. View Article : Google Scholar : PubMed/NCBI
|
|
17
|
Jorgensen RA: Nonalcoholic fatty liver
disease. Gastroenterol Nurs. 26:150–155. 2003. View Article : Google Scholar : PubMed/NCBI
|
|
18
|
Azam G, Alam S, Hasan SKMN, Alam SMNE,
Kabir J and Alam AKMK: Insulin resistance in nonalcoholic fatty
liver disease. Experience from Bangladesh. Bangladesh Critical Care
Journal. 4:862016.doi: org/10.3329/bccj.v4i2.30022. View Article : Google Scholar
|
|
19
|
Targher G, Bertolini L, Padovani R,
Rodella S, Tessari R, Zenari L, Day C and Arcaro G: Prevalence of
nonalcoholic fatty liver disease and its association with
cardiovascular disease among type 2 diabetic patients. Diabetes
Care. 30:1212–1218. 2007. View Article : Google Scholar : PubMed/NCBI
|
|
20
|
Kelley DE, McKolanis TM, Hegazi RA, Kuller
LH and Kalhan SC: Fatty liver in type 2 diabetes mellitus: Relation
to regional adiposity, fatty acids, and insulin resistance. Am J
Physiol Endocrinol Metab. 285:E906–E916. 2003. View Article : Google Scholar : PubMed/NCBI
|
|
21
|
Peng L, Yu Y, Liu J, Li S, He H, Cheng N
and Ye RD: The chemerin receptor CMKLR1 is a functional receptor
for amyloid-β peptide. J Alzheimers Dis. 43:227–242.
2015.PubMed/NCBI
|
|
22
|
Lehrke M, Becker A, Greif M, Stark R,
Laubender RP, von Ziegler F, Lebherz C, Tittus J, Reiser M, Becker
C, et al: Chemerin is associated with markers of inflammation and
components of the metabolic syndrome but does not predict coronary
atherosclerosis. Eur J Endocrinol. 161:339–344. 2009. View Article : Google Scholar : PubMed/NCBI
|
|
23
|
Zhuang X, Sun F, Li L, Jiang D, Li X, Sun
A, Pan Z, Lou N, Zhang L and Lou F: Therapeutic effect of metformin
on chemerin in non-obese patients with non-alcoholic fatty liver
disease (NAFLD). Clin Lab. 61:1409–1414. 2015.PubMed/NCBI
|
|
24
|
Stejskal D, Karpisek M, Hanulova Z and
Svestak M: Chemerin is an independent marker of the metabolic
syndrome in a Caucasian population - a pilot study. Biomed Pap Med
Fac Univ Palacky Olomouc Czech Repub. 152:217–221. 2008. View Article : Google Scholar : PubMed/NCBI
|