Introduction
Noncoding RNAs (ncRNAs) are transcripts that have no
ability of coding proteins, which widely exit in high eukaryotics.
According to their characteristics, ncRNAs can be divided into
several subtypes including transfer RNA, small nucleolar RNA
(snoRNA), ribosomal RNA (rRNA), microRNA (miRNA) and long
non-coding RNA (lncRNA). The amount of the ncRNAs transcripts is
>98% of the whole genome transcripts and have been suggested to
represent transcriptional noise (1). However, more and more evidence
indicates that transcriptional output of genome is far more complex
than predicted, and suggests new paradigms of ncRNA regulation
(2).
Recent studies suggest that the ncRNAs may play
important biological roles in transcriptional regulation, cellular
development, formation of chromosome and RNA modification (3). Based on the transcript size, ncRNAs
are grouped into small ncRNAs (<200 bp) and long ncRNAs (>200
bp, up to 100 kb). lncRNA is the functional end-product, and the
level of lncRNA expression correlates directly with the level of
the active molecule. Thus, the use of lncRNAs in diagnostics has
intrinsic advantages over the use of protein-coding RNAs (4). In addition, lncRNAs show greater
tissue specificity compared to miRNAs and protein-coding mRNAs,
making them attractive in the search for novel diagnostic and
prognostic cancer biomarkers (5).
Increasing number of evidence shows that lncRNAs regulate the
biological roles of various cancers in progression and development,
including gastric cancer (GC) (6),
esophageal cancer (7),
hepatocellular carcinoma (HCC) (8), colorectal cancer (9), and lung cancer (10). According to the theory lncRNAs can
regulate miRNAs and mRNAs by sequestering and binding them, many
researchers also found lncRNA regulation of progression in GC
(11,12). In addition, cancer specific lncRNAs
may also relate to invasion and metastasis of GC (13).
LncRNAs play important biological roles as a
regulatory molecule through a variety of mechanisms. Salmena et
al, presented the competing endogenous RNA (ceRNA) hypothesis,
indicated that RNA transcripts communicate with each other by miRNA
response elements (14). This
competition between mRNAs, lncRNAs and pseudogene transcripts
regulate each other's expression by using miRNA response elements
(MREs) to compete for the binding of miRNAs, which exert an
important role in the initiation and progression of tumor (15).
Gu et al (16), reported abnormal lncRNA expression
profile of GC by microarray analysis from six GC patients. To date,
there is also lack of large sample size studies and cancer specific
lncRNA biomarkers or detection methods in GC. Moreover, small
sample studies can not explain whether abnormal lncRNAs are related
with gender, survival or other clinical features with statistical
power. The Cancer Genome Atlas (TCGA) (http://cancergenome.nih.gov) project data portal
provides a platform of RNA sequencing with mRNA, miRNA and lncRNA
data for GC. To improve the reliability and accuracy of the
results, we further explored lncRNAs in GC using data sets by the
tools of TCGA. A total of 361 samples of GC tumor tissues, and 34
adjacent non-tumor stomach tissue RNA sequence results were
included from TCGA. To the best of our knowledge, our study is the
first to use the large scale sequencing database to explore the
cancer specific lncRNA expression profiles and ceRNAs co-expression
network in GC. We also used quantitative RT-PCR (qRT-PCR)
validation for some of these bioinformatic analysis results in
tumor tissues and adjacent non-tumor tissues from 82 newly
diagnosed GC patients. This approach of finding cancer specific
lncRNAs and ceRNA related network can help to clarify the functions
of lncRNAs in GC.
Materials and methods
Patients and samples
A total of 443 patients with GC were collected from
the TCGA database. The criteria of exclusion were set as follows:
i) tissues samples without completed data for analysis; ii)
histologic diagnosis is not stomach adenocarcinoma; iii) suffering
of other malignancy except GC; iv) patients had received
preoperative chemoradiation; and v) overall survival time more than
5 years. Overall, a total of 361 GC patients were included in our
study. Among these 361 GC patients, the GC tumor tissues were
obtained from 361 subjects and the adjacent non-tumor stomach
tissues were from 34 subjects. In addition, there are 338 GC
patients with lymphatic metastases and 23 GC patients with
non-lymphatic metastases. According to the histologic staging data,
well and moderately-differentiated adenocarcinoma GC (G1-2 stage)
were 133 cases, and poorly-differentiated adenocarcinoma GC (G3-x
stage) were 228 cases. This study was fully compliance with the
publication guidelines provided by TCGA. The data were obtained by
using TCGA database, so the approval of ethics committee was not
required.
In addition, 82 GC patient specimens, aged 45–70
years, and their paired adjacent non-cancerous tissue specimens
were obtained from the Wuwei Tumor Hospital of Gansu (Wuwei,
China), for quantitative RT-PCR analysis. All of these patients
were assigned a diagnosis of GC based on histopathology and
clinical history. Clinical information that was recorded for each
specimen included age, tumor grade, cancer stage, tissue
dimensions, and date of resection. None of the patients had
received preoperative chemoradiation. Adjacent noncancerous tissues
were located ≥5 cm from the tumor edge. Tissue samples were
immersed in RNAlater (Ambion, Austin, TX, USA) and stored at −80°C
until use.
RNA sequence data sets and differential
analysis
The stomach adenocarcinoma (STAD) RNA expression
profile data (level 3) of the corresponding patients were obtained
from TCGA data portal (up to Nov 1, 2015) (https://tcga-data.nci.nih.gov/tcga/dataAccessMatrix.htm?mode=ApplyFilter).
TCGA database provide the normalized count data of RNA sequencing
including lncRNA and mRNA expression profiles by RNASeqV2 system.
The STAD level 3 microRNA sequencing (miRNAseq) data, downloaded
from TCGA database, were collected by Illumina HiSeq 2000 microRNA
sequencing platforms (Illumina Inc., Hayward, CA, USA). The
downloaded data including many individual data files consist of one
for each tissue sample. TCGA database have already normalized these
RNA expression profile data, so no further normalization was
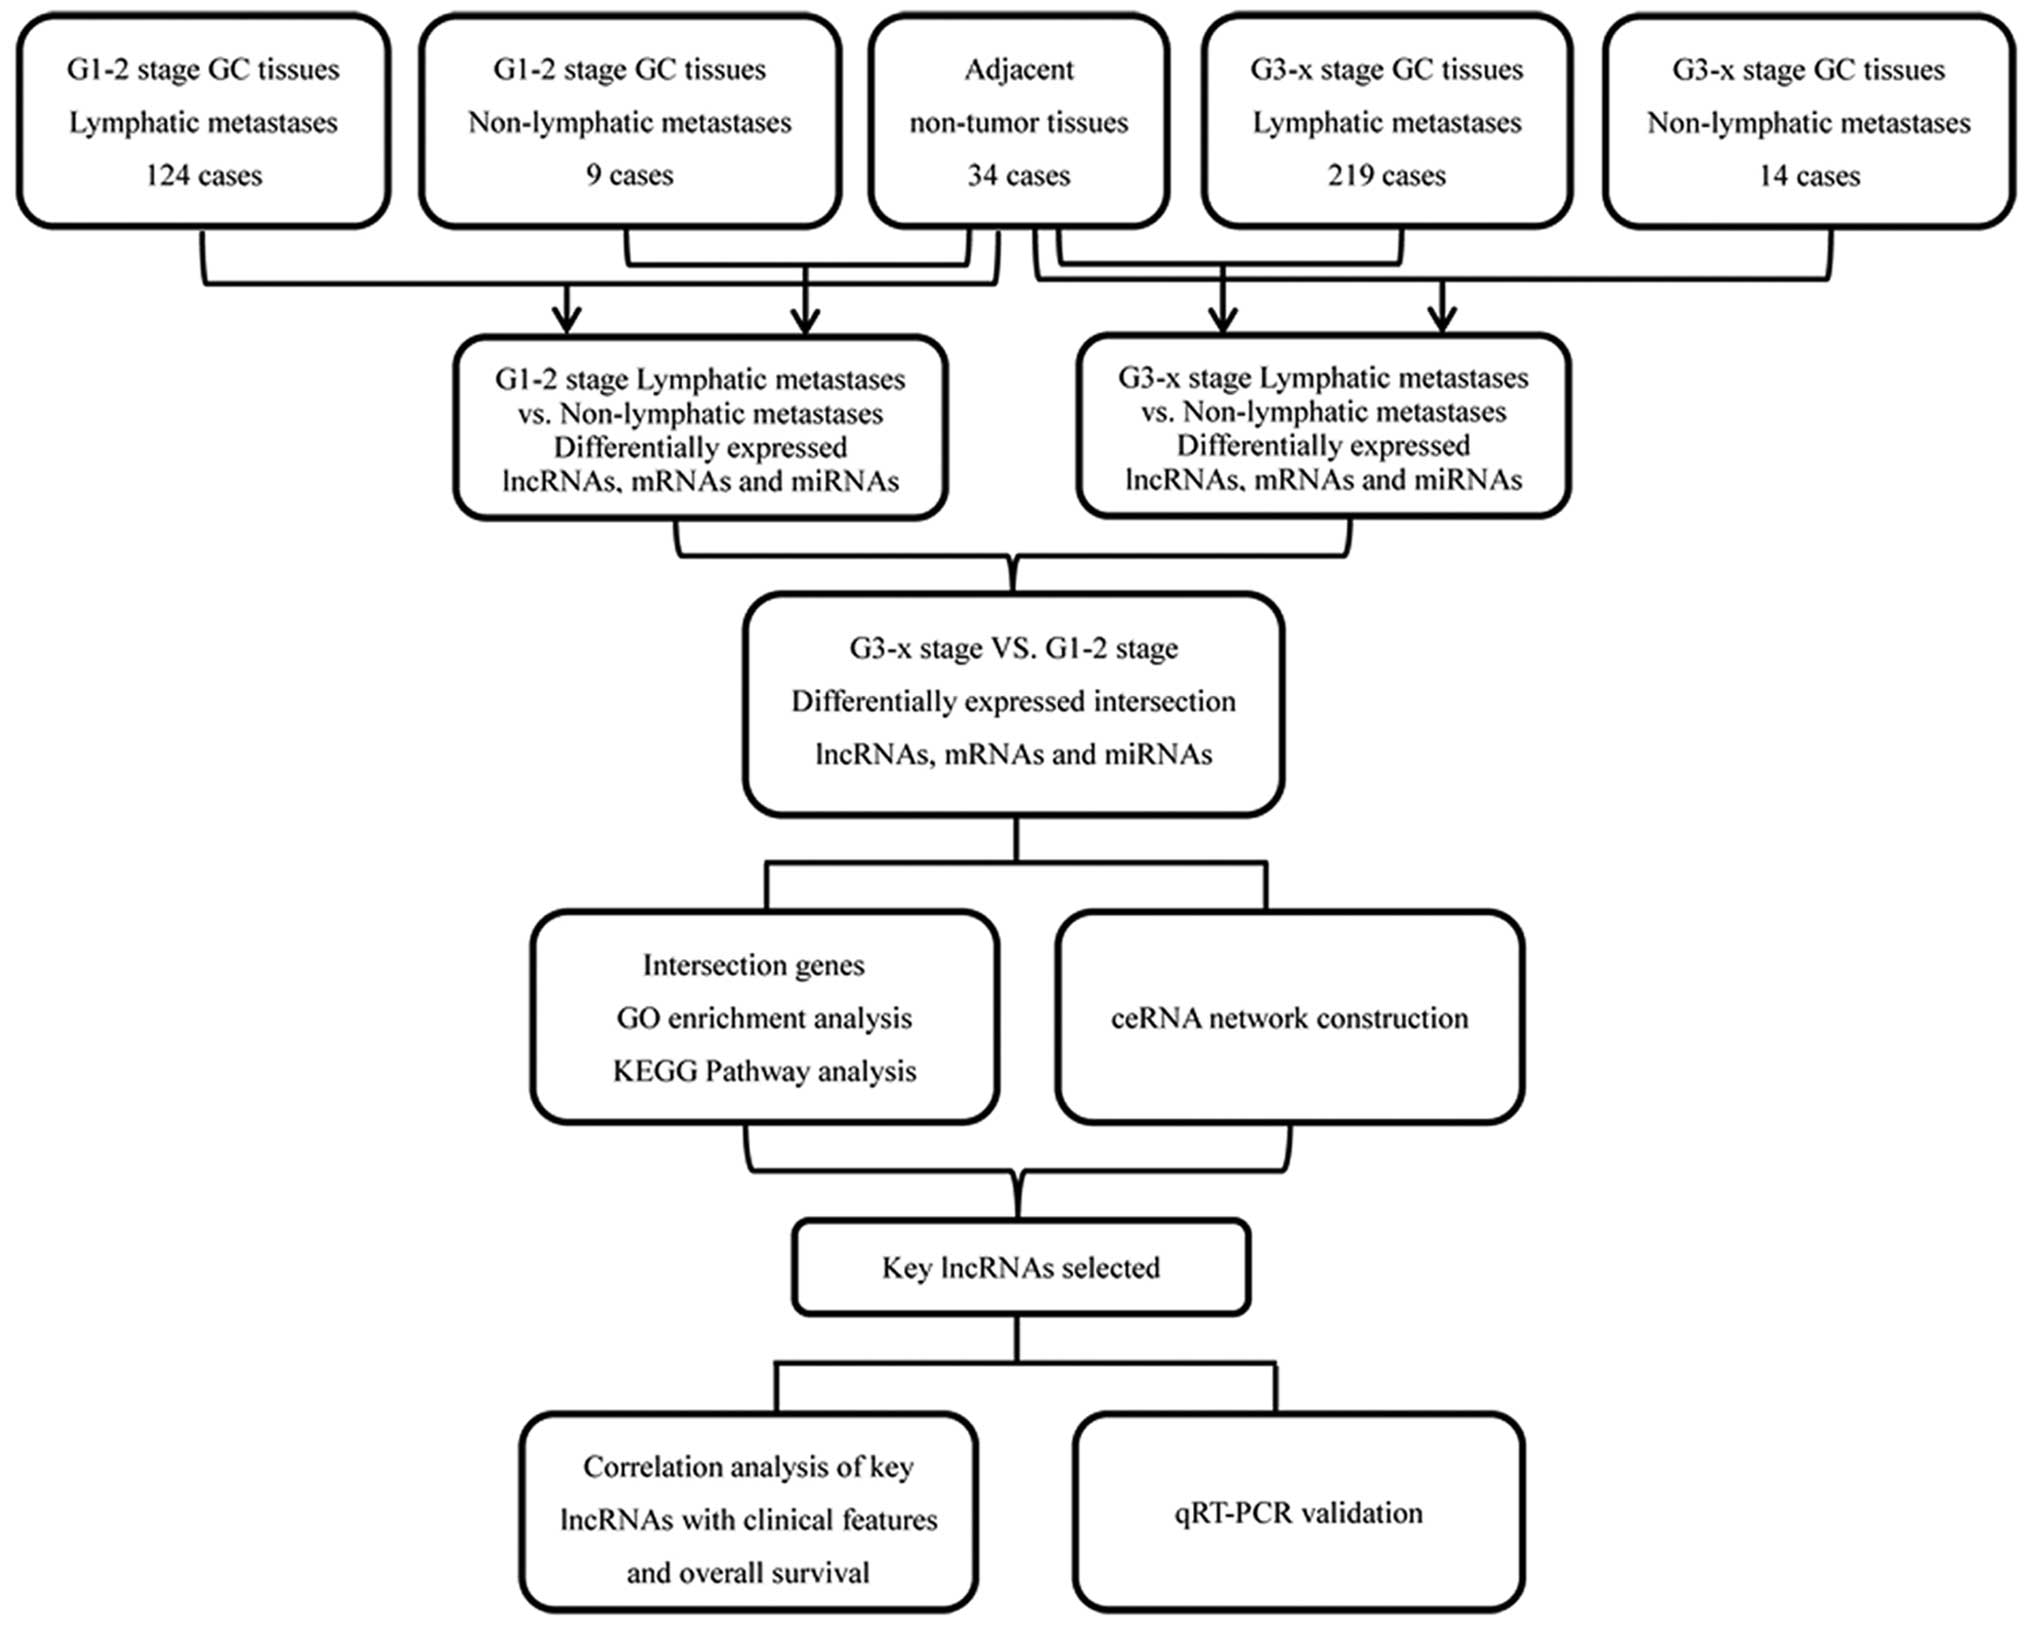
required. In the next step, we compared the differentially
expressed lncRNAs, mRNAs and miRNAs in 3 levels, including, GC
patient tumor tissues/adjacent non-tumor stomach tissues, lymphatic
metastases of GC patients/non-lymphatic metastases of GC patients,
well and moderately-differentiated (G1-2 stage) adenocarcinoma of
GC/poorly-differentiated (G3-x stage) adenocarcinoma of GC,
respectively. Then, we chose intersection lncRNAs, mRNAs and miRNAs
in the above 3 levels for further analysis. Fig. 1 depicts a flow chart for
bioinformatics analysis.
GO and Pathway analysis
Differentially expressed intersection mRNAs were
entered into the Gene Ontology database (http://www.geneontology.org), which utilized GO to
identify the molecular function represented in the gene profile. Up
and downregulated genes were analyzed, respectively. The Kyoto
Encyclopedia of Genes and Genomes (KEGG) (http://www.kegg.jp/) was used to analyze the potential
functions of these genes participated in the pathways (17).
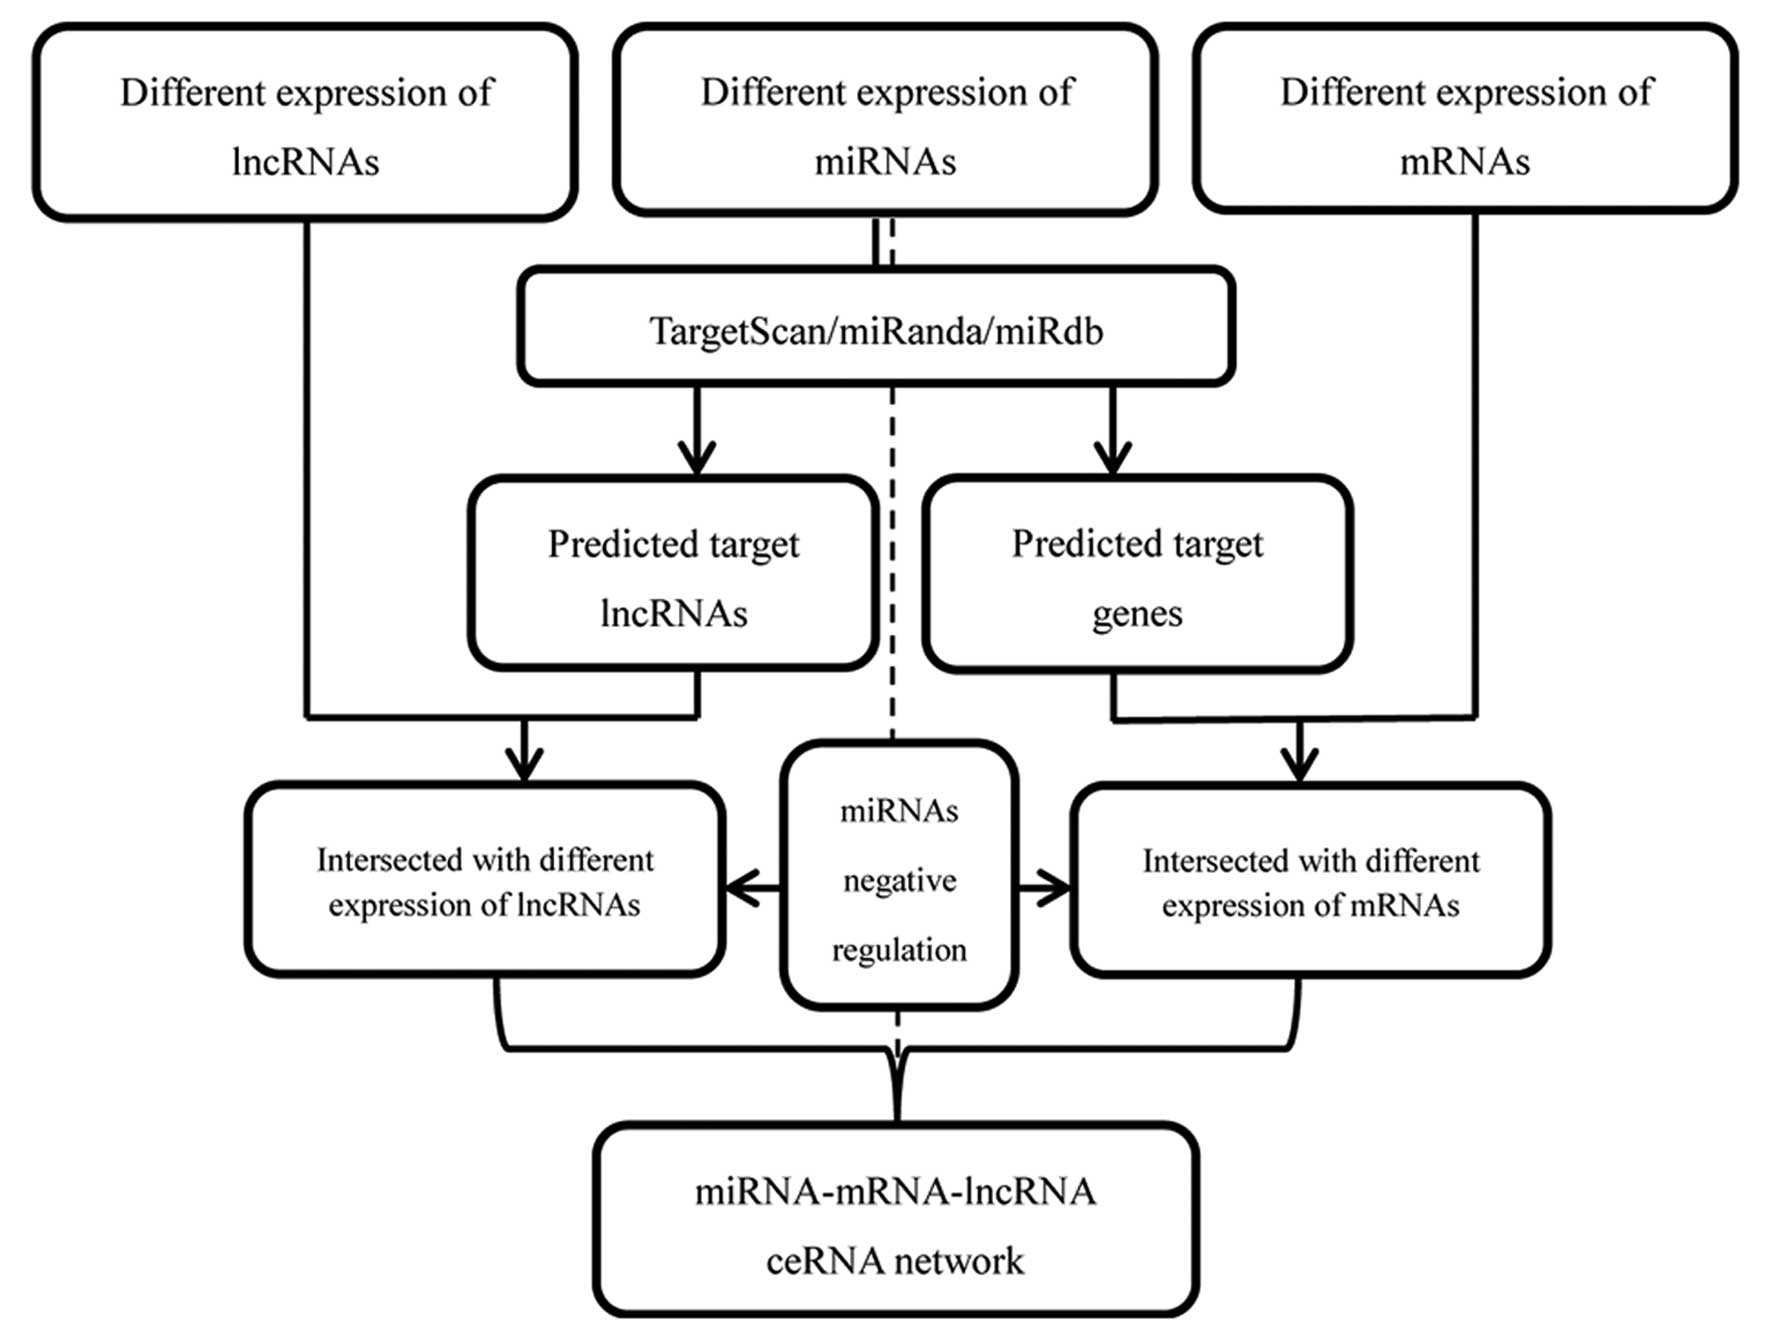
Construction of the ceRNA network
According to the relationship among lncRNA, miRNA
and mRNA, the posttranscriptional regulation of mRNA transcripts
bound by single-stranded miRNAs is basically established. In this
study, we built miRNA-lncRNA-mRNA ceRNA network which are based on
the theory that lncRNA can regulate miRNA abundance by sequestering
and binding them, acting as so-called miRNA sponges. We chose
differentially expressed intersection miRNA, lncRNA, and mRNA with
fold change >2.0 (including upregulation and downregulation) and
p<0.05. Predicted differentially expressed miRNA targets in this
study were determined using miRanda (http://www.microrna.org/microrna/home.do) to find the
lncRNA-miRNA interactions, and using mRBase targets (http://mirdb.org/miRDB/) and Targetscan (http://www.targetscan.org/) to predict target genes.
Next the study combined the information of miRNAs predicted and
differentially expressed data of TCGA to choose the inter section
lncRNAs and mRNAs. Then, according to the theory of ceRNA, we chose
the miRNA negatively regulated intersection expression of lncRNAs
and mRNAs to construct the ceRNA network. The ceRNA networks were
constructed and visualized using Cytoscape v3.0 (18). Fig.
2 depicts a flow chart for ceRNA network construction.
Key lncRNAs and clinical feature analysis
and qRT-PCR validation
According to the bioinformatics analysis and the
ceRNA network, key lncRNAs were chosen. We further analyzed the
clinical features including race, gender, tumor grade, TNM stage,
pathological stage and invasion. In addition, our study also
analyzed the association between the key lncRNAs and the GC patient
survival time. Finally, we selected some of the key lncRNAs and
used qRT-PCR to validate the results of bioinformatics analysis
from 82 newly diagnosed GC patients.
Statistical analysis
All the results were expressed as mean ± SD.
Statistical analysis was done with Student's t-test for comparison
of two groups in data analysis, and ANOVA for multiple comparisons.
In both cases, differences with p<0.05 were considered
statistically significant. The statistical significance of data
analysis results was analyzed by fold change and Student's t-test.
False discovery rate was calculated to correct the p-value. qRT-PCR
relative fold change results are calculated using the
2−ΔΔCt method (19),
where [ΔCt = (Ct RNAs - Ct GAPDH) and ΔΔCt =
ΔCt tumor tissues - ΔCt adjacent non-tumor
tissues].
Results
Cancer specific lncRNAs in GC
We identified that 268 lncRNAs were differentially
expressed between GC tumor tissues and adjacent non-tumor tissues
from TCGA database (absolute fold change >2, p<0.05). In
further analysis of these differentially expressed lncRNAs, between
GC tumor tissues and adjacent non-tumor tissues, we found 208
lncRNAs were differentially expressed between G1-2 stage (lymphatic
metastasis) GC tumor tissues and adjacent non-tumor tissues; 48
lncRNAs were differentially expressed between G1-2 stage
(non-lymphatic metastasis) GC tumor tissues and adjacent non-tumor
tissues; 153 lncRNAs were differentially expressed between G3-x
stage (lymphatic metastasis) GC tumor tissues and adjacent
non-tumor tissues; 101 lncRNAs were differentially expressed
between G3-x stage (non-lymphatic metastasis) GC tumor tissues and
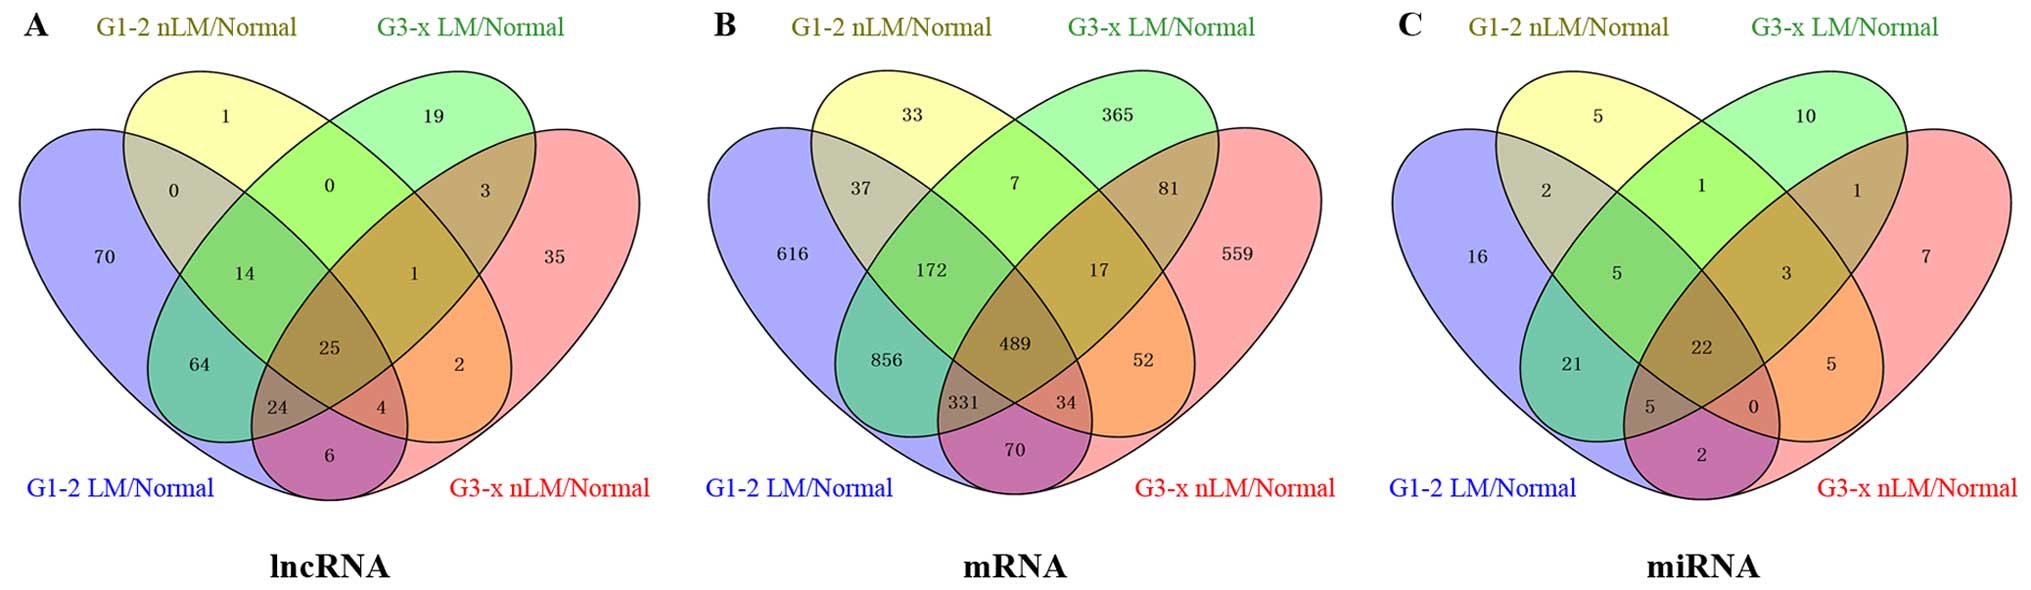
adjacent non-tumor tissues. To further enhance the reliability of
the bioinformatics analysis, we selected 25 lncRNAs included in the
intersection of the above analyzed levels (Fig. 3A). Finally, 25 lncRNAs (16
upregulated; 9 down regulated) were selected to build the ceRNA
network (Table I).
 | Table IDifferentially expressed intersection
lncRNAs between G1-2 LM/Normal, G1-2 nLM/Normal, G3-x LM/Normal and
G3-x nLM/Normal.a |
Table I
Differentially expressed intersection
lncRNAs between G1-2 LM/Normal, G1-2 nLM/Normal, G3-x LM/Normal and
G3-x nLM/Normal.a
| Name (lncRNAs) | Transcript-ID | Regulation | Average
fold-change |
|---|
| HOXA11-AS | 221883 | Up | 16.58 |
| HNF1A-AS1 | 283460 | Up | 13.09 |
| HOTAIR | 100124700 | Up | 12.30 |
| RPLP0P2 | 113157 | Up | 10.31 |
| UCA1 | 652995 | Up | 9.29 |
| PVT1 | 5820 | Up | 7.34 |
| H19 | 283120 | Up | 6.66 |
| FOXD2-AS1 | 84793 | Up | 6.15 |
| GUCY1B2 | 2974 | Up | 4.84 |
| LOC553137 | 553137 | Up | 4.63 |
| TSPEAR-AS2 | 114043 | Up | 3.86 |
| FCGR1C | 100132417 | Up | 3.82 |
| ATP8B5P | 158381 | Up | 3.43 |
| IGF2BP2-AS1 | 646600 | Up | 3.34 |
| LOC100131496 | 100131496 | Up | 3.28 |
| RHPN1-AS1 | 78998 | Up | 3.13 |
| PGM5-AS1 | 572558 | Down | −11.98 |
| PART1 | 25859 | Down | −11.59 |
| SNORD116-4 | 100033416 | Down | −5.71 |
| LOC100128164 | 100128164 | Down | −5.06 |
| SMIM10L2A | 399668 | Down | −4.60 |
| SLC26A4-AS1 | 286002 | Down | −3.57 |
| GGTA1P | 2681 | Down | −3.36 |
| SMIM10L2B | 644596 | Down | −3.36 |
| TINCR | 257000 | Down | −3.28 |
GO and Pathway analysis of differentially
expressed genes
Predicted functions of differentially expressed
genes in this study were determined by intersection mRNAs. Our
study found that 3719 mRNAs were differentially expressed between
GC tumor tissues and adjacent non-tumor tissues in TCGA. We further
analyzed these differentially expressed genes and found 2605 mRNAs
were differentially expressed between G1-2 stage (lymphatic
metastasis) GC tumor tissues and adjacent non-tumor tissues; 841
mRNAs were differentially expressed between G1-2 stage
(non-lymphatic metastasis) GC tumor tissues and adjacent non-tumor
tissues; 2318 mRNAs were differentially expressed between G3-x
stage (lymphatic metastasis) GC tumor tissues and adjacent
non-tumor tissues; 1633 mRNAs were differentially expressed between
G3-x stage (non-lymphatic metastasis) GC tumor tissues and adjacent
non-tumor tissues. Finally, we selected 489 mRNAs, which included
in the intersection of the above analyzed levels (Fig. 3B).
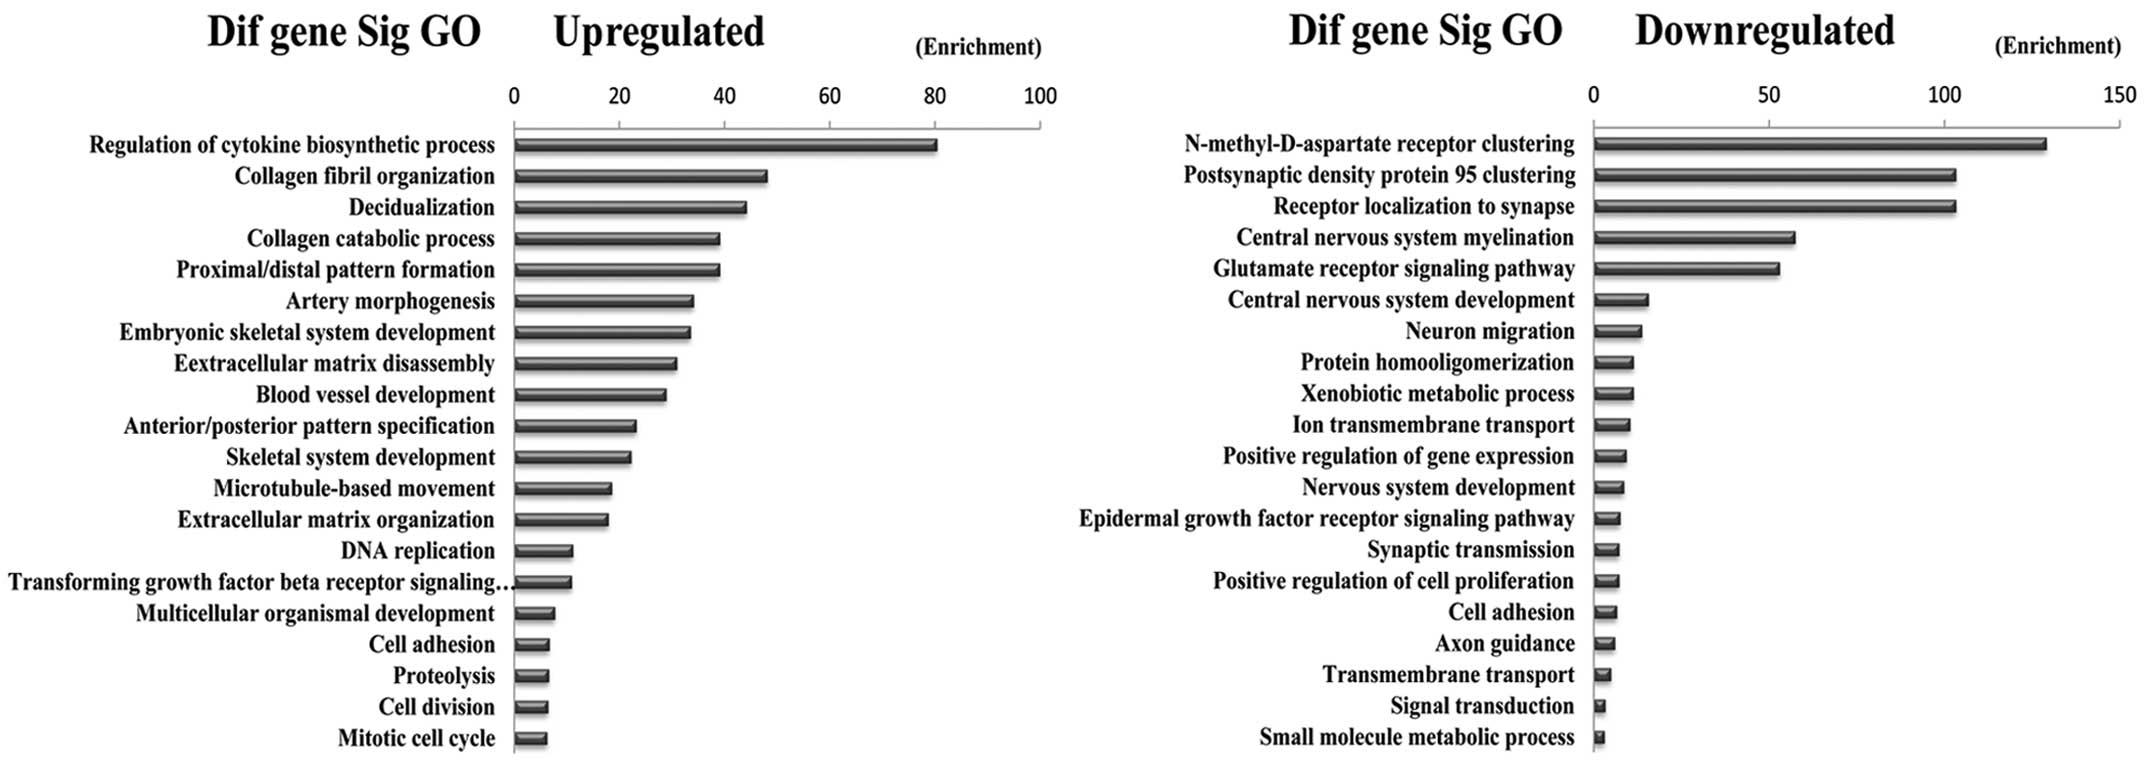
The 489 differentially expressed genes were further
analyzed by Gene Ontology database (http://www.geneontology.org). The upregulated and down
regulated genes were analyzed, respectively. We analyzed the
enrichment of these differentially expressed genes. Enrichment
provides a measure of the significance of the function, and as the
enrichment increases, the corresponding function is more specific,
which helps us to identify GO with a more definitive functional
description (20). The results
showed that the highest enriched GOs targeted by upregulated
transcripts were ‘Regulation of cytokine biosynthetic processes’.
The highest enriched GOs targeted by downregulated transcripts were
‘N-methyl-D-aspartate receptor clustering’ (Fig. 4).
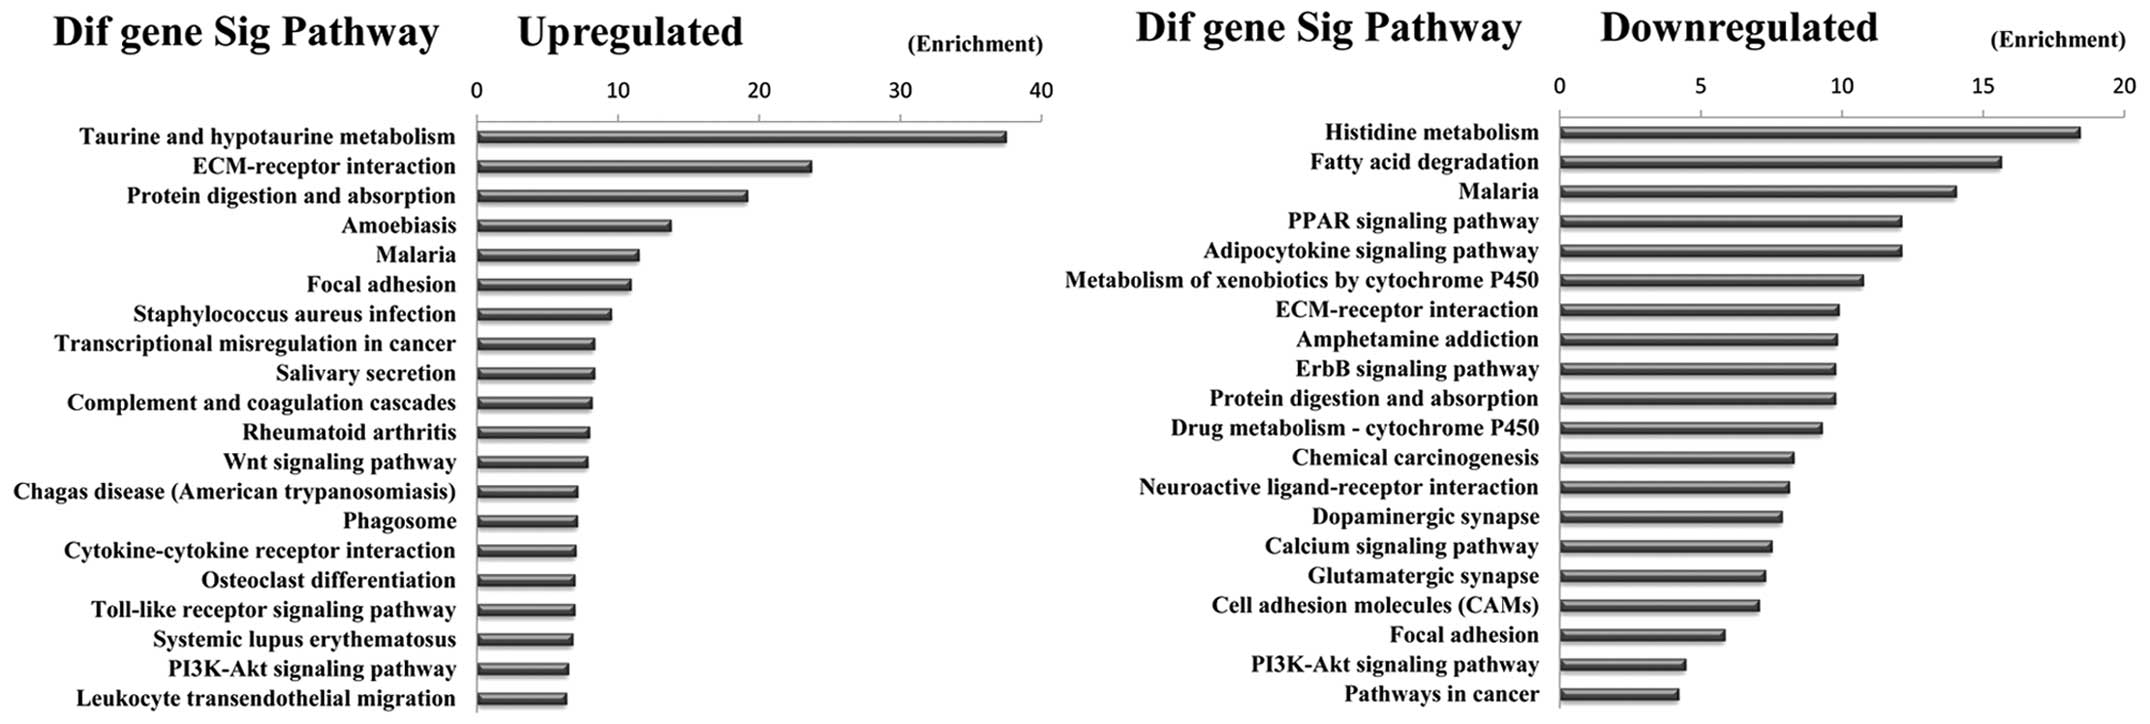
Pathway analysis indicated that 23 pathways
corresponded to upregulated transcripts and that the most enriched
network was ‘Taurine and hypotaurine metabolism’. Moreover, pathway
analysis also showed that 39 pathways corresponded to downregulated
transcripts and that the most enriched network was ‘Histidine
metabolism’. Among these pathways, such as the ‘PI3K-Akt signaling
pathway’, is involved in the carcinogenesis of gastric
adenocarcinoma metastases (21),
the ‘Wnt signaling pathway’ has been investigated as a cause of
adenocarcinoma invasion (22) and
the gene category ‘Pathways in cancer’ is involved in the
development of GC. In addition, some pathways such as ‘Small cell
lung cancer, Cell adhesion molecules (CAMs), Proteoglycans in
cancer and Transcriptional regulation in cancer’ were also reported
as cancers related pathways (23,24)
(Fig. 5).
Predicted miRNAs targeted relationship
and ceRNA network construction
In this study we have found 105 GC associated miRNAs
which were differentially expressed between GC tumor tissues and
adjacent non-tumor tissues. We selected 22 intersection miRNAs from
105 GC associated miRNAs by bioinformatics analysis from G1-2
lymphatic metastases GC patients /non-lymphatic metastases GC
patients and G3-x lymphatic metastases GC patients /non-lymphatic
metastases GC patients (Fig. 3C).
In the next step, we focused on whether these intersection miRNAs
would target the above 25 GC specific lncRNAs. In the ceRNAs
network, 17 miRNAs targeted 19 key lncRNAs were predicted though
miRcode (http://www.mircode.org/) (25) (Table
II).
| Table IImiRNAs targeting specific
intersection key lncRNAs in GC. |
Table II
miRNAs targeting specific
intersection key lncRNAs in GC.
| Key lncRNAs | miRNAs |
|---|
| ATP8B5P | miR-133a-3p,
miR-133b, miR-145-3p, miR-204-5p, miR-30c-2-3p |
| FOXD2-AS1 | miR-129-5p,
miR-139-5p, miR-145-3p, miR-145-5p |
| GUCY1B2 | miR-129-5p,
miR-145-3p, miR-145-5p, miR-204-5p, miR-30c-2-3p |
| H19 | miR-129-5p,
miR-145-3p, miR-145-5p, miR-486-5p |
| HOTAIR | miR-1, miR-133a-3p,
miR-133b, miR-145-3p, miR-204-5p |
| LOC100128164 | miR-182-5p,
miR-183-5p, miR-194-5p, miR-196b-5p, miR-335-3p, miR-4326 |
| SNORD116-4 | miR-1, miR-139-3p,
miR-204-5p, miR-30c-2-3p, miR-363-3p |
| LOC553137 | miR-129-5p,
miR-139-5p, miR-144-5p, miR-145-5p, miR-30c-2-3p |
| PART1 | miR-135b-5p,
miR-182-5p, miR-196a-5p, miR-196b-5p, miR-335-3p, miR-4326 |
| PGM5-AS1 | miR-182-5p,
miR-335-3p, miR-4326 |
| PVT1 | miR-30c-2-3p |
| RHPN1-AS1 | miR-145-3p,
miR-145-5p, miR-451a, miR-486-5p |
| RPLP0P2 | miR-129-5p,
miR-30c-2-3p |
| SLC26A4-AS1 | miR-194-5p,
miR-335-3p |
| SMIM10L2A | miR-182-5p,
miR-183-5p, miR-194-5p, miR-196a-5p, miR-196b-5p, miR-4326 |
| SMIM10L2B | miR-182-5p,
miR-196a-5p, miR-196b-5p, miR-4326 |
| TINCR | miR-135b-5p,
miR-196a-5p, miR-196b-5p, miR-4326 |
| TSPEAR-AS2 | miR-144-5p,
miR-486-5p |
| UCA1 | miR-1 |
Then, in order to establish the lncRNA-miRNA-mRNA
ceRNAs network, we also search for mRNAs targeted by miRNAs.
According to the miRNAs described in Table II, we predicted miRNAs targeted
mRNAs though miRTarBase (http://mirtarbase.mbc.nctu.edu.tw/) (26). Finally, we selected the
intersection mRNAs through the predicted mRNAs and bioinformatics
analyzed differentially expressed 489 mRNAs. The results identified
14 miRNAs (Table III) related to
the 67 intersection mRNAs, and some of them have been reported to
be cancer-associated genes such as COL1A1, FIGF, GHR, HOXC10,
HOXC13, HOXC8, LIFR and SF11B.
| Table IIImiRNAs targeted cancer specific
intersection mRNAs. |
Table III
miRNAs targeted cancer specific
intersection mRNAs.
| miRNAs | mRNAs |
|---|
| miR-1 | ADAM12, CELSR3,
FN1 |
| miR-129-5p | COL1A1, CSMD2,
EME1, AKT3, HOXC13, HOXC8, IGF2BP1, KIT, PMEPA1, SALL4 |
| miR-133a-3p | XIRP1 |
| miR-135b-5p | COX6B2, ERBB4, GHR,
GPR155, MAOB, GRIK3, HDC, MYOCD, PAK7, PDE8B, PLCXD3, PRIMA1,
RIMS1, SLITRK6 |
| miR-139-5p | HOXA9, KIT |
| miR-145-5p | SERPINE1, TNFR,
SF11B |
| miR-182-5p | ATOH8, CADM2, CHL1,
BIRC7, ASPA, FAM107A, FIGF, MAOB, GRIK3, KLF15, LHFPL4, MYRIP,
PDK4, RIMS3, SLC16A9 |
| miR-183-5p | COMP |
| miR-194-5p | AFF3, GRIN2A,
ATM |
| miR-196a-5p | ACSL6, AQP4, NRXN1,
OPCML, RSPO2 |
| miR-204-5p | ADAM12, CELSR3,
HMGA2, HOXC8, KIT |
| miR-30c-2-3p | AKT3, IGF2BP1,
TOP2A |
| miR-335-3p | ACSL6, GHR, GPR155,
GRIN2A, HS6ST3, COL4A5, COL4A6, KIAA2022, LIFR, MYRIP, PARK2,
PLCXD3, COL11A6, ATP2B |
| miR-363-3p | HMGA2, NOX4,
ZNF469 |
Based on Tables II
and III, we constructed a
miRNA-lncRNA-mRNA ceRNA network. The miRNA-lncRNA-mRNA relationship
was integrated into the ceRNA network through negative regulation.
The ceRNA network was drawn using Cytoscape 3.0. Nineteen lncRNAs,
22 miRNAs (Tables II and III complementary miRNAs) and 67 mRNAs
were involved in the ceRNA network (Fig. 6). We also analyzed the mRNAs
involved in ceRNA network to understand the lncRNAs indirectly
regulated signal pathways by DAVID database (https://david.ncifcrf.gov/). According to the number
of mRNAs involved, we listed the top 8 KEGG pathways in our study
(Table IV). Four cancer-related
pathways including pathways in ‘Pathways in cancer, Small cell lung
cancer, Renal cell carcinoma and PI3K-Akt signaling pathway’ were
enriched with the mRNAs, another 4 non-cancer related pathways such
as ‘Focal adhesion, ECM-receptor interaction, Histidine metabolism
and ErbB signaling pathway’ were also enriched.
| Table IVKEEG pathways enriched by the coding
genes involved in the ceRNA network. |
Table IV
KEEG pathways enriched by the coding
genes involved in the ceRNA network.
| KEEG pathways | Genes |
|---|
| Cancer related |
| Pathways in
cancer | KIT, FIGF, COL4A6,
AKT3, FN1 |
| Small cell lung
cancer | COL4A6, AKT3,
FN1 |
| Renal cell
carcinoma | PAK7, FIGF,
AKT3 |
| PI3K-Akt signaling
pathway | AKT3, KIT,
FIGF |
| Non-cancer
related |
| Focal
adhesion | PAK7, COMP, COL1A1,
FIGF, COL4A6, AKT3, FN1 |
| ECM-receptor
interaction | COMP, COL1A1,
COL4A6, FN1 |
| Histidine
metabolism | ASPA, HDC,
MAOB |
| ErbB signaling
pathway | PAK7, ERBB4,
AKT3 |
Key lncRNAs and clinical feature
association and qRT-PCR validation
The 19 key lncRNAs from the ceRNA network were
further analyzed according to the clinical features, respectively,
including race, gender, tumor grade, TNM stage and lymphatic
metastasis status in TCGA data sets. There were 14 GC specific
lncRNAs, the expression levels of which were significantly
different in comparison of clinical features (p<0.05). We found
that ATP8B5P, FOXD2-AS1, UCA1, GUCY1B2, RHPN1-AS, TSPEAR-AS2,
LOC100128164 and SLC26A4-AS1 were linked to tumor grade, PVT1, H19
and PART1 were linked to TNM stage, LOC553137, HOTAIR and TINCR
were linked to lymphatic metastasis (Table V).
| Table VThe correlation between cancer
specific lncRNAs and clinical features. |
Table V
The correlation between cancer
specific lncRNAs and clinical features.
| Comparisons | Upregulated | Downregulated |
|---|
| Gender (Female vs.
Male) | | TINCR |
| Race (White vs.
Asian) | H19 | |
| Tumor grade (G3-x
vs. G1-2) | ATP8B5P, FOXD2-AS1,
UCA1, GUCY1B2, RHPN1-AS, TSPEAR-AS2 | LOC100128164,
SLC26A4-AS1 |
| TNM staging system
(T3 + T4 vs. T1 + T2) | PVT1, H19 | PART1 |
| Lymphatic
metastasis (No vs. Yes) | LOC553137,
HOTAIR | TINCR |
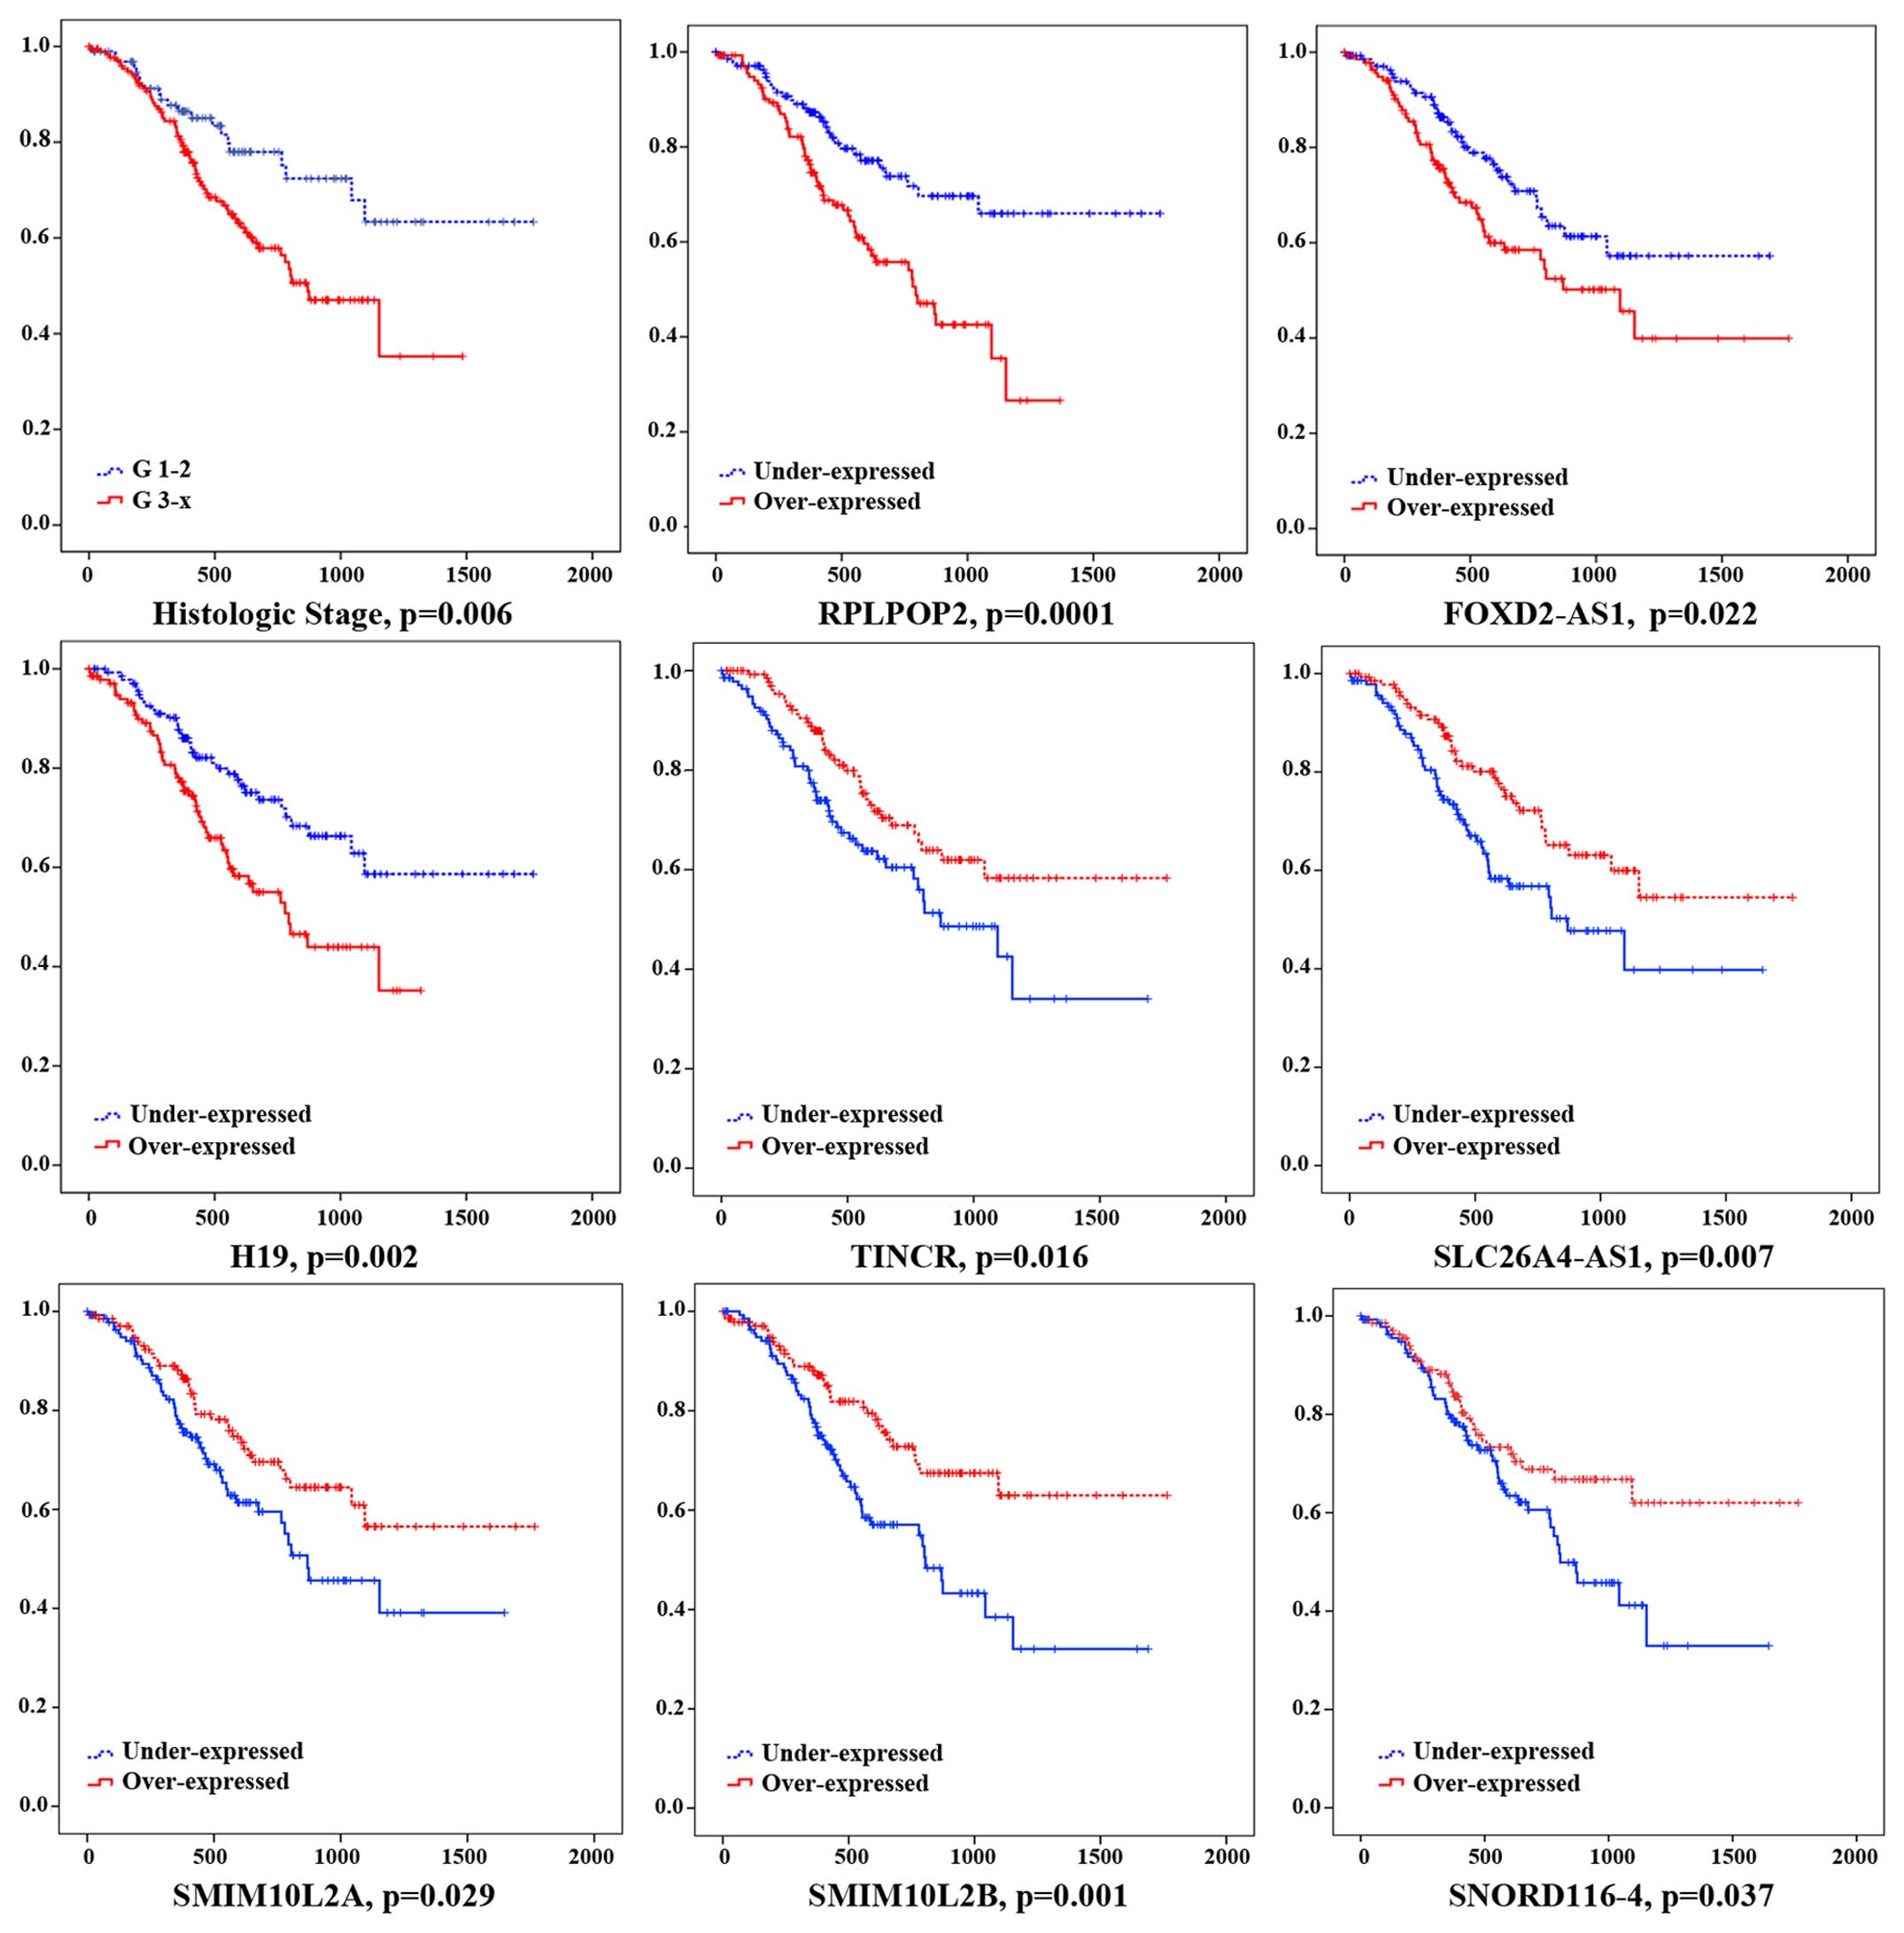
Furthermore, to further identify the 19 key lncRNAs
with prognostic characteristics from 361 GC patients, the lncRNA
data set and the overall survival information were profiled by the
univariate Cox proportional hazards regression model and 8 lncRNAs
were found significantly associated with GC patients' overall
survival (log-rank p<0.05). Among the 8 significant lncRNAs, 3
lncRNA (RPLP0P2, FOXD2-AS1 and H19) were negatively associated with
overall survival (p<0.05), while the remaining 5 lncRNA (TINCR,
SLC26A4-AS1, SMIM10L2A, SMIM10L2B and SNORD116-4) were positively
correlated with overall survival (p<0.05) (Fig. 7).
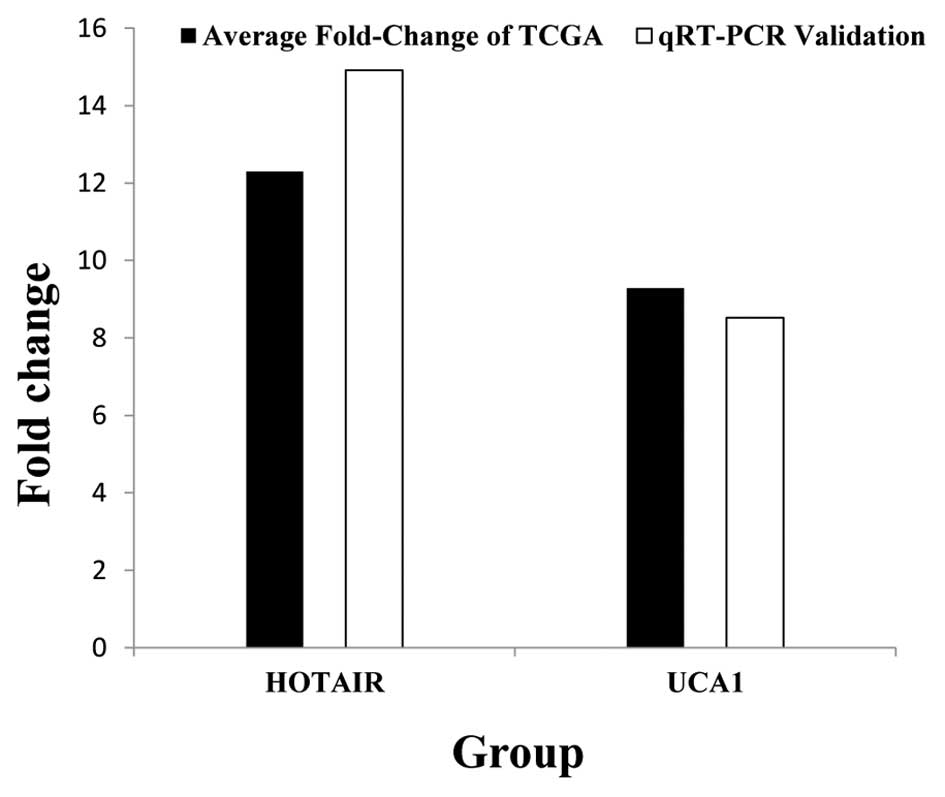
Subsequently, to confirm the reliability and
validity of the above analyzed results, we random selected 2 key
lncRNAs (HOTAIR, UCA1) and analyzed their actual expression levels
in 82 newly diagnosed tumor tissues of GC patients and adjacent
non-tumor tissues. Results suggest that HOTAIR and UCA1 both were
significantly higher expressed in GC tumor tissues than adjacent
non-tumor tissues. The results from the qRT-PCR validation in 82
newly diagnosed GC patients and the above bioinformatics results
(Table I) were 100% in agreement
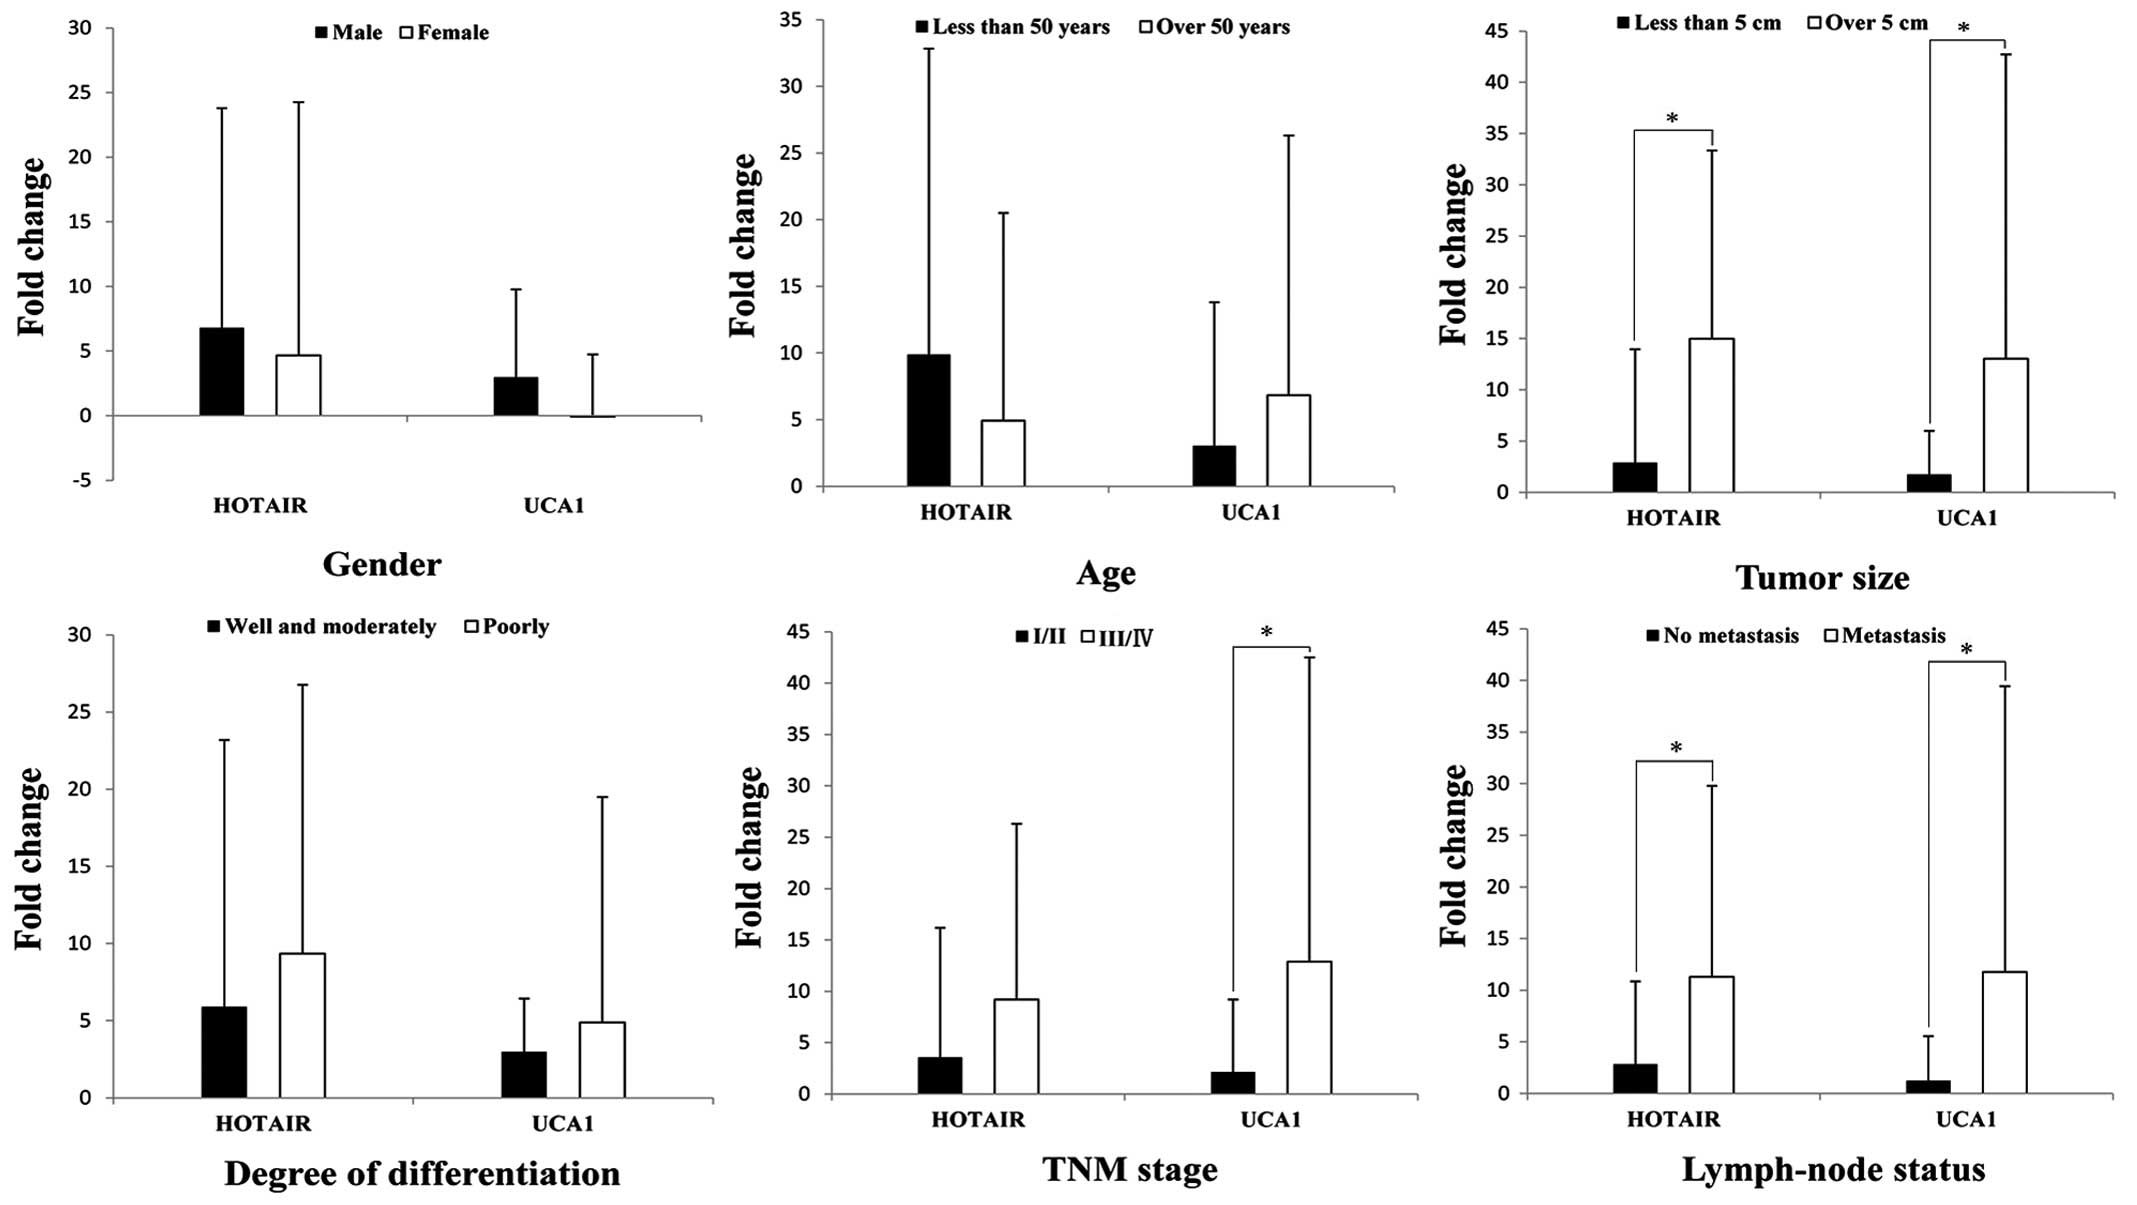
(Fig. 8). To further analyze the
association between the 2 key lncRNAs and clinicopathological
characteristics of 82 GC patients, we found that HOTAIR was
significantly associated with tumor size and lymphatic metastasis,
and UCA1 was significantly associated with tumor size, TNM stage
and lymphatic metastasis (Fig. 9).
The two lncRNAs are clinically relevant and the results of
bioinformatics analysis were almost the same, and the results
showed that our bioinformatics analysis is credible.
Discussion
Although over several decades there appears to a
slight decline in gastric cancer (GC) incidence and associated
mortality (27), it still has
outstanding incidence and mortality in China, with a large number
of patients diagnosed with an advanced stage and poor prognosis
(28). Many Japanese series have
consistently reported that early diagnosis and treatment of GC,
with a 5-year survival rate approximately 90% (29). However, the diagnosis of
gastrointestinal (GI) endoscopy cannot find all precancerous
diseases and the early stages GC (30). Therefore, in order to improve this
situation, increasing attention has been given to the
identification of genes and the exact regulatory mechanism of GC
development and progress. Recent years, lncRNAs have been found to
be associated with wide range of biological regulatory functions
(31). Many studies have reported
that lncRNAs participated in pathogenesis of cancers, epigenome,
levels of transcription and post-transcription (32–34).
To date, only a few studies have reported the expression profiles
of lncRNA in GC by microarray or sequencing, and with small sample
size (35). LncRNA and mRNA
co-expression network was built by significantly differently
expressed lncRNA and mRNA (36).
In addition, some studies also described interactions between
lncRNAs and miRNAs (37–39) or lncRNAs and mRNAs (40) in GC, the results of which showed
that lncRNAs may function as a part of GC related regulation
network, but lncRNA functions are still poorly explored.
In the present study, we identified tumor grade and
lymphatic metastasis related specific lncRNAs, mRNAs and miRNAs in
GC from TCGA database. We predicted functions of differentially
expressed genes in GC by GO and Pathway analysis. Then, according
to the bioinformatics differential analysis we constructed a ceRNA
network with tumor grade and lymphatic metastasis related GC
specific lncRNAs, mRNAs and miRNAs, which provides an integrated
biological views of ceRNA network. Furthermore, we selected key
lncRNAs from ceRNA network and further investigated their
distributions in different GC clinical features and their
correlations with overall survival on the basis of RNA sequencing
profile from TCGA. Finally, we randomly selected two key lncRNAs
(HOTAIR, UCA1) and analyzed their actual expression levels in the
82 newly diagnosed tumor tissues of GC patients and adjacent
non-tumor tissues using qRT-PCR and further analyzed the
association between the two key lncRNAs and clinicopathological
characteristics to confirm the reliability and validity of the
results of the bioinformatics analysis.
Based on the RNA sequence data from TCGA, we found
that 25 specific lncRNAs, 22 specific miRNAs and 489 specific
lncRNAs were differentially expressed in different tumor stage and
lymphatic metastasis of GC patients from 361 GC tumor tissues and
34 non-tumor stomach tissues. Focusing on dysregulation mRNAs
through GO and Pathway analysis, the GO results suggested the
functions of significant differences in the aspects of immune
functions, metabolism and cellular functions, the significant
differences in the pathways mainly focus on cancer-related pathways
such as ‘PI3K-Akt signaling pathway, Wnt signaling pathway,
pathways in cancer and small cell lung cancer’. Many
pathway-related analysis of the GC significant difference genes,
Liu et al (41) and Ren
et al (42), also found
‘PI3K-Akt signaling pathway and Wnt signaling pathway’ were related
with GC cell functions.
In addition, many studies have reported that lncRNAs
may function as ceRNA regulators to communicate with other RNA
transcripts (15,43–45).
For example, the lncRNA H19 has been shown to play an important
role in tumor progress (46), by
acting as an endogenous RNA sponge to inhibit miR-675 in breast
cancer and reducing miR-675 mediated translational repression of
c-Cb1 and Cb1-b (47). Therefore,
there may be some internal contact between lncRNA-miRNA-mRNA in the
progress and development of GC. Based on significant differences in
lncRNA, miRNA and mRNA expression data, we construction the ceRNA
network by bioinformatics prediction and correlation analysis. The
ceRNA network we built reveals an unknown ceRNA regulatory network
in GC. Recent study also identified that lncRNA interactions with
miRNA and mRNA might act as potential diagnosis and prognosis
biomarkers in cancer, such as H19, PVT1, HOTAIR, UCA1 and TINCR
(7,48–51).
In our ceRNA network, we also found these key lncRNAs. Furthermore,
many genes from the ceRNA network also were reported as oncogenes
and tumor suppressors participating in cancer development and
progression, such as COL1A1, FIGF, GHR, HOXC10, LIFR and SF11B
(52–54). In the present study, we analyzed
the GC specific lncRNA indirectly related mRNAs signal pathways
involved in ceRNA network. The pathways analysis results showed
that there were four pathways related with cancer. In addition, Ke
et al also found that the miR-326 was overexpressed after
knockdown lncRNA HOTAIR in glioma cells, which reduced FGF1
expression by activating the PI3K/AKT pathway (55). Therefore, our results suggested
that these key lncRNAs may play an important role in the
progression and development of GC and the cancer genes related
pathways.
To gain insight into the function of lncRNA, 19 key
lncRNAs from ceRNA network were analyzed for associations with the
clinical features such as gender, race, tumor grade, TNM staging
and lymphatic metastasis. The results suggested that 14 lncRNAs
were associated with the above indicators, such as HOTAIR, TINCR
and H19. These indicators of lncRNAs mainly focus on tumor grade,
TNM staging and lymphatic metastasis, among these lncRNAs, H19, and
HOTAIR also were reported to be indicators of invasion and
lymphatic metastasis of GC (56,57).
However, the function of other lncRNAs has not been reported with
relevant features yet. Then, we also analyzed the associations
between the above 19 key lncRNAs and patient survival. The results
showed that eight lncRNAs were related to GC overall survival.
Among these eight lncRNAs only H19 has been reported in the
survival of hepatocellular carcinoma (58), and the other lncRNAs (RPLP0P2,
FOXD2-AS1, TINCR, SLC26A4-AS1, SMIM10L2A, SMIM10L2B and SNORD116-4)
were not reported yet. However, the results of lncRNAs and overall
survival reveals potential indictors of prognosis in GC.
Subsequently, we randomly selected two key lncRNAs
(HOTAIR, and UCA1) and used qRT-PCR validation to confirm the
reliability and validity of the above bioinformatics results from
the 82 newly diagnosed GC patients. The results from the TCGA and
qRT-qPCR experiments were 100% in agreement. Correlation analysis
between the HOTAIR, UCA1 and the clinical features were performed.
The results showed that HOTAIR was significantly correlated with
tumor size and lymphatic metastasis, and UCA1 was significantly
correlated with tumor size, TNM stage and lymphatic metastasis. The
two lncRNAs are clinically relevant and the bioinformatics analysis
were almost the same, and the results showed that our
bioinformatics analysis is credible.
In conclusion, the present study successfully
identified cancer specific lncRNAs in GC by bioinformatics analysis
from hundreds of candidate lncRNAs and large scale samples in TCGA
database. Moreover, we constructed a ceRNA network; it provided a
new approach to lncRNA research in GC. Importantly, we analyzed
abnormal expression pattern of GC specific lncRNAs under different
clinical features and overall survival. We also used qRT-PCR
validation for the reliability and validity of our bioinformatics
analysis results. Results revealed that lncRNAs (ATP8B5P,
FOXD2-AS1, GUCY1B2, H19, HOTAIR, LOC100128164, SNORD116-4,
LOC553137, PART1, PGM5-AS1, PVT1, RHPN1-AS1, RPLP0P2, SLC26A4-AS1,
SMIM10L2A, SMIM10L2B, TINCR, TSPEAR-AS2 and UCA1) may be considered
as potential specificity biomarkers in the diagnosis, prognosis and
classification of GC.
Acknowledgements
This study was financially supported by the National
Natural Science Foundation of China (81472939, 81172618, 81502783),
the Qing Lan Project (no. 2012), the 333 project of Jiangsu
Province (no. 2012), the Liu Da Ren Cai Gao Feng Project of Jiangsu
Province (no. 2013-WSW-053) and the Fundamental Research Funds for
the Central Universities (no. 2014).
References
|
1
|
Guttman M, Amit I, Garber M, French C, Lin
MF, Feldser D, Huarte M, Zuk O, Carey BW, Cassady JP, et al:
Chromatin signature reveals over a thousand highly conserved large
non-coding RNAs in mammals. Nature. 458:223–227. 2009. View Article : Google Scholar : PubMed/NCBI
|
|
2
|
Kapranov P, St Laurent G, Raz T, Ozsolak
F, Reynolds CP, Sorensen PH, Reaman G, Milos P, Arceci RJ, Thompson
JF, et al: The majority of total nuclear-encoded non-ribosomal RNA
in a human cell is ‘dark matter’ un-annotated RNA. BMC Biol.
8:1492010. View Article : Google Scholar
|
|
3
|
Sana J, Faltejskova P, Svoboda M and Slaby
O: Novel classes of non-coding RNAs and cancer. J Transl Med.
10:1032012. View Article : Google Scholar : PubMed/NCBI
|
|
4
|
Kunej T, Obsteter J, Pogacar Z, Horvat S
and Calin GA: The decalog of long non-coding RNA involvement in
cancer diagnosis and monitoring. Crit Rev Clin Lab Sci. 51:344–357.
2014. View Article : Google Scholar : PubMed/NCBI
|
|
5
|
Hung T and Chang HY: Long noncoding RNA in
genome regulation: Prospects and mechanisms. RNA Biol. 7:582–585.
2010. View Article : Google Scholar : PubMed/NCBI
|
|
6
|
Pan W, Liu L, Wei J, Ge Y, Zhang J, Chen
H, Zhou L, Yuan Q, Zhou C and Yang M: A functional lncRNA HOTAIR
genetic variant contributes to gastric cancer susceptibility. Mol
Carcinog. 55:90–96. 2016. View
Article : Google Scholar
|
|
7
|
Huang C, Cao L, Qiu L, Dai X, Ma L, Zhou
Y, Li H, Gao M, Li W, Zhang Q, et al: Upregulation of H19 promotes
invasion and induces epithelial-to-mesenchymal transition in
esophageal cancer. Oncol Lett. 10:291–296. 2015.PubMed/NCBI
|
|
8
|
Wang F, Xie C, Zhao W, Deng Z, Yang H and
Fang Q: Long noncoding RNA CARLo-5 expression is associated with
disease progression and predicts outcome in hepatocellular
carcinoma patients. Clin Exp Med. Oct 3–2015.Epub ahead of print.
View Article : Google Scholar
|
|
9
|
Zheng HT, Shi DB, Wang YW, Li XX, Xu Y,
Tripathi P, Gu WL, Cai GX and Cai SJ: High expression of lncRNA
MALAT1 suggests a biomarker of poor prognosis in colorectal cancer.
Int J Clin Exp Pathol. 7:3174–3181. 2014.PubMed/NCBI
|
|
10
|
Loewen G, Jayawickramarajah J, Zhuo Y and
Shan B: Functions of lncRNA HOTAIR in lung cancer. J Hematol Oncol.
7:902014. View Article : Google Scholar : PubMed/NCBI
|
|
11
|
Liu Y, Zhao J, Zhang W, Gan J, Hu C, Huang
G and Zhang Y: lncRNA GAS5 enhances G1 cell cycle arrest via
binding to YBX1 to regulate p21 expression in stomach cancer. Sci
Rep. 5:101592015. View Article : Google Scholar : PubMed/NCBI
|
|
12
|
Li L, Zhang L, Zhang Y and Zhou F:
Increased expression of LncRNA BANCR is associated with clinical
progression and poor prognosis in gastric cancer. Biomed
Pharmacother. 72:109–112. 2015. View Article : Google Scholar : PubMed/NCBI
|
|
13
|
Wang Y, Liu X, Zhang H, Sun L, Zhou Y, Jin
H, Zhang H, Zhang H, Liu J, Guo H, et al: Hypoxia-inducible
lncRNAAK058003 promotes gastric cancer metastasis by targeting
γ-synuclein. Neoplasia. 16:1094–1106. 2014. View Article : Google Scholar : PubMed/NCBI
|
|
14
|
Salmena L, Poliseno L, Tay Y, Kats L and
Pandolfi PP: A ceRNA hypothesis: The Rosetta Stone of a hidden RNA
language? Cell. 146:353–358. 2011. View Article : Google Scholar : PubMed/NCBI
|
|
15
|
Song X, Cao G, Jing L, Lin S, Wang X,
Zhang J, Wang M, Liu W and Lv C: Analysing the relationship between
lncRNA and protein-coding gene and the role of lncRNA as ceRNA in
pulmonary fibrosis. J Cell Mol Med. 18:991–1003. 2014. View Article : Google Scholar : PubMed/NCBI
|
|
16
|
Gu W, Gao T, Sun Y, Zheng X, Wang J, Ma J,
Hu X, Li J and Hu M: LncRNA expression profile reveals the
potential role of lncRNAs in gastric carcinogenesis. Cancer
Biomark. 15:249–258. 2015. View Article : Google Scholar : PubMed/NCBI
|
|
17
|
Zhang T, Jiang M, Chen L, Niu B and Cai Y:
Prediction of gene phenotypes based on GO and KEGG pathway
enrichment scores. Biomed Res Int. 2013:8707952013.PubMed/NCBI
|
|
18
|
Shannon P, Markiel A, Ozier O, Baliga NS,
Wang JT, Ramage D, Amin N, Schwikowski B and Ideker T: Cytoscape: A
software environment for integrated models of biomolecular
interaction networks. Genome Res. 13:2498–2504. 2003. View Article : Google Scholar : PubMed/NCBI
|
|
19
|
Vu HL, Troubetzkoy S, Nguyen HH, Russell
MW and Mestecky J: A method for quantification of absolute amounts
of nucleic acids by (RT)-PCR and a new mathematical model for data
analysis. Nucleic Acids Res. 28:E182000. View Article : Google Scholar : PubMed/NCBI
|
|
20
|
Li X, Chen H, Li J and Zhang Z: Gene
function prediction with gene interaction networks: A context graph
kernel approach. IEEE Trans Inf Technol Biomed. 14:119–128. 2010.
View Article : Google Scholar
|
|
21
|
Hao NB, Tang B, Wang GZ, Xie R, Hu CJ,
Wang SM, Wu YY, Liu E, Xie X and Yang SM: Hepatocyte growth factor
(HGF) upregulates heparanase expression via the PI3K/Akt/NF-κB
signaling pathway for gastric cancer metastasis. Cancer Lett.
361:57–66. 2015. View Article : Google Scholar : PubMed/NCBI
|
|
22
|
Pan KF, Liu WG, Zhang L, You WC and Lu YY:
Mutations in components of the Wnt signaling pathway in gastric
cancer. World J Gastroenterol. 14:1570–1574. 2008. View Article : Google Scholar : PubMed/NCBI
|
|
23
|
Chatzinikolaou G, Nikitovic D,
Stathopoulos EN, Velegrakis GA, Karamanos NK and Tzanakakis GN:
Protein tyrosine kinase and estrogen receptor-dependent pathways
regulate the synthesis and distribution of
glycosaminoglycans/proteoglycans produced by two human colon cancer
cell lines. Anticancer Res. 27:4101–4106. 2007.
|
|
24
|
Di J, Huang H, Qu D, Tang J, Cao W, Lu Z,
Cheng Q, Yang J, Bai J, Zhang Y, et al: Rap2B promotes
proliferation, migration, and invasion of human breast cancer
through calcium-related ERK1/2 signaling pathway. Sci Rep.
5:123632015. View Article : Google Scholar : PubMed/NCBI
|
|
25
|
Jeggari A, Marks DS and Larsson E:
miRcode: A map of putative microRNA target sites in the long
non-coding transcriptome. Bioinformatics. 28:2062–2063. 2012.
View Article : Google Scholar : PubMed/NCBI
|
|
26
|
Hsu SD, Tseng YT, Shrestha S, Lin YL,
Khaleel A, Chou CH, Chu CF, Huang HY, Lin CM, Ho SY, et al:
miRTarBase update 2014: An information resource for experimentally
validated miRNA-target interactions. Nucleic Acids Res. 42:D78–D85.
2014. View Article : Google Scholar :
|
|
27
|
Patru CL, Surlin V, Georgescu I and Patru
E: Current issues in gastric cancer epidemiology. Rev Med Chir Soc
Med Nat Iasi. 117:199–204. 2013.
|
|
28
|
Li G, Hu Y and Liu H: Current status of
randomized controlled trials for laparoscopic gastric surgery for
gastric cancer in China. Asian J Endosc Surg. 8:263–267. 2015.
View Article : Google Scholar : PubMed/NCBI
|
|
29
|
Tanaka N, Katai H, Taniguchi H, Saka M,
Morita S, Fukagawa T and Gotoda T: Trends in characteristics of
surgically treated early gastric cancer patients after the
introduction of gastric cancer treatment guidelines in Japan.
Gastric Cancer. 13:74–77. 2010. View Article : Google Scholar : PubMed/NCBI
|
|
30
|
Rajan E, Gostout CJ, Aimore Bonin E, Moran
EA, Locke RG, Szarka LA, Talley NJ, Deters JL, Miller CA,
Knipschield MA, et al: Endoscopic full-thickness biopsy of the
gastric wall with defect closure by using an endoscopic suturing
device: Survival porcine study. Gastrointest Endosc. 76:1014–1019.
2012. View Article : Google Scholar : PubMed/NCBI
|
|
31
|
Moran VA, Perera RJ and Khalil AM:
Emerging functional and mechanistic paradigms of mammalian long
non-coding RNAs. Nucleic Acids Res. 40:6391–6400. 2012. View Article : Google Scholar : PubMed/NCBI
|
|
32
|
Gutschner T and Diederichs S: The
hallmarks of cancer: A long non-coding RNA point of view. RNA Biol.
9:703–719. 2012. View Article : Google Scholar : PubMed/NCBI
|
|
33
|
Zhang H, Chen Z, Wang X, Huang Z, He Z and
Chen Y: Long non-coding RNA: A new player in cancer. J Hematol
Oncol. 6:372013. View Article : Google Scholar : PubMed/NCBI
|
|
34
|
Kornienko AE, Guenzl PM, Barlow DP and
Pauler FM: Gene regulation by the act of long non-coding RNA
transcription. BMC Biol. 11:592013. View Article : Google Scholar : PubMed/NCBI
|
|
35
|
Song H, Sun W, Ye G, Ding X, Liu Z, Zhang
S, Xia T, Xiao B, Xi Y and Guo J: Long non-coding RNA expression
profile in human gastric cancer and its clinical significances. J
Transl Med. 11:2252013. View Article : Google Scholar : PubMed/NCBI
|
|
36
|
Lin XC, Zhu Y, Chen WB, Lin LW, Chen DH,
Huang JR, Pan K, Lin Y, Wu BT, Dai Y, et al: Integrated analysis of
long non-coding RNAs and mRNA expression profiles reveals the
potential role of lncRNAs in gastric cancer pathogenesis. Int J
Oncol. 45:619–628. 2014.PubMed/NCBI
|
|
37
|
Zhou X, Ye F, Yin C, Zhuang Y, Yue G and
Zhang G: The interaction between miR-141 and lncRNA-H19 in
regulating cell proliferation and migration in gastric cancer. Cell
Physiol Biochem. 36:1440–1452. 2015. View Article : Google Scholar : PubMed/NCBI
|
|
38
|
Chen X: Predicting lncRNA-disease
associations and constructing lncRNA functional similarity network
based on the information of miRNA. Sci Rep. 5:131862015. View Article : Google Scholar : PubMed/NCBI
|
|
39
|
Peng W, Si S, Zhang Q, Li C, Zhao F, Wang
F, Yu J and Ma R: Long non-coding RNA MEG3 functions as a competing
endogenous RNA to regulate gastric cancer progression. J Exp Clin
Cancer Res. 34:792015. View Article : Google Scholar : PubMed/NCBI
|
|
40
|
Kong R, Zhang EB, Yin DD, You LH, Xu TP,
Chen WM, Xia R, Wan L, Sun M, Wang ZX, et al: Long noncoding RNA
PVT1 indicates a poor prognosis of gastric cancer and promotes cell
proliferation through epigenetically regulating p15 and p16. Mol
Cancer. 14:822015. View Article : Google Scholar : PubMed/NCBI
|
|
41
|
Liu M, Li CM, Chen ZF, Ji R, Guo QH, Li Q,
Zhang HL and Zhou YN: Celecoxib regulates apoptosis and autophagy
via the PI3K/Akt signaling pathway in SGC-7901 gastric cancer
cells. Int J Mol Med. 33:1451–1458. 2014.PubMed/NCBI
|
|
42
|
Ren X, Zheng D, Guo F, Liu J, Zhang B, Li
H and Tian W: PPARγ suppressed Wnt/β-catenin signaling pathway and
its downstream effector SOX9 expression in gastric cancer cells.
Med Oncol. 32:912015. View Article : Google Scholar
|
|
43
|
Wu Q, Guo L, Jiang F, Li L, Li Z and Chen
F: Analysis of the miRNA-mRNA-lncRNA networks in ER+ and
ER− breast cancer cell lines. J Cell Mol Med.
19:2874–2887. 2015. View Article : Google Scholar : PubMed/NCBI
|
|
44
|
Hu Y, Tian H, Xu J and Fang JY: Roles of
competing endogenous RNAs in gastric cancer. Brief Funct Genomics.
pii: elv036. Sep 24–2015.Epub ahead of print. View Article : Google Scholar : PubMed/NCBI
|
|
45
|
Zhang J, Fan D, Jian Z, Chen GG and Lai
PB: Cancer specific long noncoding RNAs show differential
expression patterns and competing endogenous RNA potential in
hepatocellular carcinoma. PLoS One. 10:e01410422015. View Article : Google Scholar : PubMed/NCBI
|
|
46
|
Raveh E, Matouk IJ, Gilon M and Hochberg
A: The H19 Long non-coding RNA in cancer initiation, progression
and metastasis - a proposed unifying theory. Mol Cancer.
14:1842015. View Article : Google Scholar : PubMed/NCBI
|
|
47
|
Vennin C, Spruyt N, Dahmani F, Julien S,
Bertucci F, Finetti P, Chassat T, Bourette RP, Le Bourhis X and
Adriaenssens E: H19 non coding RNA-derived miR-675 enhances
tumorigenesis and metastasis of breast cancer cells by
downregulating c-Cbl and Cbl-b. Oncotarget. 6:29209–29223.
2015.PubMed/NCBI
|
|
48
|
Liu XH, Sun M, Nie FQ, Ge YB, Zhang EB,
Yin DD, Kong R, Xia R, Lu KH, Li JH, et al: Lnc RNA HOTAIR
functions as a competing endogenous RNA to regulate HER2 expression
by sponging miR-331-3p in gastric cancer. Mol Cancer. 13:922014.
View Article : Google Scholar : PubMed/NCBI
|
|
49
|
Ding J, Li D, Gong M, Wang J, Huang X, Wu
T and Wang C: Expression and clinical significance of the long
non-coding RNA PVT1 in human gastric cancer. Onco Targets Ther.
7:1625–1630. 2014. View Article : Google Scholar : PubMed/NCBI
|
|
50
|
Zheng Q, Wu F, Dai WY, Zheng DC, Zheng C,
Ye H, Zhou B, Chen JJ and Chen P: Aberrant expression of UCA1 in
gastric cancer and its clinical significance. Clin Transl Oncol.
17:640–646. 2015. View Article : Google Scholar : PubMed/NCBI
|
|
51
|
Xu TP, Liu XX, Xia R, Yin L, Kong R, Chen
WM, Huang MD and Shu YQ: SP1-induced upregulation of the long
noncoding RNA TINCR regulates cell proliferation and apoptosis by
affecting KLF2 mRNA stability in gastric cancer. Oncogene.
34:5648–5661. 2015. View Article : Google Scholar : PubMed/NCBI
|
|
52
|
Li AQ, Si JM, Shang Y, Gan LH, Guo L and
Zhou TH: Construction of COL1A1 short hairpin RNA vector and its
effect on cell proliferation and migration of gastric cancer cells.
Zhejiang Da Xue Xue Bao Yi Xue Ban. 39:257–263. 2010.In Chinese.
PubMed/NCBI
|
|
53
|
Ran G, Lin Y, Cao P, Cai XT and Li SY:
Effect of rhGH on JAK2-STAT3 signal pathway after GHR was
down-regulated by siRNA in gastric cancer cell. Yao Xue Xue Bao.
48:435–440. 2013.In Chinese. PubMed/NCBI
|
|
54
|
Feng X, Li T, Liu Z, Shi Y and Peng Y:
HOXC10 up-regulation contributes to human thyroid cancer and
indicates poor survival outcome. Mol Biosyst. 11:2946–2954. 2015.
View Article : Google Scholar : PubMed/NCBI
|
|
55
|
Ke J, Yao YL III, Zheng J, Wang P, Liu YH,
Ma J, Li Z, Liu XB, Li ZQ, Wang ZH, et al: Knockdown of long
non-coding RNA HOTAIR inhibits malignant biological behaviors of
human glioma cells via modulation of miR-326. Oncotarget.
6:21934–21949. 2015. View Article : Google Scholar : PubMed/NCBI
|
|
56
|
Li H, Yu B, Li J, Su L, Yan M, Zhu Z and
Liu B: Overexpression of lncRNA H19 enhances carcinogenesis and
metastasis of gastric cancer. Oncotarget. 5:2318–2329. 2014.
View Article : Google Scholar : PubMed/NCBI
|
|
57
|
Zhang ZZ, Shen ZY, Shen YY, Zhao EH, Wang
M, Wang CJ, Cao H and Xu J: HOTAIR long noncoding RNA promotes
gastric cancer metastasis through suppression of Poly r(C)-Binding
Protein (PCBP) 1. Mol Cancer Ther. 14:1162–1170. 2015. View Article : Google Scholar : PubMed/NCBI
|
|
58
|
Yang Z, Lu Y, Xu Q, Tang B, Park CK and
Chen X: HULC and H19 played different roles in overall and
disease-free survival from hepatocellular carcinoma after curative
hepatectomy: a preliminary analysis from gene expression omnibus.
Dis Markers. 2015:1910292015. View Article : Google Scholar : PubMed/NCBI
|